
Studying Correlation between Precipitation and NDVI/MODIS for Time Series (2012–2022) in Arid Region in Syria †


Natural Resources Research Administration, General Commission for Scientific Agricultural Research (GCSAR), Damascus P.O. Box 12573, Syria
†
Presented at the 5th International Electronic Conference on Remote Sensing, 7–21 November 2023; Available online: https://ecrs2023.sciforum.net/ .
Environ. Sci. Proc. 2024, 29(1), 58; https://doi.org/10.3390/ECRS2023-16704
Published: 15 January 2024
Abstract
:Vegetation degradation is correlated with drought. The more drought intensifies, the more degraded vegetation increases. Therefore, this study aimed to assess the correlation between rainfall and changes in the Normalized Difference Vegetation Index (NDVI) under arid and semi-arid conditions in Syria. This study was carried out using annual rainfall data for 2012–2022, obtained from the Agricultural cloud seeding Project, to determine the average rainfall in the study area and to link it to the NDVI of MODIS image data processed using the Google Earth Engine (GEE) for April of each year for the same time series. The results showed that the lowest NDVI value (0.098) was in 2016, representing the driest year during the studied series, while the highest NDVI value (0.24) was in 2019, which coincided with the highest rainfall rate of 206.67 mm, thus representing the least arid year during the same series. It also found a strong correlation (R = 0.7) between the overall average rainfall and the overall NDVI values of the studied time series. This study shows that changes in the NDVI are associated with changes in rainfall, indicating that they can be used to estimate and study drought as a simple method derived from satellite data in isolation from ground data.
1. Introduction
Many difficult climatic factors have dominated the Middle East region recently, most notably drought [1]. Syria in particular is considered one of the regions where drought most affects the economy. Drought has negatively affected agricultural areas and their productivity, which led to the removal of a large portion of agricultural areas from the production process, especially rain-fed agriculture [2].
Low rainfall negatively affects the agricultural and livestock sectors, requiring limited quantitative and qualitative use of the available water [3]. The sensitivity to drought is also increasing in the eastern region of Syria as a result of the growing population, the subsequent increase in the demand for water resources, and the deterioration of natural pastures [4].
On the other hand, Remote sensing technologies play a major role in the agricultural and climatic fields, such as monitoring climate changes, the growth of agricultural crops, and studying different patterns of drought, which has prompted an attempt to employ these data in the drought monitoring process [5].
2. Objectives of This Study
This study aimed to evaluate the relationship between rainfall amounts and changes in vegetation areas in conditions of arid and semi-arid regions represented by the Deir ez-Zor Governorate.
3. Materials and Methods
3.1. Study Area
The total area of the governorate is 33.06 thousand km2, occupying 17.9% of the country’s area. It extends between the longitudes of (39°14′36″–41°13′7″) east and the latitudes of (36°20′23″–33°7′29″) north. Its average height is 220 m above sea level, as seen in Figure 1.
3.2. Climate of the Study Area
The climate of the study area is Mediterranean with a continental influence, and climatically it is classified into semi-arid, arid, and extremely dry regions according to the Amberger classification. It is characterized by a long dry season, extending from June to October, and a cold winter with an average rainfall of 160–200 mm annually [6].
3.3. Data
3.3.1. Satellite Images
NDVI images from MODIS (Terra/Aqua) satellite data were used for the time series from 2012 to 2022 (11 years) for April of each year. MODIS images have a spatial resolution of 250 m, and temporal resolution of 16 days. The processing level is the third level [7].
Data were extracted and processed using a JavaScript code editor in the GEE (Google Earth Engine) platform https://earthengine.google.com/ (Accessed: 29 April 2023), which provides big data processing capabilities for even very large study areas [8], as shown in Figure 2.
3.3.2. Rainfall Data
Annual rainfall data for the period 2012–2022, obtained from the Agricultural cloud seeding Project, were used to determine the average rainfall for the study area for five rain stations: Deir ez-Zor, Al-Tebny, Souar, Meaden, and Abu Kamal. See Figure 3.
4. Methodology
4.1. Rainfall Maps
Rainfall maps for the study area were prepared using the annual rainfall rates for the five climate stations within the ArcGIS 10.8.2 environment using the Kriging tool from Spatial Analyst (Figure 4). The Krigink model is an important geostatistical technique, which is the best unbiased linear interpolation procedure and an approximation technique that gives the best prediction of the unknown values of the random function. This prediction is a weighted combination of the measured values [9].
4.2. Normalized Difference Vegetation (NDVI) Maps
The ratio between the reflectance difference in the red and near-infrared (NIR) spectral bands relative to their sum [10] is considered the most widespread indicator; it is calculated from the following equation:
NDVI = (NIR − R)/(NIR + R)
The area of the Deir ez-Zor Governorate was clipped from the satellite images according to the administrative boundaries approved by the Ministry of Local Administration, and the satellite images representing the NDVI were classified into rows using ArcGIS 10.8.2. as Table 1 shows:
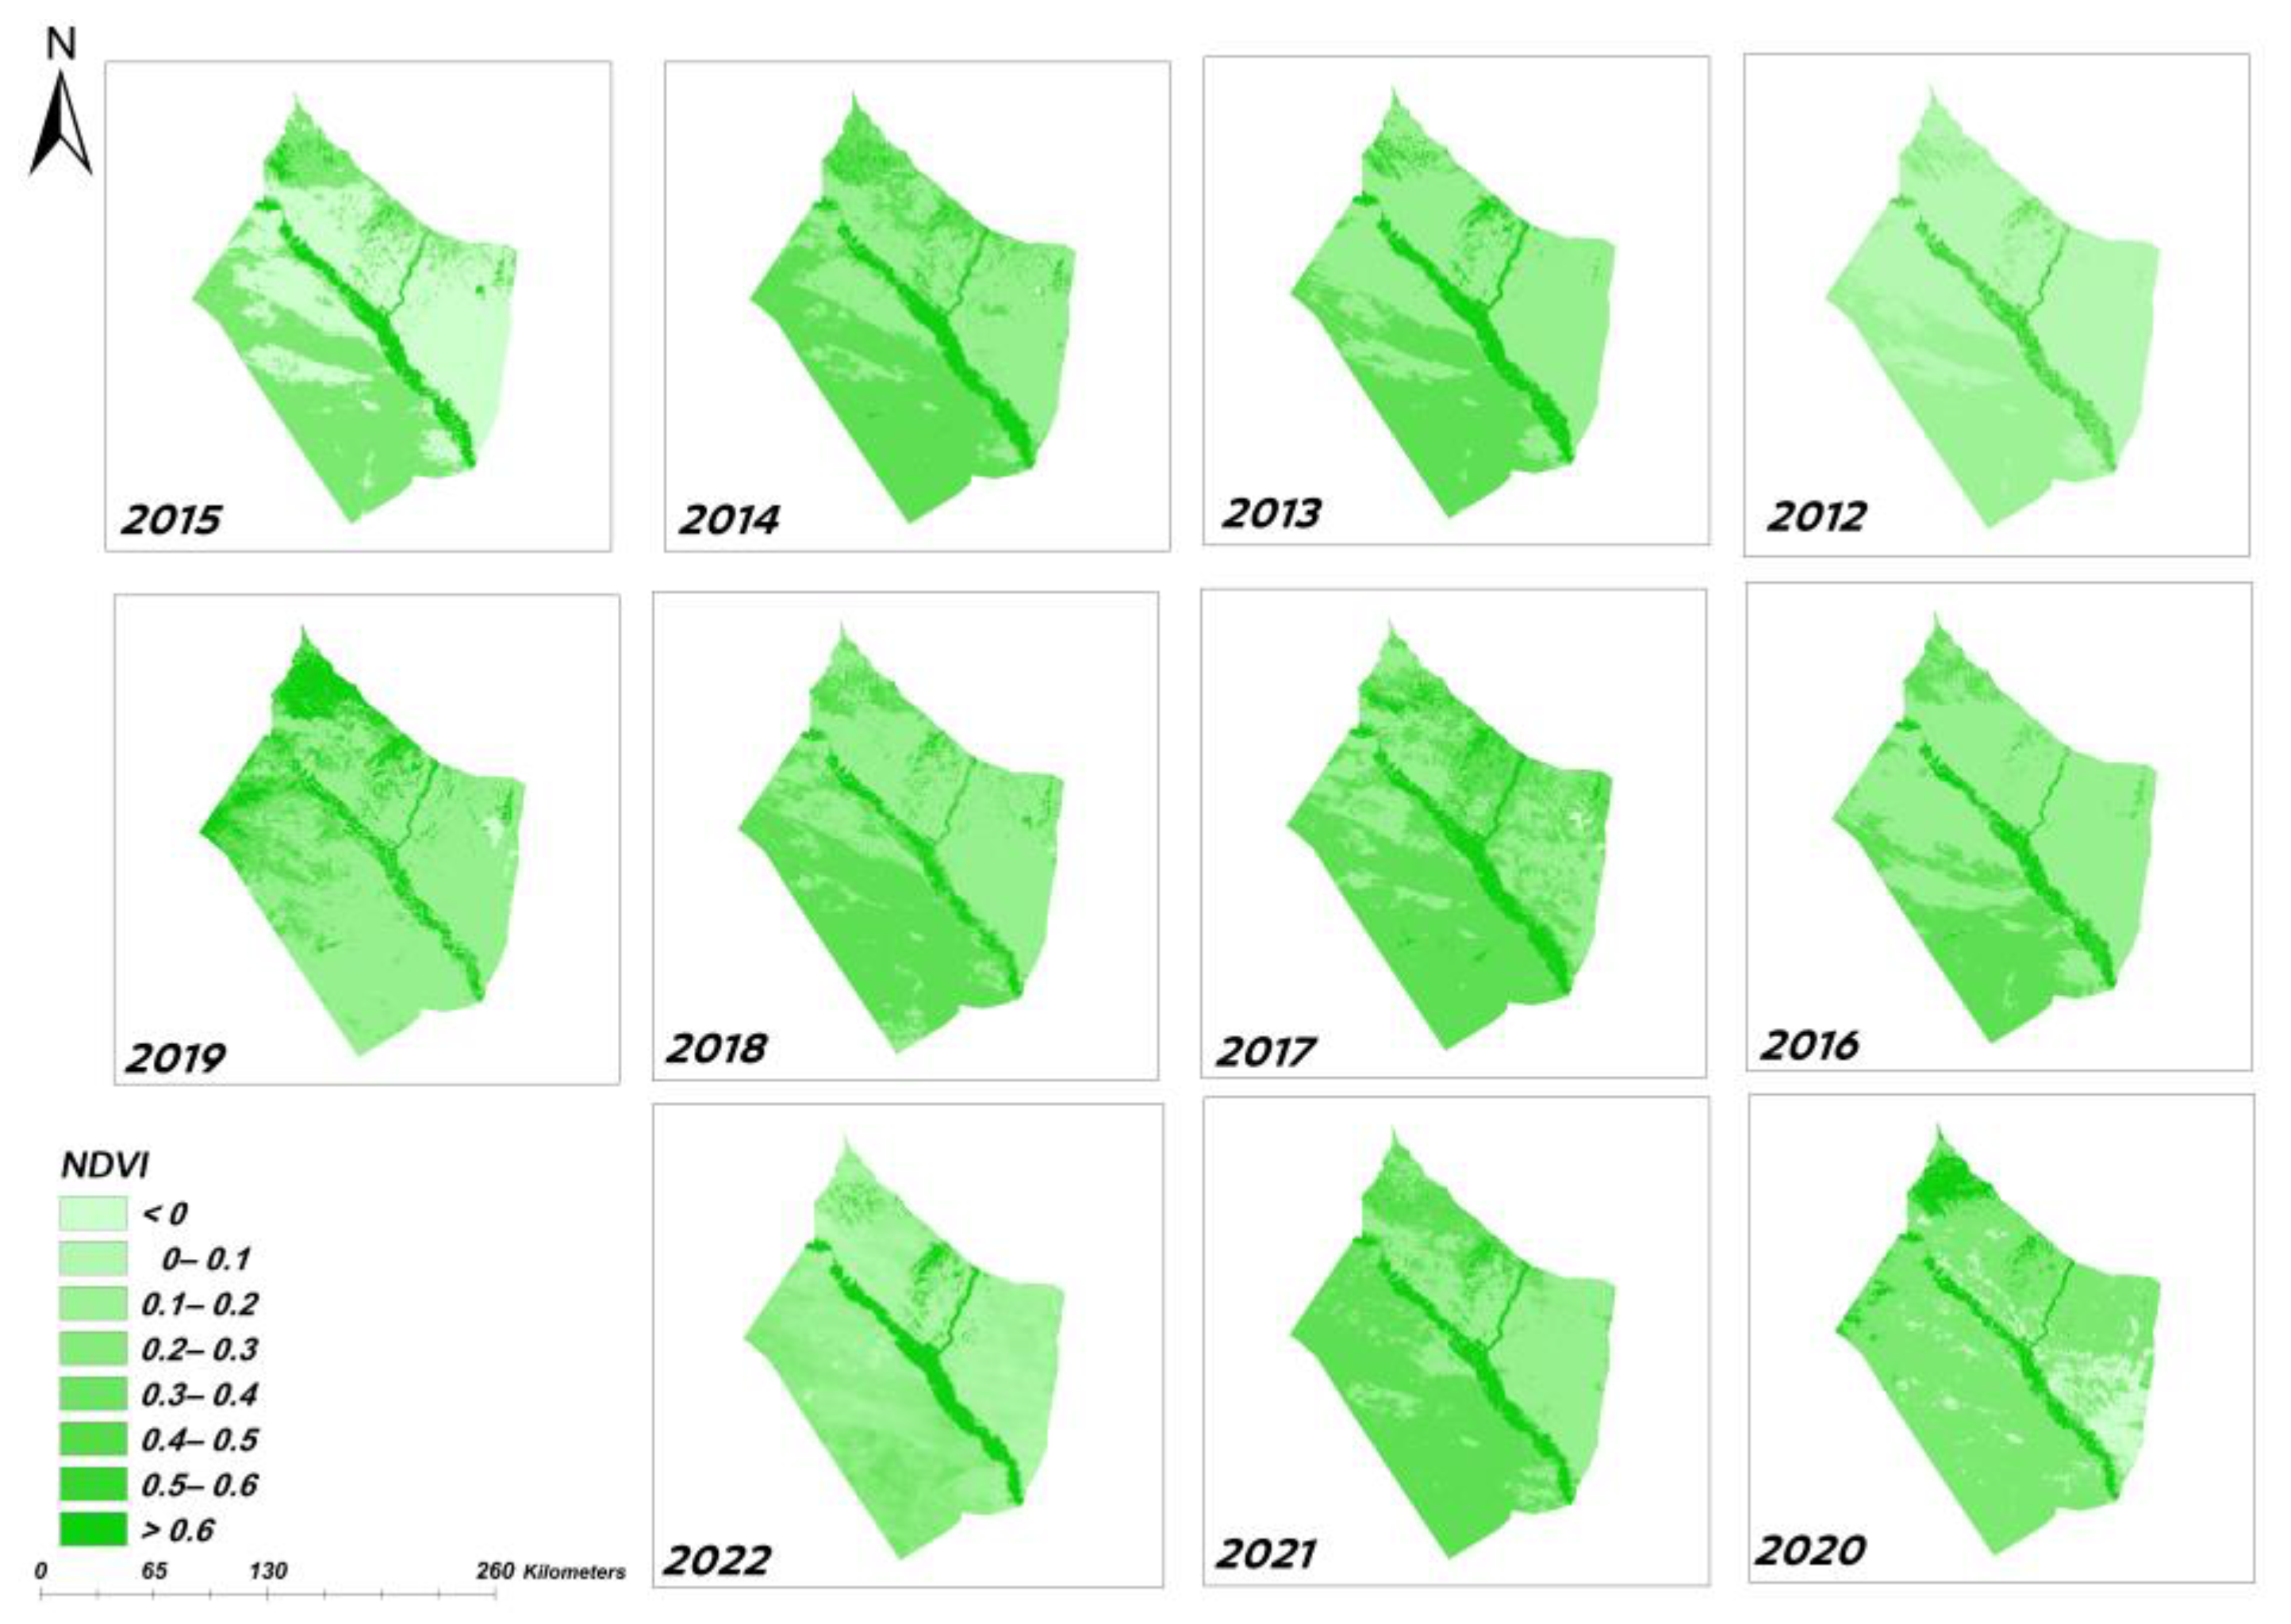
Figure 5 shows NDVI maps from April of each year for the study area during the timeframe (2012–2022).
5. Results and Discussion
Correlation of Rainfall with NDVI
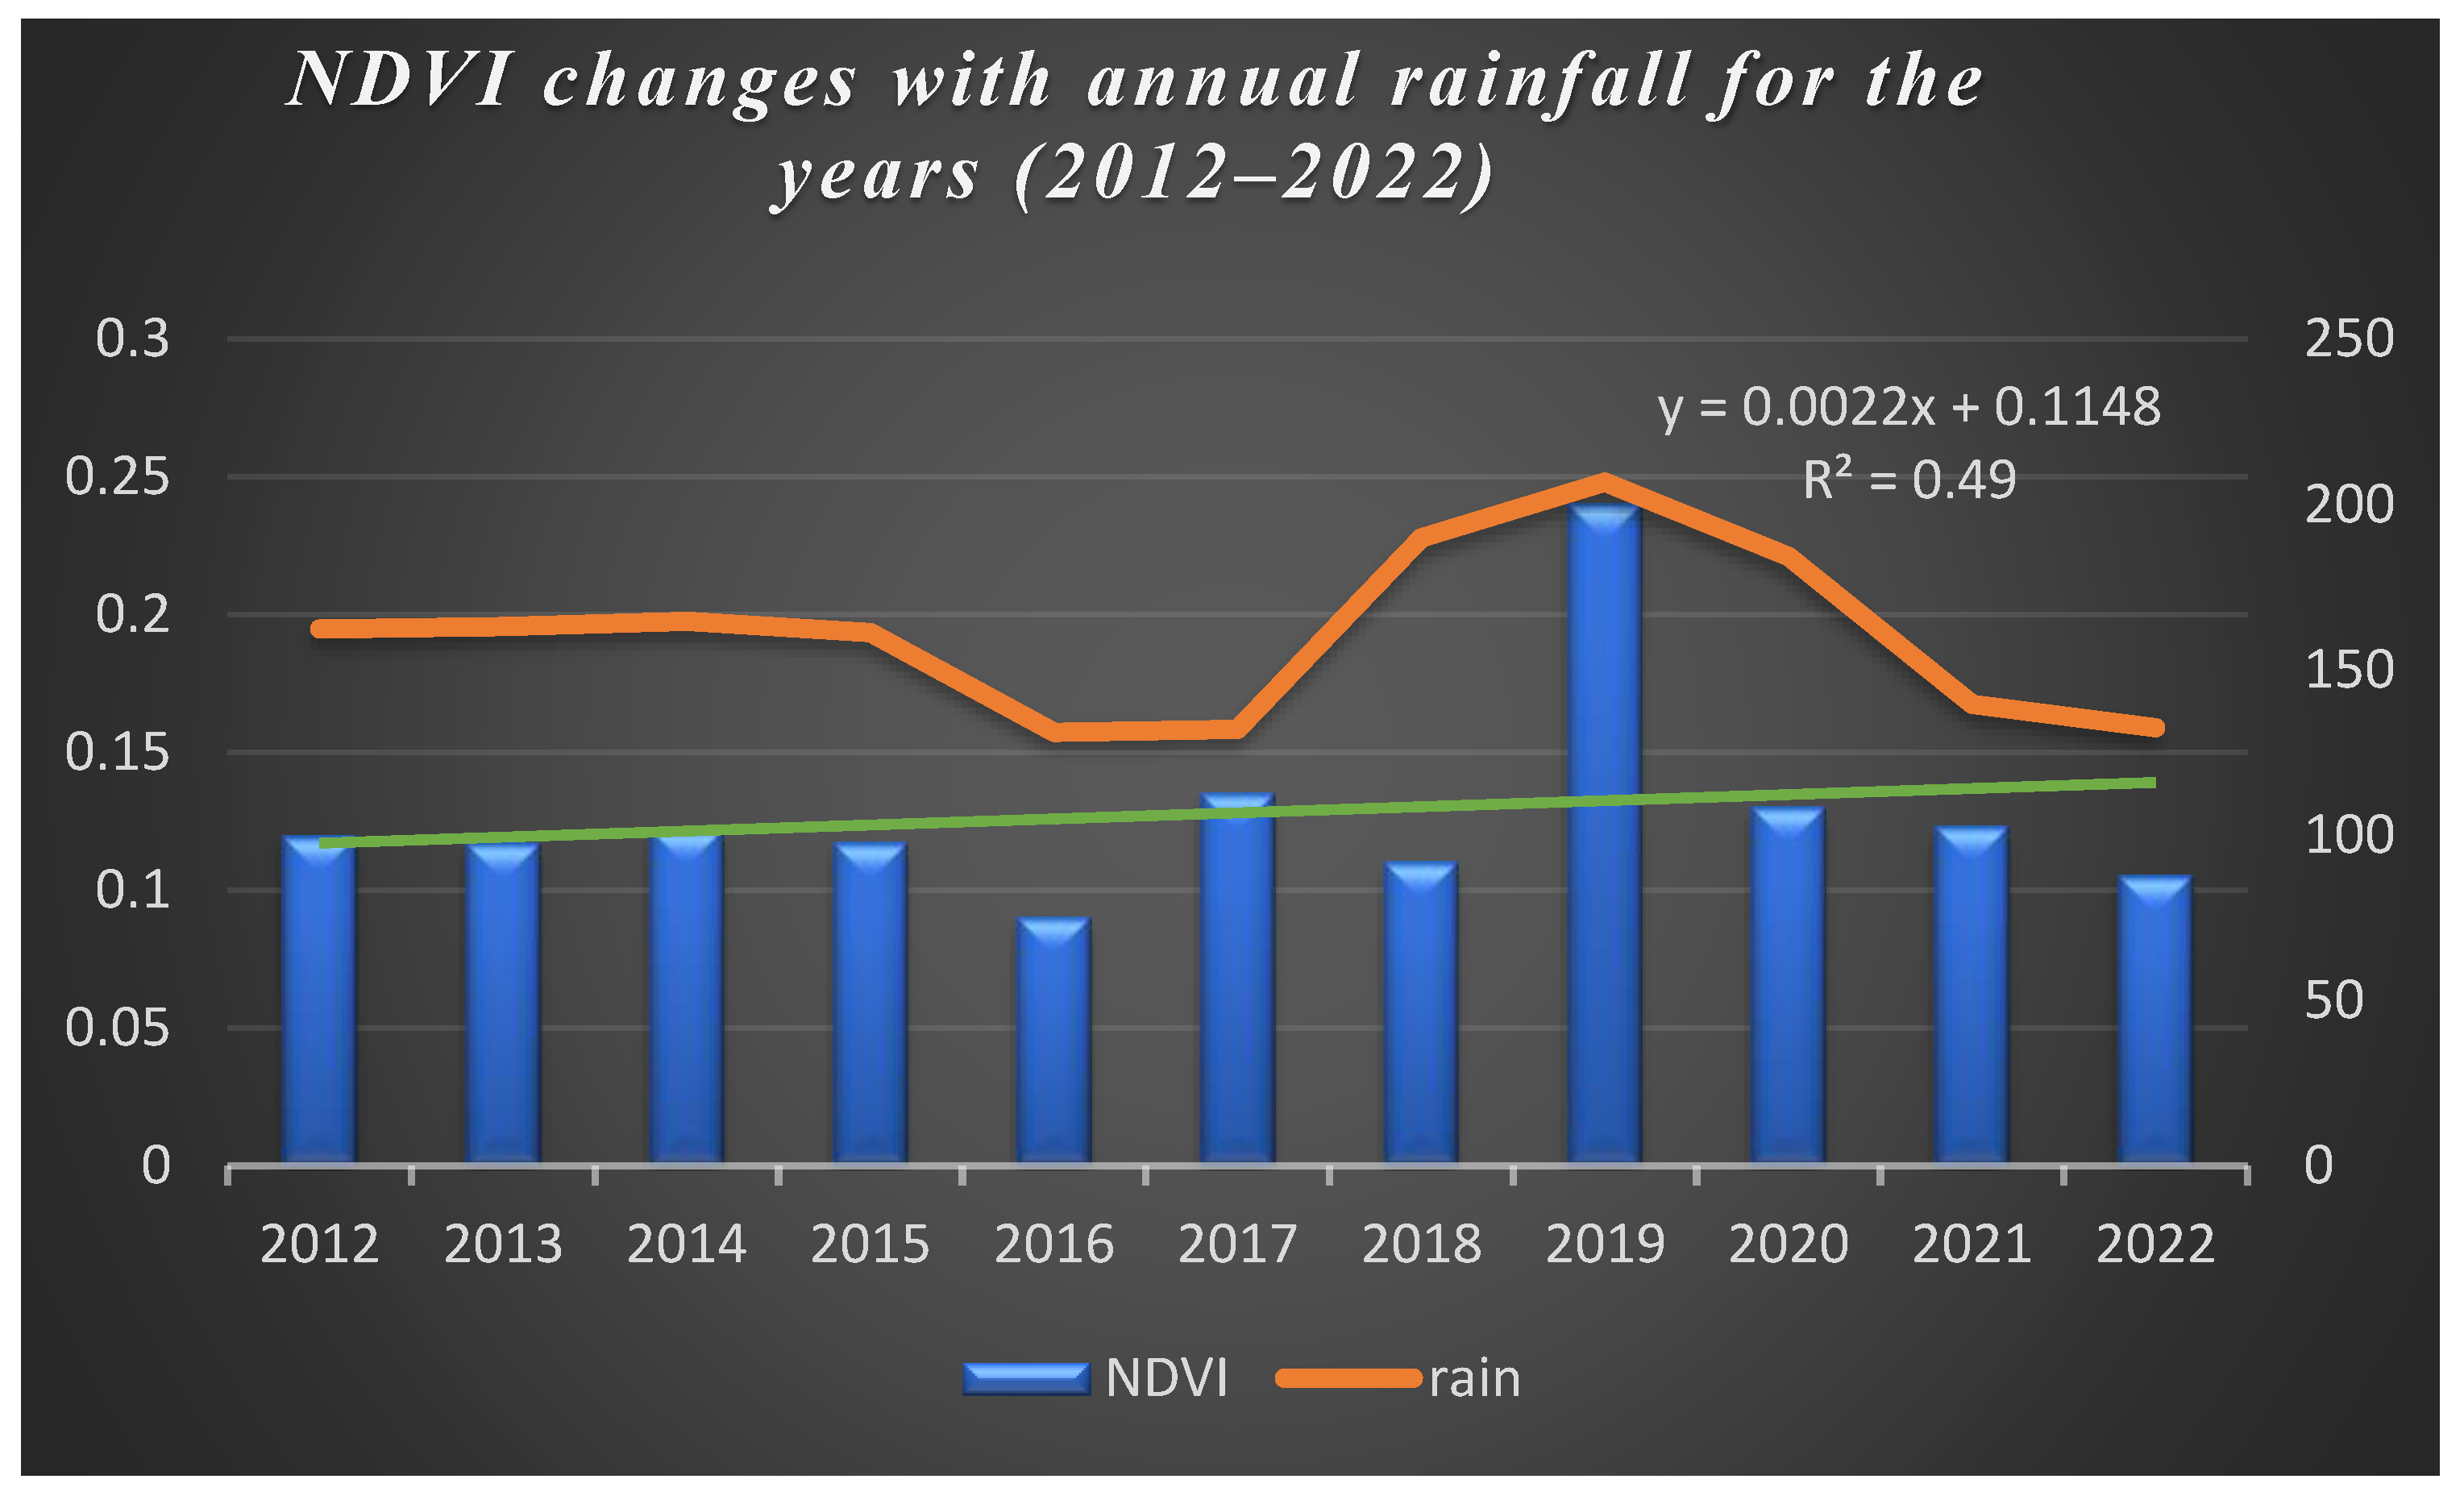
The results showed that the lowest value of the NDVI was in 2016 with an average of 0.098, which represents the driest years during the studied series and corresponds to the lowest rainfall rate in the studied series (131 mm), while the highest value was in 2019 with an average of 2.4. This corresponds to the highest mean rainfall of 206.67 mm, thus representing the least-dry years during the same series. There was also a strong correlation (R = 0.7) between the general mean rainfall amount for the studied time series and the general mean values of the NDVI. We also observe relatively average values of the NDVI during the rest of the years, accompanied by rainfall values as well; Figure 6 shows this:
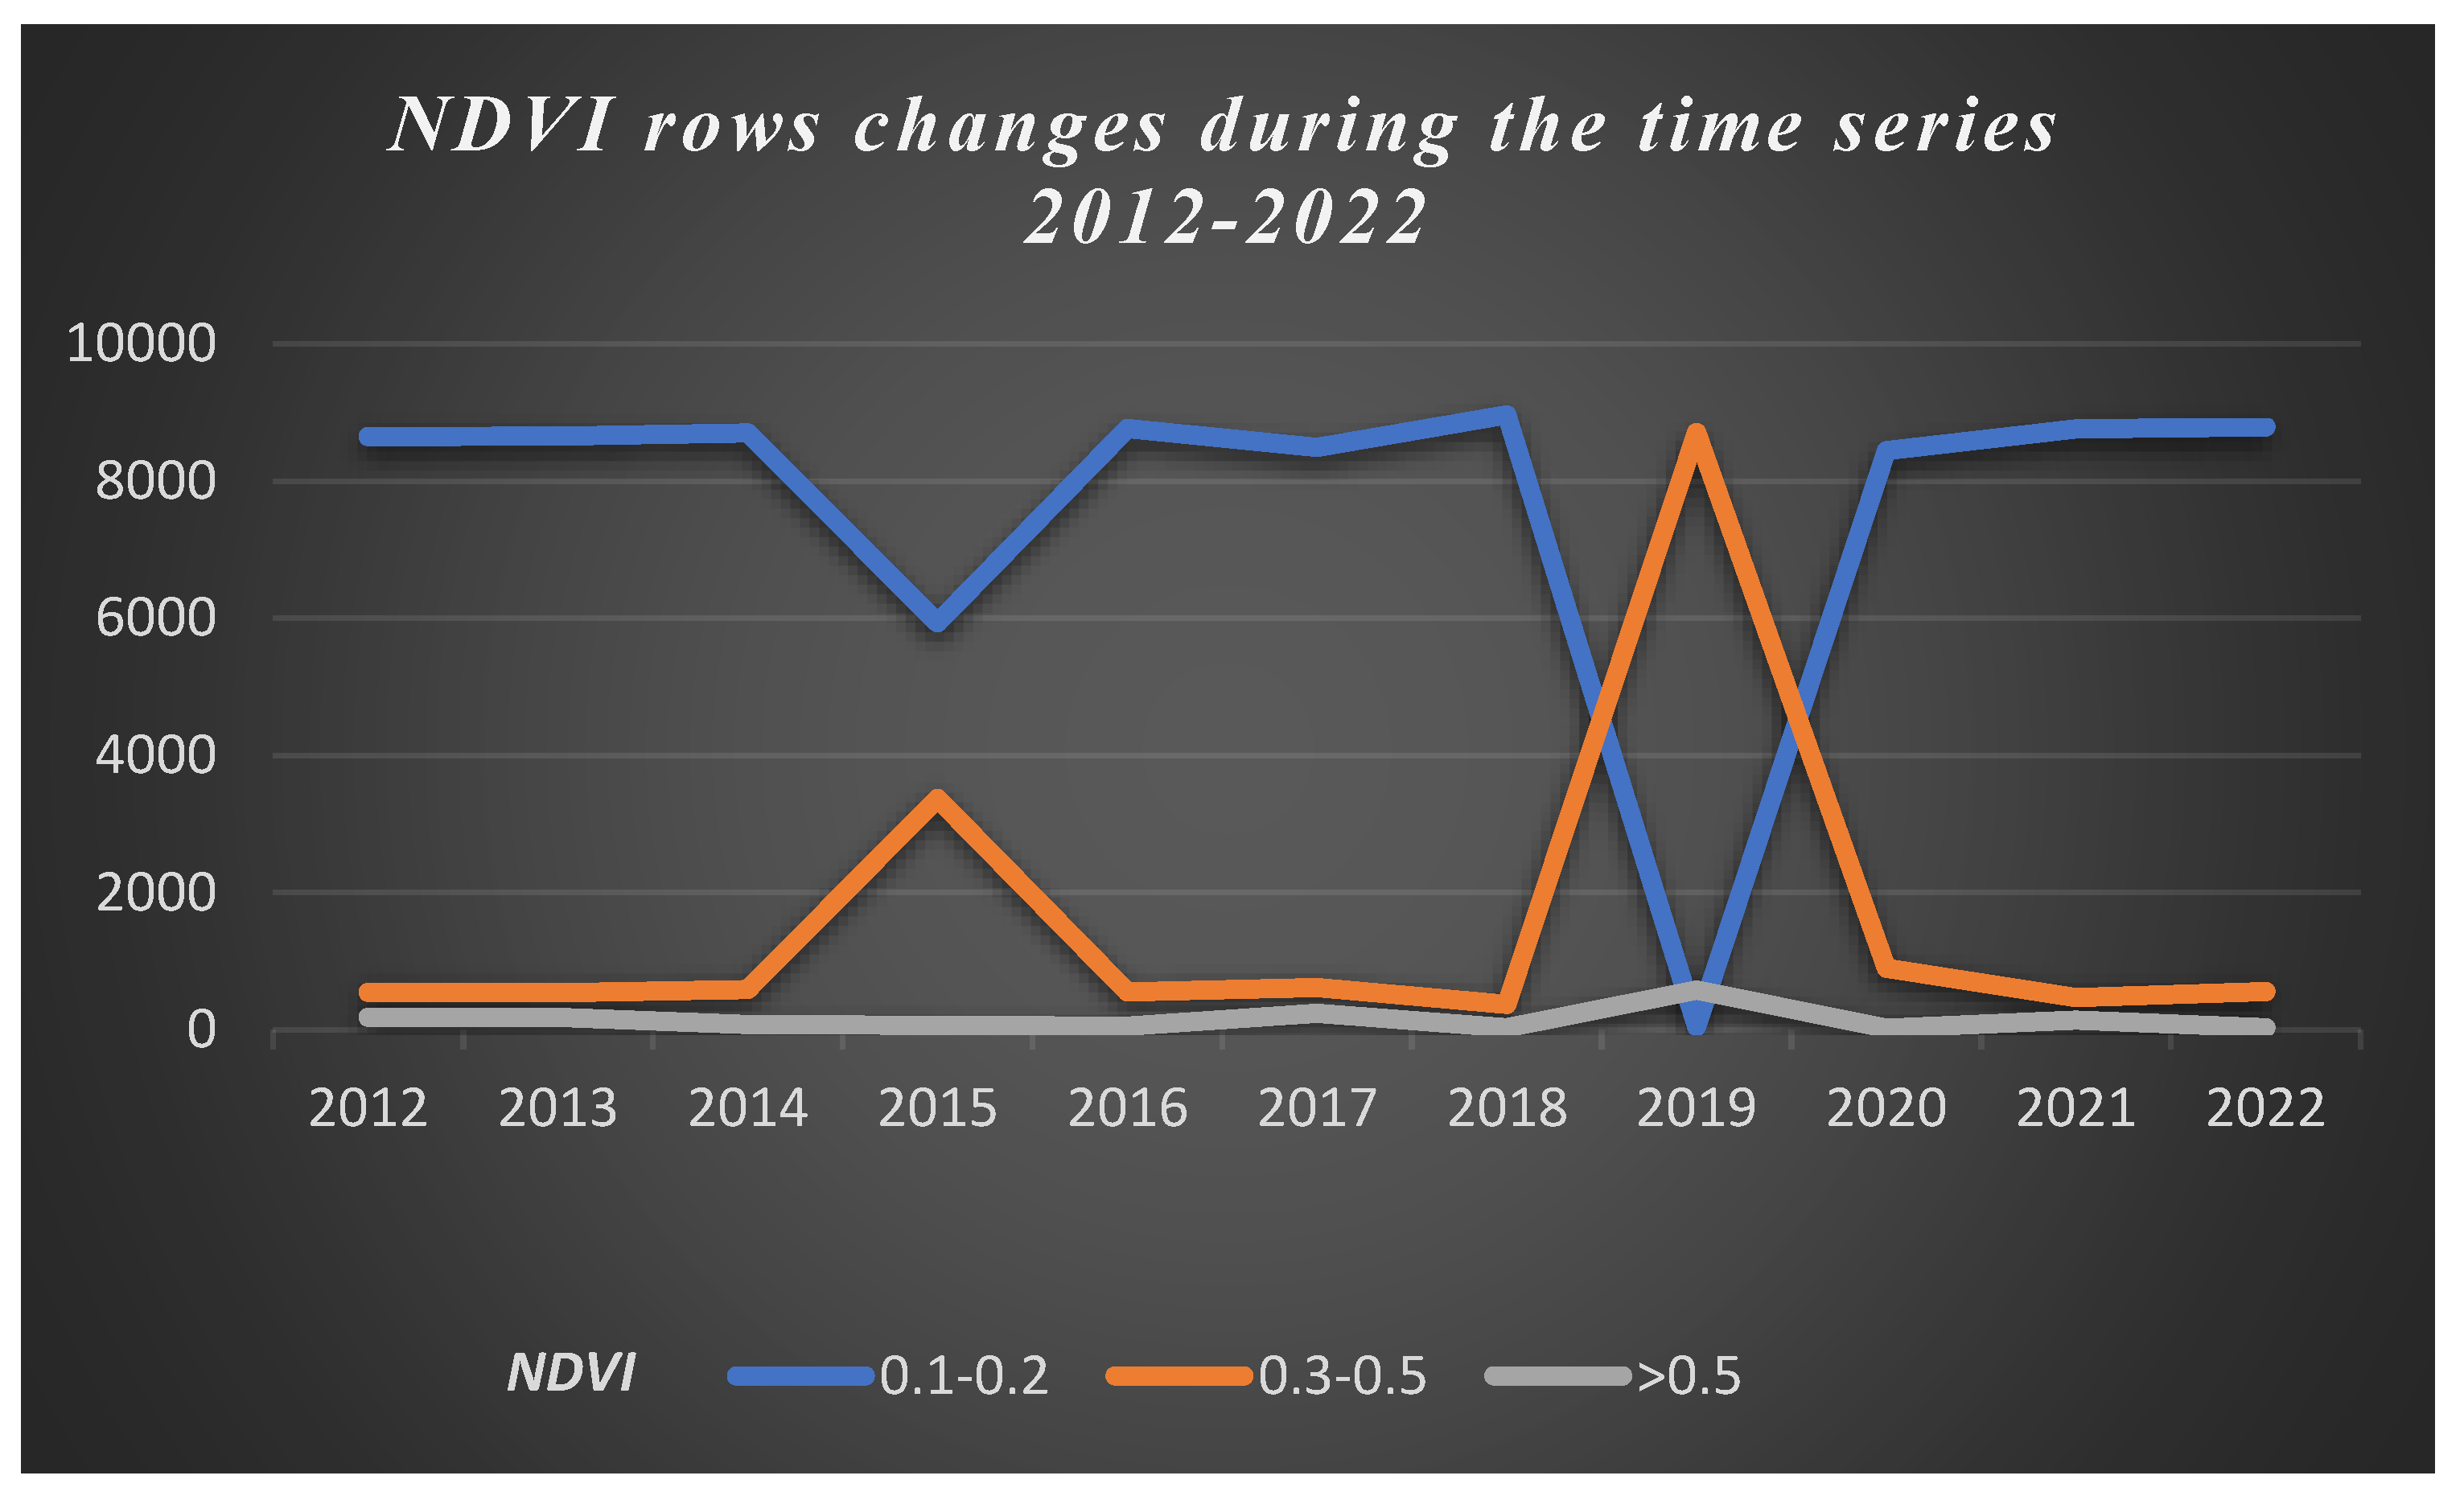
The NDVI maps, which were classified into rows from −0.2 to 0.8 using the ArcGIS 10.8.2 program, also showed the following: the barren lands with simple grass coverage (0–0.1) occupied an area estimated at 90% of the total area of the studied region, with the exception of the year 2019, where pastures and rain-fed crops (0.3–0.4) occupied 85.45% of the total area of the studied region. (Figure 7).
6. Conclusions
This study concluded several results, the most important of which are as follows:
- -
- This study showed that changes in the vegetation index (NDVI) are related to changes in rainfall, which indicates the possibility of using it to estimate and study drought as a simple method derived from satellite data in isolation from ground data.
- -
- The NDVI maps, which were classified as (−0.2–0.8), using ArcGIS 10.8.2, showed that arid land with a simple herbal coverage (0–0.1) occupied 90% of the total study area with the exception of 2019, where pastures and rain-fed crops (0.3–0.4) occupied 85.45% of the total study area.
- -
- This study showed the effectiveness of using MODIS satellite images to derive drought indicators for any region in the world. Using these indicators, the development and severity of drought in a country or region where ground observations are absent or limited can be monitored and estimated (such as in Syria and the Arab region).
Funding
This research received no external funding.
Institutional Review Board Statement
Not applicable.
Informed Consent Statement
Not applicable.
Data Availability Statement
Data is contained within the article.
Conflicts of Interest
The author declares no conflicts of interest.
References
- Wehrey, F.; Dargin, J.; Mehdi, Z.; Muasher, M.; Yahya, M.; Kayssi, I.; Hassan, Z.; Andrews, M.; Madain, M.; Al-Mailam, M.; et al. Climate Change and Vulnerability in the Middle East; Carnegie Endowment for International Peace (CEIP): Washington, DC, USA, 2023. [Google Scholar]
- Al Bitar, A.; Najem, S.; Jarlan, L.; Zribi, M.; Faour, G. Precipitation and soil moisture datasets show severe droughts in the MENA region. Res. Sq. 2021. preprint. [Google Scholar] [CrossRef]
- Daher, J. Water Scarcity, Mismanagement and Pollution in Syria; European University Institute: Florence, Italy, 2022. [Google Scholar]
- Lyall, N.; Shaar, K. Out of the Frying Pan into the Fire: The Impacts of the Contemporary Drought in Syria and Its Implications for the Conflict; Operations and Policy Center (OPC): Gaziantep, Turkey, 2022. [Google Scholar]
- Wei, W.; Zhang, J.; Zhou, L.; Xie, B.; Zhou, J.; Li, C. Comparative evaluation of drought indices for monitoring drought based on remote sensing data. Environ. Sci. Pollut. Res. 2021, 28, 20408–20425. [Google Scholar] [CrossRef] [PubMed]
- Climate Atlas of Syria; Ministry of Defence, Meteorological Department, Climate Division Service of Military Geography, Damascus: Damascus, Syria, 1977; p. 150.
- Marshall, M.; Okuto, E.; Kang, Y.; Opiyo, E.; Ahmed, M. Global assessment of vegetation index and phenology lab (VIP) and global inventory modeling and mapping studies (GIMMS) version 3 products. Biogeosciences 2016, 13, 625–639. [Google Scholar] [CrossRef]
- Amani, M.; Ghorbanian, A.; Ahmadi, S.A.; Kakooei, M.; Moghimi, A.; Mirmazloumi, S.M.; Moghaddam, S.H.A.; Mahdavi, S.; Ghahremanloo, M.; Parsian, S.; et al. Google earth engine cloud computing platform for remote sensing big data applications: A comprehensive review. IEEE J. Sel. Top. Appl. Earth Obs. Remote Sens. 2020, 13, 5326–5350. [Google Scholar] [CrossRef]
- Poshtmasari, H.K.; Sarvestani, Z.T.; Kamkar, B.; Shataei, S.; Sadeghi, S. Comparison of interpolation methods for estimating pH and EC in agricultural fields of Golestan province (north of Iran). Int. J. Agric. Crop Sci. (IJACS) 2012, 4, 157–167. [Google Scholar]
- Rouse, J.W., Jr.; Haas, R.H.; Deering, D.W.; Schell, J.A.; Harlan, J.C. Monitoring the Vernal Advancement and Retrogradation (Green Wave Effect) of Natural Vegetation; No. E75-10354; NASA Technical Reports Server: Cleveland, OH, USA, 1974.
Figure 1.
Location of the study area.

Figure 2.
The GEE (Google Earth Engine) platform.

Figure 3.
Climatic stations in Deir ez-Zor.

Figure 4.
Rainfall maps for the study area for the time series 2012–2022.

Figure 5.
NDVI maps from April of each year for the study area during the time series (2012–2022).

Figure 6.
NDVI changes with annual rainfall for the years 2012–2022.

Figure 7.
NDVI row changes during the time series 2012–2022.


Table 1.
NDVI classes.
| Classification | NDVI |
|---|---|
| water | −0.8 |
| −0.5 | |
| 0 | |
| barren lands | 0.1 |
| pastures, grass, shrubs | 0.2 |
| medium plant cover and field crops | 0.3 |
| 0.4 | |
| 0.5 | |
| forests | 0.6 |
| 0.76 | |
| 0.82 |
Disclaimer/Publisher’s Note: The statements, opinions and data contained in all publications are solely those of the individual author(s) and contributor(s) and not of MDPI and/or the editor(s). MDPI and/or the editor(s) disclaim responsibility for any injury to people or property resulting from any ideas, methods, instructions or products referred to in the content. |
© 2024 by the author. Licensee MDPI, Basel, Switzerland. This article is an open access article distributed under the terms and conditions of the Creative Commons Attribution (CC BY) license (https://creativecommons.org/licenses/by/4.0/).
Share and Cite
MDPI and ACS Style
Al-hasn, R. Studying Correlation between Precipitation and NDVI/MODIS for Time Series (2012–2022) in Arid Region in Syria. Environ. Sci. Proc. 2024, 29, 58. https://doi.org/10.3390/ECRS2023-16704
AMA Style
Al-hasn R. Studying Correlation between Precipitation and NDVI/MODIS for Time Series (2012–2022) in Arid Region in Syria. Environmental Sciences Proceedings. 2024; 29(1):58. https://doi.org/10.3390/ECRS2023-16704
Chicago/Turabian StyleAl-hasn, Rukea. 2024. "Studying Correlation between Precipitation and NDVI/MODIS for Time Series (2012–2022) in Arid Region in Syria" Environmental Sciences Proceedings 29, no. 1: 58. https://doi.org/10.3390/ECRS2023-16704