
Impact of Land Use and Land Cover Change on Agricultural Production in District Bahawalnagar, Pakistan †

 , , , , ,
Abstract
:1. Introduction
2. Materials and Methods
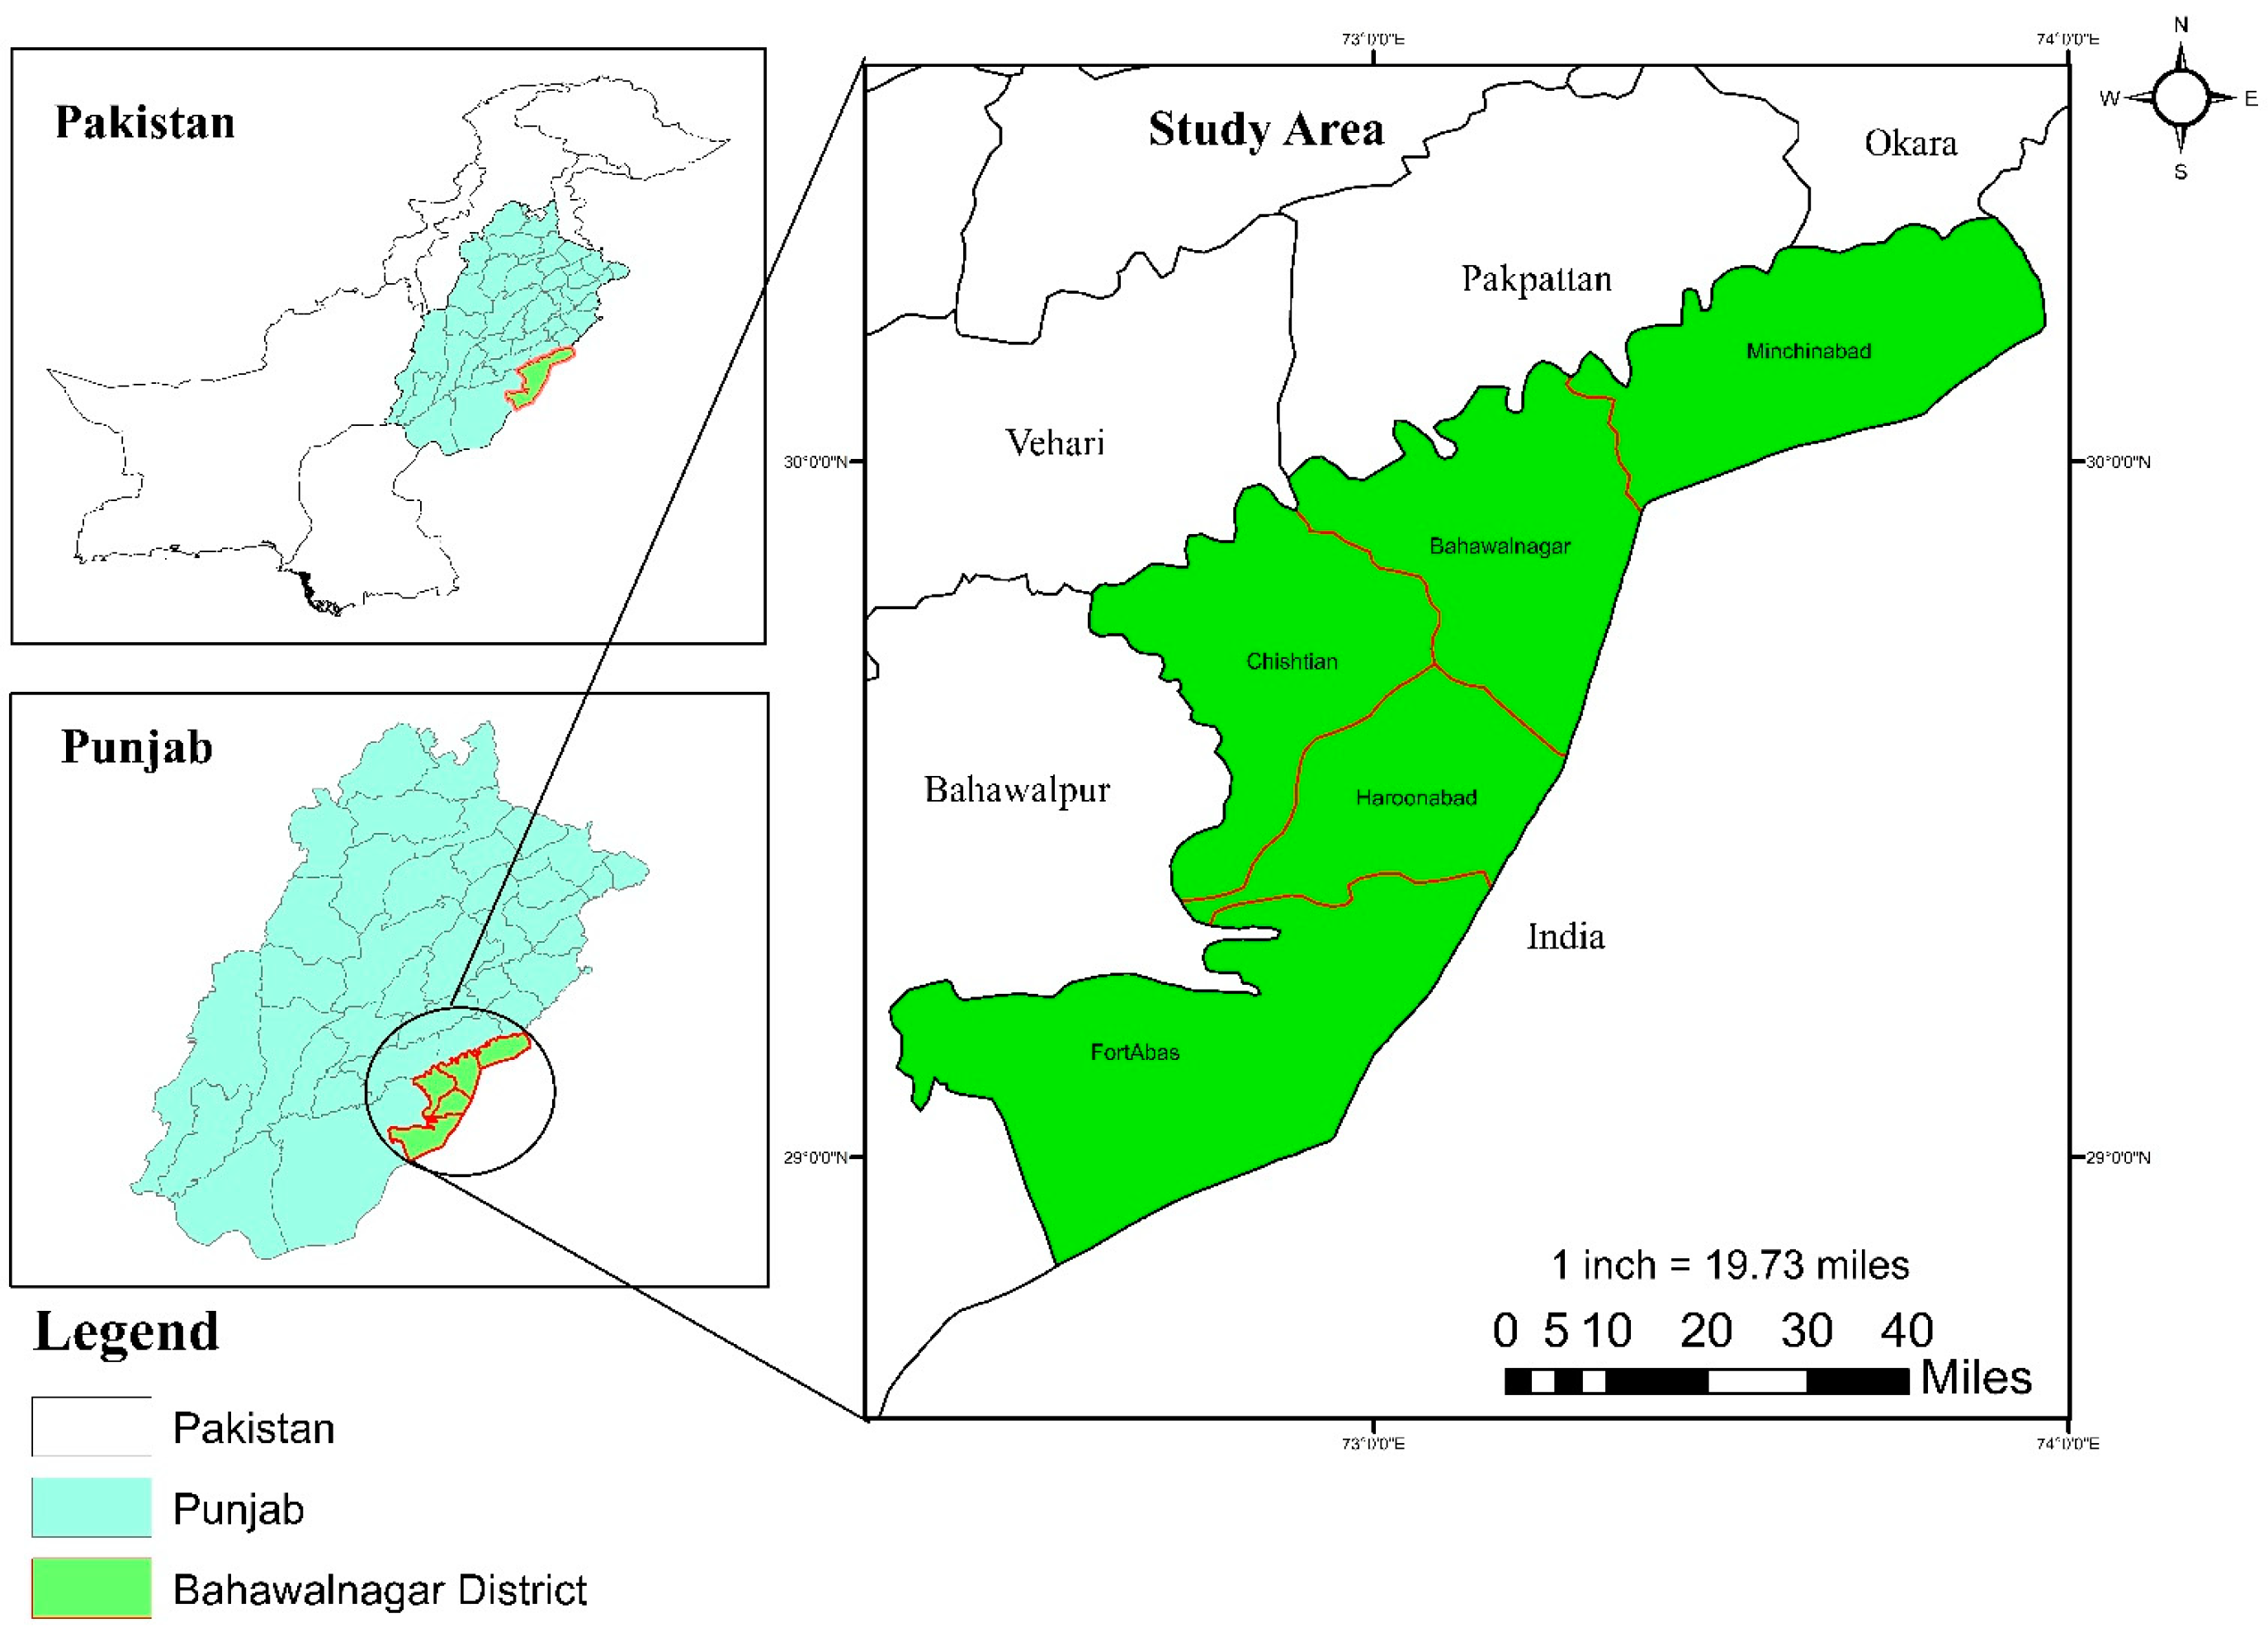
2.1. Study Area
2.2. Data Sources
2.3. Image Processing
3. Results and Discussion
4. Conclusions
Author Contributions
Funding
Institutional Review Board Statement
Informed Consent Statement
Data Availability Statement
Conflicts of Interest
References
- Food and Agriculture Organization of the United Nations (FAO). The State of Food and Agriculture 2010-11: Investing in Agriculture for Food Security; FAO: Rome, Italy, 2011. [Google Scholar]
- Intergovernmental Panel on Climate Change (IPCC). Climate Change 2013: The Physical Science Basis. Contribution of Working Group I to the Fifth Assessment Report of the Intergovernmental Panel on Climate Change; Cambridge University Press: Cambridge, UK; New York, NY, USA, 2013. [Google Scholar]
- Hassan, Z.; Shabbir, R.; Ahmad, S.S.; Malik, A.H.; Aziz, N.; Butt, A.; Erum, S. Dynamics of land use and land cover change (LULCC) using geospatial techniques: A case study of Islamabad Pakistan. SpringerPlus 2016, 5, 812. [Google Scholar] [CrossRef] [PubMed]
- Kumar, N.; Singh, S.K.; Singh, V.G.; Dzwairo, B. Investigation of impacts of land use/land cover change on water availability of Tons River Basin, Madhya Pradesh, India. Model. Earth Syst. Environ. 2018, 4, 295–310. [Google Scholar] [CrossRef]
- Alawamy, J.S.; Balasundram, S.K.; Mohd Hanif, A.H.; Teh Boon Sung, C. Response of Potential Indicators of Soil Quality to Land-Use and Land-Cover Change under a Mediterranean Climate in the Region of Al-Jabal Al-Akhdar, Libya. Sustainability 2021, 14, 162. [Google Scholar] [CrossRef]
- Pulido-Velazquez, M.; Peña-Haro, S.; García-Prats, A.; Mocholi-Almudever, A.F.; Henríquez-Dole, L.; Macian-Sorribes, H.; Lopez-Nicolas, A. Integrated assessment of the impact of climate and land use changes on groundwater quantity and quality in the Mancha Oriental system (Spain). Hydrol. Earth Syst. Sci. 2015, 19, 1677–1693. [Google Scholar] [CrossRef]
- Nhung, N.T.T.; Huu, C.T.; Lebailly, P. Constraints of Agricultural Development in the Context of Environmental Conservation for Protected Areas, Vietnam. In Tropentag 2019 Filling Gaps and Removing Traps for Sustainable Resources Management; Cuvilier Verlag: Göttingen, Germany, 2019. [Google Scholar]
- Butt, A.; Shabbir, R.; Ahmad, S.S.; Aziz, N. Land use change mapping and analysis using Remote Sensing and GIS: A case study of Simly watershed, Islamabad, Pakistan. Egypt. J. Remote Sens. Space Sci. 2015, 18, 251–259. [Google Scholar] [CrossRef]
- Khan, I.; Akram, A.; Fatima, S.; Ahmad, B.; Rehman, Z.; Arshad, N.; Sattar, A.; Ahmad, Z. Problems of agriculture in pakistan: An insight into their solution. Pak. J. Biotechnol. 2022, 19, 73–83. [Google Scholar] [CrossRef]
- Naeem, M.; Farid, H.U.; Madni, M.A.; Ahsen, R.; Khan, Z.M.; Dilshad, A.; Shahzad, H. Remotely sensed image interpretation for assessment of land use land cover changes and settlement impact on allocated irrigation water in Multan, Pakistan. Environ. Monit. Assess. 2022, 194, 98. [Google Scholar] [CrossRef] [PubMed]
- Ma, S.; Li, Y.; Zhang, Y.; Wang, L.J.; Jiang, J.; Zhang, J. Distinguishing the relative contributions of climate and land use/cover changes to ecosystem services from a geospatial perspective. Ecol. Indic. 2022, 136, 108645. [Google Scholar] [CrossRef]
- Baskent, E.Z. Assessment and improvement strategies of sustainable land management (SLM) planning initiative in Turkey. Sci. Total Environ. 2021, 797, 149183. [Google Scholar] [CrossRef]
- Short, N.M. The Remote Sensing Tutorial. NASA. Goddard Space Flight Center. 2004. Available online: http://rst.gsfc.nasa.gov (accessed on 11 November 2023).
- Lillesand, T.M.; Kiefer, R.W.; Chipman, J.W. Remote Sensing and Image Interpretation, 5th ed.; John Wiley & Sons Ltd.: Hoboken, NJ, USA, 2004. [Google Scholar]
- Rwanga, S.S.; Ndambuki, J.M. Accuracy assessment of land use/land cover classification using remote sensing and GIS. Int. J. Geosci. 2017, 8, 611. [Google Scholar] [CrossRef]


| Data Type | Source | Description |
|---|---|---|
| Multispectral images | Landsat 5 and 8 from USGS Earth Explorer | Multiple years’ worth of data from Landsat 5 TM and Landsat 8 OLI_TIRs imaging |
| Road network shapefile | Local authorities | Geographic Information System (GIS) shapefile containing road network data, includes classified roads and their attributes. |
| Population data | Government records | Population census data for District Bahawalnagar, collected from government records. |
| Administrative boundaries | Government records | Shapefile or geographic data defining the administrative boundaries of District Bahawalnagar. |
| Topographic maps | Survey of Pakistan | Topographic maps at a scale of 1:50,000. |
| GPS coordinates | Field surveys | GPS coordinates were collected for the training site to create a spectral signature for image classification during field surveys conducted within the study area of District Bahawalnagar. |
| Actual Class | Predicted Class | Producer Accuracy | User Accuracy |
|---|---|---|---|
| Water bodies | Water bodies | 90% | 85% |
| Bare land | Bare land | 85% | 90% |
| Built-up area | Built-up Area | 80% | 80% |
| Agricultural land | Agricultural land | 80% | 75% |
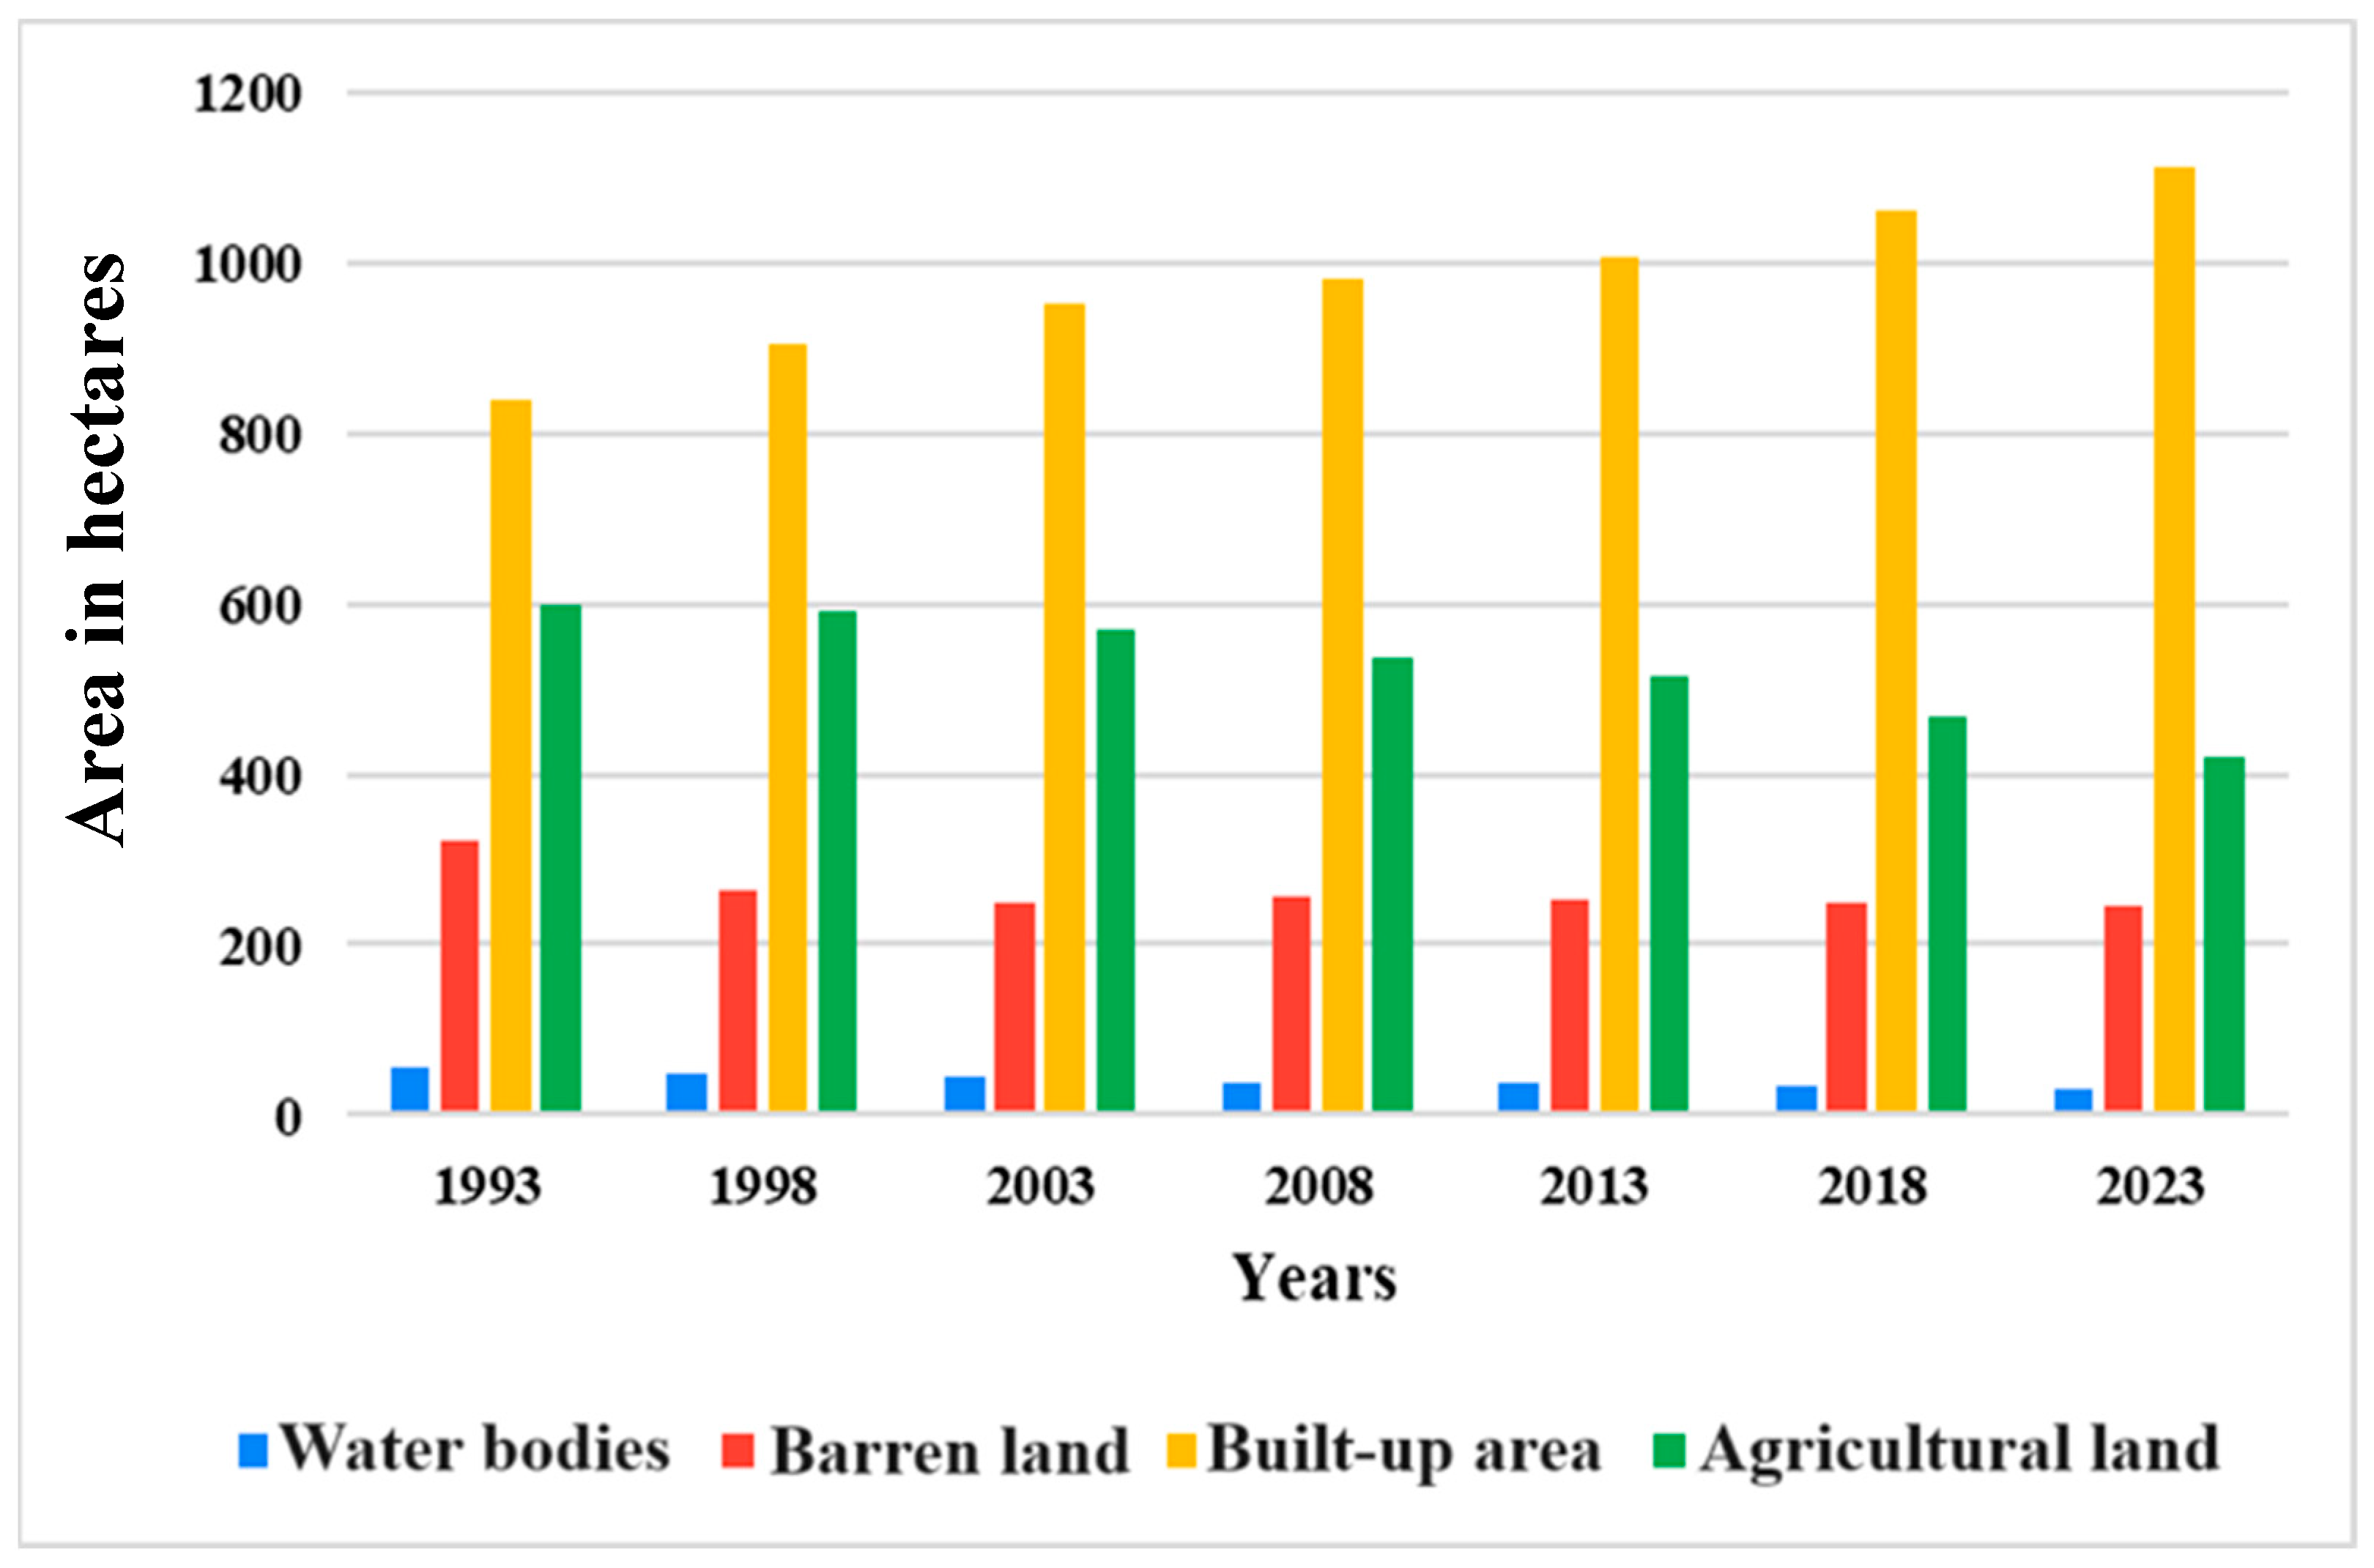
| 1993 | 1998 | 2003 | 2008 | |||||
| LULC Class | Area ha | % | Area ha | % | Area ha | % | Areaha | % |
| Water bodies | 54.311 | 3% | 48.796 | 3% | 43.29 | 2% | 37.79 | 2% |
| Bare land | 320.518 | 18% | 264.898 | 15% | 248.071 | 14% | 257.106 | 14% |
| Built-up area | 837.761 | 46% | 906.146 | 50% | 951.233 | 52% | 980.788 | 54% |
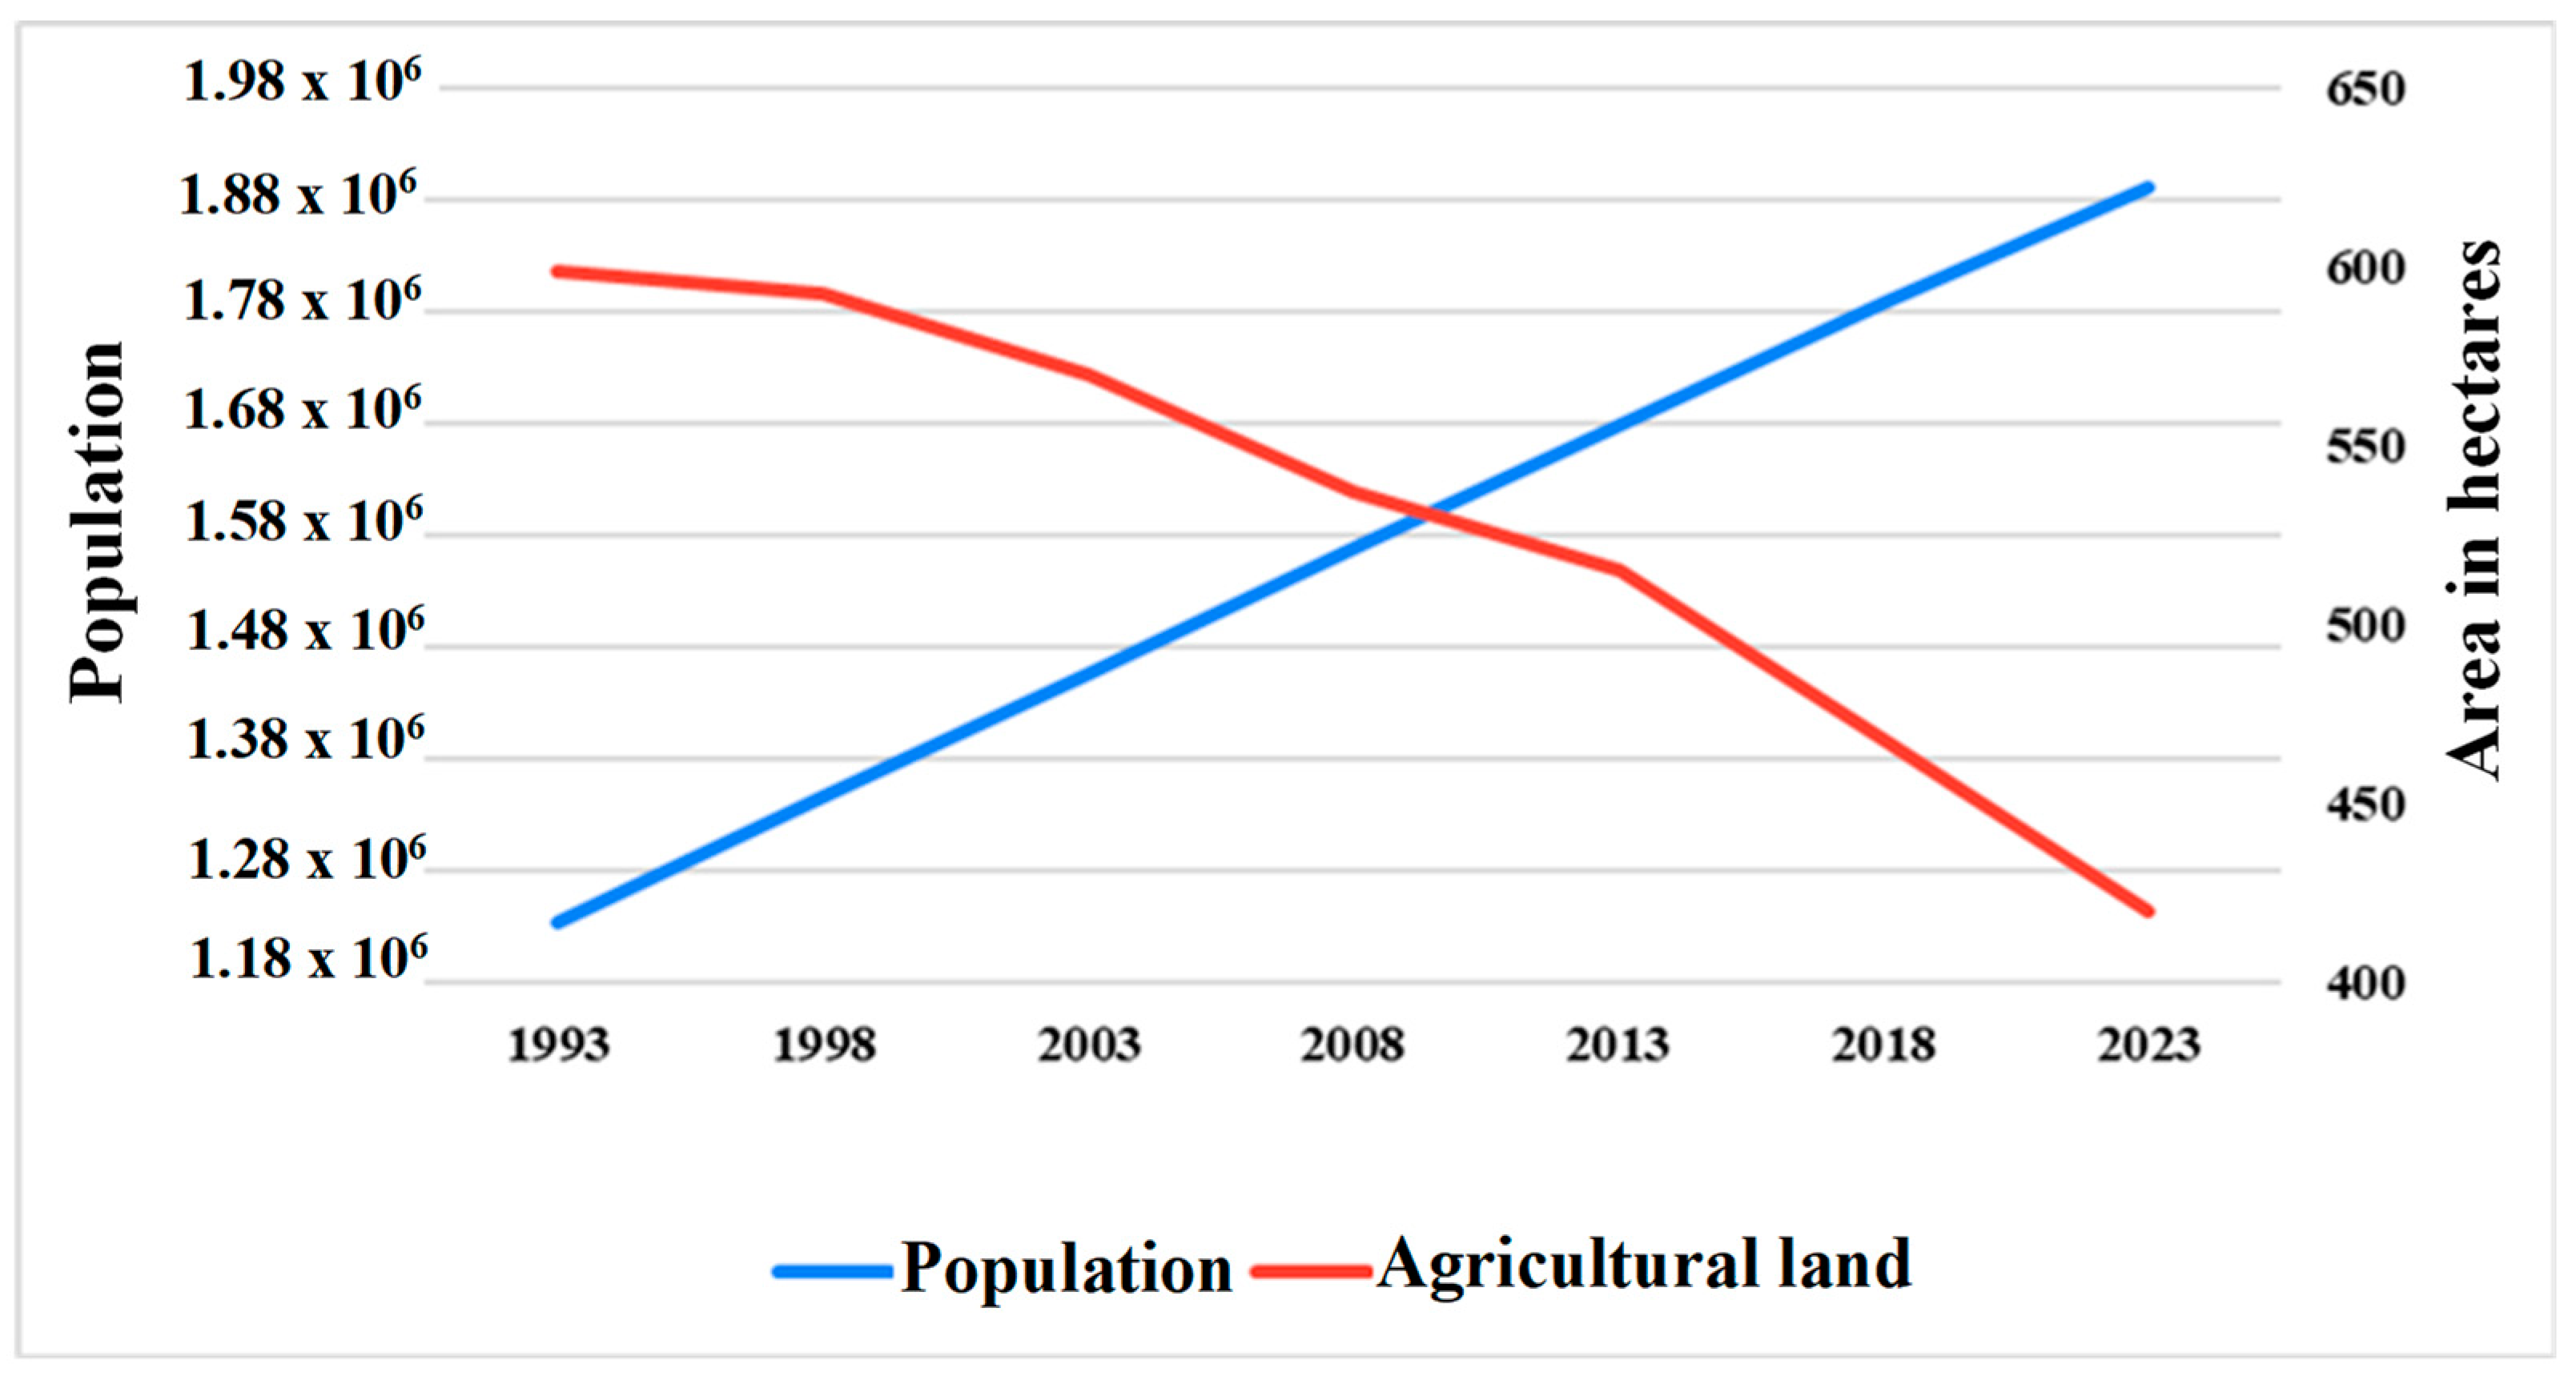
| Agricultural land | 598.779 | 33% | 592.344 | 33% | 569.913 | 31% | 536.818 | 30% |
| Total | 1811.369 | 100% | 1812.184 | 100% | 1812.507 | 100% | 1812.502 | 100% |
| 2013 | 2018 | 2023 | ||||||
| Area ha | % | Area ha | % | Area ha | % | |||
| Water bodies | 38.644 | 2% | 35.10089 | 2% | 31.55778 | 2% | ||
| Bare land | 251.72 | 14% | 249.16 | 14% | 246.6 | 14% | ||
| Built-up area | 1006.566 | 56% | 1060.383625 | 59% | 1114.20125 | 61% | ||
| Agricultural land | 515.57 | 28% | 467.85765 | 26% | 420.1453 | 23% | ||
| Total | 1812.5 | 100% | 1812.502165 | 100% | 1812.50433 | 100% | ||
Disclaimer/Publisher’s Note: The statements, opinions and data contained in all publications are solely those of the individual author(s) and contributor(s) and not of MDPI and/or the editor(s). MDPI and/or the editor(s) disclaim responsibility for any injury to people or property resulting from any ideas, methods, instructions or products referred to in the content. |
© 2024 by the authors. Licensee MDPI, Basel, Switzerland. This article is an open access article distributed under the terms and conditions of the Creative Commons Attribution (CC BY) license (https://creativecommons.org/licenses/by/4.0/).
Share and Cite
Raza, A.; Shahid, M.A.; Safdar, M.; Zaman, M.; Sabir, R.M.; Muzammal, H.; Ahmed, M.M. Impact of Land Use and Land Cover Change on Agricultural Production in District Bahawalnagar, Pakistan. Environ. Sci. Proc. 2024, 29, 46. https://doi.org/10.3390/ECRS2023-16644
Raza A, Shahid MA, Safdar M, Zaman M, Sabir RM, Muzammal H, Ahmed MM. Impact of Land Use and Land Cover Change on Agricultural Production in District Bahawalnagar, Pakistan. Environmental Sciences Proceedings. 2024; 29(1):46. https://doi.org/10.3390/ECRS2023-16644
Chicago/Turabian StyleRaza, Aamir, Muhammad Adnan Shahid, Muhammad Safdar, Muhammad Zaman, Rehan Mehmood Sabir, Hafsa Muzammal, and Mian Muhammad Ahmed. 2024. "Impact of Land Use and Land Cover Change on Agricultural Production in District Bahawalnagar, Pakistan" Environmental Sciences Proceedings 29, no. 1: 46. https://doi.org/10.3390/ECRS2023-16644