1. Introduction
One of the pillars of the National Development Plan 2022–2026 is “Internationalization, Productive Transformation for Life, and Climate Action,” which stipulates that the country’s socio-economic development and environmental sustainability can no longer be treated as separate processes. Therefore, the government must address the interconnected global crises of climate change, biodiversity loss, and the decline of ecosystem services. In Colombia, an area equivalent to the size of the Risaralda department is lost due to deforestation every two years, impacting biodiversity and services such as water protection and oxygen production. This problem is concentrated in nine deforestation hotspots [
1]. Furthermore, it is a matter of concern that approximately 28% of the country’s land is affected by illegal mining activities, highlighting a significant challenge in governance and state surveillance [
2]. These issues pose a serious threat to the effective functioning of the state and call for immediate attention.
The National Development Plan 2022–2026 is aligned with the Sustainable Development Goals (SDGs) adopted by the United Nations in 2015, which represent the most ambitious global agenda approved by the international community to mobilize collective action towards common goals. The SDGs integrate and balance the three essential dimensions of sustainable development, economic, social, and environmental, providing a valuable roadmap for articulating the formulation of global policies [
3]. Without a doubt, a clean, stable, and predictable water supply stands as one of the utmost invaluable ecosystem services that forests bestow upon humanity [
4], but throughout the course of human civilization, the Earth has experienced a significant decline in forested areas, shrinking from approximately 60 million square kilometers to less than 40 [
5]. In Latin America, deforestation occurs mainly in areas dedicated to drug cultivation and distribution [
6]. Colombian forests and jungles face a high risk because criminal groups have stopped relying solely on drug trafficking, as they have found more economic benefits in developing other environmental crimes such as illegal logging, illegal mining, and wildlife trafficking [
7]. Politically, the peace agreement signed in 2016 identifies Colombian ecosystems as direct and indirect victims of the armed conflict. Illegal mining has devastated entire ecosystems, increasing violence and war, displacing farmers to urban areas, and causing loss of biodiversity [
2].
Platforms such as Global Forest Watch and Map Biomass Alert provide forest and jungle monitoring to focus on areas with biomass loss, so that governmental agencies can make decisions and take action against deforestation and other environmental crimes associated with it.
This article proposes a methodology to identify deforestation and illegal mining based on satellite images from the Planet Scope constellation. A tool was developed to detect mercury-contaminated bodies of water and deforestation in the Cauca River in Colombia using object and pixel-based analysis applied to satellite images. The workflow also employs the tip and cue technique, combining machine learning methods and tonality extraction. The tool’s results yield two geographic layers that delimit the study phenomena. The methodology demonstrates efficiency in studying environmental crimes and their change over time and is recommended for use in processes aimed at detecting, mitigating, and preventing damage to the ecosystem.
2. Materials and Methods
2.1. Preliminary Evaluation of the Study Area
The study area is located on the banks of the Cauca River and includes the townships of Margento, Palomar, Palanca, and the hamlet of Villa del Socorro in Caucasia, Antioquia. Despite becoming an economic center due to its connection between departments and the gold rush, illegal armed groups have caused harm through illegal mining, which has negatively impacted both the ecosystem and the inhabitants of the municipality [
8].
2.2. Data Acquisition and Characterization of the Phenomenon
The used imagery is from Planet Scope, these satellite images have 8 spectral bands and 3 meters of spatial resolution, provide a spectral range of 431 nm to 885 nm, and enable daily monitoring of land cover phenomena. Mercury, a pollutant that poses health risks to humans and the environment, is used in gold mining to extract the metal from rocks. The heating process to separate mercury from gold can contaminate soils and rivers [
9]. In optical sensors, mercury appears as a cyan-blue tone in natural color satellite images, and the 864 (RGB) color combination best highlights it, allowing for easy differentiation from vegetation (red color) and bare soil or structures (white color) and facilitating the identification and delineation of mining pits.
2.3. Cover Classification Methods Validation
Object-based image analysis (OBIA) offers several advantages over pixel-based techniques, including greater precision in coverage classification. OBIA involves segmentation and classification phases to identify significant objects in the image and categorize them into pre-defined classes [
10]. Support vector machines (SVMs) are supervised classifiers that have shown excellent results in classification and are commonly used in machine learning. They were chosen for both pixel-based and object-oriented classifications due to their success in previous studies. The workflow presented offers both options to accommodate the expertise and knowledge of the end-user [
11].
2.4. Tool Development
The interface was developed using Esri’s ArcGIS Pro 2.9 software (Esri: Redlands, CA, USA) purchased under a partner license and the task module, which follows a set of steps within the same workflow. Each section (tip and cue) contains an evaluation module for the interpreter, allowing the user to edit geographic layers based on their knowledge of the area. Results are verified through a confusion matrix that includes the Kappa index for the presumed deforestation module and an accuracy percentage for the tonality module.
Figure 1 displays the interface of the tool [
12].
2.4.1. Tip: Deforestation Monitoring
The large-scale analysis was developed to monitor deforestation in forest areas of the area of interest. Two tools have been developed: one using pixel-based classification and the other using object-based classification. Both tools aimed to evaluate and quantify the loss of vegetation cover. The inputs required are pre- and post-event images, segmentation layer, and forest samples (for object-based classification) or a classifier file (for pixel-based classification).
2.4.2. Cue: Extraction of Elements by Tonality
The specific analysis aimed at detecting mercury in illegal mining. Elements of interest were automatically extracted from the satellite image, based on their tone or color. The inputs required satellite imagery and a geographic layer containing samples of mercury, which represent its present in wells. Digital level values were extracted and compared throughout the study area to identify other areas where mercury may be present. This approach allowed for the detection of mercury in illegal mining operations.
3. Results
3.1. Tip (Deforestation Detection)
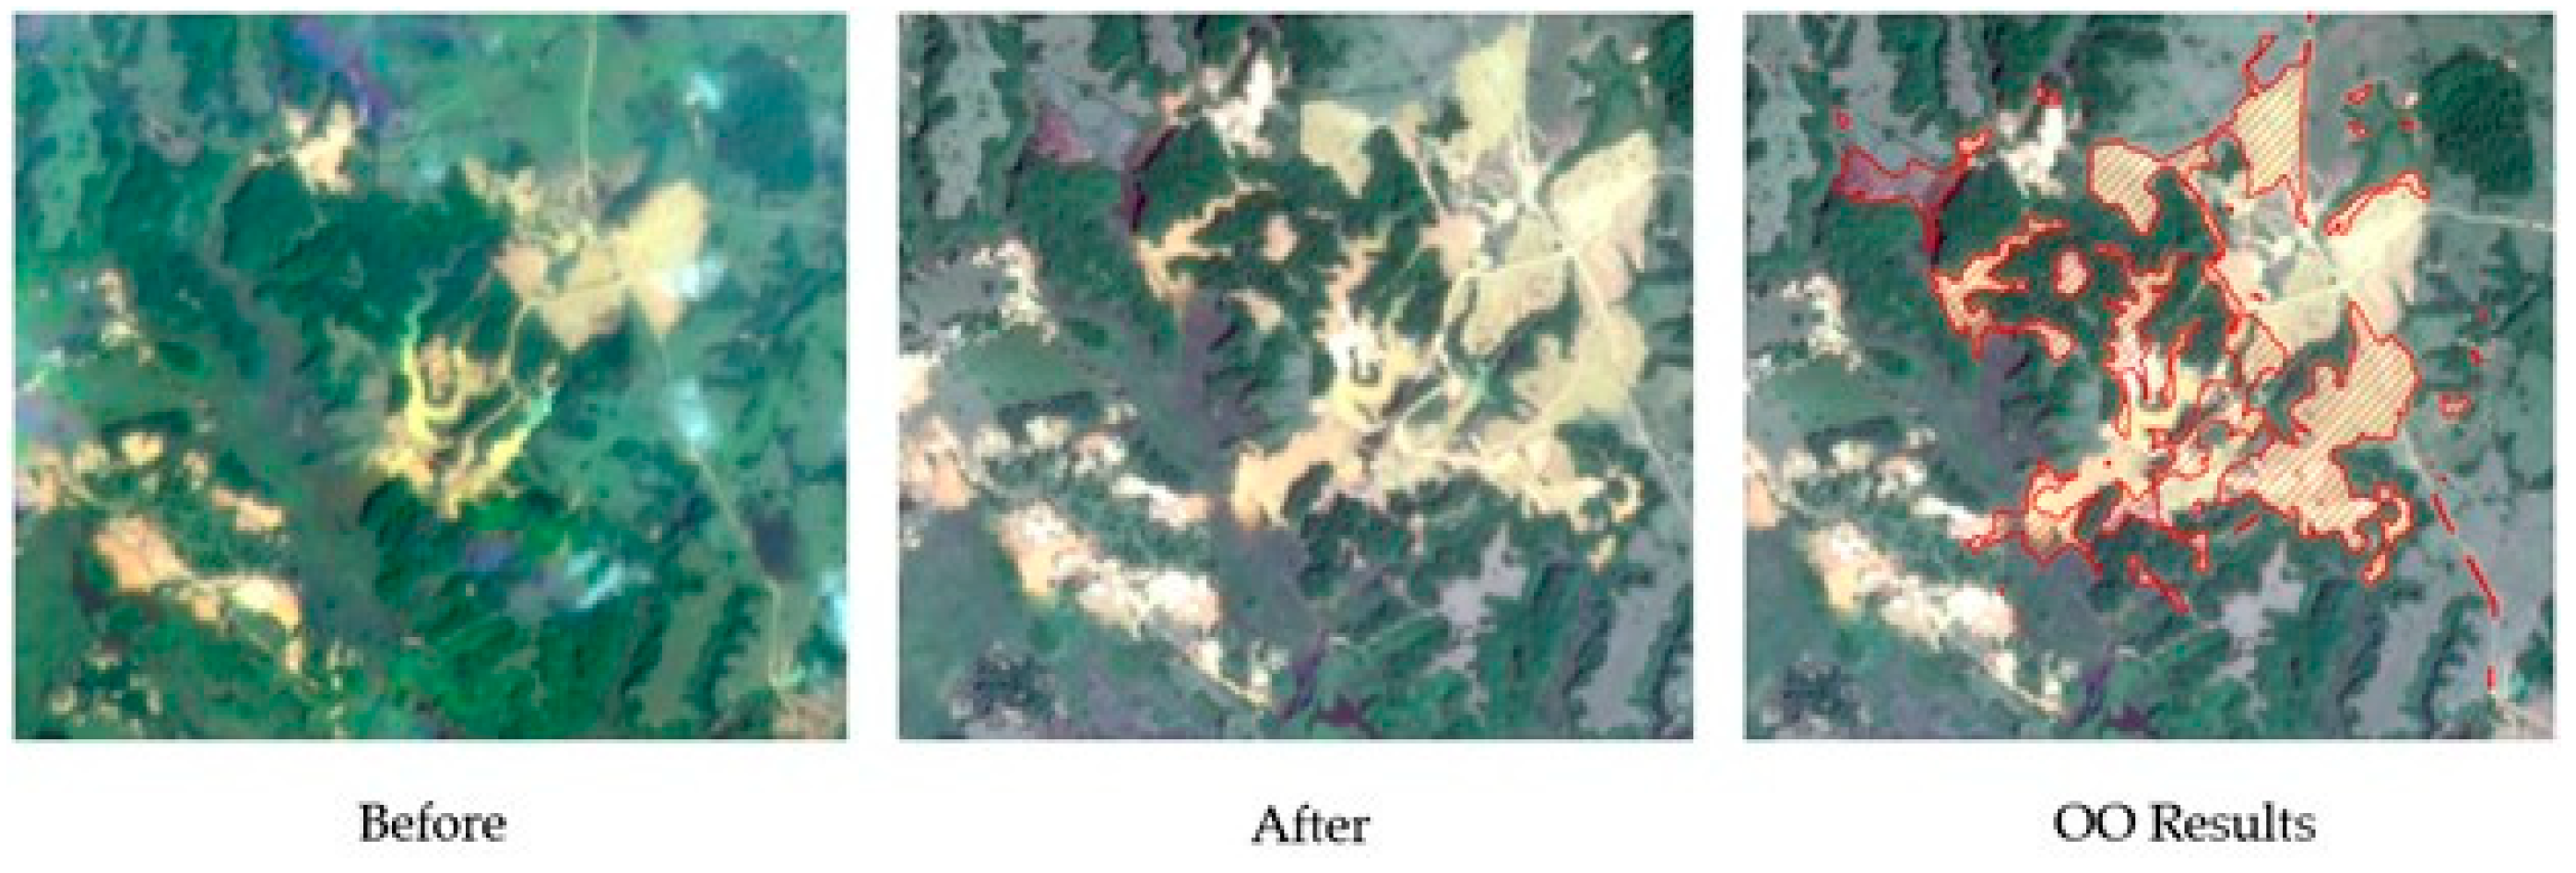
At the end of this phase, four geographic layers are produced, 2 forest classifications which are depicted in
Figure 2 and one deforestation layer for each method showed in
Figure 3. The first two classification layers identify the current forest cover in the study area, while the other ones represent the forest loss calculated by comparing the coverage between the given dates. These layers can be obtained through either object-oriented (OO) or pixel-by-pixel (PP) classification methods and are stored as vector elements, enabling the calculation of areas of interest and interpreter editing. Object Oriented method provides the best result; hence, it was chosen for further analysis.
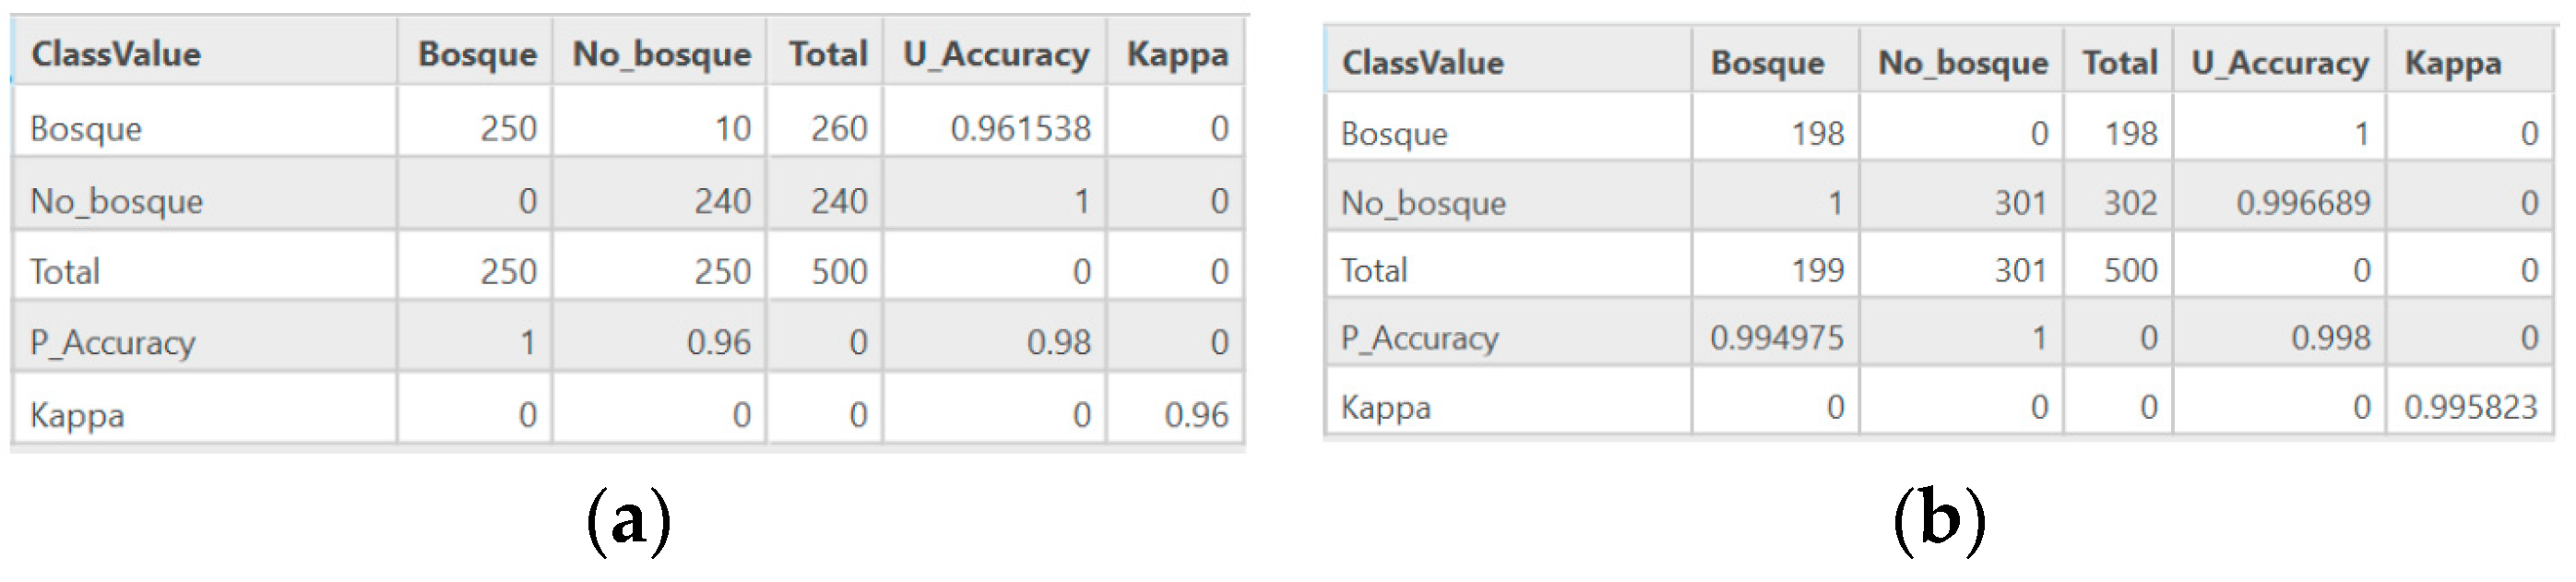
The total loss of forest cover for the study area was estimated at 218.1 ha for the OO method of 5685 ha (3.83%) and 234.1 ha for the PP method of 6340 ha (3.69%) before the intervention of an analyst. In this case, the object-oriented classification method is superior in accurately classifying forest cover and determining its loss, as seen in
Figure 4. The confusion matrix for this method demonstrated a 99% accuracy, confirming its excellent performance.
3.2. Cue (Illegal Mining)
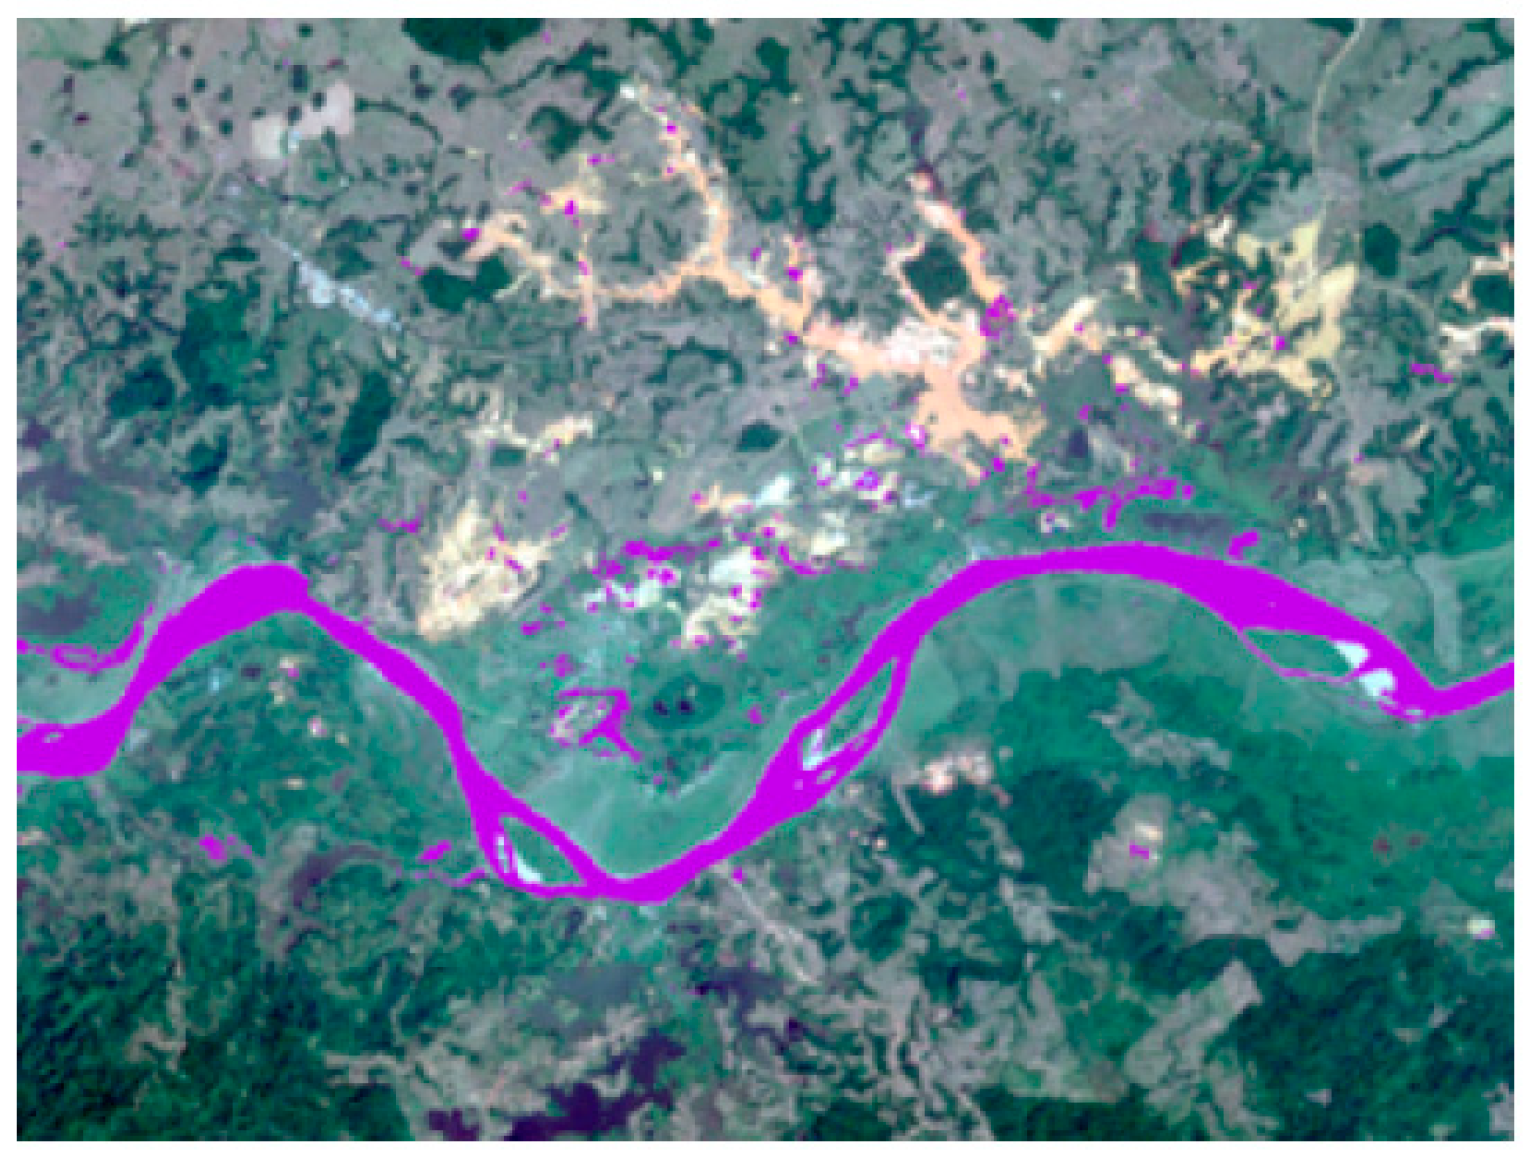
The tonal extraction process is executed after detecting the areas with forest cover loss. It results in two geographic layers, one vector and one raster, which delimit the mercury-contaminated bodies of water. The polygonal layer is useful for calculating coverage area metrics, while the raster layer can be processed with other images and indexes. The results confirm the existence of several contaminated wells and highlight the contaminated segment of the Cauca River, which puts nearby settlements at risk (
Figure 5).
4. Discussion
This case study demonstrates how image processing and tip and cue concept can contribute to the early detection of environmental crimes, aligning with Colombia’s Sustainable Development Goals and National Development Plan 2022–2026. The presented tools generate valuable products for analyzing deforestation and mercury contamination in a territory that is interoperable with other geographic formats and fully editable. However, field verification is recommended as errors may occur due to radiometry, haze, or shadow, and the results need to be adjusted and validated by an analyst. The study area has an estimated 5700 hectares of forest, with 220 hectares lost between January 2021 and January 2022, representing a 4% loss. The main issue in the region appears to be illegal mining, with tonality coverages identifying 8 km² of mercury contamination, including the Cauca River stretch. The analysis suggests a relation between mining and the formation of new water wells in deforested areas.
In conclusion, the integration with Esri’s Task module allows for an intuitive and easy-to-use interface, while maintaining accuracy in processing, making the tools presented in this study accessible to a wide range of users and fields, regardless of the user’s level of knowledge in remote sensing and information systems. However, for future research, the implementation of this workflow in other development environments should not be ruled out.
Author Contributions
Conceptualization, methodology and validation, M.P.V.G., C.C.F.P. and M.A.P.A.; writing-review and editing, G.A.M.B. All authors have read and agreed to the published version of the manuscript.
Funding
This research received no external funding.
Data Availability Statement
The data presented in this study are available on request from the corresponding author. Send an email to
[email protected].
Conflicts of Interest
Authors Valbuena Gaona, M.P.; Ferrucho Parra C.C.; Prieto Arenas, M.A.; Muñoz Bravo G.A were employed by the company Procalculo. All authors declare that the research was conducted in the absence of any commercial or financial relationships that could be construed as a potential conflict of interest.
References
- DNP. Colombia Potencia Mundial de la Vida. Bases del Plan Nacional de Desarrollo 2022–2026. 2022. Available online: https://www.dnp.gov.co/plan-nacional-desarrollo/pnd-2022-2026 (accessed on 25 April 2023).
- Cely Mariño, H.G.; Jaimes Villamizar, O.G.; Moreno Rey, C.H. La Sanción del Delito Ambiental en el Contexto del Conflicto Armado. Master’s Thesis, Universidad Libre, Bogotá, Colombia, 2019. [Google Scholar]
- Gómez Gil, C. Objetivos de Desarrollo Sostenible (ODS): Una revisión crítica. PAPELES de Relaciones Ecosociales y Cambio Global 2017, 140, 107–118. [Google Scholar]
- Zhang, M.; Wei, X. Deforestation, forestation, and water supply. Science 2021, 371, 990–991. [Google Scholar] [CrossRef] [PubMed]
- Bologna, M.; Aquino, G. Deforestation and world population sustainability: A quantitative analysis. Sci. Rep. 2020, 10, 7631. [Google Scholar] [CrossRef] [PubMed]
- Clerici, N.; Armenteras, D.; Kareiva, P.; Botero, R.; Ramírez-Delgado, J.P.; Forero-Medina, G.; Ochoa, J.; Pedraza, C.; Schneider, L.; Lora, C.; et al. Deforestation in Colombian protected areas increased during post-conflict periods. Sci. Rep. 2020, 10, 1–10. [Google Scholar] [CrossRef] [PubMed]
- Instituto Igarapé. La Amazonía Saqueada: Las Raíces de los Delitos Ambientales en cinco Países; InSight Crime: Washington, DC, USA, 2022. [Google Scholar]
- Pérez Casarrubia, E.D. Caucasia: Entre la violencia y la economía. Un Análisis Desde una Perspectiva Antropológica. Master’s Thesis, Universidad de Antioquia, Antioquia, Colombia, 2022. [Google Scholar]
- Cano, S.E. Contaminación con mercurio por la actividad minera. Biomédica 2012, 32, 309–311. [Google Scholar] [CrossRef]
- Osgouei, P.E.; Sertel, E.; Kabadayı, M.E. Integrated usage of historical geospatial data and modern satellite images reveal long-term land use/cover changes in Bursa/Turkey, 1858–2020. Sci. Rep. 2022, 12, 9077. [Google Scholar] [CrossRef] [PubMed]
- Ashiagbor, G.; Forkuo, E.K.; Asante, W.A.; Acheampong, E.; Quaye-Ballard, J.A.; Boamah, P.; Mohammed, Y.; Foli, E. Pixel-based and object-oriented approaches in segregating cocoa from forest in the Juabeso-Bia landscape of Ghana. Remote Sens. Appl. Soc. Environ. 2020, 19, 100349. [Google Scholar] [CrossRef]
- ESRI. Design a Task Item-ArcGIS Pro|Documentation. 2023. Available online: https://pro.arcgis.com/en/pro-app/latest/help/tasks/design-a-task.htm (accessed on 24 February 2023).
| Disclaimer/Publisher’s Note: The statements, opinions and data contained in all publications are solely those of the individual author(s) and contributor(s) and not of MDPI and/or the editor(s). MDPI and/or the editor(s) disclaim responsibility for any injury to people or property resulting from any ideas, methods, instructions or products referred to in the content. |
© 2024 by the authors. Licensee MDPI, Basel, Switzerland. This article is an open access article distributed under the terms and conditions of the Creative Commons Attribution (CC BY) license (https://creativecommons.org/licenses/by/4.0/).


