
Reconstructing the Past of Magnetic Declination at the Real Observatorio de Madrid †


1
Servicio de Geomagnetismo, Instituto Geográfico Nacional, Observatorio Geofísico de Toledo, Av. Adolfo Suárez, km 4, 45005 Toledo, Spain
2
Departamento de Ingeniería Cartográfica Geodesia y Fotogrametría, Universitat Politècnica de València, Camino de Vera s/n, 46022 Valencia, Spain
3
Departamento de Física de la Tierra y Astrofísica, Universidad Complutense de Madrid, Pl. Ciencias, 1, 28040 Madrid, Spain
4
Instituto de Geociencias IGEO, CSIC-UCM, C/Doctor Severo Ochoa, 7, 28040 Madrid, Spain
*
Author to whom correspondence should be addressed.
†
Presented at the IV Conference on Geomatics Engineering, Madrid, Spain, 6–7 July 2023.
Environ. Sci. Proc. 2023, 28(1), 21; https://doi.org/10.3390/environsciproc2023028021
Published: 11 January 2024
(This article belongs to the Proceedings of IV Conference on Geomatics Engineering)
Abstract
:The agonic line, characterized by zero values of geomagnetic declination, has had a westward drift during the last centuries, crossing the location of the Real Observatorio de Madrid at the end of the year 2021. This fact, which was monitored by the Instituto Geográfico Nacional, moves us to study the evolution of the magnetic declination in this emblematic emplacement between the last two crosses of the agonic line. Our results point out that the current westward drift started around the year 1810 and, before this period, the agonic line moved from west to east, crossing the location of the Real Observatorio around 1650–1675.
1. Introduction
During the last months of the year 2021, the agonic line, or 0° magnetic declination line, crossed the location of the Real Observatorio de Madrid (ROM), changing the declination value in this emplacement from the west (negative values) to east (positive values). This westward drift of the agonic line was monitored at the Instituto Geográfico Nacional (IGN, https://www.ign.es/web/ign/portal/paso-de-la-linea-agona-por-madrid accessed on 27 December 2023), by deducting the declination value at the ROM coordinates through the geomagnetic field variations measured at the Observatorio Geofísico de San Pablo de los Montes (SPT).
This is not the first time that the sign change of the declination has taken place at the ROM location due to the drifting movement toward the east or west of the agonic line. The last time this event occurred was during the opposite eastward drift of the agonic line.
The interest in monitoring the cross of the agonic line by the ROM, a center without a great tradition in the study of geomagnetism, comes because it was the first place in Spain where daily measurements of magnetic declination and inclination were made along September 1855 [1]. Later, this observatory was the first center of the Instituto Geográfico Nacional where daily measurements of these parameters were obtained between 1879 and 1901 [2]. These measurements provided ROM with a historical position in the geomagnetic community and aroused in us an interest in knowing the evolution of the geomagnetic declination in this place since the last cross of the agonic line.
2. Materials and Methods
There are very few magnetic declination data observed in Madrid. Apart from the measurements taken at ROM between 1879 and 1901 and the rejected ones of 1855 due to some measurement errors, we only found a determination obtained by Dr. Lamont in 1858 at ROM [3], and other three previous values for Madrid City [1].
With this scarce amount of data, it was impossible to reconstruct the evolution of the declination at ROM, so we need to select other sources of data to obtain a curve of variation of declination for this emplacement.
2.1. Selection of Data
The most important and accurate source of declination data is the measurements obtained at Geomagnetic Observatories. Data from all observatories that IGN has had working in the Iberian Peninsula along the 20th century were selected. Data from other observatories in Spain such as the Real Observatorio de la Armada and the Observatorio del Ebro were also selected.
Further, in order to complete the coverture of data, data from other observatories that have worked in Portugal (Lisbon and Coimbra) and the south of France (Toulouse and Perpignan) were selected. Table 1 shows information about data selected from observatories in Spain, France and Portugal.
Since these data only cover the second half of the 19th century, in order to go back in time, the declination data was completed using the HISTMAG database [4]. This is a database that integers historical geomagnetic data from all around the world along with other non-direct geomagnetic information such as archeomagnetic and volcanic data. Using this database, we select the declination data located in a circular area of 1000 km of radius around San Pablo de los Montes Observatory and covering a temporal period from 1500 to 1900. The result provides a set of 3483 declination values, mainly from marine expeditions around the Iberian Peninsula, and less frequently from measurements on land.
2.2. Relocation of Data
All data selected in the previous section (observatory and historical data) were relocated to the ROM coordinates (latitude = 40.400° N; longitude = 3.6879° W) using the declination spatial gradient obtained from two geomagnetic models. For data between 1590 and 1900, the GUFM1 model [5] was considered, and for data after 1900, the IGRF-13 model [6] was used. The final relocated data is plotted versus time in Figure 1.
2.3. Preliminary Declination Curve
By means of a bootstrapping method applied to the relocated data, we obtain a preliminary curve. This approach provides a temporal fitting taking into account a base of penalised cubic B-splines. The error margins of the curve were estimated considering three different uncertainty values in the declination measurement according to the date on which they were obtained: 1′ for observatory data after 1900; 0.5° for historical data between 1750 and 1900; and 1° for historical data before 1750.
The result was a declination curve for the ROM that was presented at the 10th Spanish–Portuguese Assembly of Geodesy and Geophysics [7]. This declination curve showed a minimum declination value of −20.8° in the year 1811, and then a progressive increase until it obtained a 0° value at the end of 2021. The previous value of 0° was situated at ROM for the year 1668.
3. Improvement of Curve Fitting
The above-cited preliminary study shows the evolution of the declination at ROM for the last 432 years. Nevertheless, an improvement has been made considering some data selections and fitting parameters that were not considered in the previous study.
As in the previous case, we apply a bootstrap method to generate the declination curve, but now the data is ranked into two categories: historical data covering the earliest times up to 1950, and the instrumental data series covering from 1850 to the most modern values.
The smoothing parameter of the declination curve (λ) has been modified in the fitting approach showing an optimal value of λ = 0.1 for the historical data and λ = 0.001 for the instrumental series. Additionally, it has been considered a set of b-spline functions separated by knot points every 20 and 40 years for each kind of data, respectively. To obtain the error bars of the declination curve, the bootstrap approach considers a total of 1000 iterations.
The resulting curves with the error bands obtained by applying the above-mentioned approach have been merged at 1900 resulting in the declination curve for the ROM (see Figure 1).
4. Declination Data Residual
Once the optimal declination curve for the ROM is obtained, it has been calculated the residues of each database used in the calculation process with respect to the fitted curve.
For this, it has been considered the two independent types of data: historical data and instrumental data, as defined above.
The histograms of the residuals obtained for each series are shown in Figure 2. The histogram of the historical data (Figure 2a) points out the sum of two types of distributions: a Gaussian distribution plus a Laplacian distribution, both centered at 0°. The histogram of the instrumental data (Figure 2b) follows a Gaussian distribution centered at 0°. These results indicate an appropriate fitting of both kinds of data to obtain the declination curve at the ROM coordinates.
5. Discussion and Conclusions
In this work, an improvement of the declination curve for the ROM obtained in previous work has been carried out. The new declination curve has a better variability than the preliminary one and it is better adapted to original data. The goodness of the new fit has been verified with the distribution of the residuals obtained between the original data and the fitted curve.
According to the new curve, the declination presented an eastward drift up to 1810 crossing the agonic line by the ROM around 1657 (see Figure 3). Then, the declination turns to a westward drift crossing again the agonic line at the ROM coordinates at the end of 2021.
Author Contributions
Conceptualization, J.M.T. and F.J.P.-C.; methodology, F.J.P.-C.; software, F.J.P.-C.; validation, J.M.T. and F.J.P.-C.; formal analysis, J.M.T.; investigation, J.M.T.; writing—original draft preparation, J.M.T.; writing—review and editing, F.J.P.-C. and A.B.A.; supervision, F.J.P.-C. and A.B.A. All authors have read and agreed to the published version of the manuscript.
Funding
This research received no external funding.
Data Availability Statement
Current data from SPT observatory are freely available at https://doi.org/10.7419/162.06.2023 (accessed on 9 January 2024). Historical data from IGN observatories are freely available at https://www.ign.es/web/ign/portal/gmt-anuarios-geomagneticos (accessed on 9 January 2024). Annual means data from observatories are available at the WDC of Geomagnetism (Edinburgh): https://geomag.bgs.ac.uk/data_service/data/annual_means.shtml (accessed on 9 January 2024).
Conflicts of Interest
The authors declare no conflict of interest.
References
- Rico y Sinobas, M. Observaciones magnéticas de declinación e inclinación, hechas en el Observatorio de Madrid el mes de setiembre de 1855 por D. Manuel Rico y Sinobas, encargado de dirigir las observaciones meteorológicas del mismo, e individuo corresponsal de la Real Academia de Ciencias. Rev. Prog. Cienc. Exactas Fis. Nat. 1856, Tomo VI, 83–97. [Google Scholar]
- Pro, C.; Vaquero, J.M.; Moreno-Pizarro, D. Early geomagnetic data from the Astronomical Observatory of Madrid (1879–1901). Geosci. Data J. 2018, 5, 87–93. [Google Scholar] [CrossRef]
- Lamont, J. Untersuchungen über Die Richtung und Stärke des Erdmagnetismus an Verschiedenen Puncten des Südwestlichen Europa; Hübschmann: Munchen, Germany, 1858. [Google Scholar]
- Arneitz, P.; Leonhardt, R.; Schepp, E.; Heilig, B.; Mayrhofer, F.; Kovacs, P.; Hejda, P.; Valach, F.; Vadasz, G.; Hammerl, C.; et al. The HISTMAG database: Combinating historical, archeomagnetic and volcanic data. Geophys. J. Int. 2017, 210, 1347–1359. [Google Scholar] [CrossRef]
- Jackson, A.; Jonkers, A.R.T.; Walker, M.R. Four centuries of geomagnetic secular variation from historical records. Phil. Trans. R. Soc. A 2000, 358, 957–990. [Google Scholar] [CrossRef]
- Alken, P.; Thébault, E.; Beggan, C.D.; Amit, H.; Aubert, J.; Baerenzung, J.; Bondar, T.N.; Brown, W.J.; Califf, S.; Chambodut, A.; et al. International Geomagnetic Reference Field: The thirteenth generation. Earth Planets Space 2021, 73, 49. [Google Scholar] [CrossRef]
- Tordesillas, J.M.; Pavón-Carrasco, F.J.; Villasante, V.; Nuñez, A.; Anquela, A.B. Evolución de la declinación magnética en el Real Observatorio de Madrid entre los dos últimos pasos de la línea ágona. In Proceedings of the 10th Spanish-Portuguese Assembly on Geodesy and Geophysics, Toledo, Spain, 28 November–1 December 2022. [Google Scholar]
Figure 1.
Fitted declination curve obtained for the Real Observatorio de Madrid (blue solid line) and its error margins (red dashed lines). In the background, relocated data that have been used for curve fitting (grey dots).
Figure 1.
Fitted declination curve obtained for the Real Observatorio de Madrid (blue solid line) and its error margins (red dashed lines). In the background, relocated data that have been used for curve fitting (grey dots).
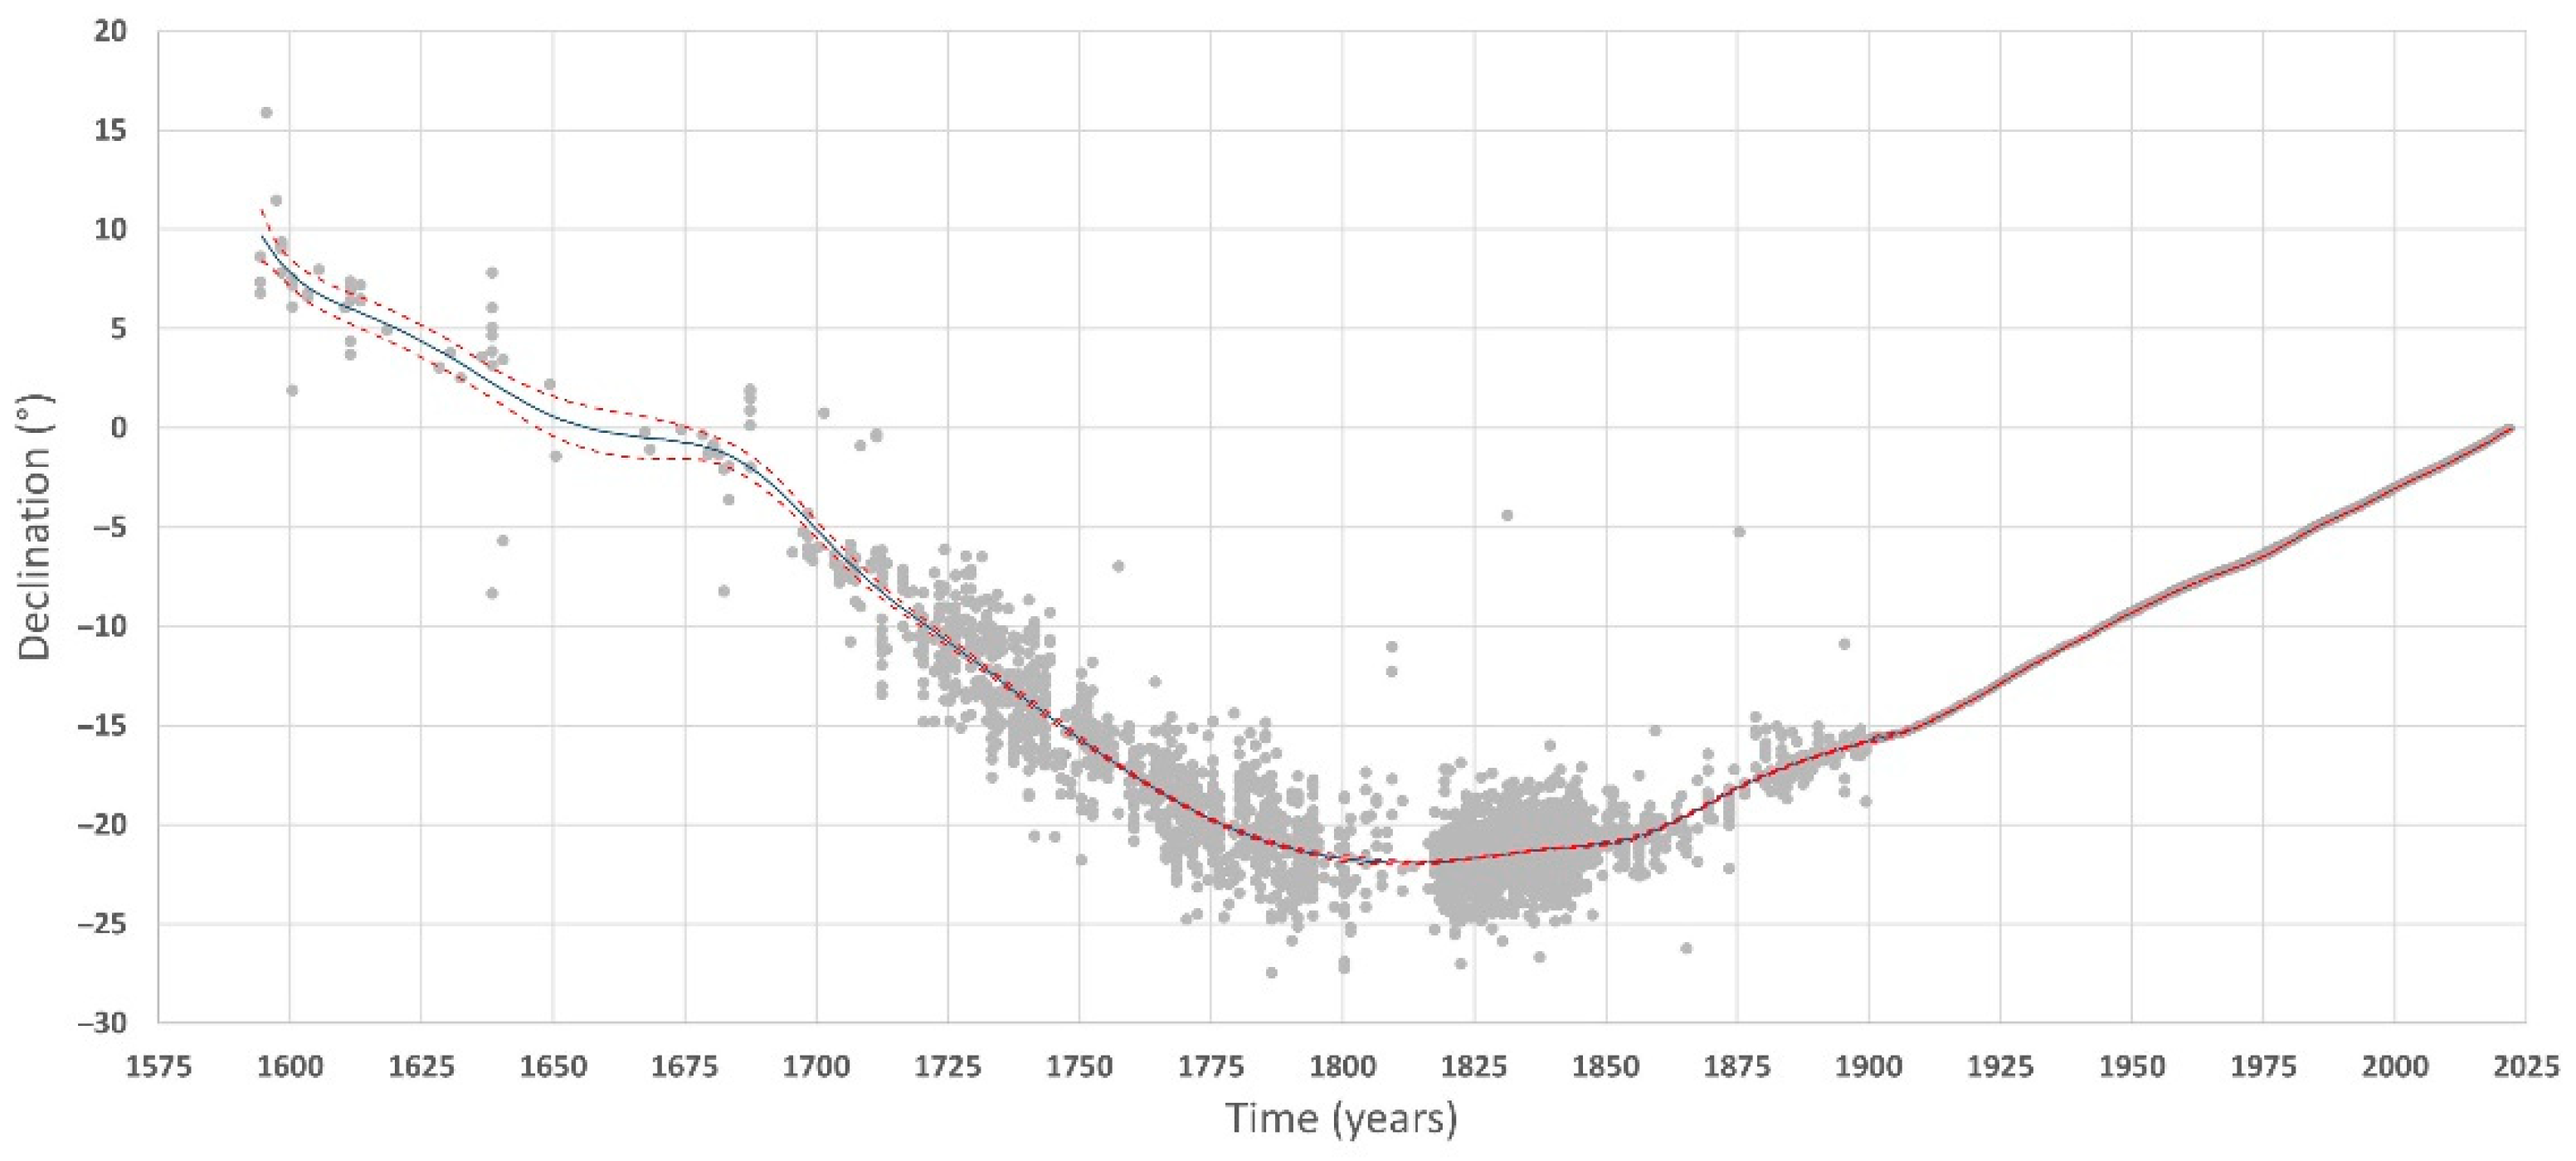
Figure 2.
Distribution of residuals between original data and the fitted declination curve of the ROM: (a) histogram of residuals for the historical data series; (b) histogram of residuals for the instrumental data series.
Figure 2.
Distribution of residuals between original data and the fitted declination curve of the ROM: (a) histogram of residuals for the historical data series; (b) histogram of residuals for the instrumental data series.
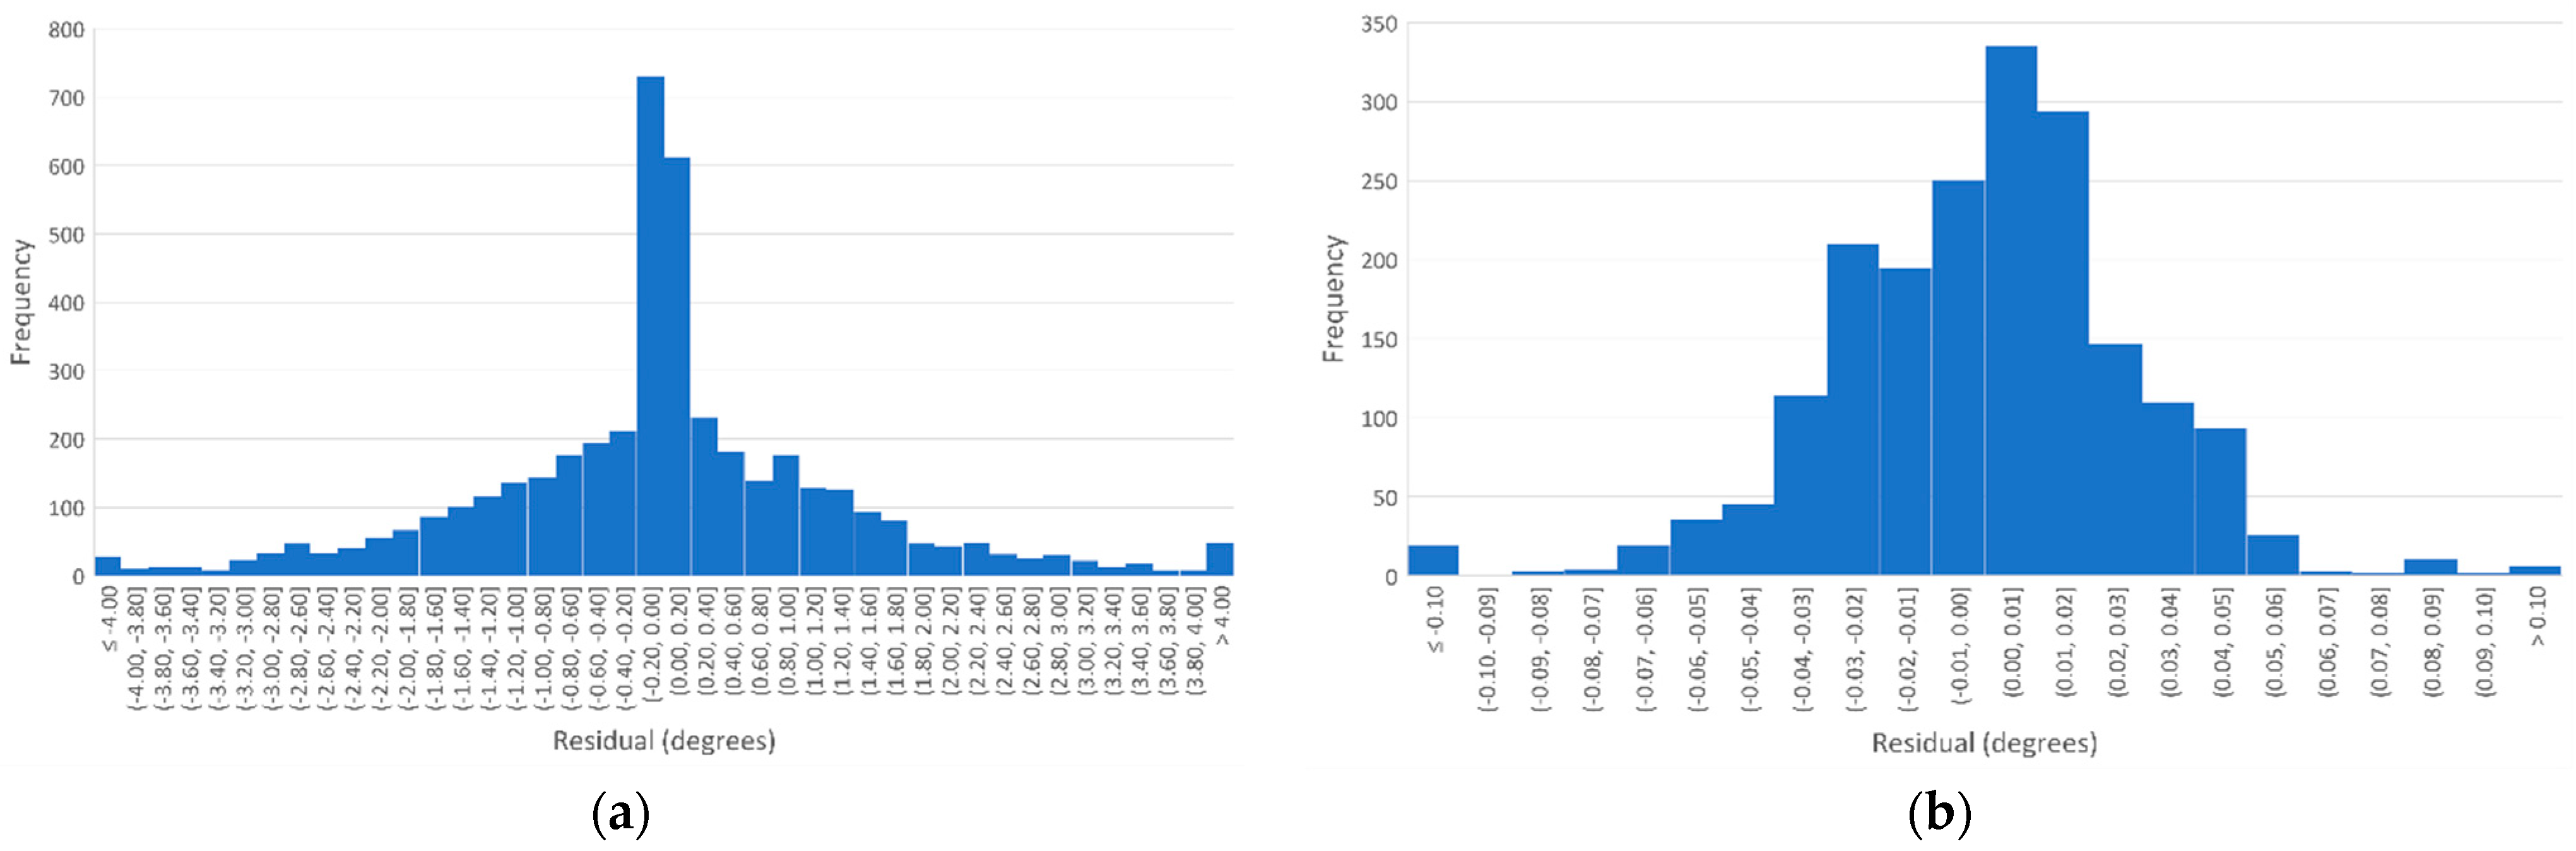
Figure 3.
Detail of the declination curve. The yellow cross shows the date when the declination at ROM had a 0° value, changing from east values (positive) to west values (negative).
Figure 3.
Detail of the declination curve. The yellow cross shows the date when the declination at ROM had a 0° value, changing from east values (positive) to west values (negative).


Table 1.
Geomagnetic observatories where the declination data have been selected.
| Observatory | Owner | Period of Data |
|---|---|---|
| Toledo | Spain (IGN) | 1947–1981 |
| San Pablo de los Montes (Toledo) | Spain (IGN) | 1982–2022 |
| Almería | Spain (IGN) | 1955–1989 |
| Logroño | Spain (IGN) | 1957–1976 |
| San Fernando (Cádiz) | Spain (Spanish Army) | 1879–2022 |
| Ebro (Tarragona) | Spain (Jesuits Fathers—Observatory de l’Ebre Foundation) | 1904–2022 |
| Infante D. Luiz (Lisbon) | Portugal | 1858–1900 |
| Universidade de Coimbra | Portugal | 1866–2022 |
| Toulouse | France | 1882–1905 |
| Perpignan | France | 1886–1910 |
Disclaimer/Publisher’s Note: The statements, opinions and data contained in all publications are solely those of the individual author(s) and contributor(s) and not of MDPI and/or the editor(s). MDPI and/or the editor(s) disclaim responsibility for any injury to people or property resulting from any ideas, methods, instructions or products referred to in the content. |
© 2024 by the authors. Licensee MDPI, Basel, Switzerland. This article is an open access article distributed under the terms and conditions of the Creative Commons Attribution (CC BY) license (https://creativecommons.org/licenses/by/4.0/).
Share and Cite
MDPI and ACS Style
Tordesillas, J.M.; Pavón-Carrasco, F.J.; Anquela, A.B. Reconstructing the Past of Magnetic Declination at the Real Observatorio de Madrid. Environ. Sci. Proc. 2023, 28, 21. https://doi.org/10.3390/environsciproc2023028021
AMA Style
Tordesillas JM, Pavón-Carrasco FJ, Anquela AB. Reconstructing the Past of Magnetic Declination at the Real Observatorio de Madrid. Environmental Sciences Proceedings. 2023; 28(1):21. https://doi.org/10.3390/environsciproc2023028021
Chicago/Turabian StyleTordesillas, Jose Manuel, Francisco Javier Pavón-Carrasco, and Ana Belén Anquela. 2023. "Reconstructing the Past of Magnetic Declination at the Real Observatorio de Madrid" Environmental Sciences Proceedings 28, no. 1: 21. https://doi.org/10.3390/environsciproc2023028021