Proceeding Paper

Identification of Areas with Instability and Surface Deformation: Using Advanced Radar Interferometry in the Municipality of Fusagasugá, Colombia †

by
Edier Fernando Ávila
1,2,*,
Bibiana Royero Benavides
2 and
Gelberth Efren Amarillo
2
1
Higher Technical School of Engineers, Universidad Politécnica of Madrid, 28040 Madrid, Spain
2
Faculty of Agricultural Sciences, Universidad of Cundinamarca, Fusagasugá 252211, Colombia
*
Author to whom correspondence should be addressed.
Presented at the IV Conference on Geomatics Engineering, Madrid, Spain, 6–7 July 2023.
Environ. Sci. Proc. 2023, 28(1), 19; https://doi.org/10.3390/environsciproc2023028019
Published: 10 January 2024
(This article belongs to the Proceedings of IV Conference on Geomatics Engineering)

Abstract

:
The municipality of Fusagasugá is located 50 kilometers from the city of Bogotá, Colombia, in the eastern cordillera of the Andes in South America. Due to its geographical location, a mountainous area with heights between 1000 and 2000 meters above sea level and two rainy seasons a year, it is affected by processes of instability and surface deformations. The objective of the present investigation was to identify and quantify the displacement speeds of the zones affected by processes of instability and superficial deformation. In this study, 20 radar satellite images from the Sentinel-1 program were used in the SLC format between 30 January 2020 and 19 April 2022 in descending orbit, applying the Small Base Line (SBAS) technique. On the other hand, 21 SAR images were also used in descending orbit between 6 January 2020 and 14 December 2021, applying the persistent scatterers (PS) technique. With the above information, it was possible to map and update the data of the municipality of Fusagasugá in order to include them in the monitoring processes at the regional level.

1. Introduction

Increasing populations in big cities and land use changes in the rural zones exacerbate the problems of instability processes and deformation over the Earth’s surface [1,2], increasing the risk of landslides of huge proportions [3]. These events have been increasingly common [4] and are mainly generated by hydrogeomorphological factors [1], which are associated with climate change [5,6]. The delimitation and monitoring of these events make a difference and can mitigate a potential natural disaster into a simple natural event that does not include the loss of human life [7]. Landslides have affected human life, the economy and infrastructure in major parts around the globe, and these events have appeared in Portugal [8], the Indian Himalayas [9], China [10], the United States [11] and Colombia [12].
Differential interferometry using radar images (DINSAR) is a novel tool that can cover a huge spatial area to show instability processes, monitor landcover deformations [13,14,15,16,17], make landslide predictions [18], monitor geological faults [19,20], monitor volcanic activity [21], monitor seismic movements [22], monitor extraction of resources from the subsoil [23], and show unstable areas of the Earth [24].
The municipality of Fusagasugá has areas with steep topographic slopes and, mixed with hydrometeorological factors, can produce huge landslides; therefore, the production of spatial information related to these processes is very important because this information allows the municipality to monitor possible landslides and prevent a possible natural disaster.
The objective of the present investigation was to identify the active zones with deformation and surface instability using DINSAR tools as a contribution to the municipality’s risk monitoring and management program.

2. Materials and Methods
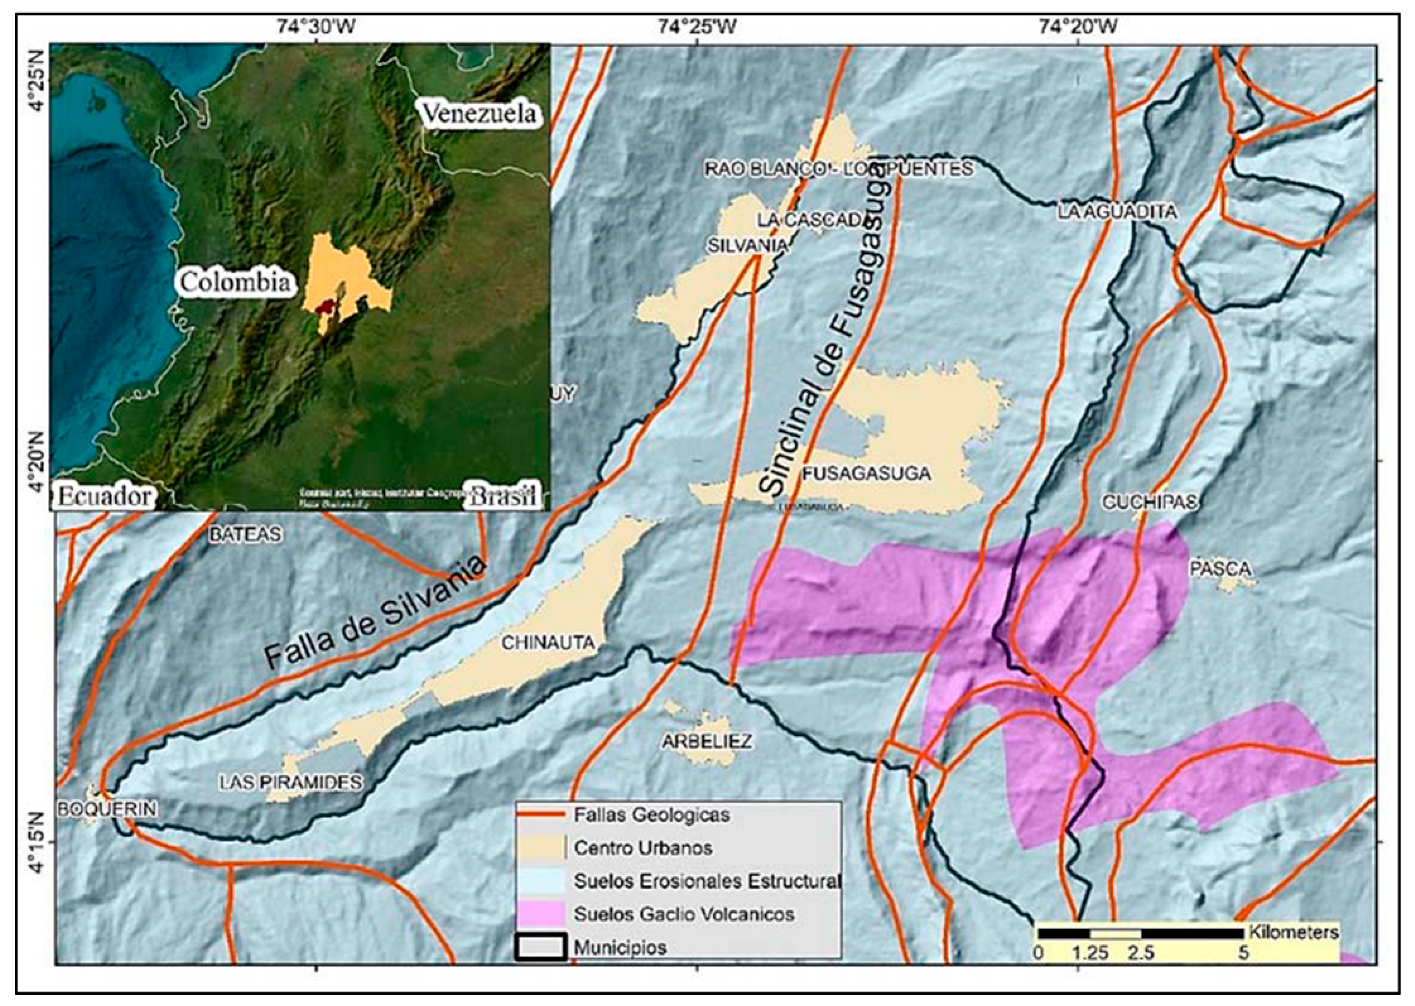
2.1. Evaluated Area

The municipality of Fusagasugá is located in the eastern cordillera of the Andes in South America. It has mountain landscapes, high mountain landscapes and a 54% flat relief, and the remaining landscape is moderately inclined [25]. There are sedimentary rocks from the Cretaceous period that are associated with the depositional processes that formed the landscape. Geologically, the Fusagasugá and Silvania faults and the Fusagasugá syncline are present (Figure 1). According to morphogenesis, it presents some mountain landscapes, and terrain formations, such as structural and erosional slopes, stand out.
The research area presents two rainy periods in March–May and September–November, with rainfall volumes around 270 mm/month in the first period, which are more abundant in the second period, about 330 mm/month, as of 2022. The city is located at a north latitude of 4°20′38′′ and a west longitude of 74°22′04′′.

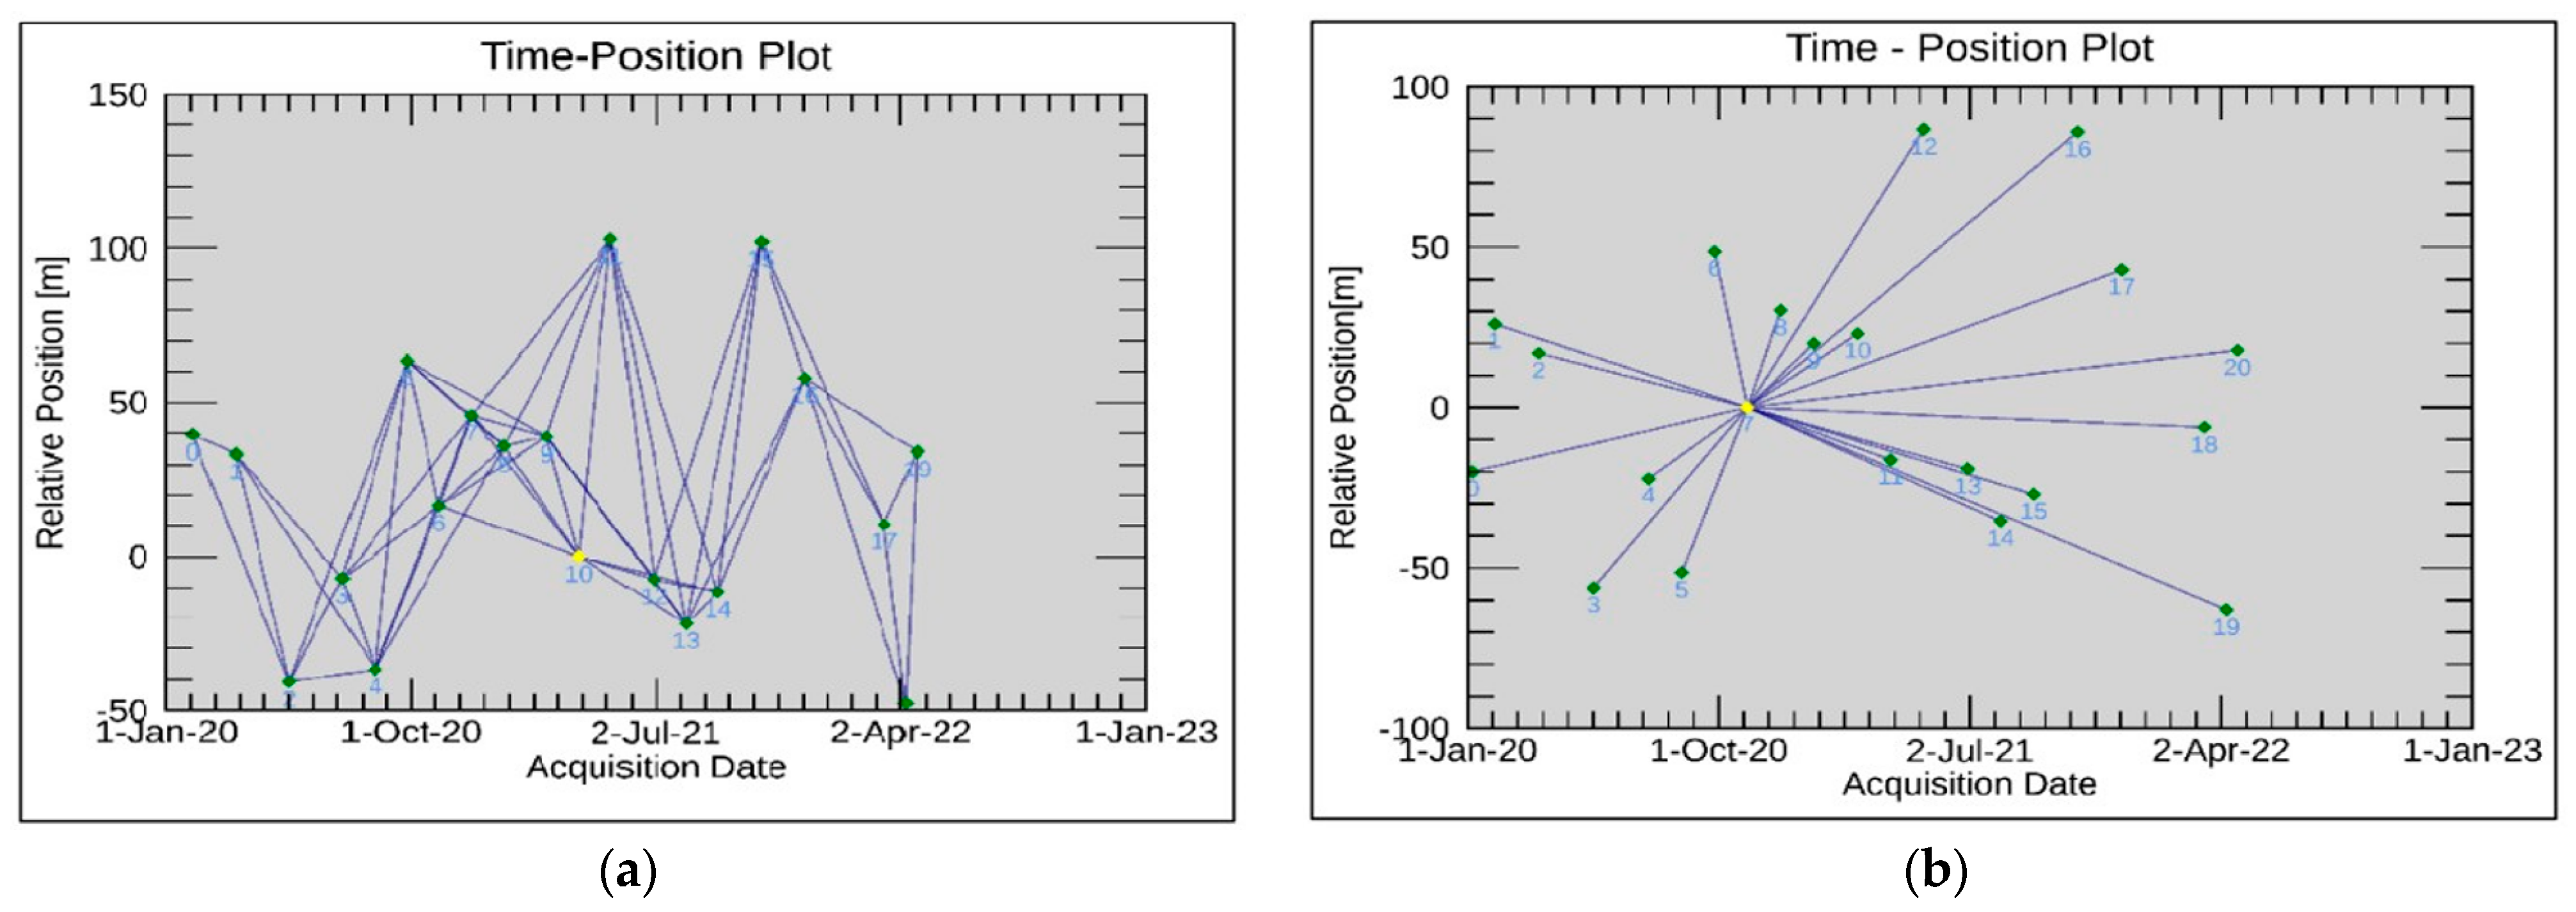
2.2. Selection of Method and Materials
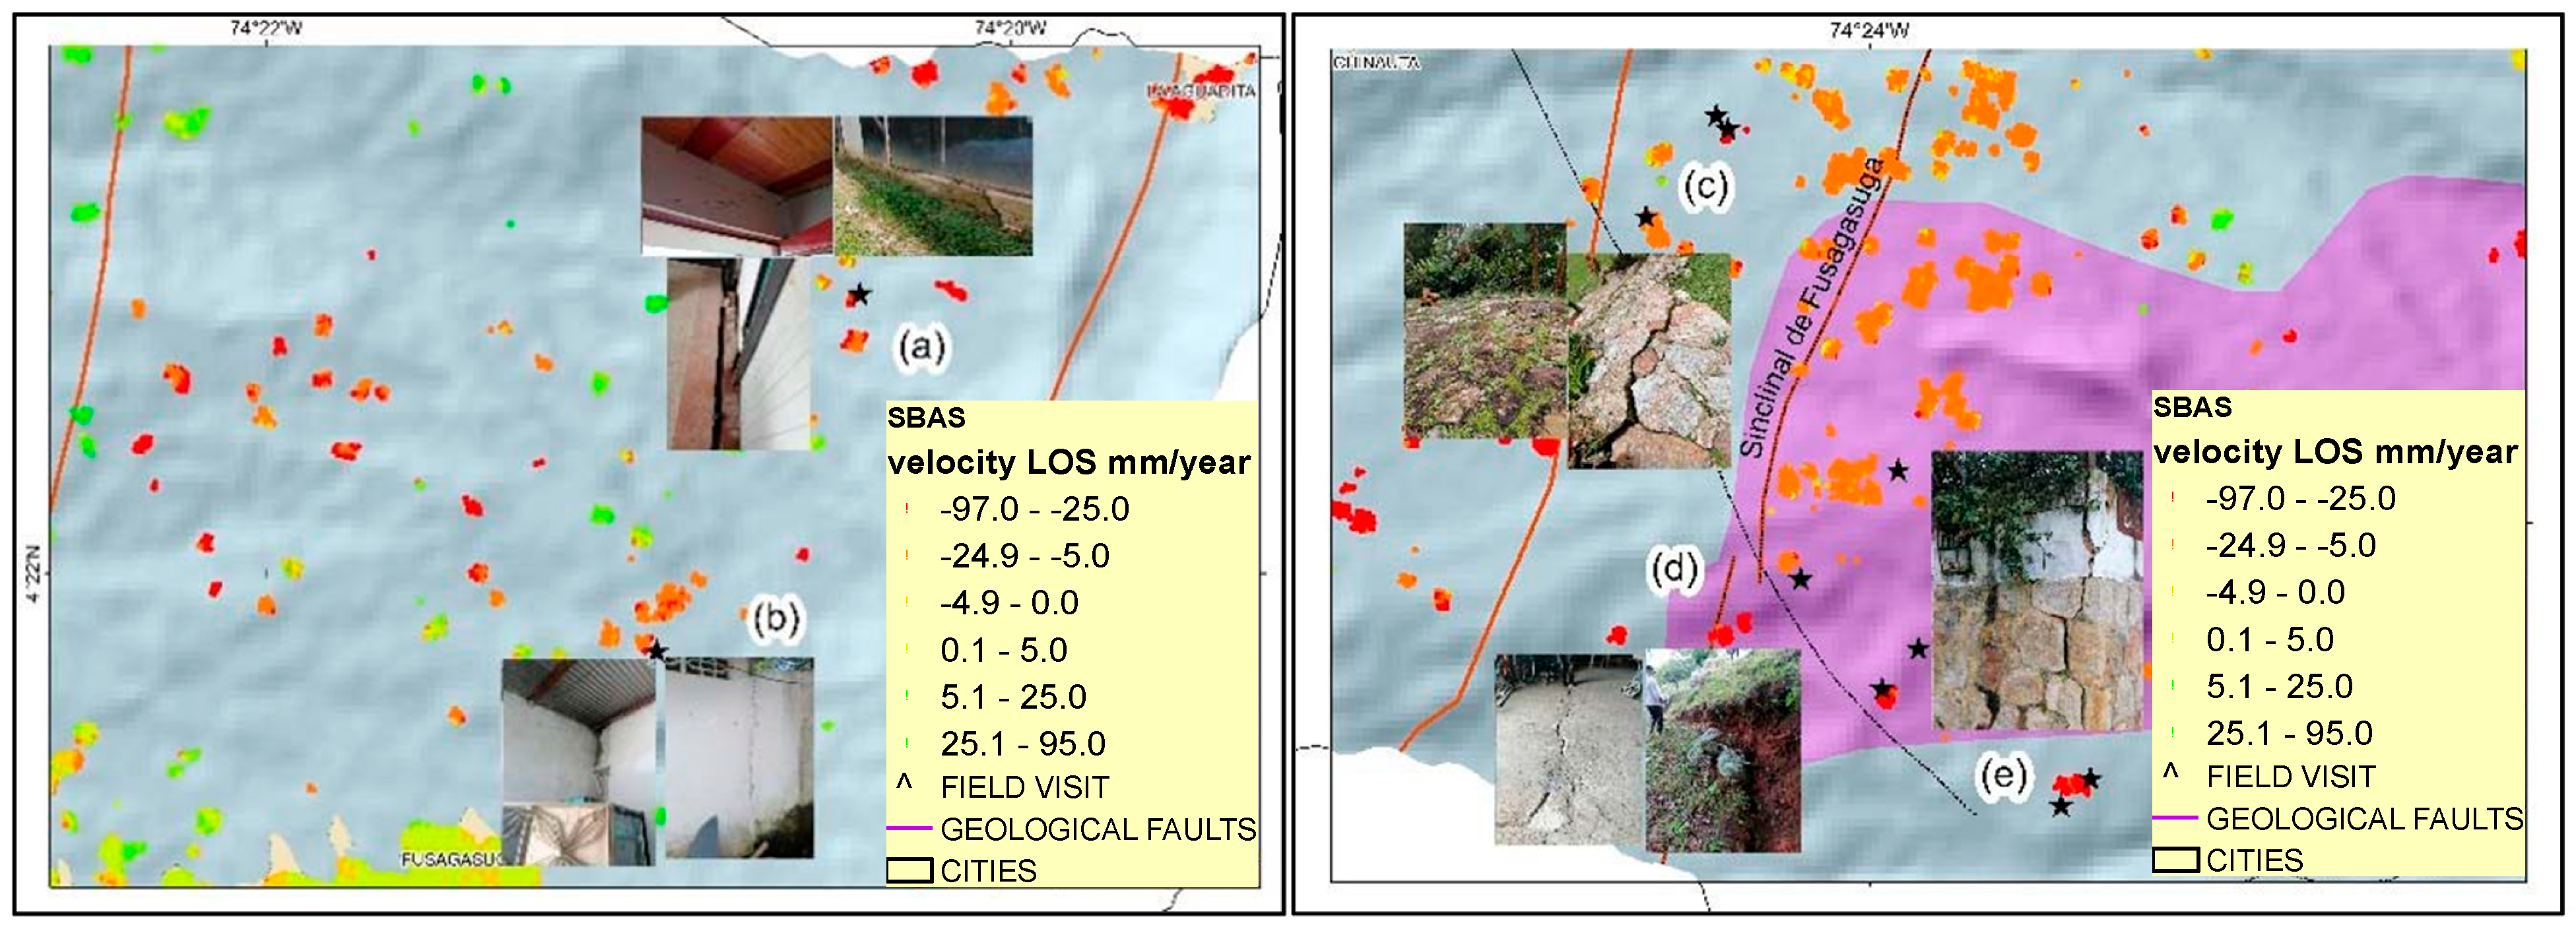
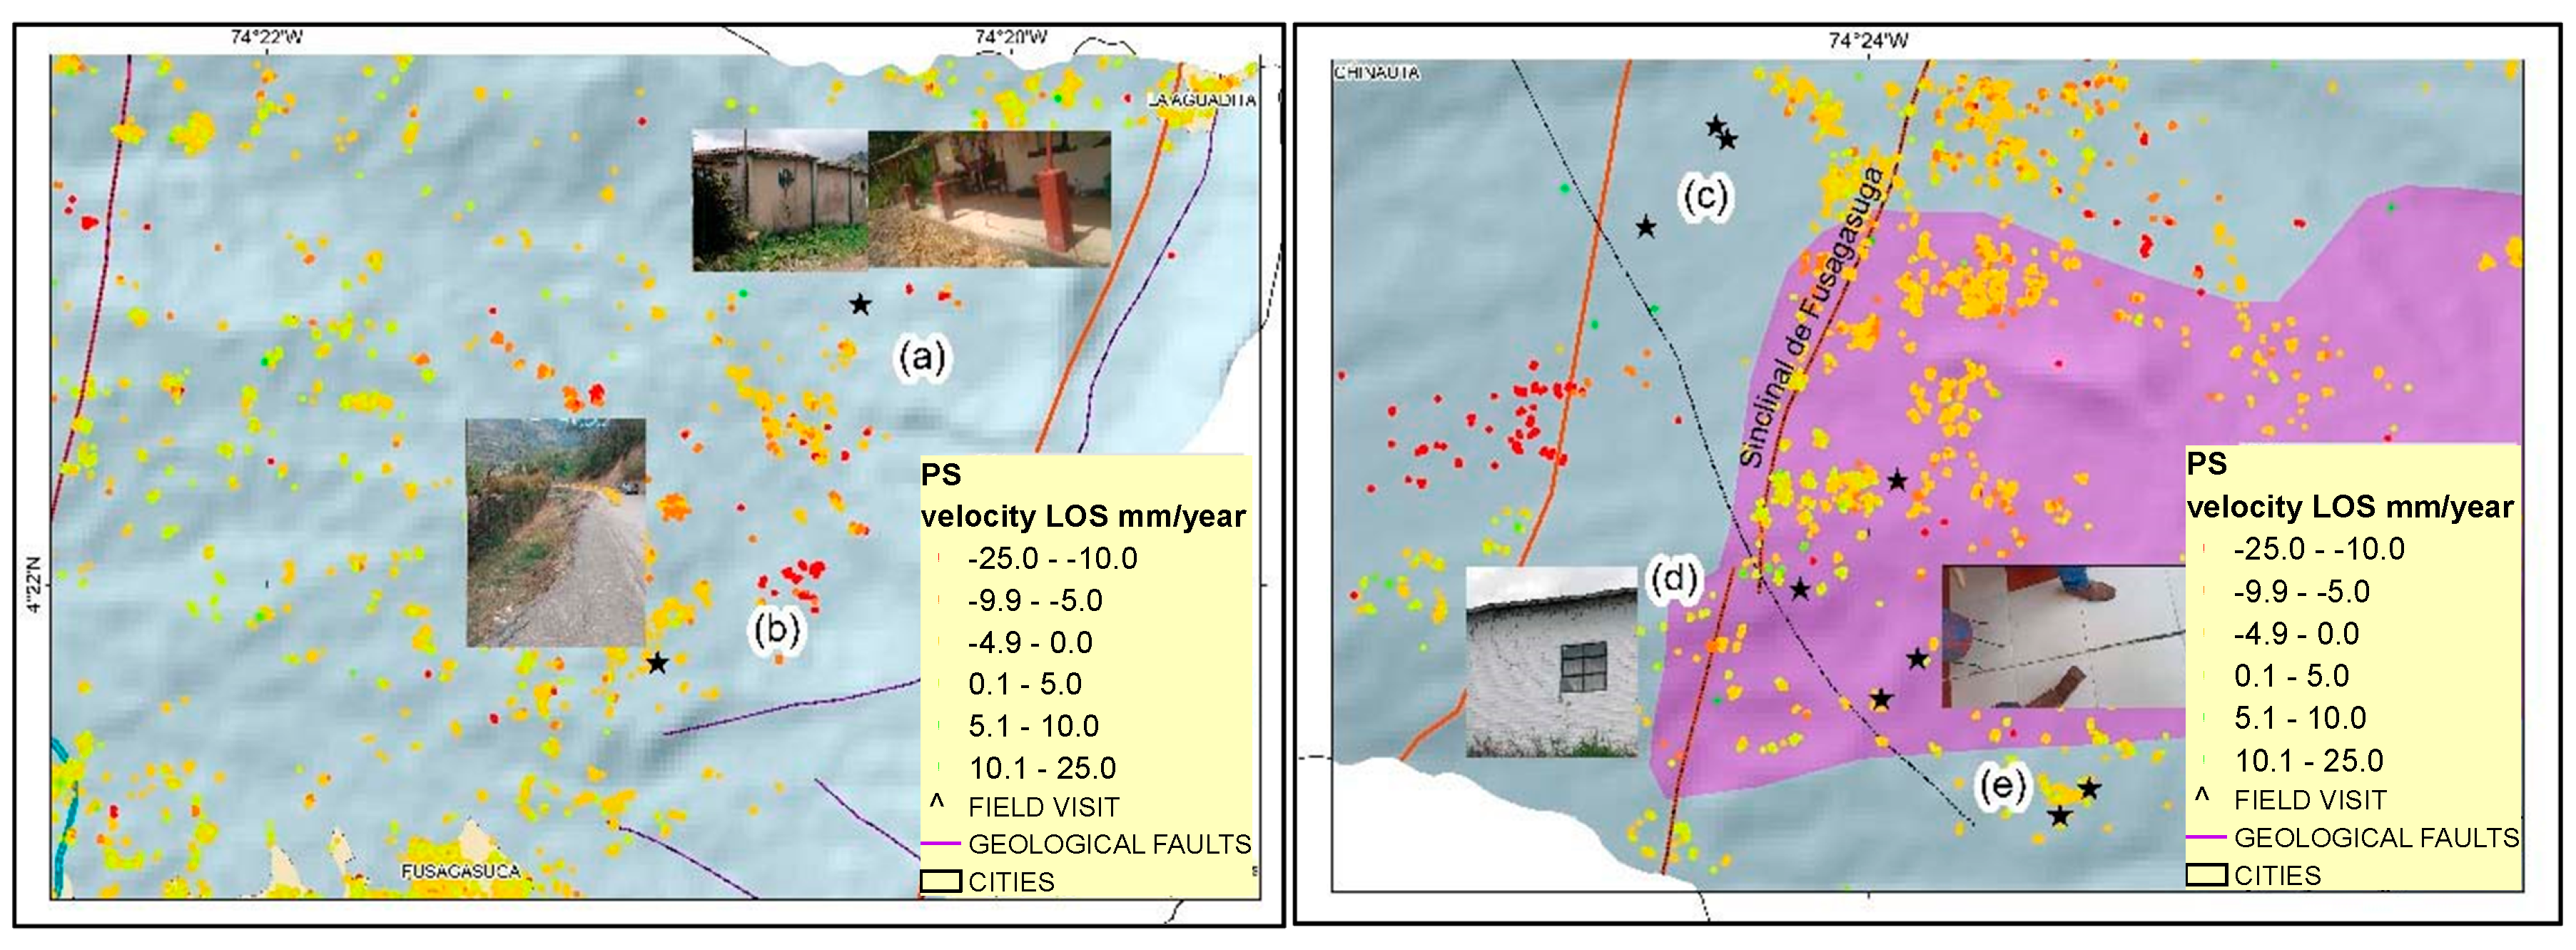
In the present investigation, satellite images taken from the Synthetic Aperture Radar of the Copernicus Sentinel-1 program with a wavelength of 5.6 cm in a Single Look Complex (SLC) format were used.
In this study, 20 SAR images were downloaded from the Alaska Satellite Facility (ASF) geoportal between 30 January 2020 and 19 April 2022 in descending orbit and processed with the Small Base Line technique (SBAS) [26], which allows for the calculation of the phase difference by means of distributed scatterers; that is, those elements that do not have a high intensity in backscattering but are statistically stable. On the other hand, 21 descending-orbit SAR images were used between 6 January 2020 and 14 December 2021, applying the persistent scatterers (PSs) technique [27]; this technique is widely used to carry out deformation analysis with elements that maintain their intensity value over time, such as buildings, exposed soil, civil works, among others. Both techniques were processed with vertical–vertical (VV) polarization. Interferometric processing was implemented with the ENVI SarScape licensed software, which offers a high capacity for calculating strain series and advanced DINSAR analyses [2,28,29].
Using the SBAS technique, Figure 2a shows the connection graph between SAR images, with which 58 interferograms were generated, and Figure 2b shows the connection graph of interferometric processing with the scatterer technique. PS permanent images and 20 interferograms were generated, taking the shot dated 1 November 2020 as the master image.

3. Results

Figure 3 was derived from the development of the present research, where it shows the result of applying differential interferometry with the Small Base Line technique, which allowed for the identification of five zones (a), (b), (c), (d) and (e), with active deformation that had not been mapped by the municipal administration in the monitoring processes due to affectations associated with mass removal processes.
As evidenced in Figure 3, the zones present deformations with severe LOS (Line of Sight) velocities, with maximum values of 96 mm/year. This is evident in the visiting areas and is ratified in the interferometric processes. Other areas that reach the same displacement speed are observed; however, to date, these have not been visited by researchers. As a result, when applying the permanent disperser (PS) technique, some areas identified through the use of the previous technique were corroborated. It should be noted that the area has rural characteristics; therefore, this technique was able to evaluate the deformation only with geographical elements, such as construction works, civil works, and roads, among others that were in the study area.
Figure 4 shows the distribution of permanent spreaders, resulting in LOS velocities between 10 and 25 mm/year, especially in zone (b), where the main road and some commercial buildings are located. In zones (d) and (e), when carrying out the field visit, effects were evidenced in the houses of the residents, especially in walls and floors, realizing the severity of the deformation and instability of the sector. In zone (c), the technique does not offer more information concerning deformation due to the fact that its context relates to crop fields and some open-air resting farms.
The decomposition of the LOS velocities in the up–down and east–west component was carried out when applying Equations (1) and (2) and using only the descending orbit with the two SBAS and PS techniques. According to [30], the results can be seen in Table 1.
d i s p l a c e m e n t u p d o w n = L O S   D i s p l a c e m e n t c o s   θ
d i s p l a c e m e n t e a s t w e s t = L O S   D i s p l a c e m e n t s i n   θ
where LOS Offset is the offset in the line of sight of the satellite, and yθ is the angle of incidence of the SAR image. Permanent scatterers and distributed scatters were taken in a range between 300 and 500 m in a circular fashion in each study area to quantify the average displacements. Table 1 shows the values of magnitude obtained.
Observing Table 1, the area that presents the greatest deformation is (d) when using the SBAS technique, with about 22 centimeters of subsidence from the observation of the first scene to the last image captured and approximately 12 centimeters of displacement towards the west. Zones (c) and (e) present displacement in terms of subsidence and, to a lesser extent, displacements to the west when using this same technique. With the PS technique, zone (b) presents high magnitudes of around 3 centimeters in the range of dates studied. Additionally, the subsidence movements and displacements to the west are ratified with the PS technique when using different magnitudes.
A geovisor was developed from the research data, the mapping of the deformations and the different field visits, which were carried out with the municipal administration in order to corroborate the data obtained with the application of advanced interferometric techniques; the reader can consult the results of the geovisor via the following link DINSAR-FUSAGASUGÁ, https://unicundi.maps.arcgis.com/apps/dashboards/6ac30bd772234c9986a9b4d03459d9a7 (accessed on 6 October 2022)

4. Discussion

It is possible to appreciate the identification of the active zones due to processes of instability and superficial deformation in the municipality of Fusagasugá. Within the methods proposed in this study, it is observed that the SBAS methodology identifies the active zones caused by deformation processes much better due to the context of the study area. However, additional investigations could be carried out using other techniques, such as SQUEESAR [27]. It can also be concluded that the identification of deformation zones is correlated to some extent with hydrometeorological processes. The foregoing can be seen in Figure 5 when the deformation magnitudes are high and precipitation has relative maximums, especially in zones (a) and (b) in the first rainy period of 2021.
Likewise, it can be inferred that the deformation of zones (c), (d) and (e) could be caused by the norm fault that crosses the study zone, evidencing the fact that the fault is active in the zone. The contribution of this research to the monitoring and risk reduction processes due to processes of surface instability and mass removal in the municipality of Fusagasugá are of great importance in terms of mitigating and reducing the impact of landslides. With the above information, it was possible to map and update the data of the municipality of Fusagasugá in order to include them in the monitoring processes at the regional level.

Author Contributions

Conceptualization, E.F.Á., B.R.B. and G.E.A.; methodology, E.F.Á. and B.R.B.; software, G.E.A.; validation, E.F.Á. and B.R.B.; formal analysis, E.F.Á.; investigation, E.F.Á., B.R.B. and G.E.A.; writing—original draft preparation, E.F.Á., B.R.B. and G.E.A.; writing—review and editing, E.F.Á., B.R.B. and G.E.A.; project administration, E.F.Á. All authors have read and agreed to the published version of the manuscript.

Funding

This research was funded by the University of Cundinamarca Fusagasuga Colombia.

Institutional Review Board Statement

Not applicable.

Informed Consent Statement

Not applicable.

Data Availability Statement

The data derived from this research can be consulted in the following link https://unicundi.maps.arcgis.com/apps/dashboards/6ac30bd772234c9986a9b4d03459d9a7 (accessed on 6 October 2022).

Acknowledgments

The authors thank the University of Cundinamarca for the software and hardware resources used during the development of the project.

Conflicts of Interest

The authors declare no conflicts of interest.

References

  1. Bryant, E. Natural Hazards; Cambridge University Press: Cambridge, UK, 1991. [Google Scholar]
  2. Sahraoui, O.H.; Hassaine, B.; Serief, C. Radar Interferometry with Sarscape Software. 2006, pp. 1–10. Available online: https://fig.net/resources/proceedings/fig_proceedings/fig2006/papers/ps05_08/ps05_08_03_sahraoui_0222.pdf (accessed on 2 February 2022).
  3. Schuster, R.L.; Highland, L.M. Socioeconomic and Environmental Impacts of Landslides in the Western Hemisphere; Open-File Report 2001-276; U.S. Geological Survey: Denver, CO, USA, 2001.
  4. Haque, U.; da Silva, P.F.; Devoli, G.; Pilz, J.; Zhao, B.; Khaloua, A.; Wilopo, W.; Andersen, P.; Lu, P.; Lee, J.; et al. The human cost of global warming: Deadly landslides and their triggers (1995–2014). Sci. Total. Environ. 2019, 682, 673–684. [Google Scholar] [CrossRef] [PubMed]
  5. Froude, M.J.; Petley, D.N. Global fatal landslide occurrence from 2004 to 2016. Nat. Hazards Earth Syst. Sci. 2018, 18, 2161–2181. [Google Scholar] [CrossRef]
  6. Vandromme, R.; Thiery, Y.; Bernardie, S.; Sedan, O. ALICE (Assessment of Landslides Induced by Climatic Events): A single tool to integrate shallow and deep landslides for susceptibility and hazard assessment. Geomorphology 2020, 367, 107307. [Google Scholar] [CrossRef]
  7. Dai, F.; Lee, C.; Ngai, Y. Landslide risk assessment and management: An overview. Eng. Geol. 2002, 64, 65–87. [Google Scholar] [CrossRef]
  8. Zêzere, J.L.; Trigo, R.M.; Trigo, I.F. Shallow and deep landslides induced by rainfall in the Lisbon region (Portugal): Assessment of relationships with the North Atlantic Oscillation. Nat. Hazards Earth Syst. Sci. 2005, 5, 331–344. [Google Scholar] [CrossRef]
  9. Dikshit, A.; Sarkar, R.; Pradhan, B.; Segoni, S.; Alamri, A.M. Rainfall Induced Landslide Studies in Indian Himalayan Region: A Critical Review. Appl. Sci. 2020, 10, 2466. [Google Scholar] [CrossRef]
  10. Ma, F.; Sui, L. Investigation on Mining Subsidence Based on Sentinel-1A Data by SBAS-InSAR technology—Case Study of Ningdong Coalfield, China. Earth Sci. Res. J. 2020, 24, 373–386. [Google Scholar] [CrossRef]
  11. Mirus, B.B.; Jones, E.S.; Baum, R.L.; Godt, J.W.; Slaughter, S.; Crawford, M.M.; Lancaster, J.; Stanley, T.; Kirschbaum, D.B.; Burns, W.J.; et al. Landslides across the USA: Occurrence, susceptibility, and data limitations. Landslides 2020, 17, 2271–2285. [Google Scholar] [CrossRef]
  12. Grima, N.; Edwards, D.; Edwards, F.; Petley, D.; Fisher, B. Landslides in the Andes: Forests can provide cost-effective landslide regulation services. Sci. Total Environ. 2020, 745, 141128. [Google Scholar] [CrossRef]
  13. Meng, Q.; Xu, Q.; Wang, B.; Li, W.; Peng, Y.; Peng, D.; Qi, X.; Zhou, D. Monitoring the regional deformation of loess landslides on the Heifangtai terrace using the Sentinel-1 time series interferometry technique. Nat. Hazards 2019, 98, 485–505. [Google Scholar] [CrossRef]
  14. Rateb, A.; Abotalib, A.Z. Inferencing the land subsidence in the Nile Delta using Sentinel-1 satellites and GPS between 2015 and 2019. Sci. Total Environ. 2020, 729, 138868. [Google Scholar] [CrossRef]
  15. Awasthi, S.; Jain, K.; Bhattacharjee, S.; Gupta, V.; Varade, D.; Singh, H.; Narayan, A.B.; Budillon, A. Analyzing urbanization induced groundwater stress and land deformation using time-series Sentinel-1 datasets applying PSInSAR approach. Sci. Total Environ. 2022, 844, 157103. [Google Scholar] [CrossRef] [PubMed]
  16. Budillon, A.; Crosetto, M.; Monserrat, O. Editorial for the Special Issue “Urban Deformation Monitoring using Persistent Scatterer Interferometry and SAR Tomography”. Remote Sens. 2019, 11, 1306. [Google Scholar] [CrossRef]
  17. Monika; Govil, H.; Chatterjee, R.; Bhaumik, P.; Vishwakarma, N. Deformation monitoring of Surakachhar underground coal mines of Korba, India using SAR interferometry. Adv. Space Res. 2022, 70, 3905–3916. [Google Scholar] [CrossRef]
  18. Chung, C.-J.F.; Fabbri, A.G. Probabilistic Prediction Models for Landslide Hazard Mapping. Photogramm. Eng. Remote Sens. 1999, 65, 1389–1399. [Google Scholar]
  19. Hu, L.; Dai, K.; Xing, C.; Li, Z.; Tomás, R.; Clark, B.; Shi, X.; Chen, M.; Zhang, R.; Qiu, Q.; et al. Land subsidence in Beijing and its relationship with geological faults revealed by Sentinel-1 InSAR observations. Int. J. Appl. Earth Obs. Geoinform. 2019, 82, 101886. [Google Scholar] [CrossRef]
  20. Colesanti, C.; Ferretti, A.; Prati, C.; Rocca, F. Monitoring landslides and tectonic motions with the Permanent Scatterers Technique. Eng. Geol. 2003, 68, 3–14. [Google Scholar] [CrossRef]
  21. Fernández, J.; Escayo, J.; Camacho, A.G.; Palano, M.; Prieto, J.F.; Hu, Z.; Samsonov, S.V.; Tiampo, K.F.; Ancochea, E. Shallow magmatic intrusion evolution below La Palma before and during the 2021 eruption. Sci. Rep. 2022, 12, 20257. [Google Scholar] [CrossRef]
  22. El Kamali, M.; Abuelgasim, A.; Papoutsis, I.; Loupasakis, C.; Kontoes, C. A reasoned bibliography on SAR interferometry applications and outlook on big interferometric data processing. Remote. Sens. Appl. Soc. Environ. 2020, 19, 100358. [Google Scholar] [CrossRef]
  23. Dávila-Hernández, N.A.; Madrigal-Uribe, D. Aplicación de interferometría radar en el estudio de subsidencias en el Valle de Toluca, México. Cienc. Espaç. 2015, 8, 294–309. [Google Scholar] [CrossRef]
  24. Mora-Páez, H.; Díaz-Mila, F.; Cardona, L. Mapping land subsidence in Bogotá, Colombia, using the interferometric synthetic aperture radar (InSAR) technique with TerraSAR-X images. In The Geology of Colombia; Qua-ternary, Volume 4 Quaternary; Gómez, J., Pinilla–Pachon, A.O., Eds.; Servicio Geológico Colombiano: Bogotá, Colombia, 2020; pp. 515–548. [Google Scholar] [CrossRef]
  25. Estudio Semidetallado de Suelos de Fusagasugá. Bogota. 2010. Available online: https://www.academia.edu/28243073/ESTUDIO_SEMIDETALLADO_DE_SUELOS_DE_FUSAGASUGA_29_06_10_pdf (accessed on 19 March 2023).
  26. Berardino, P.; Fornaro, G.; Lanari, R.; Sansosti, E. A new algorithm for surface deformation monitoring based on small baseline differential SAR interferograms. IEEE Trans. Geosci. Remote Sens. 2002, 40, 2375–2383. [Google Scholar] [CrossRef]
  27. Ferretti, A.; Prati, C.; Rocca, F. Permanent Scatterers in SAR Interferometry. IEEE Trans. Geosci. Remote Sens. 2001, 39, 8–20. [Google Scholar] [CrossRef]
  28. Smolianinova, E.; Schmidt Institute of Physics of the Earth RAS; Kiseleva, E.; Mikhailov, V. Sentinel-1 InSAR for investigation of active deformation areas: Case study of the coastal region of the Big Sochi. Curr. Probl. Remote Sens. Earth Space 2019, 16, 147–155. [Google Scholar] [CrossRef]
  29. Haris, N.A. Prediksi Penurunan Muka Tanah Menggunakan Teknik Differential Interferometic Synthetic Aperture Radar (Dinsar) Di Kota Makassar Indonesia. J. Environ. Sci. 2018, 1. [Google Scholar] [CrossRef]
  30. Tzouvaras, M.; Danezis, C.; Hadjimitsis, D.G. Differential SAR Interferometry Using Sentinel-1 Imagery-Limitations in Monitoring Fast Moving Landslides: The Case Study of Cyprus. Geosciences 2020, 10, 236. [Google Scholar] [CrossRef]
Figure 1. General location of the study area. The different geological faults that cross the municipality are observed, especially the Fusagasugá syncline and the Silvania fault. In the municipality, erosional-type mountain soils predominate, and to the south, there are glacio–volcanic-type soils.
Environsciproc 28 00019 g001
Figure 2. SAR image pair connections graph, (a) Small Base Line method, 58 interferograms were generated by analyzing distributed scatterers. (b) Graphic of permanent distributors’ technical connection, specific for urban centers and civil infrastructure. Interferometric processing was performed with ENVI Sarscape software. Source: The data belongs to the authors.
Environsciproc 28 00019 g002
Figure 3. Instability and surface deformation processes are evident in the municipality of Fusagasugá. The areas of (a) Bermejal village present deformations that affect civil works and constructions in the sector and (b) Jordán Sector, mainly affecting the road that connects the city of Fusagasugá and the capital Bogotá and some civil works in rural areas. (c), (d), and (e) correspond to Espinalito, El Placer, Guayabal, and Bochica villages, in which active deformations occur that severely affect agricultural areas, civil infrastructure, and communication routes. Source: The data belongs to the authors.
Environsciproc 28 00019 g003
Figure 4. When applying the persistent scatterers (PS) interferometric technique, it was observed that the visited areas were affected due to deformation processes. It was also observed on the left side of the lower image that a high deformation zone intersects with a reverse-type geological fault, with values of LOS displacement velocities between 10 and 25 mm/year. Source: The data belongs to the authors.
Environsciproc 28 00019 g004
Figure 5. Graph where the magnitude of the LOS displacement is related, as obtained via the SBAS methodology of the five study areas, compared with the monthly precipitation meteorological data for the years 2020, 2021, and 2022, obtained from the meteorological station “El Pinar”, located in the study area.
Environsciproc 28 00019 g005
Table 1. Calculation of the average up–down (column 4) and east–west (column 5) displacement components when using Equations (1) and (2). The displacements of the two techniques, SBAS and PS, are compared. In zone (c), permanent dispersants were not obtained; therefore, the calculation of the deformation could not be carried out. Since the components were calculated with a descending orbit, the negative sign indicates that the area moves away from the satellite; therefore, they are movements downwards and towards the west. The north–south component is not calculated due to the geometry of the SAR image.
SBAS TechniquePS Technique
ZoneLOS
(mm)
Ang.
Incident
u-d (mm) e-w (mm)LOS
(mm)
Ang.
Incident
u-d (mm)e-w (mm)
(a)−60.438.4717−20.6−21.2−6.438.4788−9−9.1
(b)−56.838.4863−80.4−80.1−21.938.484−30.9−30.9
(c)−42.238.8217−97.3−46.8NANANANA
(d)−102.938.7789−218.2−116.6−5.238.7844−11.1−5.8
(e)−77.438.6752−138.1−93.44−4.638.678−8.2−5.5
Disclaimer/Publisher’s Note: The statements, opinions and data contained in all publications are solely those of the individual author(s) and contributor(s) and not of MDPI and/or the editor(s). MDPI and/or the editor(s) disclaim responsibility for any injury to people or property resulting from any ideas, methods, instructions or products referred to in the content.

