1. Introduction
The ASKOS experiment [
1] is the ground-based component of the Joint Aeolus Tropical Atlantic Campaign (JATAC) and was carried out at Cabo Verde during the summers and autumns of 2021 and 2022. The primary aim of ASKOS was the collection of a novel dataset of synergistic measurements in the region, to address a wide range of scientific objectives, including the processes affecting dessert dust transport and the effect of dust on boundary layer dynamics. Within ASKOS, a full ACTRIS (Aerosol Cloud and Trace Gasses Research Infrastructure) aerosol and cloud remote sensing station was established at Cabo Verde, Mindelo city (16.87° N, 24.99° W) on the island of São Vicente, where intense ground-based remote-sensing and UAV-based airborne in situ measurements were conducted.
The purpose of this study is to map the Planetary Boundary Layer (PBL) [
2] at the São Vicente island of Cabo Verde and investigate the capabilities of the models to accurately retrieve the PBL height of this coastal site. Additionally, we will investigate PBL height characteristics in the ASKOS dataset under different dust load conditions. The experimental site is a tropical area far away from the western coast of the African continent and is affected by Saharan dust and marine aerosols. These conditions shape an advantageous field for investigating the effect of aerosol presence on PBL evolution, with high-quality atmospheric observations. Furthermore, very shallow PBL heights can occur at coastal locations [
3]. The continuous monitoring of the boundary-layer top with active remote sensing has been verified in past studies using several methods [
4,
5,
6,
7,
8]. Studying PBL using lidars can suffer from many restrictions related to weather conditions, range, and accuracy, but it can also provide high temporal and spatial resolution.
The manuscript is structured in three sections.
Section 2 describes the data and the methodology in detail.
Section 3 presents two case studies analyzed in detail, one with a thick dust layer present on the lower troposphere and one with relatively less dust load. A statistical analysis for a short time period is also performed, in order to depict the difference between the two cases. In
Section 4, the main conclusions are summarized.
2. Data and Methodology
In this study, we used measurements from the September 2022 ASKOS operations. More specifically, collocated PollyXT Raman Lidar [
9] and Halo Wind Doppler Lidar [
10] profiles were used to derive the diurnal PBL height. Radiosonde profiles were also analyzed to provide the dynamic structure of the lower troposphere and, furthermore, evaluate the remote sensing measurements. Additionally, the observed results were then compared to the ERA5 Re-Analysis dataset from the European Centre for Medium-Range Weather Forecasts (ECMWF) [
11], at a 0.25° × 0.25° resolution with 137 levels [
12].
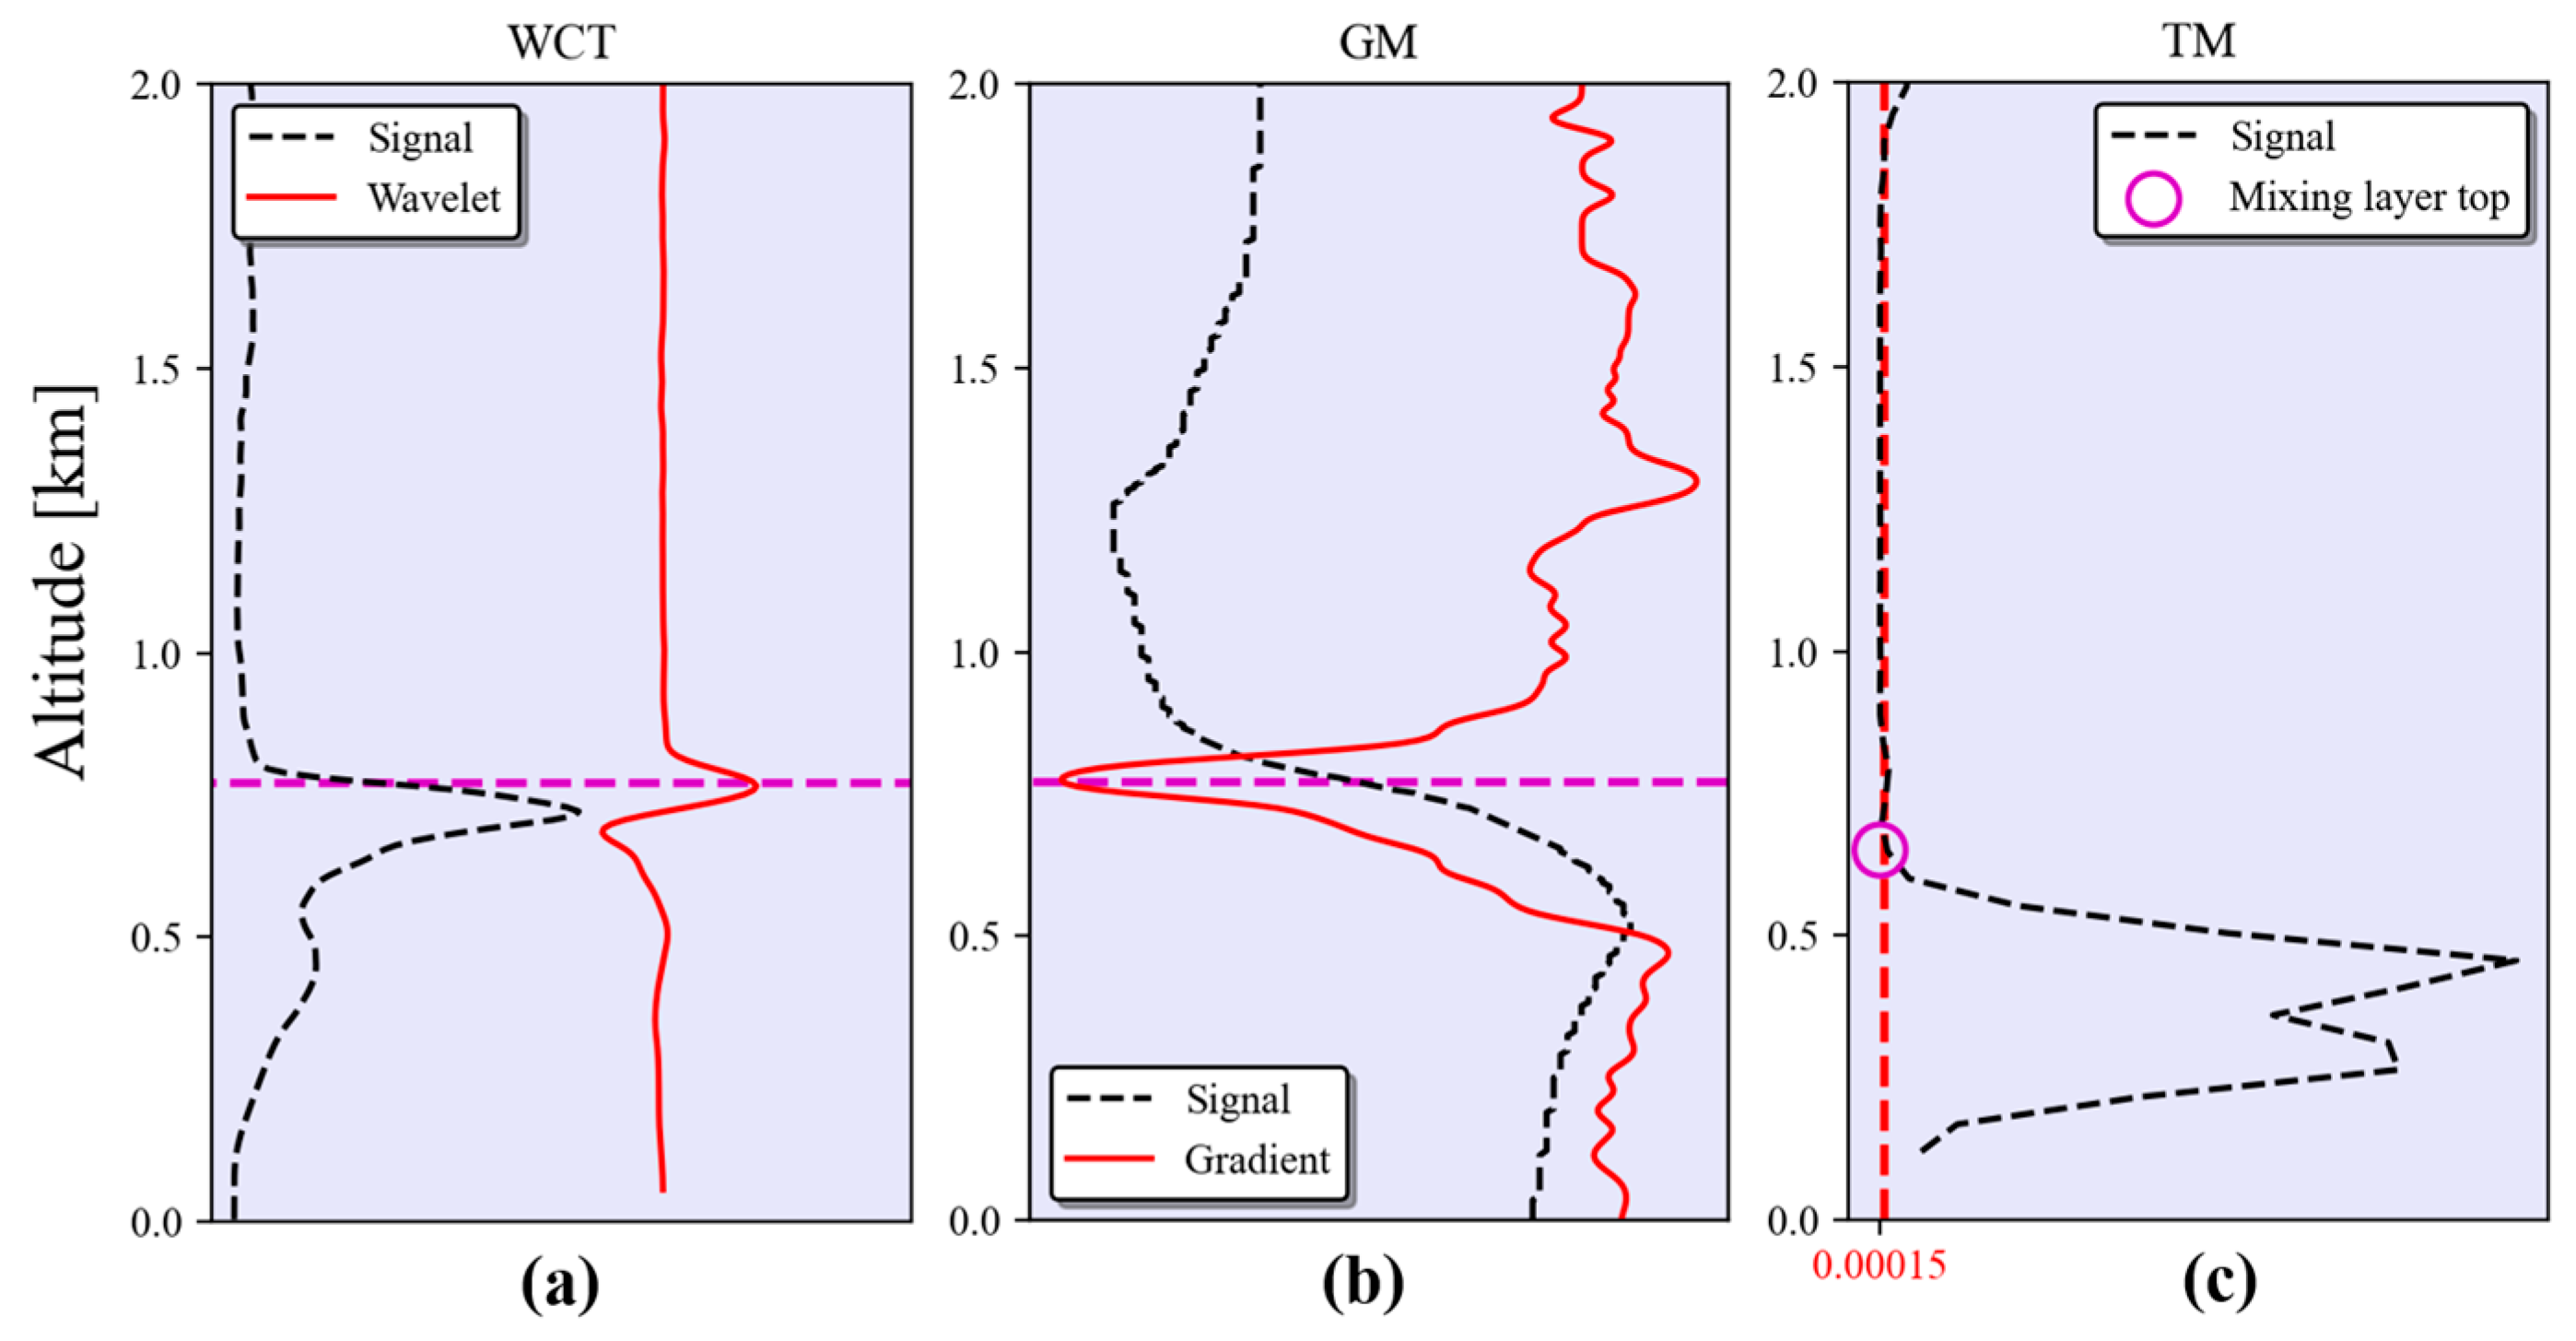
The methodologies used to identify the PBL top are depicted in
Figure 1: Wavelet Covariance Transform (WCT) [
13]; Gradient Method (GM) [
14]; and Threshold Method (TM) [
3].
The WCT method is applied on the 30 min averaged Water Vapor Mixing Ratio (WVMR) product of the PollyXT Lidar and on the attenuated backscatter coefficient (BSC) of both the PollyXT and Halo Wind Lidar [
4]. The TM is applied on the 1 h averaged Turbulent Kinetic Energy dissipation rate (TKE) product of the Halo Lidar with the threshold value of 0.00015 m
2 s
−3 [
3], and the GM is applied to potential temperature and relative humidity radiosonde profiles in order to acquire the PBL top [
14].
3. Results
Two cases with different dynamic characteristics and aerosol loads are presented in detail: 12 and 23 September.
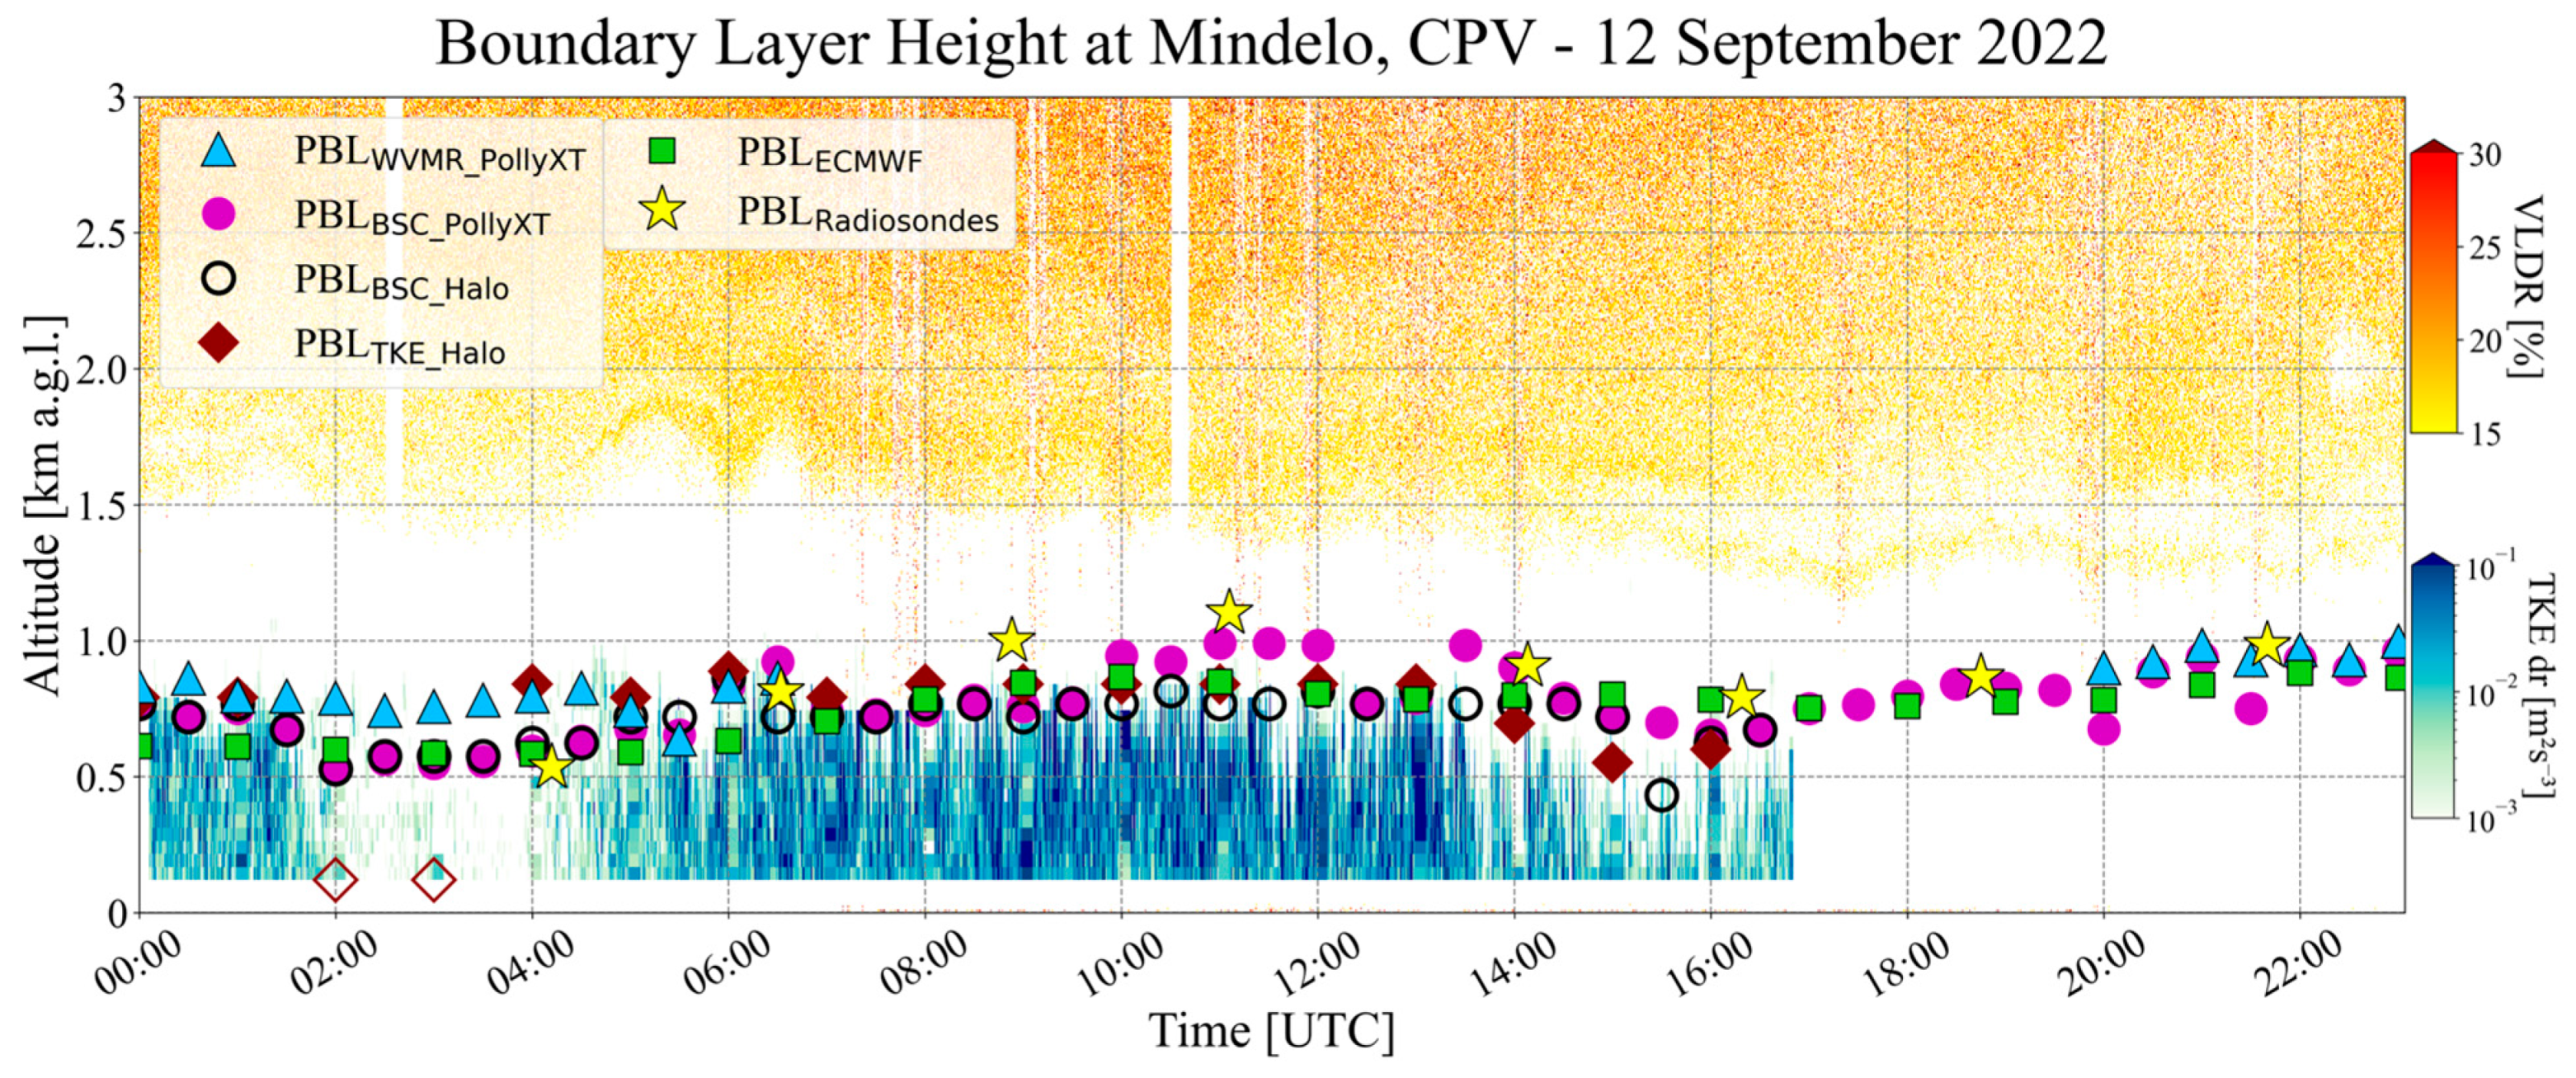
3.1. Case Study: 12 September 2022—Light Dust Load
On 12 September 2022, an elevated dust layer was present above approximately 1.5 km, with an Aerosol Optical Depth (AOD) of 0.45 at 500 nm (
Appendix A). This aerosol condition represents a common day in Mindelo.
In
Figure 2, all the retrievals of that case are cumulatively depicted. Orange shading represents the dust layer, and blue shading represents the turbulence. Overall, the results for PBL height show good agreement during the entire day (after 17:00 UTC Halo measurements were not available). PBL
WVMR_PollyXT is only available during 00:00–06:00 and 20:00–24:00 UTC because of the nighttime operation of the PollyXT water vapor channel. Northwestern winds dominate below 1 km (not shown), except for 2:00–4:00, when they become north winds. At this time space, TKE is dampened, and the TM method does not suggest the existence of a mixing layer, while PBL
WVMR_PollyXT seems to be overestimated compared to the other observations at the beginning of the day. On the other hand, during the daytime, a shallow PBL is observed for all methods. That limited daytime evolution is an indicative feature of coastal areas. The radiosonde launched at 10:00 captures the highest PBL top at 1.1 km. PBL
ECMWF is in good agreement with the rest of the retrievals.
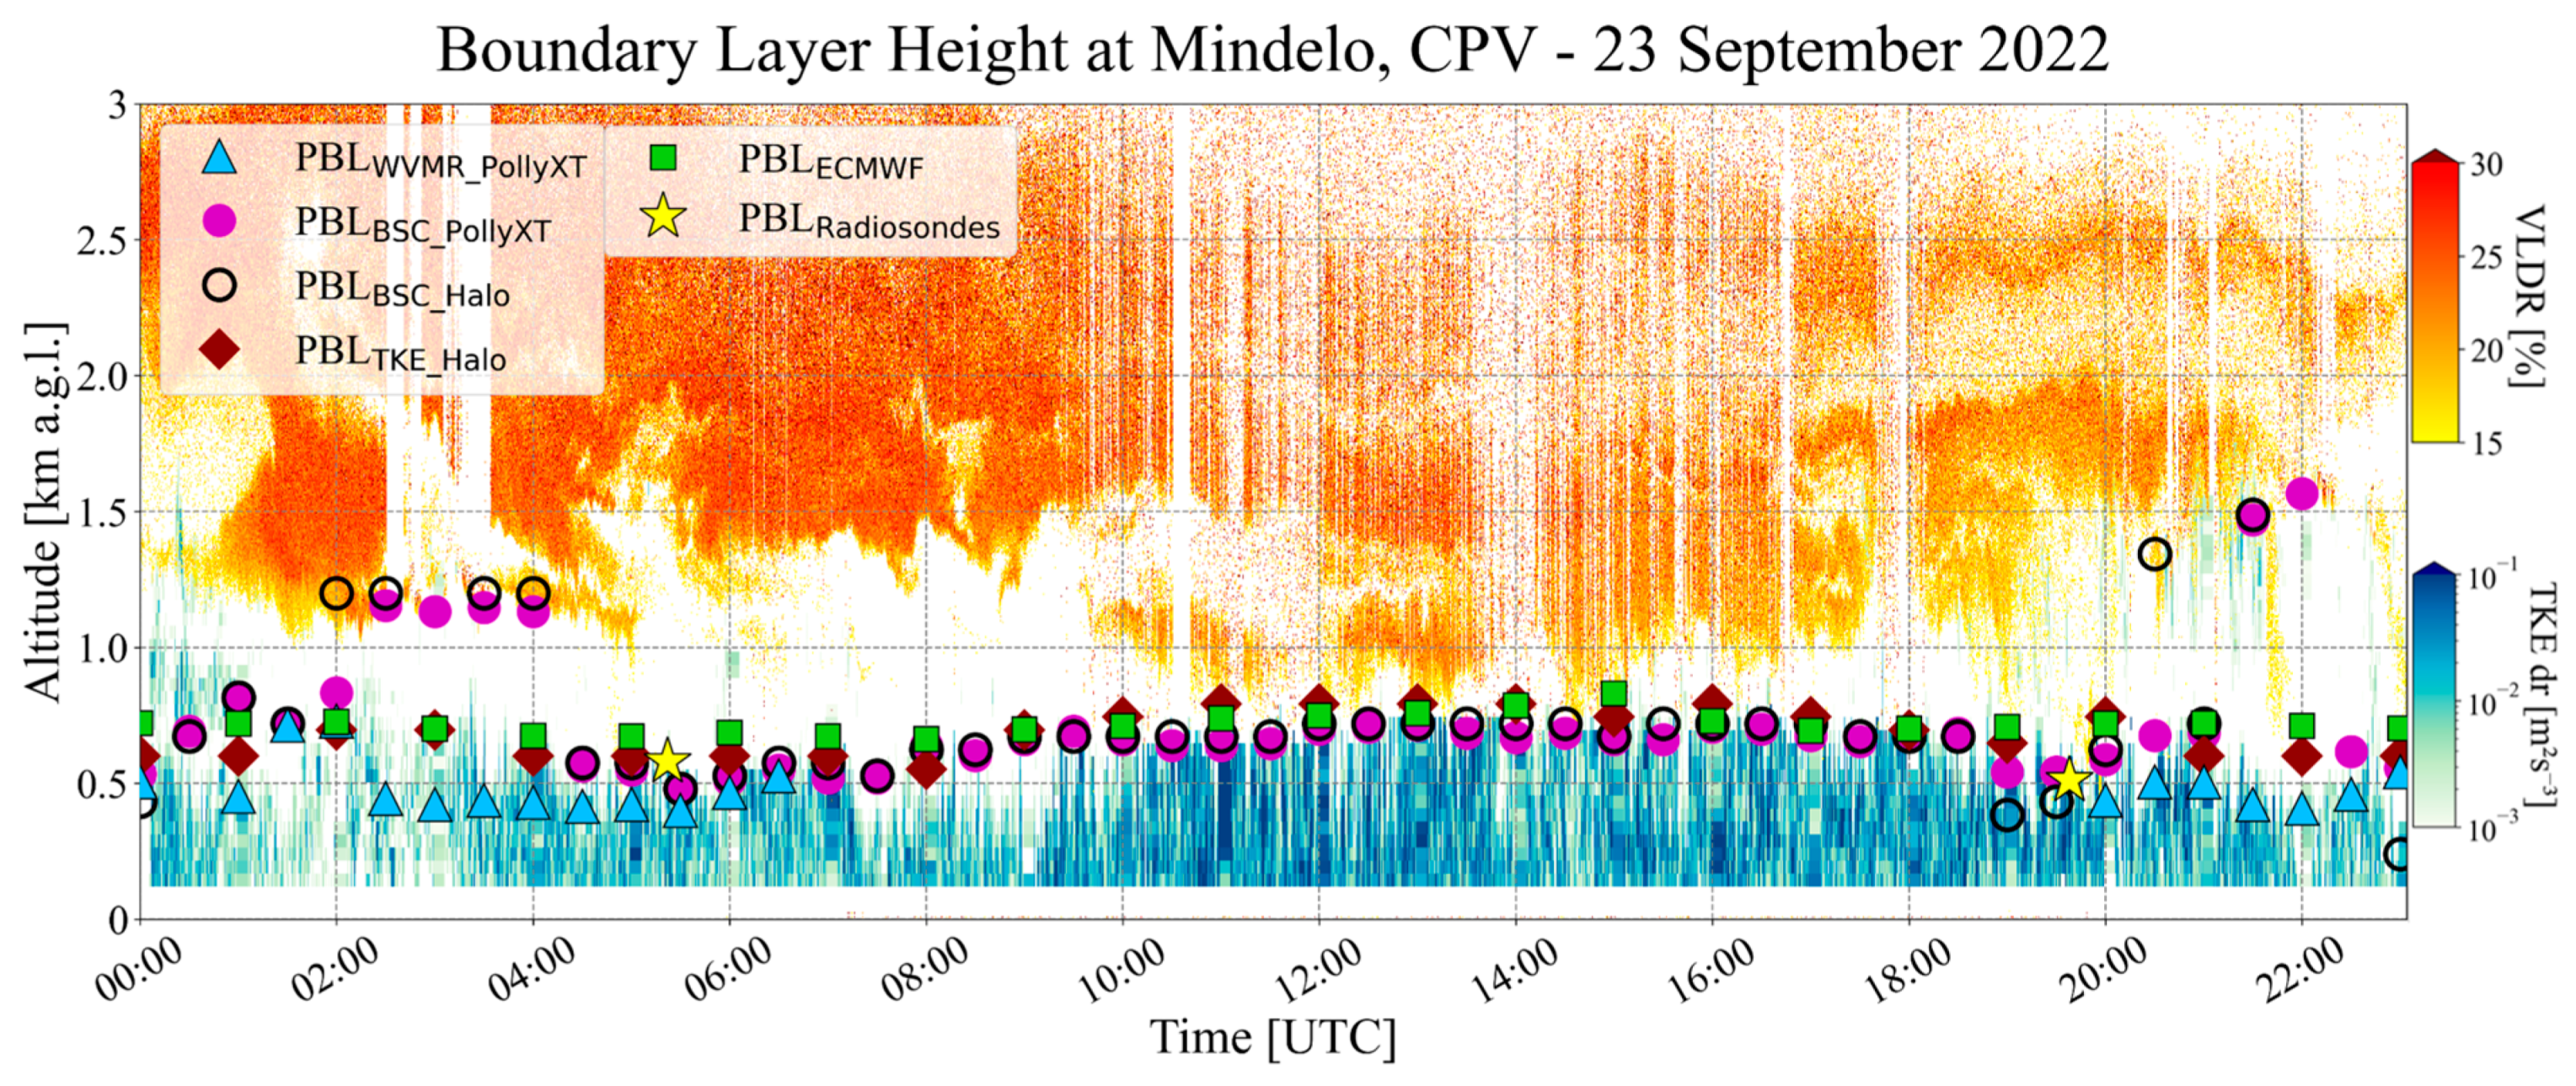
3.2. Case Study: 23 September 2022—Heavy Dust Load
On 23 September 2022, a few low-level cumulus clouds and a significant aerosol load with AOD that exceeded 0.7 at 500 nm (
Appendix A) were present. A thick dust layer penetrates at lower altitudes below 1 km, affecting the evolution of PBL. In
Figure 3, there are some alienated points above 1 km before 6:00 and after 15:00 that do not correspond to PBL values. These ‘outliers’ of PBL
BSC_PollyXT, PBL
BSC_Halo, and PBL
WVMR_PollyXT are the results of WCT, detecting elevated aerosol layers instead of the PBL top. However, the TM at TKE dissipation rate and ECMWF result in a more effective PBL representation than WCT.
As mentioned also in the previous case, no sharp daytime evolution is observed. On the contrary, lower PBL values are recorded during the convective hours, relative to 12 September. PBLECMWF is in good agreement with PBLTKE_Halo during all day and with all the results during 10:00–18:00. The radiosondes of 05:22 and 19:38 UTC capture PBL heights that are in good accordance with remote sensing (PBLBSC_PollyXT, PBLBSC_Halo, PBLWVMR_PollyXT, and PBLTKE_Halo) and model (PBLECMWF) results.
3.3. Comparison of the Two Cases
In both cases, the measured PBL presents several characteristics that resemble a Marine Atmospheric Boundary Layer (MABL): it is a relatively shallow layer with no significant variabilities on the top.
Table 1 shows the average and standard deviation of PBL
BSC_PollyXT, PBL
BSC_Halo, PBL
TKE_Halo, and PBL
ECMWF.
During the period 10:00–14:00 UTC (that corresponds to 9:00–13:00 local time), the standard deviation for both cases varies between 21.5 and 86.4 m, indicating low variability that is connected with the limited daytime evolution. The study on 23 September presented lower PBL retrievals and also smaller uncertainties, compared to 12 September during that time period. This result is a combination of the dust amount and the dust layer level. On 23 September, the layer was thick and infiltrated in lower levels (approx. 1 km), reducing the amount of solar radiation [
15] that reaches the surface and also capping the top of the PBL (
Appendix A). Moreover, the lower troposphere is less turbulent than on 12 September and is, therefore, more stable.
4. Conclusions
Our PBL results using WCT and TM are in good agreement with the PBL derived from radiosonde profiles, indicating trustworthy references for the detection of layering. BSC and WVMR are proportional to the aerosol concentration and constitute a possible indicator for PBL detection. However, when an elevated aerosol layer approaches the surface, it is likely that WCT results in big variabilities for the detection of layering, since this elevated layer is captured instead of PBL (23 September 02:00–04:00 and 20:30–22:00).
Mindelo is an area directly influenced by the continuous ocean–atmosphere exchange of heat, moisture, and momentum. Thus, the measured PBL presents MABL characteristics. No sharp daytime evolution or big vertical variabilities are observed on our relatively shallow PBL retrievals.
The presence of dust layers directly affects the formation of PBL. When a thick dust layer hovers over Mindelo (23 September), less short-wave solar radiation reaches the surface. As a result, a shallower PBL is formed, compared to a day with a lighter aerosol load (12 September).
A possible future study is to perform statistical analysis for the retrieval of PBL heights on the entire dataset of the ASKOS campaign for the years 2021 and 2022. Classification of the results according to the meteorological conditions and aerosol layers’ presence is also envisaged.
Author Contributions
Conceptualization, I.T., E.M. and V.A.; methodology, I.T., V.V. and E.M.; software, I.T.; validation, E.M., K.V. and V.V.; formal analysis, E.M., V.A., M.T. and E.G.; investigation, I.T., E.M., V.V., V.A., M.T., I.K. and E.G.; resources, V.A. and E.M.; data curation, I.T., V.V., H.B. and E.D.; writing—original draft preparation, I.T.; writing—review and editing, I.T., E.M., E.D. and V.A.; visualization, I.T., E.D., A.K. and H.B.; supervision, V.A., E.M. and E.G.; project administration, V.A. and E.M. All authors have read and agreed to the published version of the manuscript.
Funding
This research was financially supported by COST Action: CA18235 as a Short-Term Scientific Mission (STSM) with grant number E-COST-GRANT-CA18235-c9f1f673 and by the PANGEA4CalVal project (Grant Agreement 101079201) funded by the European Union
![Environsciproc 26 00023 i001]()
. The ASKOS campaign was funded by ESA’s ASKOS project and the D-TECT ERC project. Ε.Μ. acknowledges support from the Hellenic Foundation for Research and Innovation (H.F.R.I.) under the “3rd Call for H.F.R.I. Research Projects to support Post-Doctoral Researchers” (Project Acronym: REVEAL; Project Number: 07222). Parts of this research were supported by the German Federal Ministry for Economic Affairs and Energy (BMWi) (grant no. 50EE1721C). E.D. was supported by the Hellenic Foundation for Research and Innovation (H.F.R.I.) under the “2nd Call for H.F.R.I. Research Projects to support Post-Doctoral Researchers” (Project Acronym: StratoFIRE; Project number: 3995).
Data Availability Statement
Acknowledgments
The authors would like to acknowledge ACTRIS [
16] for the data collection, calibration, processing, and dissemination.
Conflicts of Interest
The authors declare no conflict of interest.
Appendix A
The Level 1 AOD data obtained with a CIMEL Sunphotometer indicate higher AOD on 23 September 2022, especially during the afternoon, compared to 12 September 2022 (
Figure A1).
Figure A1.
Aerosol Optical Depth measured with CIMEL Sunphotometer for 12 and 23 September 2022.
Figure A1.
Aerosol Optical Depth measured with CIMEL Sunphotometer for 12 and 23 September 2022.
AOD measurements for 23 September 08:00–16:00 UTC are not available, but taking into consideration the VLDR from PollyXT, one could say that it was a day with a heavy aerosol load.
In
Figure A2, the global horizontal irradiance of shortwave radiation is presented. The overall solar radiation that reached the surface on 12 September was more relative to 23 September.
Figure A2.
Global horizontal irradiance of shortwave radiation measured with a pyranometer for 12 September 2022 (blue line) and 23 September 2022 (orange line).
Figure A2.
Global horizontal irradiance of shortwave radiation measured with a pyranometer for 12 September 2022 (blue line) and 23 September 2022 (orange line).
References
- ASKOS. Available online: https://askos.space.noa.gr/data (accessed on 22 August 2023).
- Stull, R.B. An Introduction to Boundary Layer Meteorology; Springer: Berlin/Heidelberg, Germany, 1988; pp. 2–21. [Google Scholar] [CrossRef]
- Vakkari, V.; O’Connor, E.J.; Nisantzi, A.; Mamouri, R.E.; Hadjimitsis, D.G. Low-level mixing height detection in coastal locations with a scanning Doppler lidar. Atmos. Meas. Tech. 2015, 8, 1875–1885. [Google Scholar] [CrossRef]
- Tsikoudi, I.; Marinou, E.; Vakkari, V.; Gialitaki, A.; Tsichla, M.; Amiridis, V.; Komppula, M.; Raptis, I.P.; Kampouri, A.; Daskalopoulou, V.; et al. PBL Height Retrievals at a Coastal Site Using Multi-Instrument Profiling Methods. Remote Sens. 2022, 14, 4057. [Google Scholar] [CrossRef]
- Amiridis, V.; Melas, D.; Balis, D.S.; Papayannis, A.; Founda, D.; Katragkou, E.; Giannakaki, E.; Mamouri, R.E.; Gerasopoulos, E.; Zerefos, C. Aerosol Lidar observations and model calculations of the Planetary Boundary Layer evolution over Greece, during the March 2006 Total Solar Eclipse. Atmos. Chem. Phys. 2007, 7, 6181–6189. [Google Scholar] [CrossRef]
- Tombrou, M.; Dandou, A.; Helmis, C.; Akylas, E.; Angelopoulos, G.; Flocas, H.; Assimakopoulos, V.; Soulakellis, N. Model evaluation of the atmospheric boundary layer and mixed-layer evolution. Bound. Layer Meteorol. 2007, 124, 61–79. [Google Scholar] [CrossRef]
- Baars, H.; Ansmann, A.; Engelmann, R.; Althausen, D. Continuous monitoring of the boundary-layer top with lidar. Atmos. Chem. Phys. 2008, 8, 7281–7296. [Google Scholar] [CrossRef]
- Dang, R.; Yang, Y.; Hu, X.-M.; Wang, Z.; Zhang, S. A Review of Techniques for Diagnosing the Atmospheric Boundary Layer Height (ABLH) Using Aerosol Lidar Data. Remote Sens. 2019, 11, 1590. [Google Scholar] [CrossRef]
- Engelmann, R.; Kanitz, T.; Baars, H.; Heese, B.; Althausen, D.; Skupin, A.; Wandinger, U.; Komppula, M.; Stachlewska, I.S.; Amiridis, V.; et al. The automated multiwavelength Raman polarization and water-vapor lidar PollyXT: The neXT generation. Atmos. Meas. Tech. 2016, 9, 1767–1784. [Google Scholar] [CrossRef]
- Pearson, G.; Davies, F.; Collier, C. An Analysis of the Performance of the UFAM Pulsed Doppler Lidar for Observing the Boundary Layer. J. Atmos. Ocean. Technol. 2009, 26, 240–250. [Google Scholar] [CrossRef]
- ECMWF ERA5 Information. Available online: https://www.ecmwf.int/en/forecasts/dataset/ecmwf-reanalysis-v5 (accessed on 15 August 2022).
- Vogelezang, D.H.P.; Holtslag, A.A.M. Evaluation and model impacts of alternative boundary-layer height formulations. Bound. Layer Meteorol. 1996, 81, 245–269. [Google Scholar] [CrossRef]
- Brooks, I.M. Finding Boundary Layer Top: Application of a Wavelet Covariance Transform to Lidar Backscatter Profiles. J. Atmos. Ocean. Technol. 2003, 20, 1092–1105. [Google Scholar] [CrossRef]
- Li, H.; Liu, B.; Ma, X.; Jin, S.; Ma, Y.; Zhao, Y.; Gong, W. Evaluation of retrieval methods for planetary boundary layer height based on radiosonde data. Atmos. Meas. Tech. 2021, 14, 5977–5986. [Google Scholar] [CrossRef]
- Gutleben, M.; Groß, S.; Wirth, M.; Emde, C.; Mayer, B. Impacts of water vapor on Saharan Air Layer radiative heating. Geophys. Res. Lett. 2019, 46, 14854–14862. [Google Scholar] [CrossRef]
- ACTRIS, The Aerosol, Clouds and Trace Gases Research Infrastructure. Available online: https://www.actris.eu (accessed on 22 August 2023).
| Disclaimer/Publisher’s Note: The statements, opinions and data contained in all publications are solely those of the individual author(s) and contributor(s) and not of MDPI and/or the editor(s). MDPI and/or the editor(s) disclaim responsibility for any injury to people or property resulting from any ideas, methods, instructions or products referred to in the content. |
© 2023 by the authors. Licensee MDPI, Basel, Switzerland. This article is an open access article distributed under the terms and conditions of the Creative Commons Attribution (CC BY) license (https://creativecommons.org/licenses/by/4.0/).


 ,
,  . The ASKOS campaign was funded by ESA’s ASKOS project and the D-TECT ERC project. Ε.Μ. acknowledges support from the Hellenic Foundation for Research and Innovation (H.F.R.I.) under the “3rd Call for H.F.R.I. Research Projects to support Post-Doctoral Researchers” (Project Acronym: REVEAL; Project Number: 07222). Parts of this research were supported by the German Federal Ministry for Economic Affairs and Energy (BMWi) (grant no. 50EE1721C). E.D. was supported by the Hellenic Foundation for Research and Innovation (H.F.R.I.) under the “2nd Call for H.F.R.I. Research Projects to support Post-Doctoral Researchers” (Project Acronym: StratoFIRE; Project number: 3995).

