1. Introduction
Examining the precipitation regime for the period 1971 to 2020, Thessaloniki appears to exhibit a downward linear trend in annual precipitation of the order of 55 mm per decade during the subperiod of 1971 to 1995, while an upward linear trend of the order of 51 mm per decade is exhibited during the subperiod of 1996 to 2020. This upward trend coincides with the general wet trend that the major areas of Greece experienced due to the winter precipitation in the southern area and the summer precipitation in the northern area. It is worth noting that, in a general sense, most of the annual precipitation usually occurs in the autumn and winter months, from October to February, when Mediterranean frontal cyclonic activity is more frequent and relatively stronger over the examined region [
1].
These indications of Thessaloniki’s precipitation regime during the last 50-year period, and particularly between the two consecutive sub-periods, are examined more thoroughly by applying the IPTA methodology in order to bring to light any inherent trends among the months and seasons.
2. Data and Methodology
2.1. Data
The present study is carried out on a dataset of monthly, annual, and seasonal precipitation measurements obtained at the Meteorological Station of the Department of Meteorology and Climatology of the Aristotle University of Thessaloniki in Greece for the 50-year period (1971–2020). The obtained data are analysed in order to identify any trend changes within the examined half-century period and particularly between the two consecutive sub-periods of two equal segments: 1971–1995 and 1996–2020. Additional information is drawn from the standard deviation analyses.
2.2. Methodology
Innovative Polygon Trend Analysis
Innovative Polygon Trend Analysis (IPTA) is a well-known method that provides the researcher with classification and visual interpretation of a dataset. This can be applied to two consecutive time series sections of equal length and does not require any particular assumption. Additionally, the intercept and slope of the trend can be evaluated, and with the improvement in the technique, the significance test can be applied as well.
Initially, the Innovative Trend Analysis (ITA) method was proposed by [
2,
3,
4], which did not require many restrictive assumptions and provided trend identification through inductive and deductive perspectives. Since these non-parametric and parametric methods do not show any periodic variation or seasonal trend behaviour, which can be very useful for managing purposes and activities, Sen et al. [
5] (2019) proposed a new approach, the Innovative Polygon Trend Analysis, by evolving the ITA approach. This revised method provides identification of the trends, determination of the trend transitions, and a trend polygon for better numerical interpretation, filling the gap in trend analysis. Several studies have been conducted to determine the applicability of IPTA in practice [
6,
7,
8]. The present study is carried out to apply the IPTA methodology in order to examine the variability and identify any existing trends in the annual and seasonal perspectives of the precipitation measurements obtained at Thessaloniki for the 1971–2020 period.
The precipitation trend information between the months and seasons and the transition among them is depicted through IPTA, identifying single loops or any existing complexity and dynamics. The different months or seasons, which are connected through straight lines between consecutive points, define their trend slopes and trend lengths, which can be evaluated according to Esit [
9]. Their knowledge is quite useful.
3. Results
The IPTA method was applied to monthly and seasonal precipitation measurements in Thessaloniki for two consecutive sub-periods, 1971–1995 and 1996–2020, spanning over 50 years.
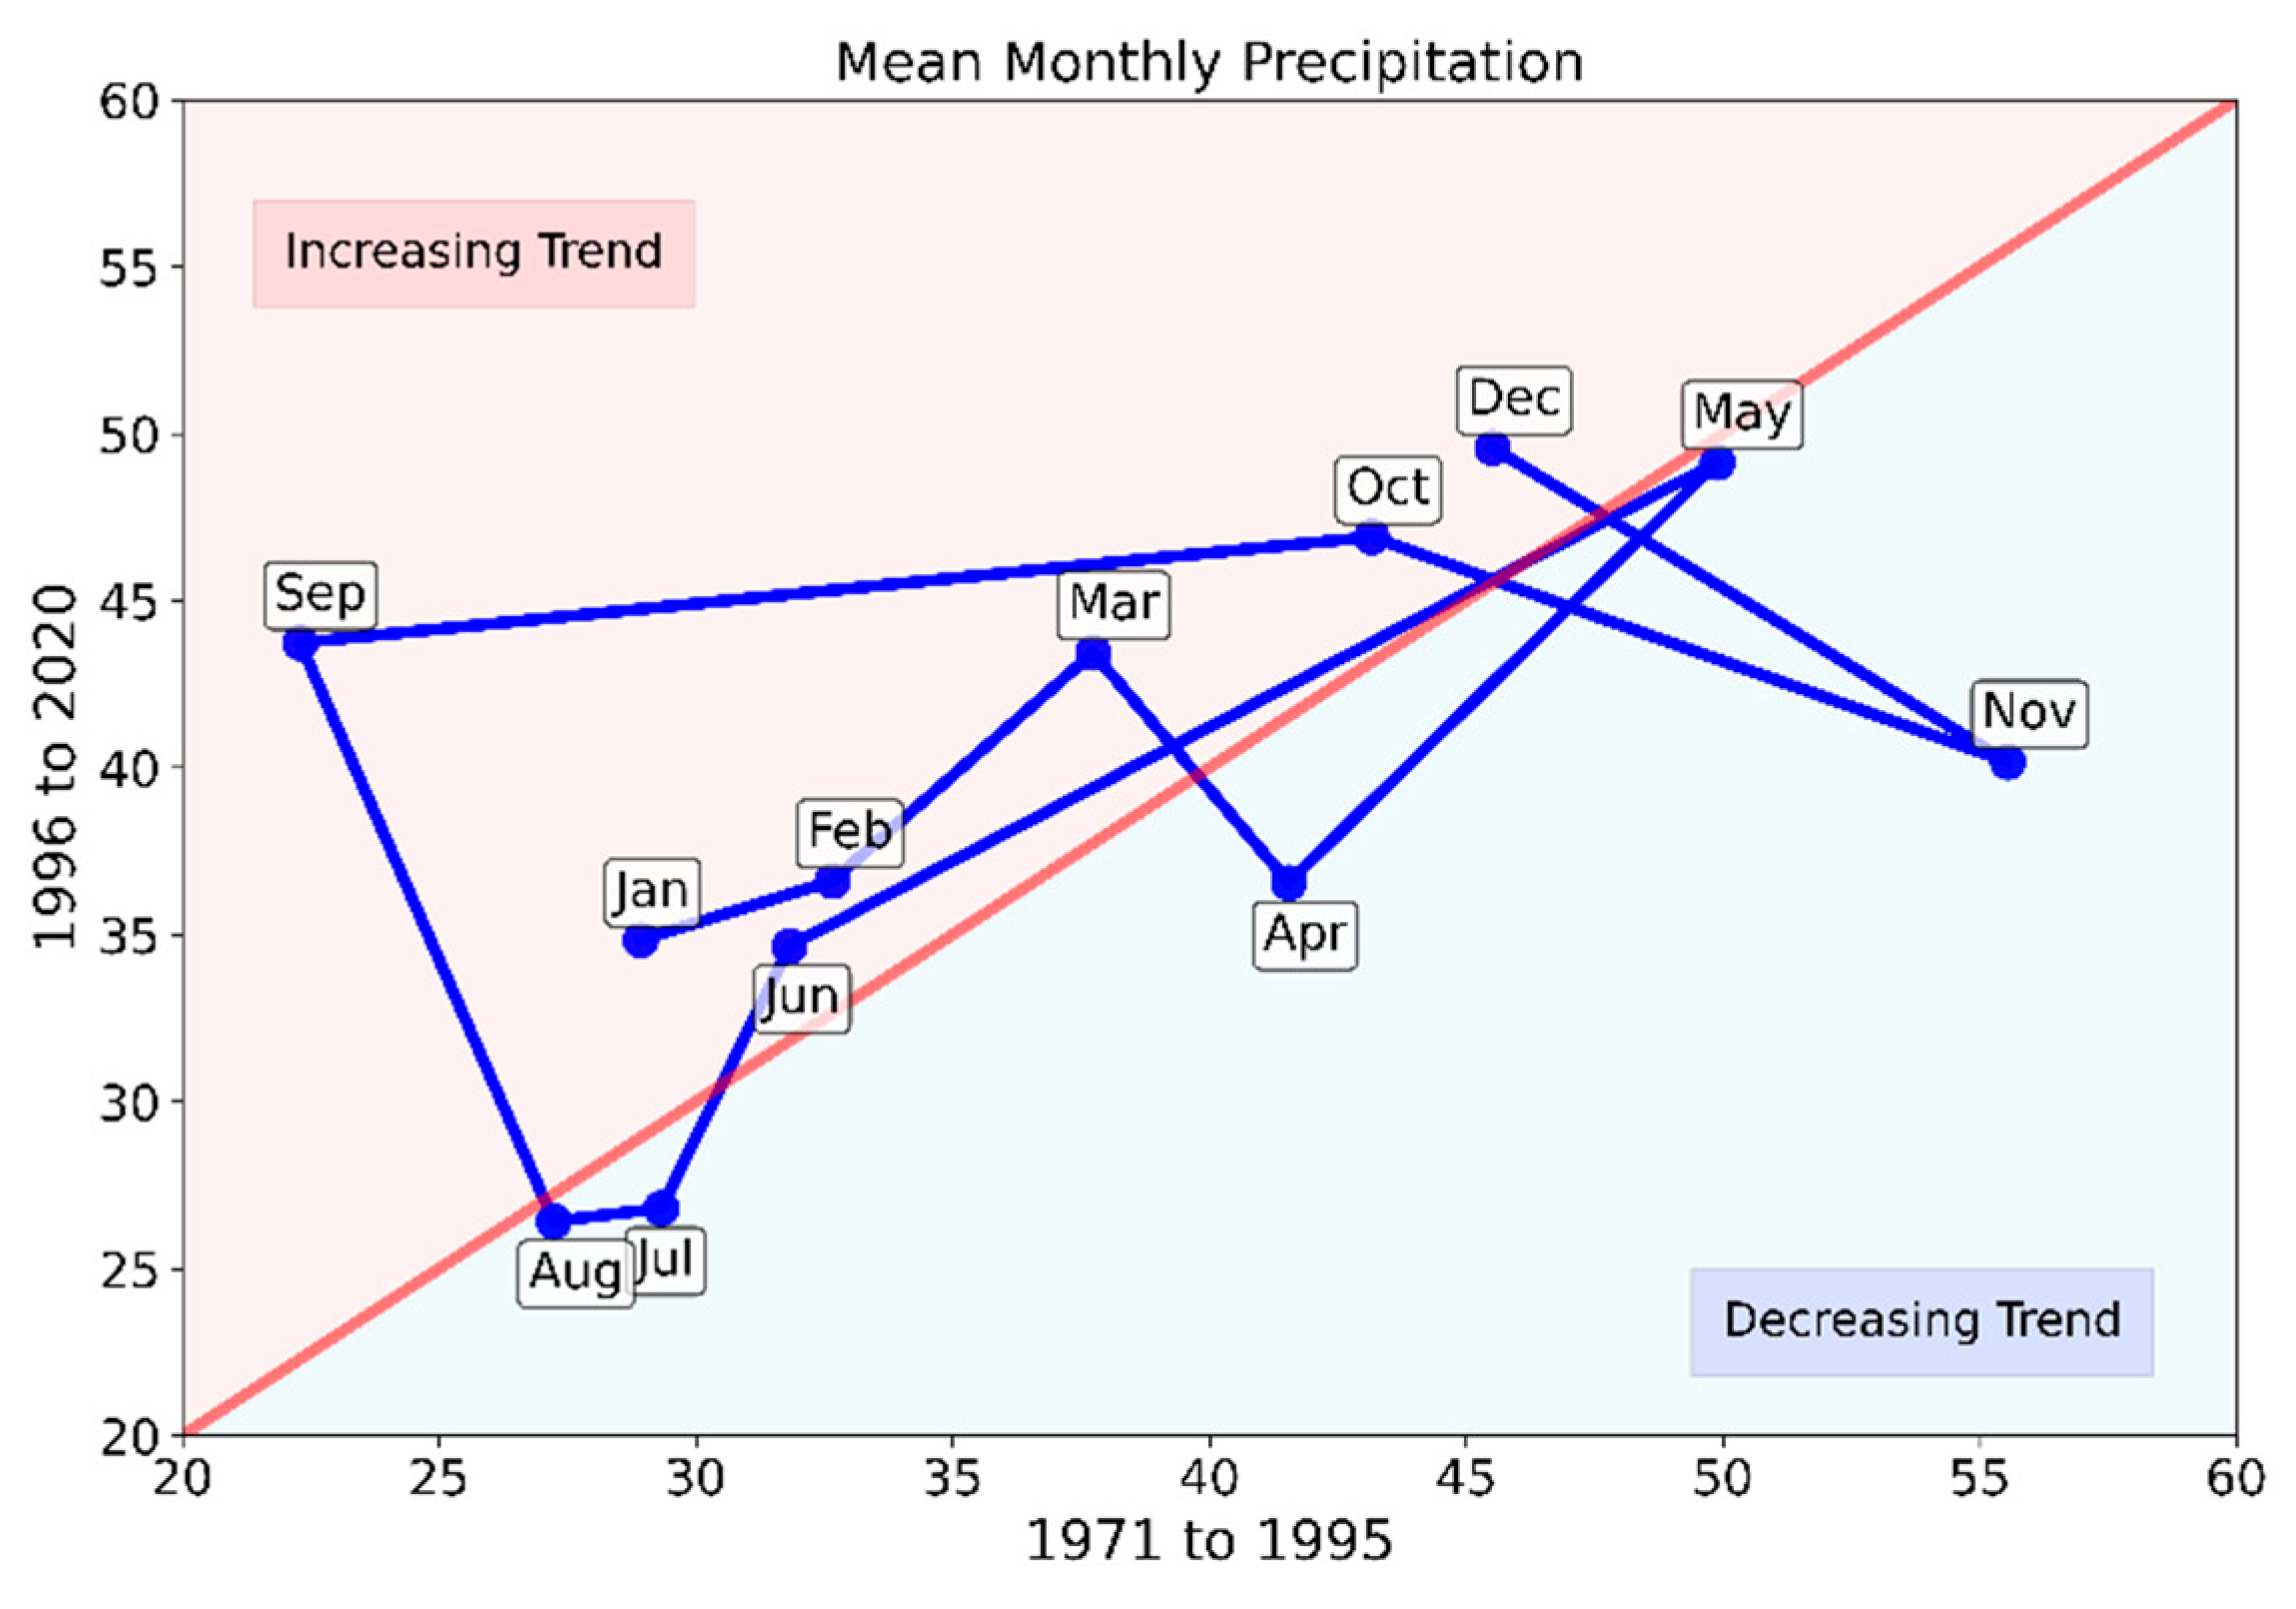
Figure 1 shows the mean monthly precipitation values for the examined consecutive sub-periods, and
Table 1 contains the general evaluation and representation of the mean monthly precipitation values, respectively.
The assessment of the results depicted in
Figure 1 and
Table 1 can be summarised as follows:
A distinctive polygon is present where the five months of April, May, July, August, and November appear in the decreasing trend area. Transitions towards the increasing trend area from May to June, August to September, and November to December are noted.
Transitions from the increasing trend area towards the decreasing trend area are also noticed from March to April, June to July, and October to November.
The depicted trend length and trend slope of the mean monthly precipitation values increase. The precipitation profile becomes more disordered.
A notable sharp transition from decreasing to increasing trend areas from August to September and from November to December is shown. The reverse can be observed from October to November.
Table 2 demonstrates the trend lengths and trend slopes calculated between the consecutive months of the mean monthly precipitation values for Thessaloniki during the 50-year period (1971–2020). The maximum value of trend length encountered is 23.15 mm, which is observed in the May to June transition, while the largest absolute value of trend slope (−26.28) is observed from August to September. The change in the trend slope sign is notable, as it follows the transition’s direction between the consecutive months.
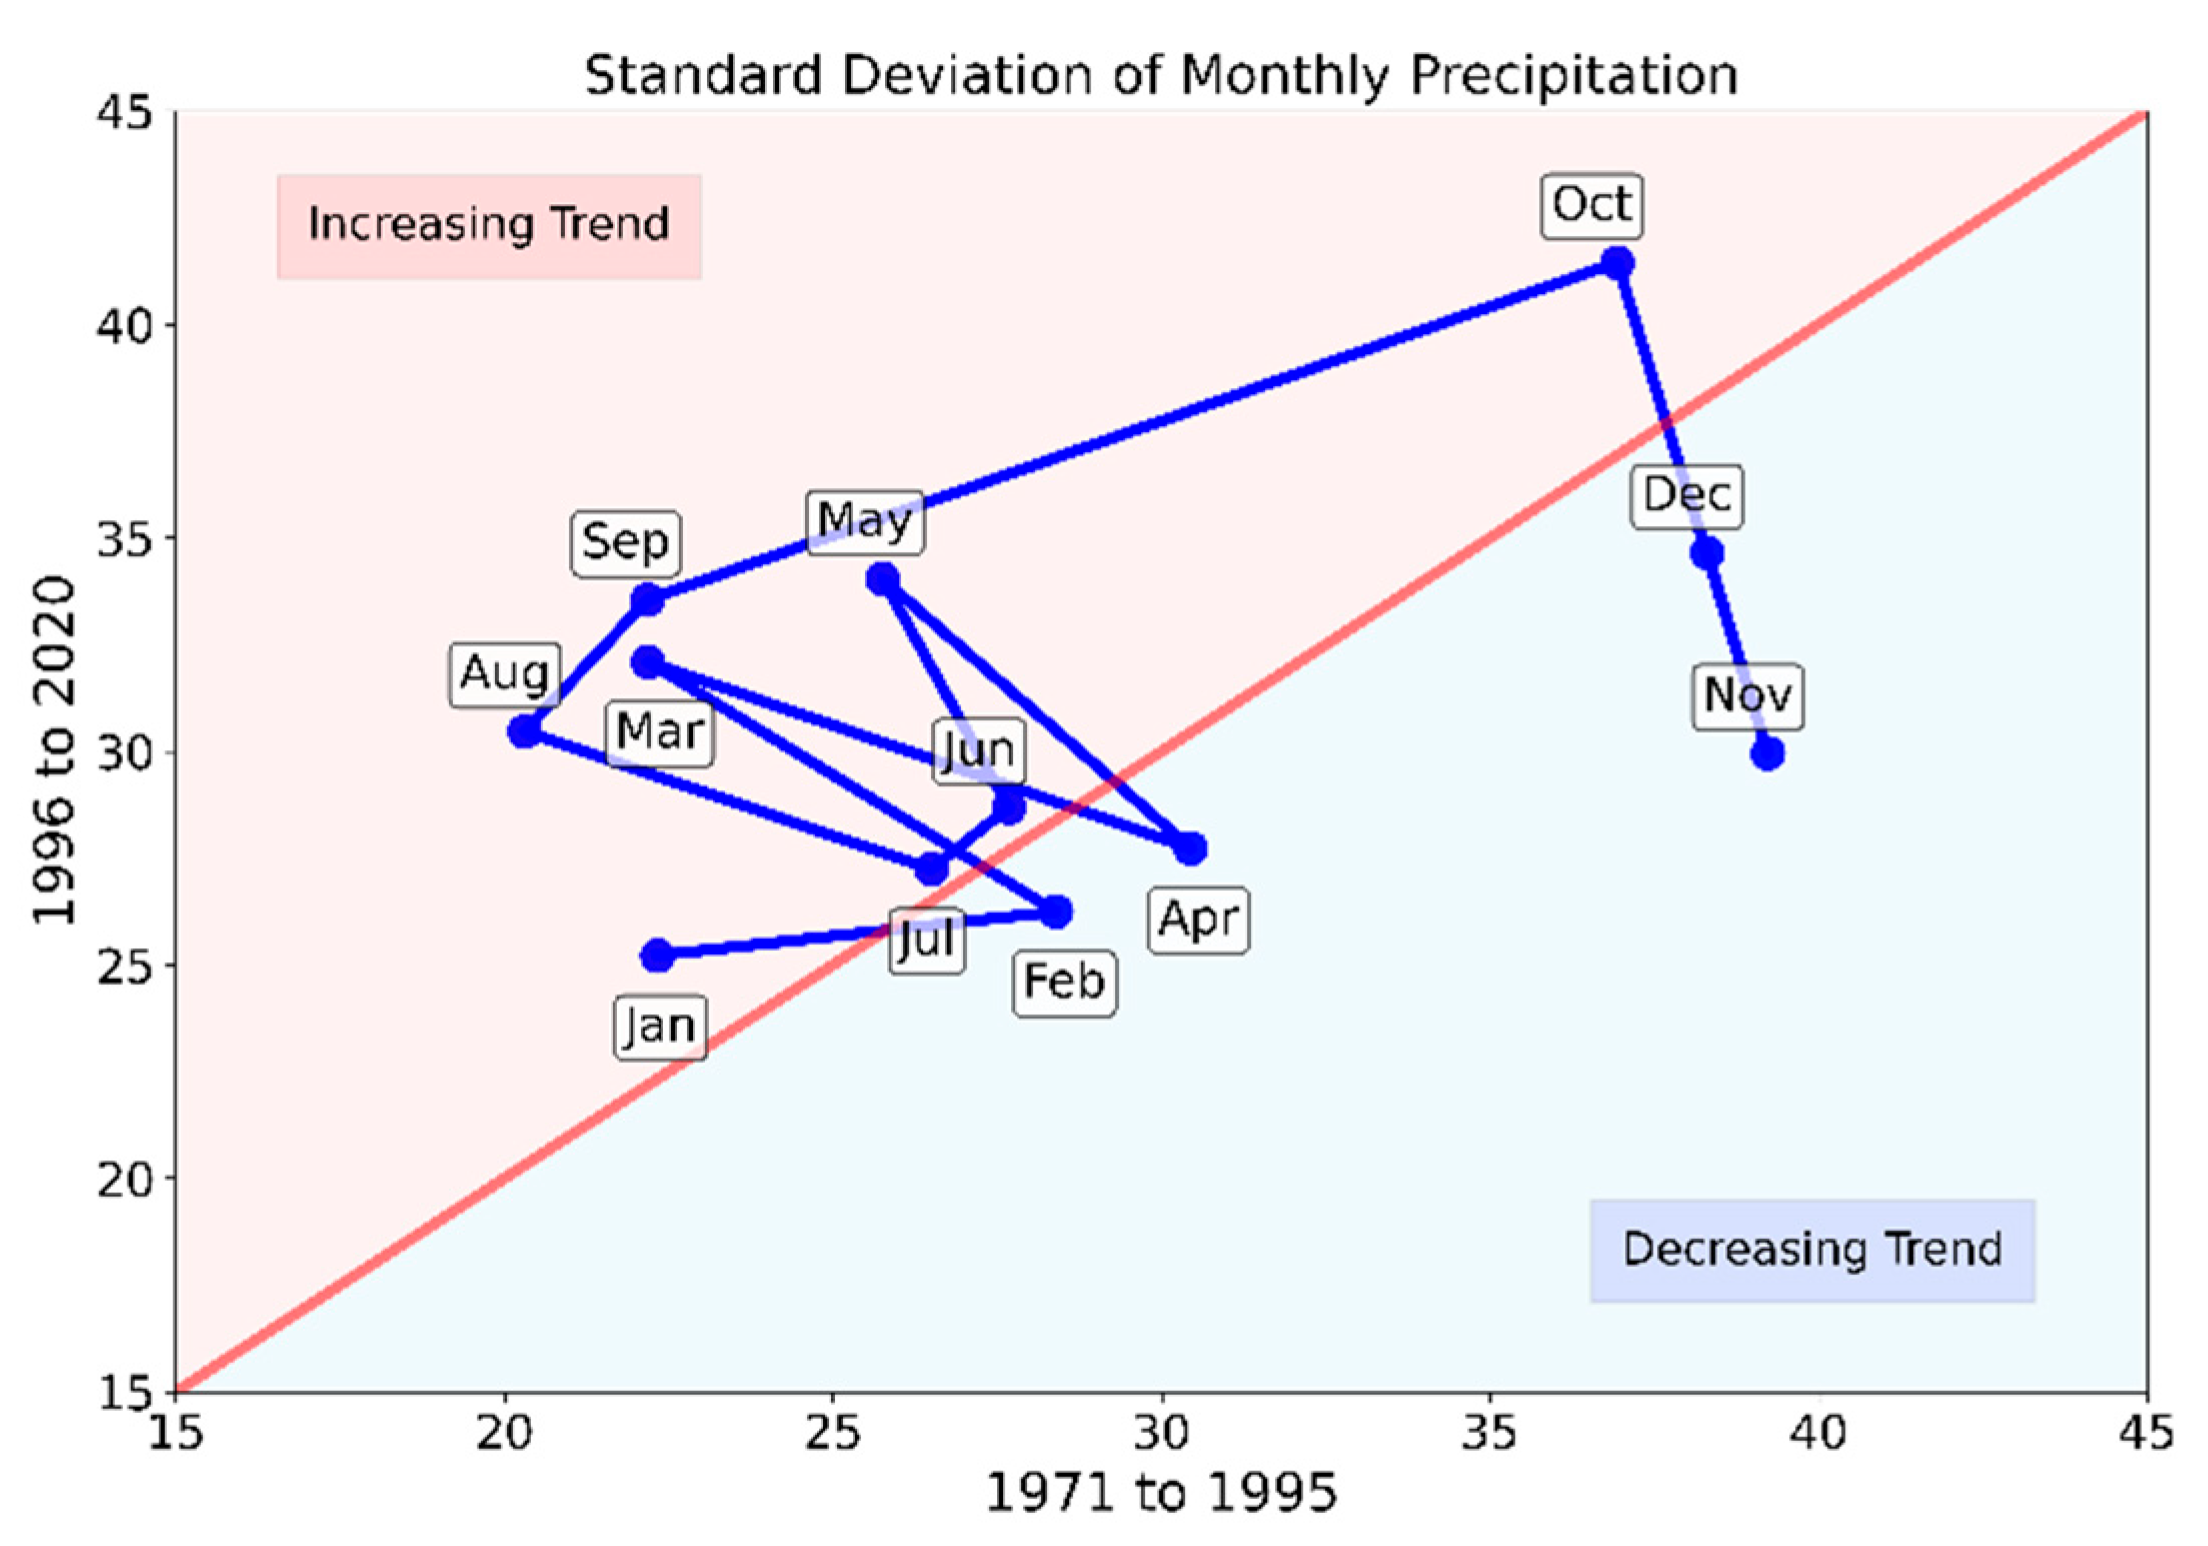
The Innovative Polygon Trend Analysis of the standard deviation of the monthly precipitation values for Thessaloniki during the period of interest is depicted in
Figure 2.
The polygon formed in
Figure 2 appears to be more disordered than the one encountered in
Figure 1, mostly due to the strong increasing trends in monthly precipitation tendencies of standard deviations. From the polygon, it can be observed that January, March, May, August, September, and October appear in the increasing trend area, while February, April, November, and December are in the decreasing area. Strong transitions appear for the majority of the months from the decreasing to the increasing trend area. The monthly points of March, May, August, September, and October show a strong increasing trend as they appear far away from the non-trend line. The reverse is observed for the months of February, April, and December, showing a light to moderate decreasing trend, except for November, which depicts a strong decreasing trend.
Generally, the polygons presented in both figures indicate a disordered and anisotropic profile for precipitation in Thessaloniki for the period in question.
The precipitation range values between the corresponding months of the two consecutive sub-periods (the difference between the highest and the lowest monthly values for each specific month over the examined period) were used to develop the associated innovative polygon demonstrated in
Figure 3. In addition,
Table 3 contains the general evaluation and representation of the precipitation range values, respectively.
The depicted analysis in
Figure 3 indicates that the disordered and anisotropic profile observed in previous figures is also evident for the precipitation range values for most months. October is characterised by the highest precipitation range, with an increasing trend in the second sub-period. Conversely, December exhibits the highest precipitation range values, with a decreasing trend in the first sub-period. Transitions towards the increasing trend area appear to be stronger. The months of July and November are close to the non-trend line, while the majority of the months are within the increased trend area.
Figure 4 depicts the IPTA polygon of the mean seasonal precipitation values between the two consecutive sub-periods: 1971–1995 and 1996–2020. The seasons of autumn and winter are well into the increasing trend area, indicating a serious increasing precipitation trend lasting for the two seasons, while spring and summer are almost on the non-trend line.
4. Conclusions
The main objective of this paper is to apply the new concept of the Innovative Polygon Trend Analysis (IPTA) method to total monthly precipitation measurements of the Meteorological Station in Thessaloniki in a 50-year period (1971–2020), divided into two consecutive sub-periods of two equal segments, that is, 1971–1995 and 1996–2020.
As a result, the IPTA graphics were created for the mean monthly precipitation and its standard deviation, the precipitation range, and the mean seasonal precipitation. Through these, trends and trend transitions between successive months and seasons were calculated, as well as their lengths and slopes. Additionally, any existing anisotropic or disorderly features were identified.
The second sub-period (1996–2020) shows a prominent increase in precipitation compared to the first one. This is probably because most of the months indicate increasing trends, especially the sharp transition from decreasing to increasing trend areas of August to September and November to December. Moreover, very large values of trend length and trend slopes have been encountered due to sharp transitions. These conclusions are also verified by the strong increasing trends in monthly precipitation tendencies of standard deviation polygons and the numerous and stronger transitions towards the increasing trend area demonstrated at the precipitation range polygon.
The confirmation of these stated results is certified by the IPTA polygon of the seasonal precipitation values between the two consecutive sub-periods (1971–1995 and 1996–2020). Autumn and winter are well into the increasing trend area, indicating a serious increasing precipitation trend lasting for the two seasons, while spring and summer are almost on the non-trend line.
In conclusion, it is believed that the IPTA method is a very good, sensitive, and useful tool for the quantitative identification of trend analyses via the transactions from one trend area to the other and the length and slope trends.
Author Contributions
Conceptualization, T.K.; methodology, T.K., P.K., N.P.; software, P.K., N.P.; validation, P.K., N.P., and M.D.; formal analysis, P.K., N.P.; investigation, P.K., N.P. and M.D.; resources, T.K., P.K.; data curation, P.K., N.P.; writing—original draft preparation, P.K., N.P.; writing—review and editing, T.K., P.K., N.P. and M.D.; visualization, P.K., N.P.; supervision, T.K.; project administration, T.K. This research received no external funding. All authors have read and agreed to the published version of the manuscript.
Funding
This research received no external funding.
Institutional Review Board Statement
Not applicable.
Informed Consent Statement
Not applicable.
Data Availability Statement
Conflicts of Interest
The authors declare no conflict of interest.
References
- Feidas, H.; Karacostas, T.; Zanis, P. The wonderful weather of Greece. In The Geography of Greece. Managing Crises and Building Resilience; Springer World Regional Geography Book Series; Springer: Berlin/Heidelberg, Germany, 2023; Unpublished work. [Google Scholar]
- Şen, Z. Innovative trend analysis methodology. J. Hydrol. Eng. 2012, 17, 1042–1046. [Google Scholar] [CrossRef]
- Şen, Z. Trend identification simulation and application. J. Hydrol. Eng. 2014, 19, 635–642. [Google Scholar] [CrossRef]
- Şen, Z. Innovative trend significance test and applications. Theor. Appl. Climatol. 2017, 127, 939–947. [Google Scholar] [CrossRef]
- Sen, Z.; Sisman, E.; Dabanli, I. Innovative Polygon Trend Analysis (IPTA) and applications. J. Hydrol. 2019, 575, 202–210. [Google Scholar] [CrossRef]
- Caloiero, T. Evaluation of rainfall trends in the South Island of New Zealand through the innovative trend analysis (ITA). Theor. Appl. Climatol. 2020, 139, 493–504. [Google Scholar] [CrossRef]
- Achite, M.; Ceribasi, G.; Ceyhunlu, A.I.; Wałęga, A.; Caloiero, T. The innovative polygon trend analysis (IPTA) as a simple qualitative method to detect changes in environment–example detecting trends of the total monthly precipitation in semiarid area. Sustainability 2021, 13, 12674. [Google Scholar] [CrossRef]
- Harka, A.E.; Jilo, N.B.; Behulu, F. Spatial-temporal rainfall trend and variability assessment in the Upper Wabe Shebelle River Basin, Ethiopia: Application of innovative trend analysis method. J. Hydrol. Reg. Stud. 2021, 37, 100915. [Google Scholar] [CrossRef]
- Esit, M. Investigation of innovative trend approaches (ITA with significance test and IPTA) comparing to the classical trend method of monthly and annual hydrometeorological variables: A case study of Ankara region, Turkey. J. Water Clim. Chang. 2023, 14, 305–329. [Google Scholar] [CrossRef]
| Disclaimer/Publisher’s Note: The statements, opinions and data contained in all publications are solely those of the individual author(s) and contributor(s) and not of MDPI and/or the editor(s). MDPI and/or the editor(s) disclaim responsibility for any injury to people or property resulting from any ideas, methods, instructions or products referred to in the content. |
© 2023 by the authors. Licensee MDPI, Basel, Switzerland. This article is an open access article distributed under the terms and conditions of the Creative Commons Attribution (CC BY) license (https://creativecommons.org/licenses/by/4.0/).


