
Monitoring Water Turbidity Using Remote Sensing Techniques †
by
 , , , and
Domenico Miglino
1,* ,
,
Seifeddine Jomaa
2,
Michael Rode
2,
Francesco Isgro
3 and
and
Salvatore Manfreda
1
1
Dipartimento di Ingegneria Civile, Edile e Ambientale (DICEA), Università degli Studi di Napoli Federico II, 80125 Napoli, Italy
2
Department of Aquatic Ecosystem Analysis and Management (ASAM), Helmholtz Centre for Environmental Research—UFZ, 39114 Magdeburg, Germany
3
Dipartimento di Ingegneria Elettrica e delle Tecnologie dell’Informazione (DIETI), Università degli Studi di Napoli Federico II, 80125 Napoli, Italy
*
Author to whom correspondence should be addressed.
†
Presented at the International Conference EWaS5, Naples, Italy, 12–15 July 2022.
Environ. Sci. Proc. 2022, 21(1), 63; https://doi.org/10.3390/environsciproc2022021063
Published: 1 November 2022
(This article belongs to the Proceedings of EWaS5 International Conference: “Water Security and Safety Management: Emerging Threats or New Challenges? Moving from Therapy and Restoration to Prognosis and Prevention”)
Abstract
:In the present work, the use of optical cameras for turbidity measurements is tested on the Bode River in Germany, which is one of the best-instrumented catchments in Central Germany with a long-term time series on water quantity and quality. Four trap cameras have been installed on monitored cross-sections with the aim to explore the potential of RGB indices for the description of water turbidity. A description of the experimental setup and some preliminary results are introduced.
1. Introduction
Water security is facing critical challenges due to the concomitant impact of global warming, population growth, and pollution. In the context of water quality (WQ) monitoring, water turbidity represents a key factor controlling for water quality assessment. In fact, it is the main transport factor for many other pollutants. Turbidity detection assumes great significance for the management of artificial reservoirs, water management, and environmental protection of aquatic ecosystems. Therefore, spatiotemporal monitoring of turbidity is essential in water resource management. Traditional monitoring techniques are time-consuming, expensive, influenced by human errors and instrumental limitations, and often discontinuous in space and time. Remote sensing techniques have been widely used to measure the qualitative parameters of waterbodies (i.e., turbidity, suspended sediments, coloured dissolved organic matter—CDOM, chlorophyll-a, and pollutants), measuring the reflectance at different wavelengths of the water body [1,2]. The presence of dissolved inorganic materials in water changes the peak of visible reflectance to shift from the green region, for clearer water, toward the red region of the spectrum for cloudy water [3]. Therefore, the ratio between the red and green band has been considered in this study, as shown in the literature [4,5,6]. Recently, the normalized difference turbidity index, derived from RGB imagery, has also been explored to provide qualitative measurements of water turbidity on large rivers such as the Ganga River [7]. The study aims to investigate the potential of optical cameras in river quality monitoring of small water bodies that cannot be seen by satellites.
2. Bode River Field Campaign
As part of the Harmonious COST Action (https://www.costharmonious.eu/ (accessed on 24 May 2022)), a field campaign along the Bode River basin was carried out in February 2022 at the Helmholtz Research Centre (UFZ) in Magdeburg (Germany). The Bode catchment is one of the meteorologically and hydrologically best-instrumented catchments in Central Germany, with a long-term time series on water quantity and quality [8,9]. RGB trail cameras have been installed in four monitoring stations, as shown in Figure 1. The choice of the stations has followed these criteria: visibility of the river cross-section, variability of the parameter to be monitored (turbidity in our case), and point of installation of the cameras.
Staßfurt station is located on the Bode catchment outlet, Meisdorf station is located upstream between the wooded area and the lowland, and the other two stations of Hausneindorf and Gross Germensleben are between the first two. As regards the on-site installation of the cameras, it has been decided to place the cameras along the riverbank and fix them on metal poles (Figure 2a). Moreover, radiometric calibration panels (Figure 2b) have been installed within the camera field of view. Radiometric calibration is essential to obtain real measurement data from spectral images, as it converts the digital value of each image pixel into a unit of scene reflectance that can be directly used in quantitative remote sensing analysis [10]. The cameras have been positioned with an angle α of 90° with respect to the plane of the Sun’s motion, and are inclined at an angle β between 30° and 45° [11] toward the water surface (Figure 3). Finally, the time-lapse has been set at regular intervals of 30 min and the observation interval has been fixed from 6 AM to 9 PM to maximize the battery lifetime.
3. Preliminary Results on Water Surface Turbidity Monitoring with Camera
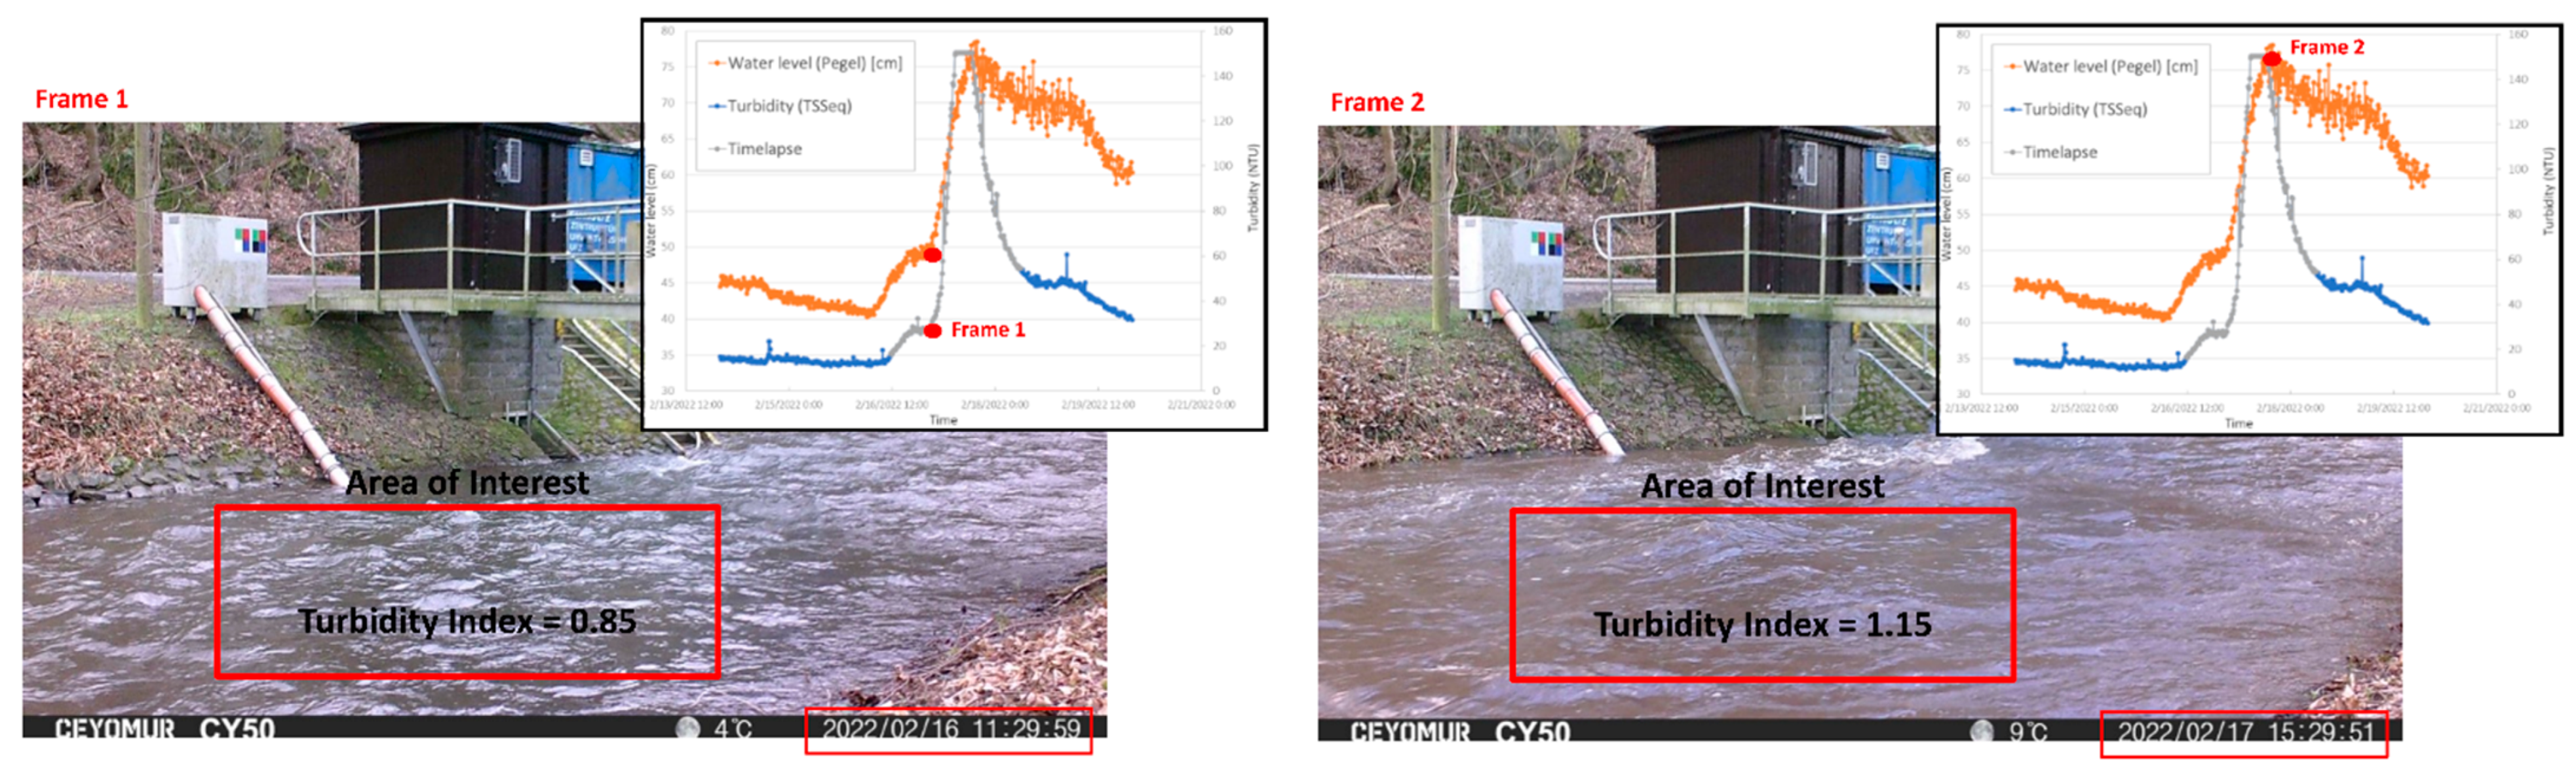
Preliminary tests highlighted interesting similarities between the chromatic variation of the water surface captured by the RGB camera and the real data continuously monitored by the optical sensors of the UFZ monitoring stations (Table 1).
The ratio between the red and green band has been considered to evaluate the camera turbidity index within the selected image area of interest of the water surface (Figure 4). Even though the images need to be enhanced, the calibration carried out using the radiometric panel installed on-site allows us to easily identify an initial correlation between the data measured by the sensor and those from the camera. On-site tests with the camera are still on-going and camera time-lapses are being recorded. This will allow us to acquire a significant set of data to understand how to optimize the characteristics of the camera prototype and how to proceed with the implementation of an image-processing algorithm for an effective estimate of turbidity using camera spectral indexes.
4. Conclusions
This work wants to take a step forward in exploring the potential of camera systems installed on rivers. The advantage of using cameras is to greatly increase the spatial and temporal resolution of observations. The low cost and the scalability of that technology may help to intensify the number of monitored points along rivers and tributaries, making the monitoring of the hydrological response possible with a level of detail never reached before. Moreover, the forthcoming works will focus on the application of remote sensing-based methods combined with machine learning (ML), producing extraordinary innovation. From this perspective, digital cameras represent the ideal tool that can be easily installed in any location and provide a large amount of data.
Author Contributions
Conceptualization, S.M. and D.M.; methodology, D.M., S.M., S.J. and M.R.; software, D.M. and S.M.; validation, S.J. and M.R.; investigation, D.M. and S.J.; writing—review and editing, D.M., S.M., S.J., M.R. and F.I.; supervision, S.M. and M.R. All authors have read and agreed to the published version of the manuscript.
Funding
This work was supported by the Harmonious COST Action (CA16219)—harmonization of UAS techniques for agricultural and natural ecosystems monitoring.
Institutional Review Board Statement
Not applicable.
Informed Consent Statement
Not applicable.
Data Availability Statement
Not applicable.
Acknowledgments
We would like to thank Uwe Kiwel for his great help during the field campaign.
Conflicts of Interest
The authors declare no conflict of interest.
References
- Brando, V.E.; Dekker, A.G. Satellite hyperspectral remote sensing for estimating estuarine and coastal water quality. IEEE Trans. Geosci. Remote Sens. 2003, 41, 1378–1387. [Google Scholar] [CrossRef]
- Giardino, C.; Bresciani, M.; Cazzaniga, I.; Schenk, K.; Rieger, P.; Braga, F.; Matta, E.; Brando, V.E. Evaluation of multi-resolution satellite sensors for assessing water quality and bottom depth of lake garda. Sensors 2014, 14, 24116–24131. [Google Scholar] [CrossRef] [PubMed] [Green Version]
- Gholizadeh, M.H.; Melesse, A.M.; Reddi, L. A comprehensive review on water quality parameters estimation using remote sensing techniques. Sensors 2016, 16, 1298. [Google Scholar] [CrossRef] [PubMed] [Green Version]
- Akbar, T.; Hassan, Q.; Achari, G. A remote sensing based framework for predicting water quality of different source waters. In Proceedings of the ISPRS Commission I Mid-Term Symposium, Image Data Acquisition—Sensors & Platforms, Calgary, AB, Canada, 15–18 June 2010. [Google Scholar]
- Toming, K.; Kutser, T.; Uiboupin, R.; Arikas, A.; Vahter, K.; Paavel, B. Mapping water quality parameters with sentinel-3 ocean and land colour instrument imagery in the Baltic Sea. Remote Sens. 2017, 9, 1070. [Google Scholar] [CrossRef] [Green Version]
- Wang, F.; Han, L.; Kung, H.T.; van Arsdale, R. Applications of Landsat-5 TM imagery in assessing and mapping water quality in Reelfoot Lake, Tennessee. Int. J. Remote Sens. 2006, 27, 5269–5283. [Google Scholar] [CrossRef]
- Garg, V.; Aggarwal, S.P.; Chauhan, P. Changes in turbidity along Ganga River using Sentinel-2 satellite data during lockdown associated with COVID-19. Geomat. Nat. Hazards Risk 2020, 11, 1175–1195. [Google Scholar] [CrossRef]
- Wollschläger, U.; Attinger, S.; Borchardt, D.; Brauns, M.; Cuntz, M.; Dietrich, P.; Fleckenstein, J.H.; Friese, K.; Friesen, J.; Harpke, A.; et al. The Bode hydrological observatory: A platform for integrated, interdisciplinary hydro-ecological research within the TERENO Harz/Central German Lowland Observatory. Environ. Earth Sci. 2017, 76, 29. [Google Scholar] [CrossRef]
- Zacharias, S.; Bogena, H.; Samaniego, L.; Mauder, M.; Fuß, R.; Pütz, T.; Frenzel, M.; Schwank, M.; Baessler, C.; Butterbach-Bahl, K.; et al. A network of terrestrial environmental observatories in Germany. Vadose Zone J. 2011, 10, 955–973. [Google Scholar] [CrossRef] [Green Version]
- Guo, Y.; Senthilnath, J.; Wu, W.; Zhang, X.; Zeng, Z.; Huang, H. Radiometric calibration for multispectral camera of different imaging conditions mounted on a UAV platform. Sustainability 2019, 11, 978. [Google Scholar] [CrossRef] [Green Version]
- Le, C.; Li, Y.; Zha, Y.; Sun, D.; Huang, C.; Lu, H. A four-band semi-analytical model for estimating chlorophyll a in highly turbid lakes: The case of Taihu Lake, China. Remote Sens. Environ. 2009, 113, 1175–1182. [Google Scholar] [CrossRef]
Figure 1.
TERENO spans an Earth observation network (a) across Germany that extends from the North German lowlands to the Bavarian Alps, including the Bode catchment (b). The red markers (c) show the four most suitable UFZ monitoring stations within the Bode catchment for the on-site installation of the RGB camera.
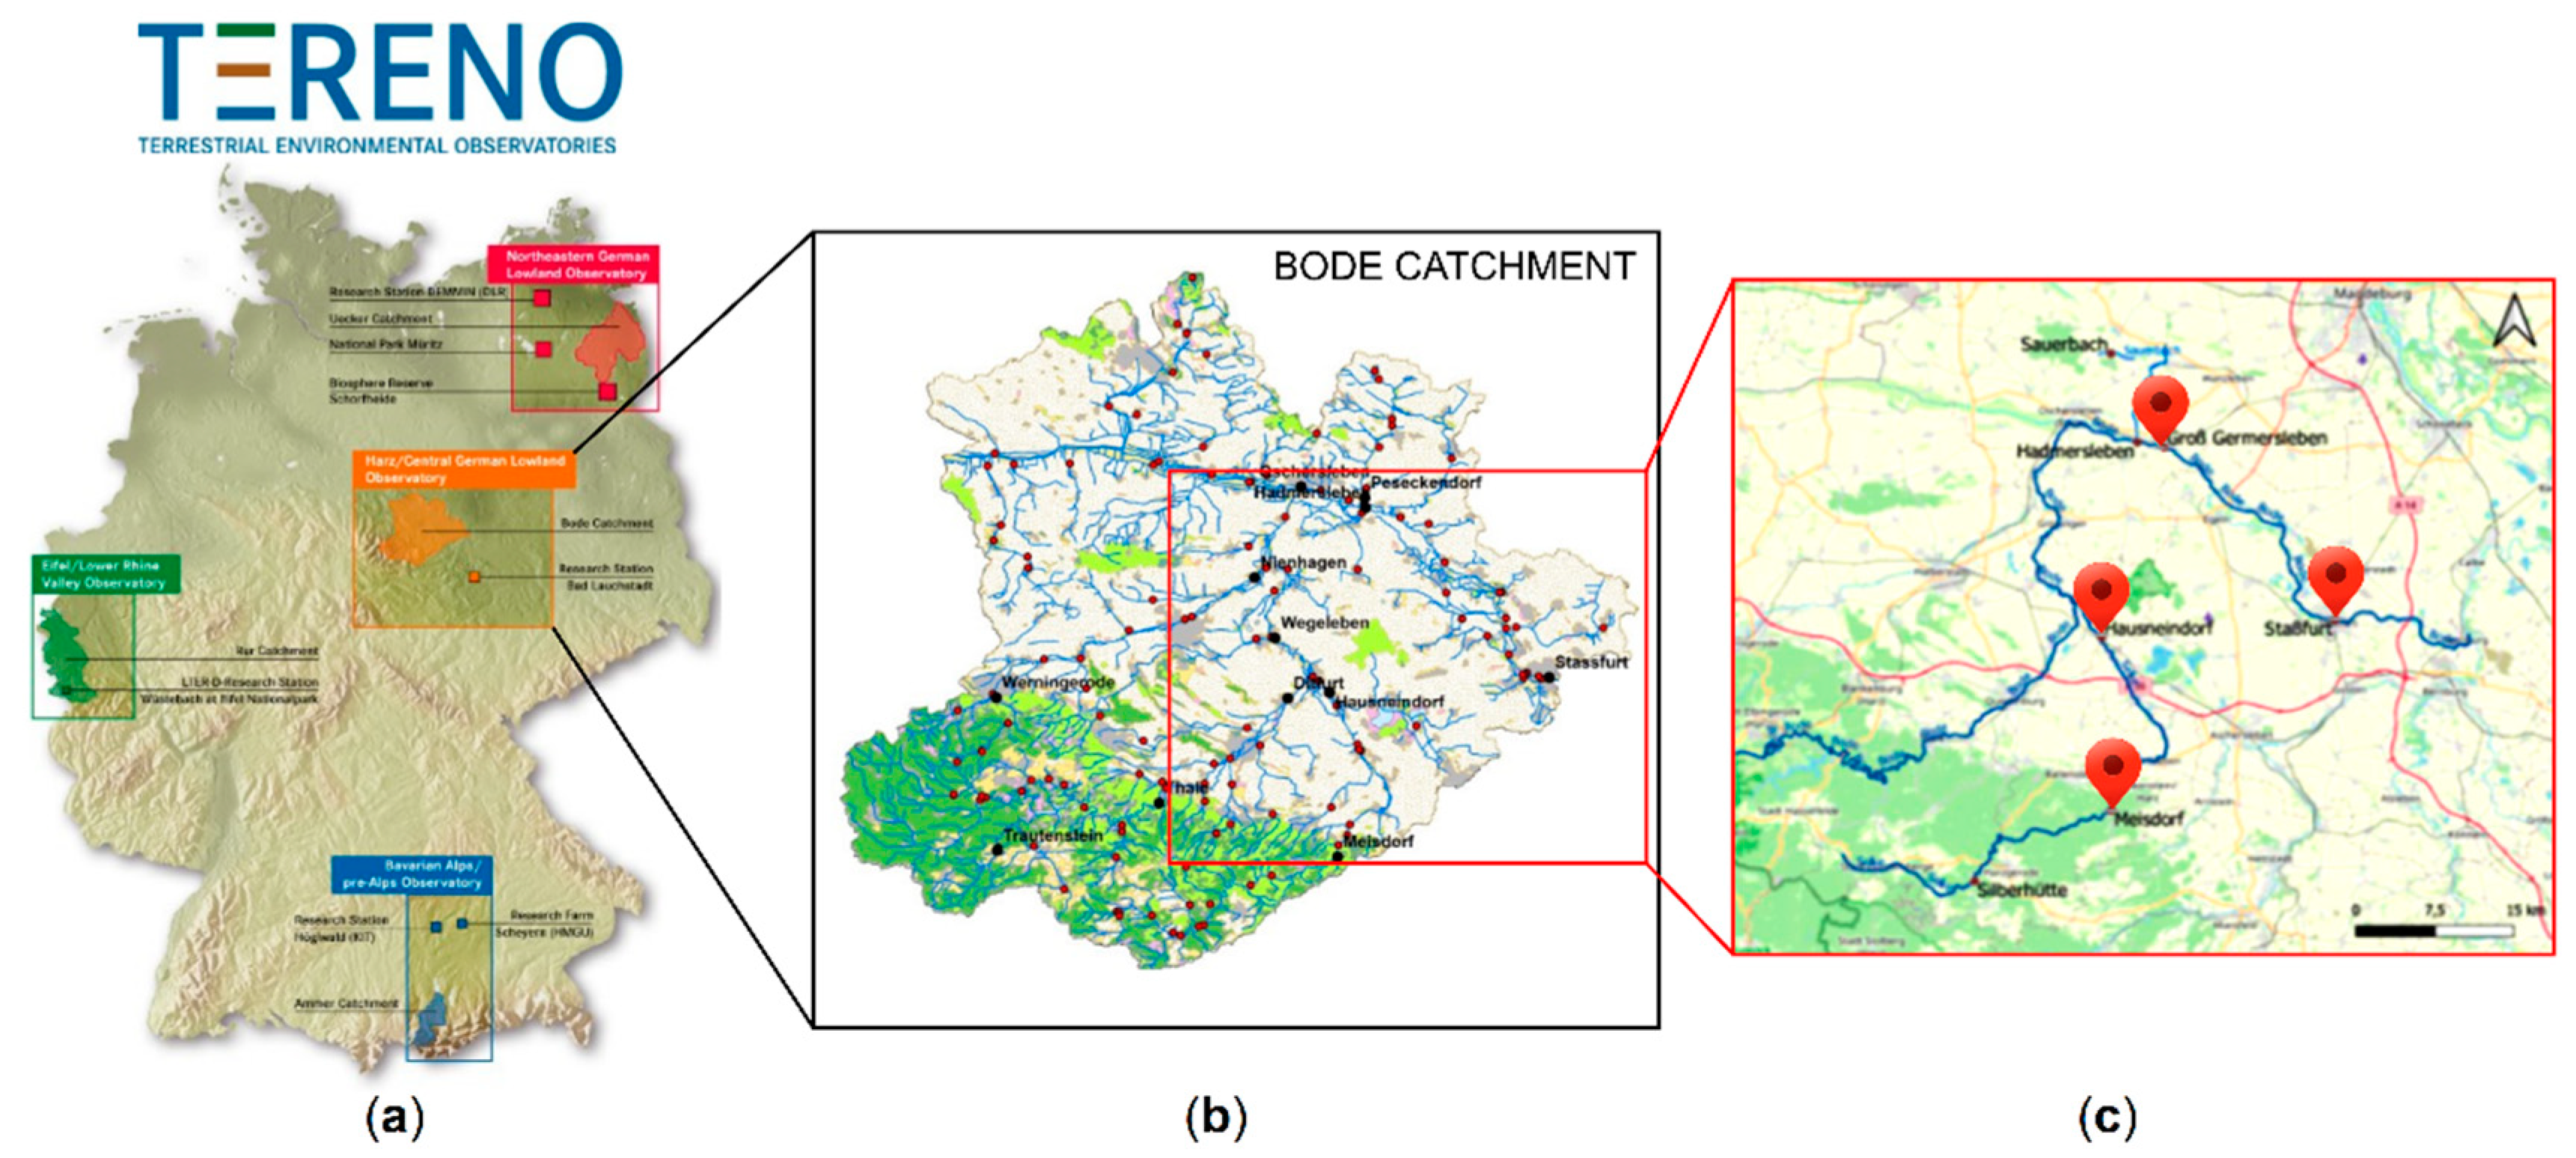
Figure 2.
Installation of the camera (a) and the radiometric calibration panel (b) circled in red on the site of Meisdorf station.
Figure 2.
Installation of the camera (a) and the radiometric calibration panel (b) circled in red on the site of Meisdorf station.

Figure 3.
River cross-sections of Meisdorf (a) and Hausneindorf (b) monitoring stations and camera scheme of installation (c).
Figure 3.
River cross-sections of Meisdorf (a) and Hausneindorf (b) monitoring stations and camera scheme of installation (c).
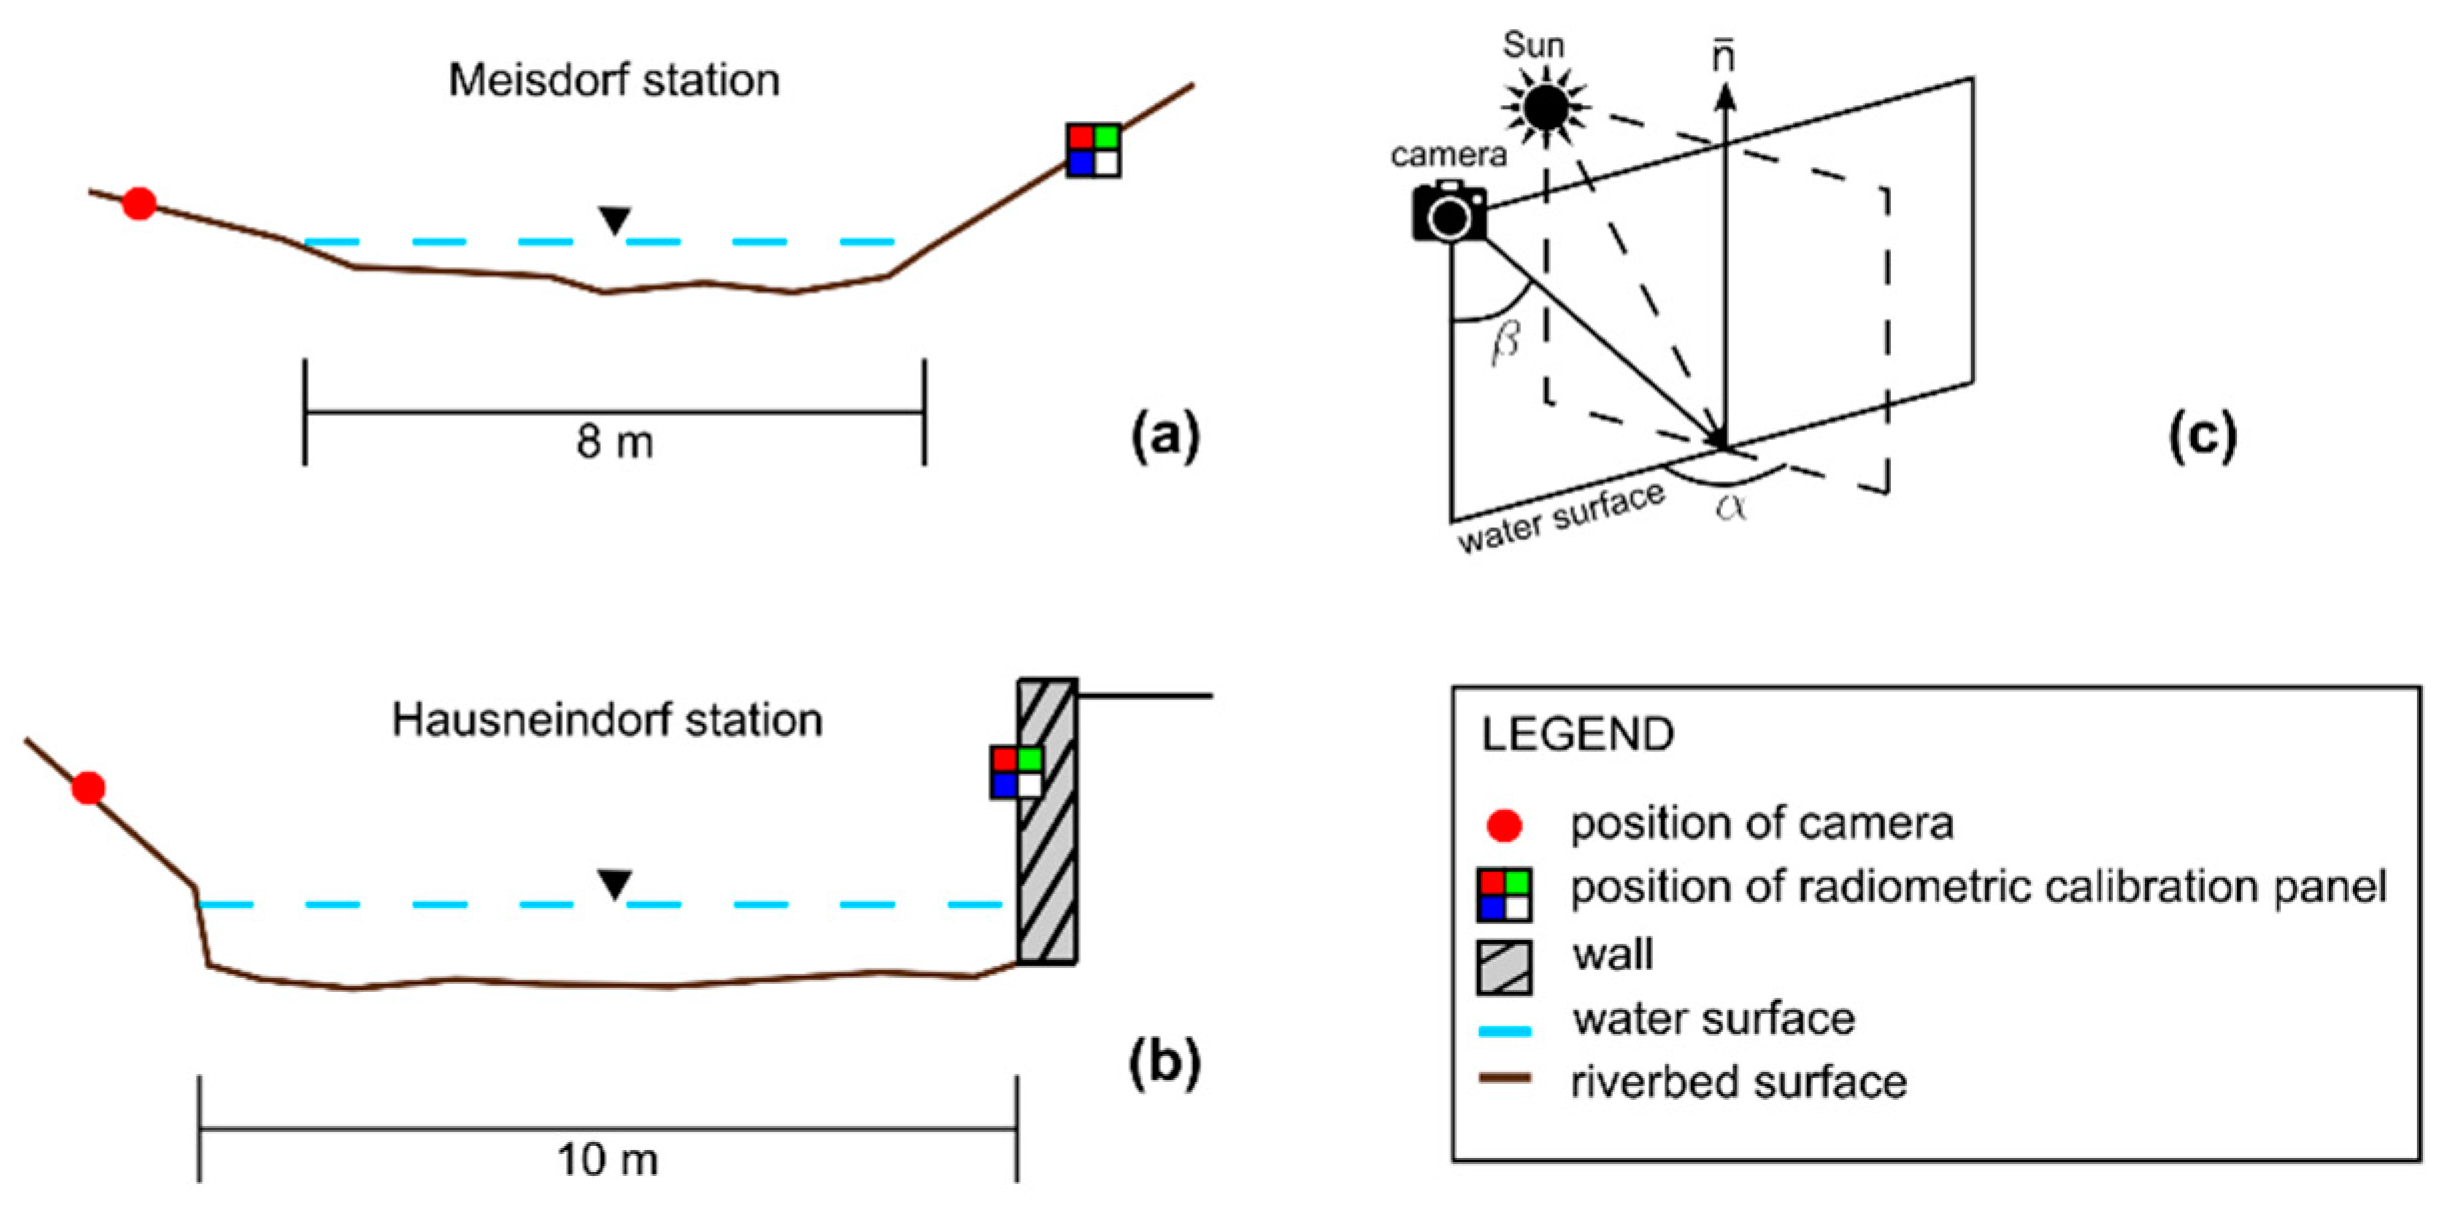
Figure 4.
Two frames of the camera time-lapse recorded from 16 to 17 February 2022, on the site of Meisdorf station. Turbidity indexes within the images’ area of interest have been evaluated as the ratio between red and green band reflectance.
Figure 4.
Two frames of the camera time-lapse recorded from 16 to 17 February 2022, on the site of Meisdorf station. Turbidity indexes within the images’ area of interest have been evaluated as the ratio between red and green band reflectance.

Table 1.
Table of UFZ sensor measurements of mean, minimum, and maximum values of river sections’ water level and water turbidity for each monitoring station, performed during February and March 2022. The turbidity measurements considered have been obtained using the scattered light method.
Table 1.
Table of UFZ sensor measurements of mean, minimum, and maximum values of river sections’ water level and water turbidity for each monitoring station, performed during February and March 2022. The turbidity measurements considered have been obtained using the scattered light method.
| Monitoring Stations | Mean Turbidity (NTU) | Min Turbidity (NTU) | Max Turbidity (NTU) | Mean Water Level (cm) | Min Water Level (cm) | Max Water Level (cm) |
|---|---|---|---|---|---|---|
| Meisdorf | 29.8 | 4.9 | 1063.1 | 48.0 | 29.0 | 101.0 |
| Hausneindorf | 18.7 | 0.9 | 1319.4 | 114.6 | 89.0 | 181.6 |
| Staßfurt | 47.7 | 4.4 | 1663.6 | 181.9 | 110.9 | 259.1 |
| Gross | 10.6 | 2.3 | 76.1 | 158.2 | 96.6 | 240.7 |
Publisher’s Note: MDPI stays neutral with regard to jurisdictional claims in published maps and institutional affiliations. |
© 2022 by the authors. Licensee MDPI, Basel, Switzerland. This article is an open access article distributed under the terms and conditions of the Creative Commons Attribution (CC BY) license (https://creativecommons.org/licenses/by/4.0/).
Share and Cite
MDPI and ACS Style
Miglino, D.; Jomaa, S.; Rode, M.; Isgro, F.; Manfreda, S. Monitoring Water Turbidity Using Remote Sensing Techniques. Environ. Sci. Proc. 2022, 21, 63. https://doi.org/10.3390/environsciproc2022021063
AMA Style
Miglino D, Jomaa S, Rode M, Isgro F, Manfreda S. Monitoring Water Turbidity Using Remote Sensing Techniques. Environmental Sciences Proceedings. 2022; 21(1):63. https://doi.org/10.3390/environsciproc2022021063
Chicago/Turabian StyleMiglino, Domenico, Seifeddine Jomaa, Michael Rode, Francesco Isgro, and Salvatore Manfreda. 2022. "Monitoring Water Turbidity Using Remote Sensing Techniques" Environmental Sciences Proceedings 21, no. 1: 63. https://doi.org/10.3390/environsciproc2022021063