Proceeding Paper

Nanostructured Bismuth Electrodes for Non-Enzymatic Paracetamol Sensing: Development, Testing, and Computational Approach †

by
Mallikarjun Madagalam
1,
Federica Catania
1,
Mattia Bartoli
2,3,*,
Alberto Tagliaferro
3,4 and
Sandro Carrara
5
1
Faculty of Science and Technology, Free University of Bolzano-Bozen, Piazza Università 1, 39100 Bolzano, Italy
2
Center for Sustainable Future Technologies @POLITO, Istituto Italiano di Tecnologia, Via Livorno 60, 10144 Turin, Italy
3
National Consortium for Materials Science and Technology (INSTM), Via G. Giusti 9, 50121 Florence, Italy
4
Department of Applied Science and Technology, Politecnico di Torino, C.so Duca degli Abruzzi 24, 10129 Turin, Italy
5
Bio/CMOS Interfaces Group, ICLAB, EPFL, CH-2002 Neuchâtel, Switzerland
*
Author to whom correspondence should be addressed.
Presented at the 1st International Electronic Conference on Chemical Sensors and Analytical Chemistry, 1–15 July 2021; Available online: https://csac2021.sciforum.net/.
Chem. Proc. 2021, 5(1), 33; https://doi.org/10.3390/CSAC2021-10427
Published: 30 June 2021

Abstract

:
In this work, new Screen Printed Carbon-paste Electrodes (SPCEs) were developed through deposition of nanostructures of HO–BiONO3 synthesized with or without surfactant additions. We performed a cyclic voltammetry study showing the improvement in performance of bismuth tailored electrodes for paracetamol sensing compared with bare SPCE. A computation study was also performed for investigating the interaction between paracetamol and bismuth species during the electron transfer process enlighten the preferential sites of interaction on the surface of modified SPEs.

1. Introduction

Paracetamol is among the most studied emerging pollutants [1] and one of the most used antipyretic drugs in the world [2]. Accordingly, the development of a new trustworthy paracetamol detection system is a key pillar in the sensors field for personalized therapy and for developing environmental monitoring. Among all available approaches, electrochemical techniques are the most useful considering production-cost, sensibility and reproducibility of sensing technologies [3]. The development of new electrode materials for paracetamol detection has attracted more interest in recent years. To improve the sensing performance, several studies used modified carbon electrodes tailored with several nanostructured materials [2,3]. Recently, Madagalam et al. [4] reported a new SPCE decorated with bismuth sub-nitrate as an effective electrochemical sensor for paracetamol detection. The choice of bismuth was driven by the great tuneability of bismuth species [5], together with its remarkable electrochemical performances [6,7].
Here, we move a step forward in the comprehension of the paracetamol detection by using bismuth tailored SPCEs through a computational study. Accordingly, we report a solid approach for the calculation of electron transfer rate with new structural information of transitional state geometry of paracetamol–bismuth sub-nitrate system.

2. Materials and Methods

2.1. Materials

Bismuth nitrate pentahydrate (Bi(NO3)3·5H2O), 1-butanol, and Polyethylene glycol (PEG) were used for material synthesis at Politecnico di Torino, Italy. Phosphate buffer saline (PBS), DI water, and paracetamol tablets made into powder were used for the preparation of material suspensions and electrolytic solution at EPFL, Neuchatel, Switzerland.

2.2. Methods

2.2.1. Material Synthesis and Modification of SPCEs

HO–BiONO3 was synthesized According to Liu et al. [8] and by the modified synthesis reported by Madagalam et al. [4]. SPCEs were prepared according to the procedure described in [4]. A SPCEs consisting on a working electrode and a counter electrode in carbon, and a reference electrode in silver/silver-chloride is presented in this study.

2.2.2. Electrochemical Measurements

Cyclic Voltammetry measurements (CV) were performed under atmospheric conditions using AutoLab potentiostat and run accordingly with the procedure described in [4]. For an electrochemically reversible electron transfer process involving freely diffusing redox species, the Randles–Sevcik equation [9] describes the linear increase of the peak current ip (A) with the square root of the scan rate ν (V/s):
i p = 0.466 n F A C ( n F ν D R T ) 1 2 ,
where n is the number of electrons transferred in the redox reaction, A (cm2) is the electrode geometric surface area, D (cm2/s) is the diffusion coefficient of the oxidized analyte, and C (mol/cm3) is the bulk concentration of the analyte. The Randles–Sevcik equation (Equation (1)) is used to deduce the analyte behavior identifying the two scenarios when it is freely diffusing in solution or adsorbed on the surface of the electrode.
Kinetic parameters were calculated using the Laviron model [10], where the peak potentials are described as follows, with the cathodic peak potential being:
E p c = E 0 ( R T α n F ) l n [ α | m | ]
and the anodic peak potential being:
E p a = E 0 + ( R T ( 1 α ) n F ) l n [ ( 1 α ) | m | ]
with m = (RT/F) (k/nν). R is the universal gas constant, n is the number of electrons involved in the redox reaction, T is the absolute temperature in Kelvin, F is the Faraday constant, ν is the scan rate, and E0 is the surface standard potential. The kinetic rate constant k was calculated by substituting α value into the following equation:
ln ( k ) = α ln ( 1 α ) + ( 1 α ) l n α l n ( R T n F ν ) α ( 1 α ) n F Δ E p R T

2.2.3. Modelling

Computational simulations were run with HyperChem (HC) software using the following procedure.
A 3D structure is obtained in HC by the function model build for both paracetamol and Bi clusters. Then, the simulations started to evaluate the electronic properties and the geometry information required in the generalized Marcus model. Therefore, the potential energy must be minimized with respect to the system coordinated by means of geometry optimization. This is done by evaluating the potential energy as function of molecules coordinates according to a hybrid quantum/molecular mechanics approach (MM+) [11]. Then, a second simulation was run in line with the neglect of differential diatomic overlap approximation (PM3 basis set) [12]. Two different Bi clusters model the polymeric layer as shown in Figure 1.
The dimer was assumed to be the minimum unit allowing the electron transfer (ET). Indeed, ET is depicted through two Bi–C “fake bonds” as shown in Figure 2 by supposing that each couple exchanges just one electron and the two charged particles are simultaneously acquired from paracetamol [1].
The Figure 2 represents one of the hypothesized transition states (HTS) geometry. Indeed, the transitional state (TS) is identified as a unique crossing point in the potential energy surface (PES) defining the reaction coordinates of both reactants and products [13]. However, according to Tachiya et al. [14] the TS is not uniquely defined since it depends on the probability to achieve a certain value of the electrostatic potential distribution. For that reason, it is necessary to talk about “hypothetical” TS. Moreover, it is observed after each simulation that the interaction distance between each Bi–C couple is not equal:, the system is asymmetric, thus the average between the interaction distance is kept within the model according to the procedure reported in [14]. Afterwards, the simulations were repeated for the Bi trimer. The geometry optimization was performed two times in both cases by cutting the “fake bonds” before starting the second simulation. The solvation effect arising from the electrolyte wetting the electrode at the interface with the organic compound was considered as well. It was modelled by adding water molecules surrounding paracetamol and it was established that the ET would be ensured by a minimum amount of five molecules. Finally, the HTS in which the nitric functional groups in both dimer and trimer were replaced by hydroxyl group by supposing that the functionalized electrode undergone a cleaning pre-treatment in H2SO4 was simulated. The electron transfer rate constant in a CdS-Phenol system was analyzed to validate our model. According to Serpone et al. [15], we simulated the electrochemical redox process between a CdS powder and a phenol molecule in solution by defining a box containing water molecules, as shown in Figure 2. All of them were mirrored outside the box by reproducing the system in solution. The obtained ET rate constant was k = 6.42 · 10 5   s 1 , in compliance with the literature constant ( k = 5.17 · 10 5   s 1 ).

3. Results and Discussion

3.1. Electrochemical Measurements

SPCEs modified sensors were tested by Madagalam et al. [4] through CV and main data are summarized in Table 1.
The peaks detected during CV without and with paracetamol were distinguishable and confirmed that we observed higher peak currents when there was paracetamol in the electrolytic solution. PEG-coated HO–BiONO3 sensor was found to have a potential shift of −75 mV, whereas HO–BiONO3 sensor has a shift of −26 mV due to Nernst effect compared to the bare SPCE sensor. PEG-coated HO–BiONO3 sensor was also found to have a higher oxidation peak current of 52.1 ± 3.0 μA. To study the behavior of the electrochemical system, CVs were run by varying the scan rate (50 mV/s–300 mV/s) while determining 1 mM paracetamol in 0.1 M PBS at pH 7. It was observed that the peak position changed by increasing the scan rate while the redox current increased linearly with the square root of the scan rate. From these observations and Equation (1), it was possible to give an indication that the electrochemical system was a freely diffusing quasi-reversible system. By plotting peak positions (Epa, Epc) versus ln(ν), a linear variation was observed and peak-to-peak separation (ΔEp) increased linearly with ln(ν). According to Equations (2) and (3), it was found that n is approximately equal to 2 meaning that two electrons were participating in the redox reaction of paracetamol as reported in [1]. The α values are listed in Table 1 for different sensors together with the k values obtained at a scan rate of 100 mV/s for three different sensors. PEG-coated HO–BiONO3 sensor had a higher rate constant of 42.0 ± 9.8 ms−1 with lower ΔEp of 243 ± 10 mV compared to other sensors. This is a big advantage compared to the SPCE sensor since a higher rate constant gives rise to faster electrochemical reaction and lower ΔEp indicates a higher possibility of a reversible reaction (low resistance). Quantitative studies run by CVs measurements showed a higher sensitivity for PEG-coated HO–BiONO3 compared with bare SPCE due to the nanostructure deposited on the surface [4].

3.2. Computational Evaluation
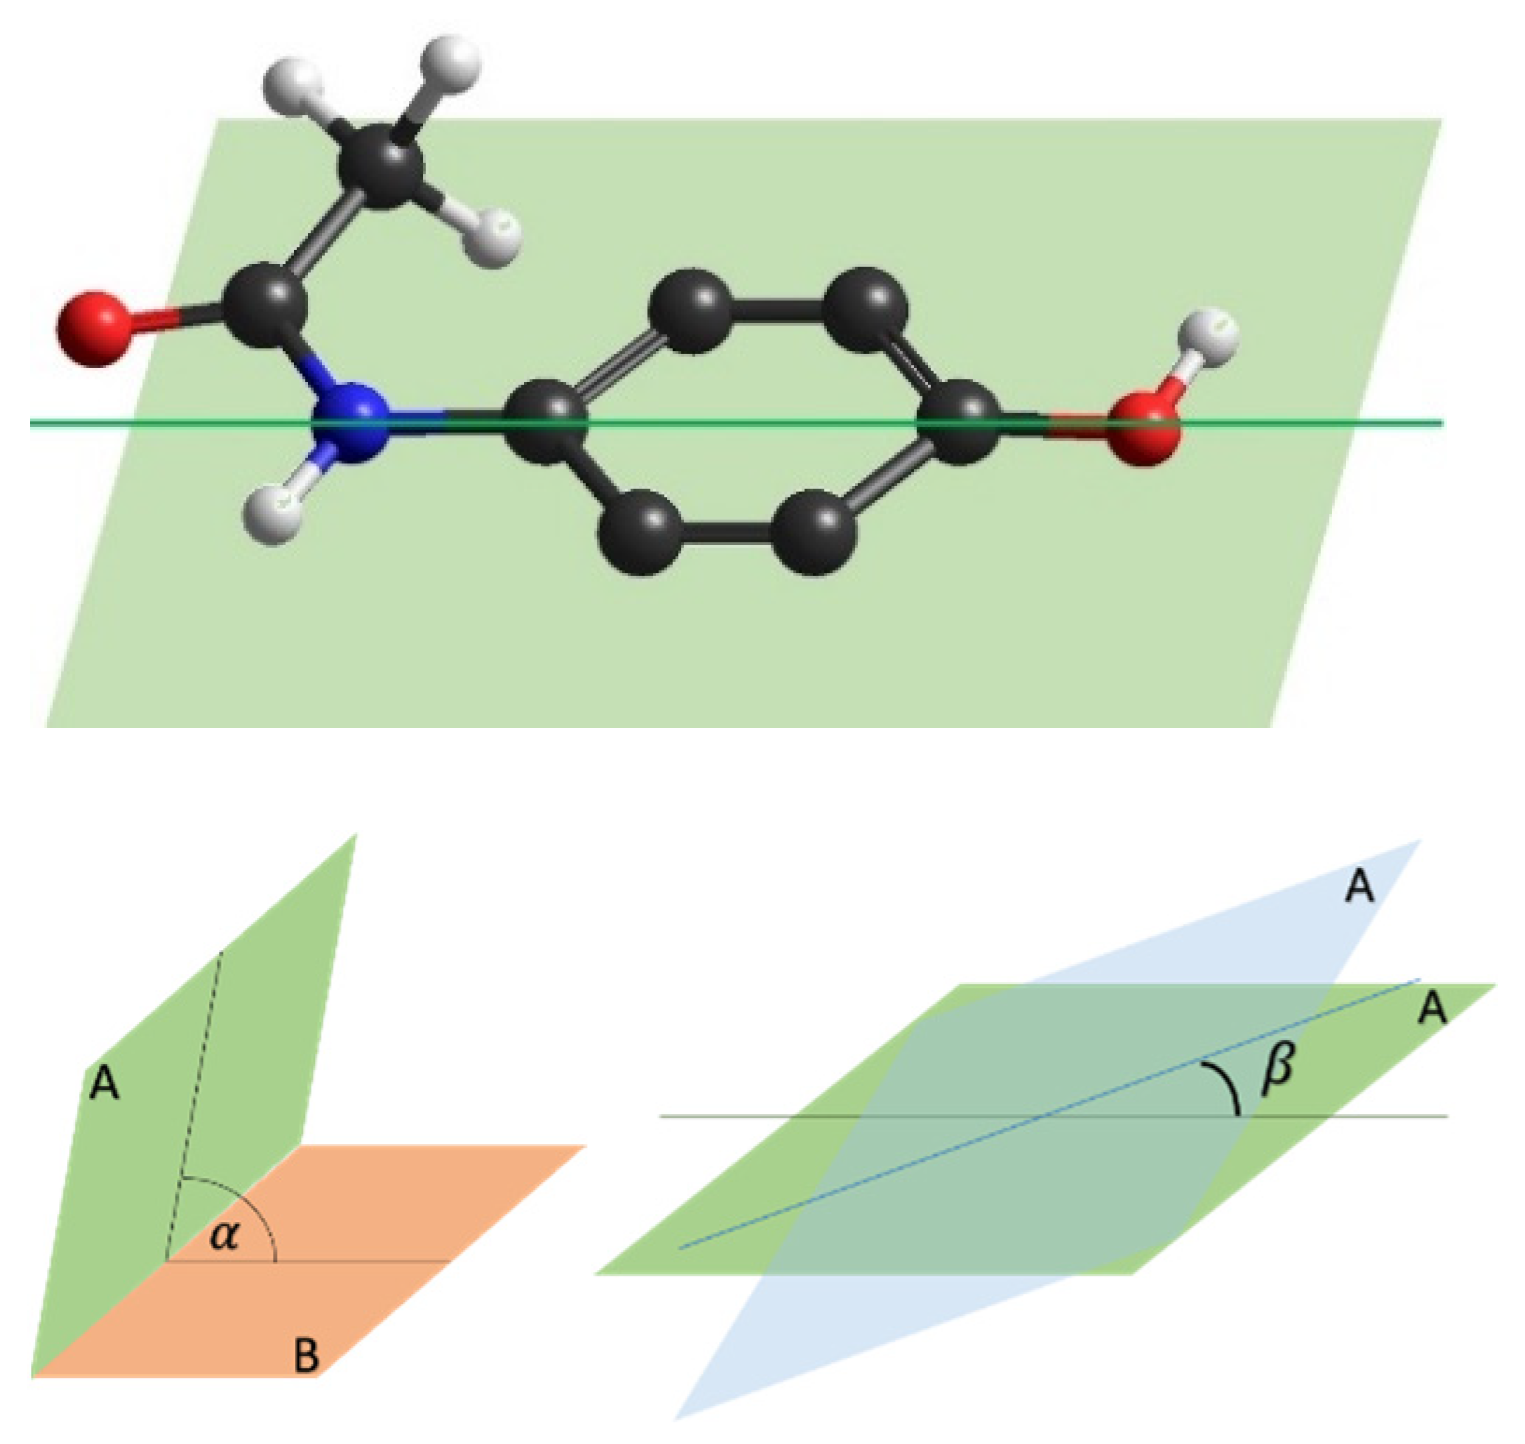
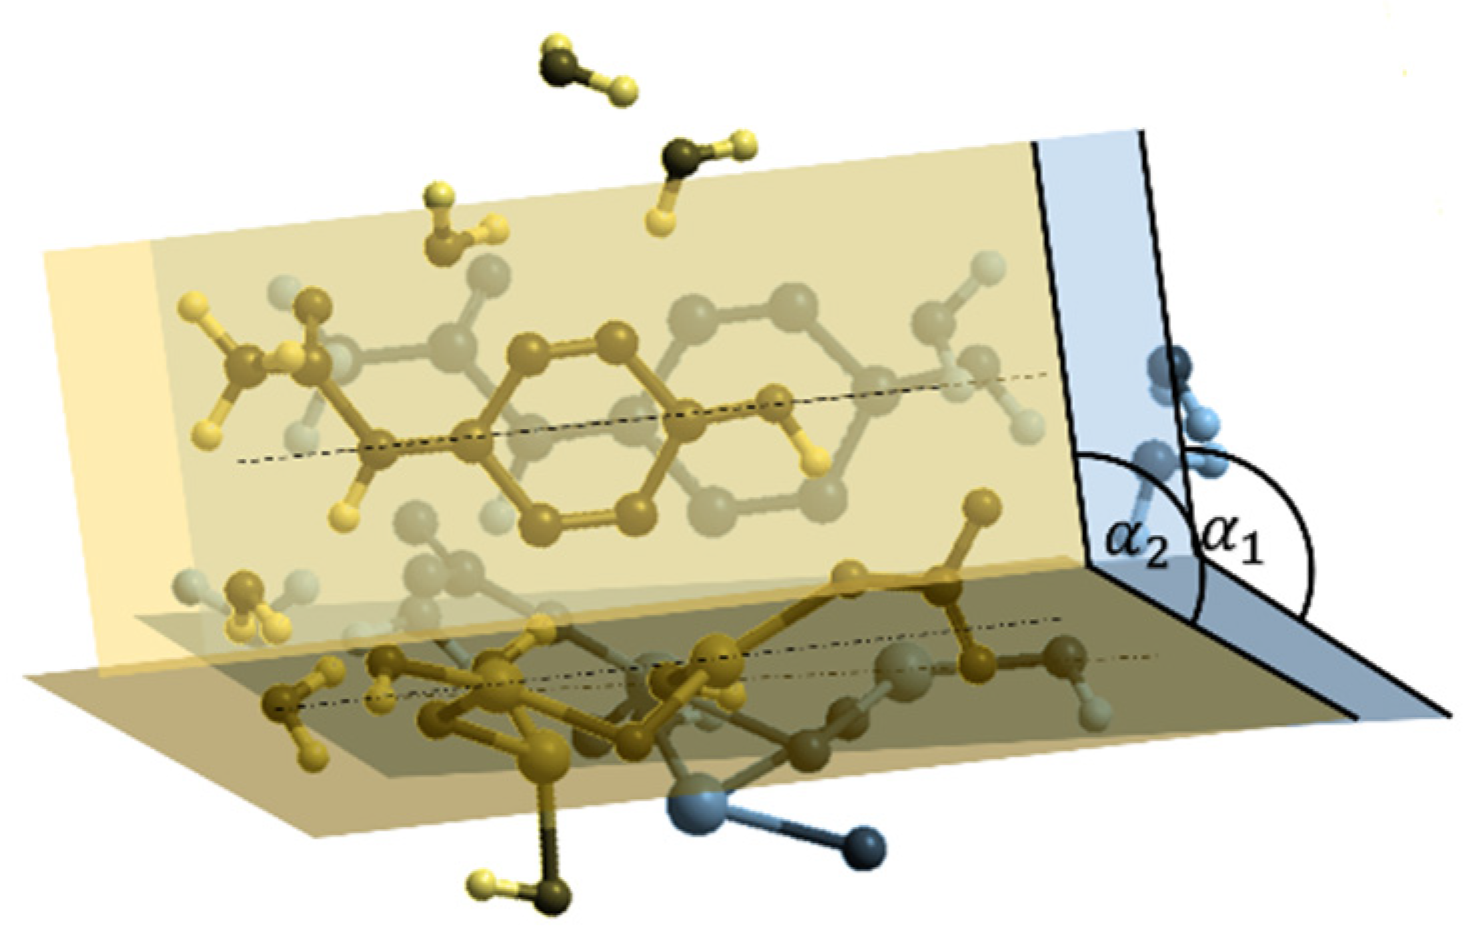
The electron transfer rate constant values coming from the computational simulations are presented in the following sections by underlying the affecting parameters on the transition state for both the HO–BiONO3 dimer and trimer cases. A geometrical scheme as shown in Figure 3 acts as reference to describe the variations in the hypothetical transition state conformation depending on the functional groups bonded to the Bi active atoms. According to the assumption that paracetamol interacts with Bi cluster through its two carbon atoms, we can define:
(1)
The symmetric axis passing through the organic compound C atoms that is a C2 axis since the symmetry is maintained by a rotation of 180°
(2)
The paracetamol plane A of symmetry on which the C ring lies that is a reflection plane
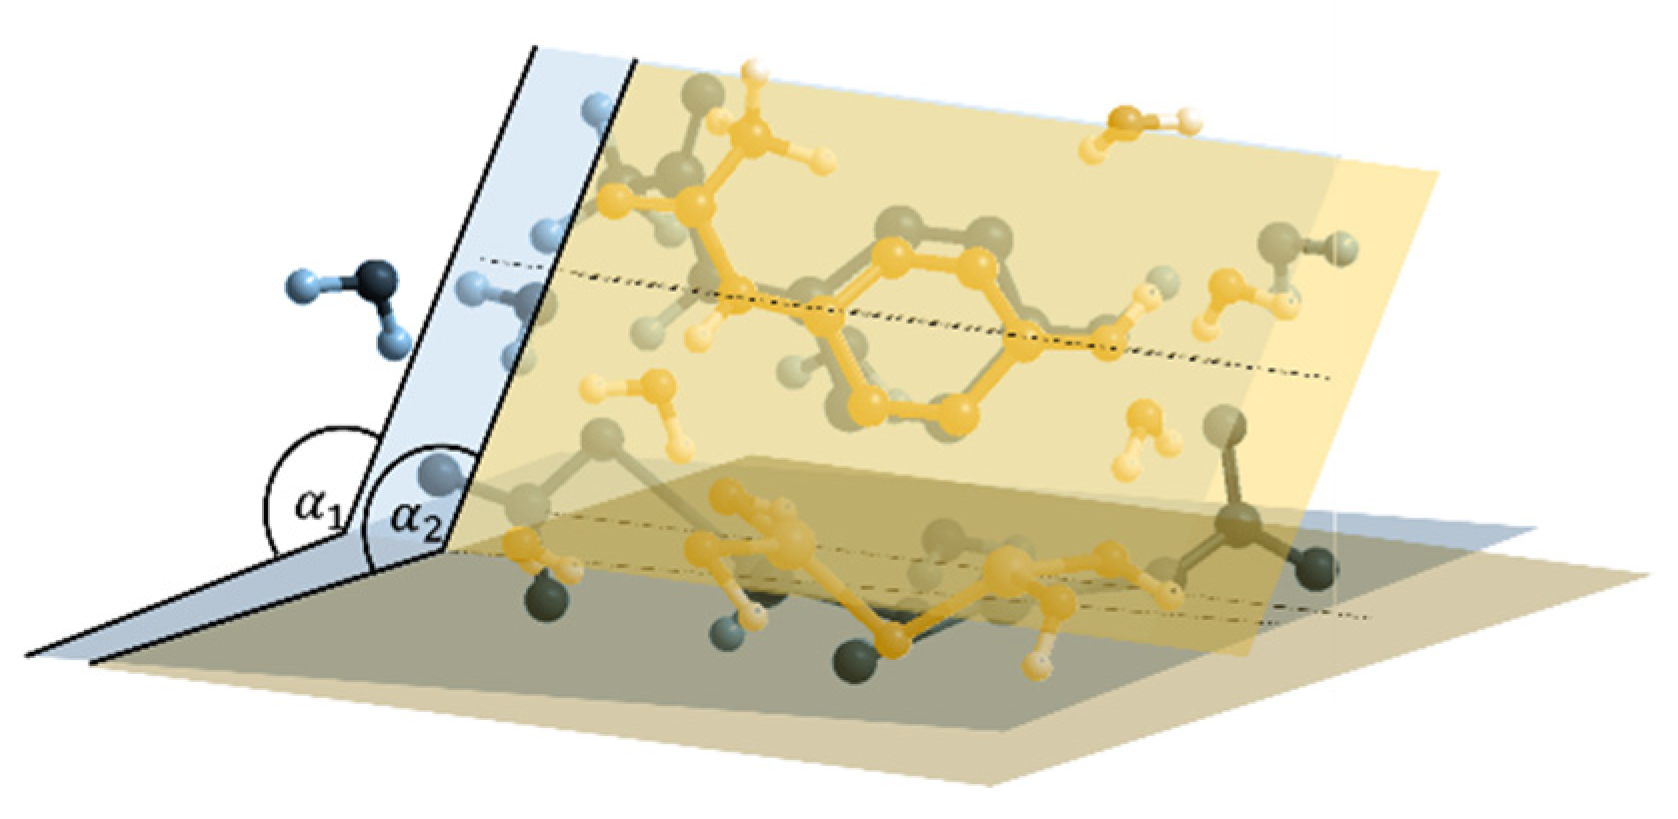
(3)
A second plane B on which the active Bi atoms lie
(4)
The dihedral angle α between these two planes
(5)
The angle β defining the rotation of the paracetamol plane with respect to its symmetric axis.

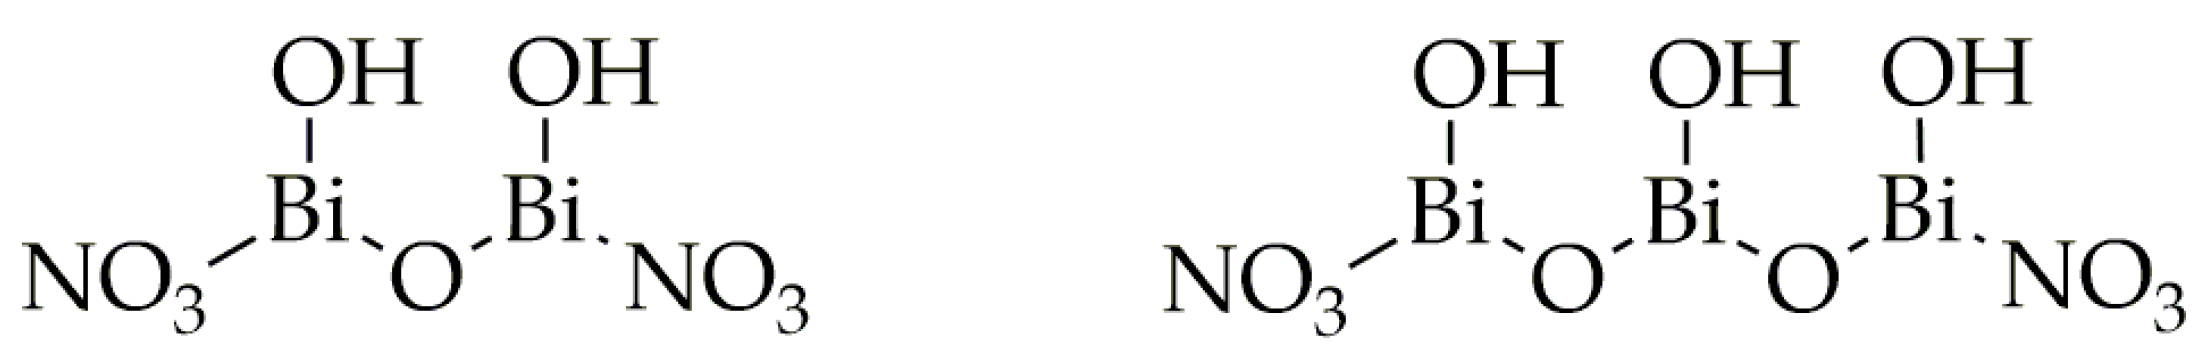
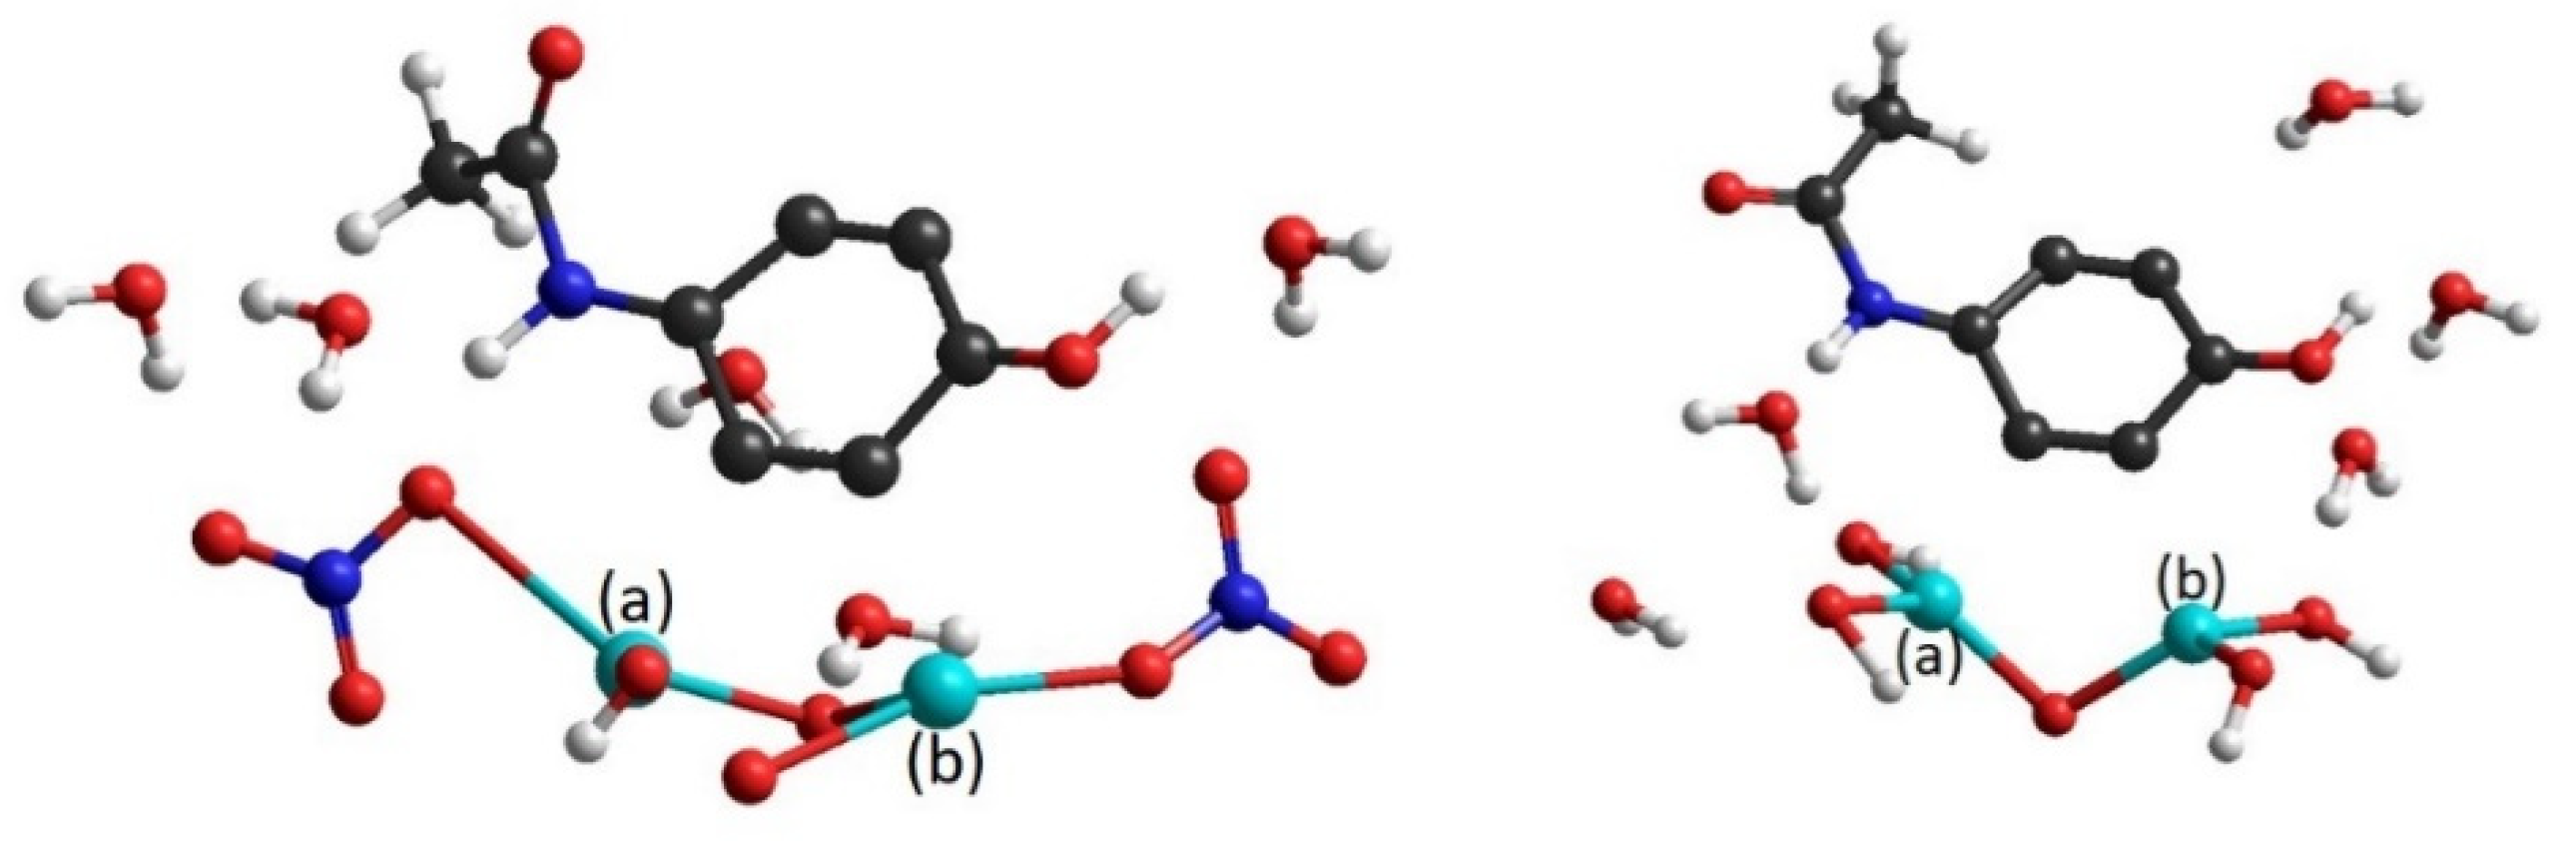
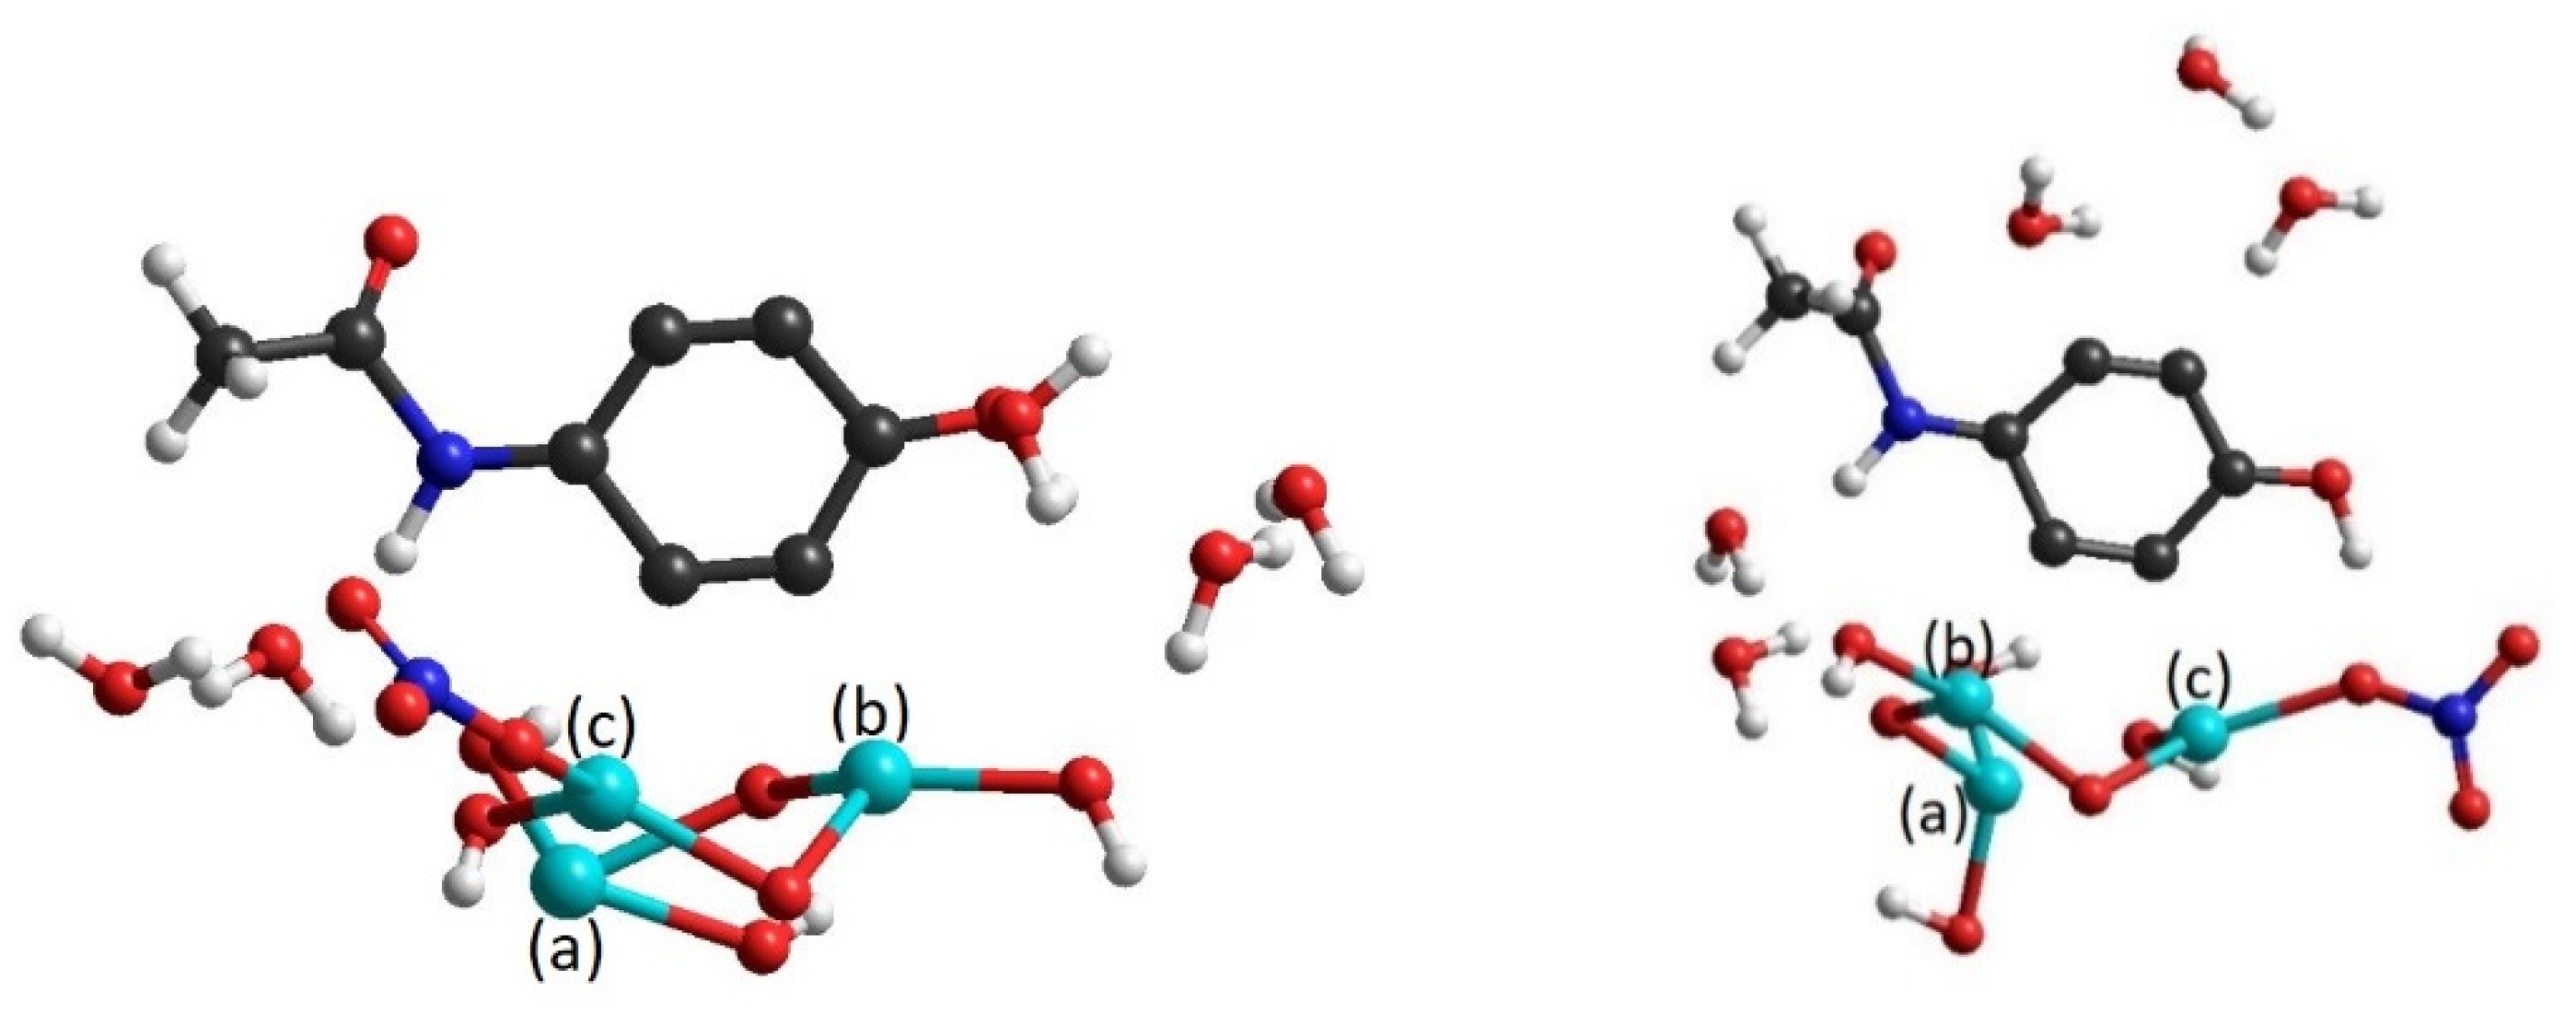
3.2.1. HO–BiONO3 Dimers

All the results are shown in Table 2. The different cases are labelled with the functional groups bonded to the two Bi atoms.
We firstly evaluated the characteristics of symmetric dimers with two nitric or hydroxylic groups as shown in Figure 4. In both cases, the electron transfer rate constant is of the order of magnitude of 10−3 s−1 a factor of 2 higher in the hydroxylic groups case. The activation energy difference is about 15%. This is reasonable, as the dihedral angle was slightly greater in NO3-NO3 than OH-OH by fixing the angle β, as can be seen in Figure 5. However, paracetamol approaching is hugely affected by the two functional groups. Indeed, the NO3 group bonded with Bi (a) was above the Bi plane and moved closer to the paracetamol nitro groups by leading to a distortion of the Bi-O bond on that side. The surrounding water molecules improved that distortion and emphasized the steric hindrance. On the other hand, having four identical hydroxylic groups ensured a less steric effect since no strong repulsions between electron clouds can arise in that case.
A second comparison was made between the HTS associated to the two specular Bi-dimers having an OH group and a NO3 alternatively bonded to each Bi atom. In this case, a larger dihedral angle resulted when NO3 was bonded to the right Bi since the interaction with the paracetamol OH-group lead the nitric group position above the Bi plane. This also resulted in an ET rate constant equals to 6.9 10 3   s 1 which is smaller than the NO3-OH by a factor of 4. Regarding the activation energy, a difference of only 4% was obtained since the structures involved are the same in terms of atoms. From these simulations, we realized that having hydroxyl groups could enhance the sensing properties of the functionalized layer despite the steric effect arising from neighboring nitric groups.

3.2.2. HO–BiONO3 Trimer

All the results are shown in Table 3. The different cases are labelled with the functional groups bonded to the three Bi atoms.
When we simulated the HTS associated to the trimer cases, we introduced a further assumption by distinguishing among the reacting Bi atoms and the non-reacting ones since just two Bi atoms are supposed to interact with the paracetamol C atoms. Based on that, we observed that the steric effect was more evident in the NO3-OH-NO3 structure due to the orientation of the nitric group bonded with the non-reacting Bi atom towards the nitro group of the organic compound. On the contrary, no distortion occurs in the NO3-NO3-NO3 because the functional groups bonded with reacting Bi lie in the same plane. However, lower activation energy of the transition state made the NO3-OH-NO3 more energetically favorable to the ET process and further confirmed that the presence of some OH groups should improve the efficiency of the ET process. Indeed, the ET rate constant was three orders of magnitude greater in NO3-OH-NO3 case than the NO3-NO3-NO3 case.
Finally, the specular case for the trimer was simulated by replacing the two nitric groups with hydroxyl as shown in Figure 6. We observed that NO3-OH-OH was strongly affected by the orientation of NO3 above the Bi plane towards the paracetamol nitro group that is also above the Bi plane. Nevertheless, no distortion occurred, and it can be seen in Figure 7 that the dihedral angle was qualitatively the same as for the OH–OH–NO3 case. These also let to ET values in the two specular trimers with a difference less than 2% and geometries with very similar the dihedral angles. Indeed, we obtained a value of 9.16 eV for NO3–OH–OH and 9.87 eV for OH–OH–NO3.

4. Conclusions

As clearly shown from the data, the electrochemical sensing boost observed for HO–BiONO3 tailored SPCEs is likely due to defective sites on HO–BiONO3 particles sitting on the surface of the electrode. The hydroxyl functionalities played a relevant role in the paracetamol–bismuth interaction that defines the geometry of the transitional state as showed by the computational study. Accordingly, a more polar surface induced a better interaction with paracetamol.
This study has firstly described in a comprehensive way the effect of bismuth subnitrate chemistry in an electrochemical system considering both empirical and experimental data sets, leading to the foundation for a rational design of bismuth modified SPCEs.

Supplementary Materials

The following are available online at https://www.mdpi.com/article/10.3390/CSAC2021-10427/s1.

Author Contributions

Conceptualization, A.T., S.C. and M.B.; formal analysis, M.M. and F.C.; resources, A.T. and S.C.; data curation, M.M. and F.C.; writing—original draft preparation, M.M., F.C. and M.B.; writing—review and editing, M.M., F.C., M.B., A.T. and S.C.; supervision, M.B.; project administration, A.T. and S.C. All authors have read and agreed to the published version of the manuscript.

Funding

This research received no external funding.

Conflicts of Interest

The authors declare no conflict of interest.

References

  1. Kang, X.; Wang, J.; Wu, H.; Liu, J.; Aksay, I.A.; Lin, Y. A graphene-based electrochemical sensor for sensitive detection of paracetamol. Talanta 2010, 81, 754–759. [Google Scholar] [CrossRef] [PubMed]
  2. Li, J.; Liu, J.; Tan, G.; Jiang, J.; Peng, S.; Deng, M.; Qian, D.; Feng, Y.; Liu, Y. High-sensitivity paracetamol sensor based on Pd/graphene oxide nanocomposite as an enhanced electrochemical sensing platform. Biosens. Bioelectron. 2014, 54, 468–475. [Google Scholar] [CrossRef] [PubMed]
  3. Li, M.; Wang, W.; Chen, Z.; Song, Z.; Luo, X. Electrochemical determination of paracetamol based on Au@ graphene core-shell nanoparticles doped conducting polymer PEDOT nanocomposite. Sens. Actuators B Chem. 2018, 260, 778–785. [Google Scholar] [CrossRef]
  4. Madagalam, M.; Bartoli, M.; Tagliaferro, A.; Carrara, S. Bismuth-nanocomposites modified SPCEs for non-enzymatic electrochemical sensors. IEEE Sens. J. 2021, 21, 11155–11162. [Google Scholar] [CrossRef]
  5. Bartoli, M.; Jagdale, P.; Tagliaferro, A. A Short Review on Biomedical Applications of Nanostructured Bismuth Oxide and Related Nanomaterials. Materials 2020, 13, 5234. [Google Scholar] [CrossRef] [PubMed]
  6. Aliakbarinodehi, N.; Taurino, I.; Pravin, J.; Tagliaferro, A.; Piccinini, G.; De Micheli, G.; Carrara, S. Electrochemical nanostructured biosensors: Carbon nanotubes versus conductive and semi-conductive nanoparticles. Chem. Pap. 2015, 69, 134–142. [Google Scholar] [CrossRef]
  7. Đurđić, S.; Vukojević, V.; Vlahović, F.; Ognjanović, M.; Švorc, Ľ.; Kalcher, K.; Mutić, J.; Stanković, D.M. Application of bismuth (III) oxide decorated graphene nanoribbons for enzymatic glucose biosensing. J. Electroanal. Chem. 2019, 850, 113400. [Google Scholar] [CrossRef]
  8. Liu, G.-Q.; Zhong, H.; Li, X.-R.; Yang, K.; Jia, F.-F.; Cheng, Z.-P.; Zhang, L.-L.; Yin, J.-Z.; Guo, L.-P.; Qian, H.-Y. Research on nonenzymatic electrochemical sensor using HO-BiONO3 nanocomposites for glucose detection. Sens. Actuators B Chem. 2017, 242, 484–491. [Google Scholar] [CrossRef]
  9. Bard, A.J.; Faulkner, L.R. Electrochemical Methods Fundamentals and Applications; Wiley: New York, NY, USA, 2001. [Google Scholar]
  10. Laviron, E. General expression of the linear potential sweep voltammogram in the case of diffusionless electrochemical systems. J. Electroanal. Chem. Interfacial Electrochem. 1979, 101, 19–28. [Google Scholar] [CrossRef]
  11. Brunk, E.; Rothlisberger, U. Mixed Quantum Mechanical/Molecular Mechanical Molecular Dynamics Simulations of Biological Systems in Ground and Electronically Excited States. Chem. Rev. 2015, 115, 6217–6263. [Google Scholar] [CrossRef] [PubMed]
  12. Stewart, J.J.P. Optimization of parameters for semiempirical methods I. Method. J. Comput. Chem. 1989, 10, 209–220. [Google Scholar] [CrossRef] [Green Version]
  13. Marcus, R.A. Chemical and electrochemical electron-transfer theory. Annu. Rev. Phys. Chem. 1964, 15, 155–196. [Google Scholar] [CrossRef]
  14. Tachiya, M. Generalization of the Marcus equation for the electron-transfer rate. J. Phys. Chem. 1993, 97, 5911–5916. [Google Scholar] [CrossRef]
  15. Serpone, N.; Maruthamuthu, P.; Pichat, P.; Pelizzetti, E.; Hidaka, H. Exploiting the interparticle electron transfer process in the photocatalysed oxidation of phenol, 2-chlorophenol and pentachlorophenol: Chemical evidence for electron and hole transfer between coupled semiconductors. J. Photochem. Photobiol. A Chem. 1995, 85, 247–255. [Google Scholar] [CrossRef]
Figure 1. BiONO3 dimer on the left and BiONO3 trimer on the right.
Chemproc 05 00033 g001
Figure 2. Transition state model: the double dashed lines on paracetamol defined the chemical bonds involved in the reaction while the single ones defined the Bi–C “fake bonds” through which the ET occurs.
Chemproc 05 00033 g002
Figure 3. Paracetamol geometrical description on the left showing the symmetrical axis C2 (right); dihedral angle is defined as the angle between the plane A (green) on which the paracetamol carbon ring lies and the plane B (orange) passing through the Bi atoms (center); description of paracetamol plane rotation of an angle β with respect to the symmetric axis (left).
Chemproc 05 00033 g003
Figure 4. Molecular conformation of the HTS associated to the dimer case NO3–NO3 on the left and OH–OH on the right and two bismuth atoms (named a and b respectively).
Chemproc 05 00033 g004
Figure 5. Overlapped molecular structure of HTS associated to the dimer NO3–NO3 (blue planes) and OH–OH (yellow planes): α angles comparison at fixed β.
Chemproc 05 00033 g005
Figure 6. Molecular conformation of the HTS associated to the dimer case NO3–OH–OH on the left and OH–OH–NO3 on the right and three bismuth atoms (named a, b and c respectively).
Chemproc 05 00033 g006
Figure 7. Overlapped molecular structure of HTS associated to the dimer OH–OH–NO3 (blue planes) and NO3–OH–OH (yellow planes): α angles comparison at fixed β.
Chemproc 05 00033 g007
Table 1. Main experimental outputs from electrochemical measurements of bare and tailored SPCEs.
Working ElectrodePeak Position (mV)Peak Current
(μA)
αΔEp
(mV)
k
(ms−1)
Sensitiviy
(μA/mM)
Detection
Limit (μM)
SPCE459.9 ± 1.033.1 ± 1.50.44 ± 0.10477 ± 450.60 ± 0.3320.02 ± 0.232.34± 0.03
HO–BiONO3433.6 ± 6.142.0 ± 1.50.45 ± 0.04392 ± 192.20 ± 0.8234.88 ± 0.152.79 ± 0.01
PEG HO–BiONO3385 ± 3052.1 ± 3.00.40 ± 0.04243 ± 1042.0 ± 9.843.50 ± 0.542.24 ± 0.03
Table 2. Electron transfer rate constant and activation energy for Bi dimers.
Dimer k   ( s 1 ) Activation   Energy   ( e V )
NO3-NO3 1.2 · 10 3 9.3
OH-OH 2.6 · 10 3 10.89
OH-NO3 6.9 · 10 3 7.74
NO3-OH 2.78 · 10 2 7.46
Table 3. k and activation energy for Bi trimers.
Trimer k   ( s 1 ) Activation   Energy   ( e V )
NO3-NO3-NO3 7.08 · 10 5 7.34
NO3-OH-NO3 5.9 · 10 2 5.75
NO3-OH-OH 8.46 · 10 2 9.16
OH-OH-NO3 8.3 · 10 2 9.87
Publisher’s Note: MDPI stays neutral with regard to jurisdictional claims in published maps and institutional affiliations.

