


Graphene Deposited on Glass Fiber Using a Non-Thermal Plasma System
 , , and
Abstract
:1. Introduction
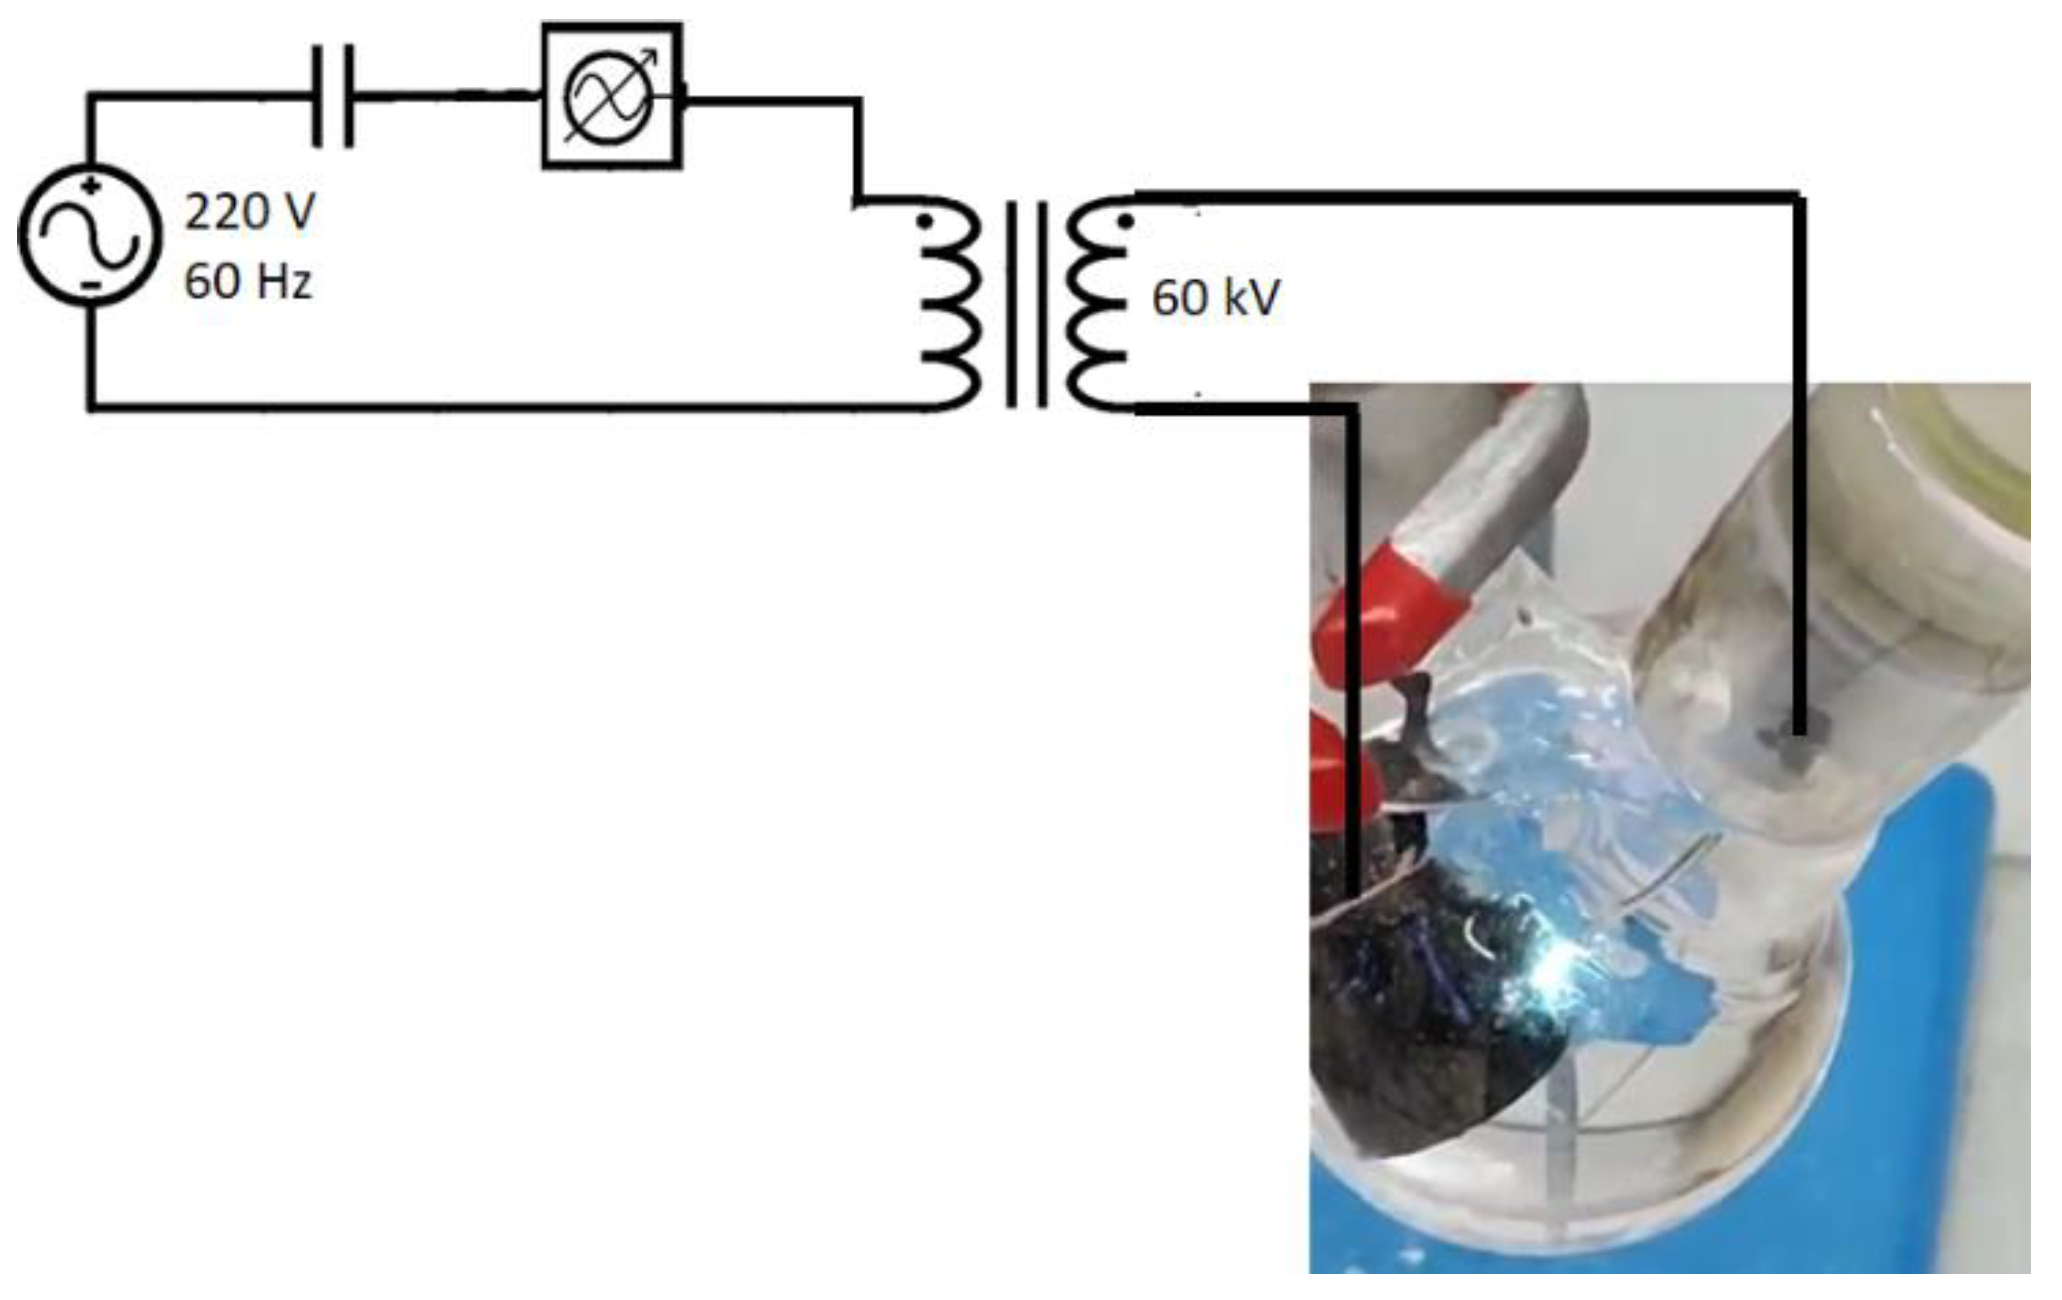
2. Experimental
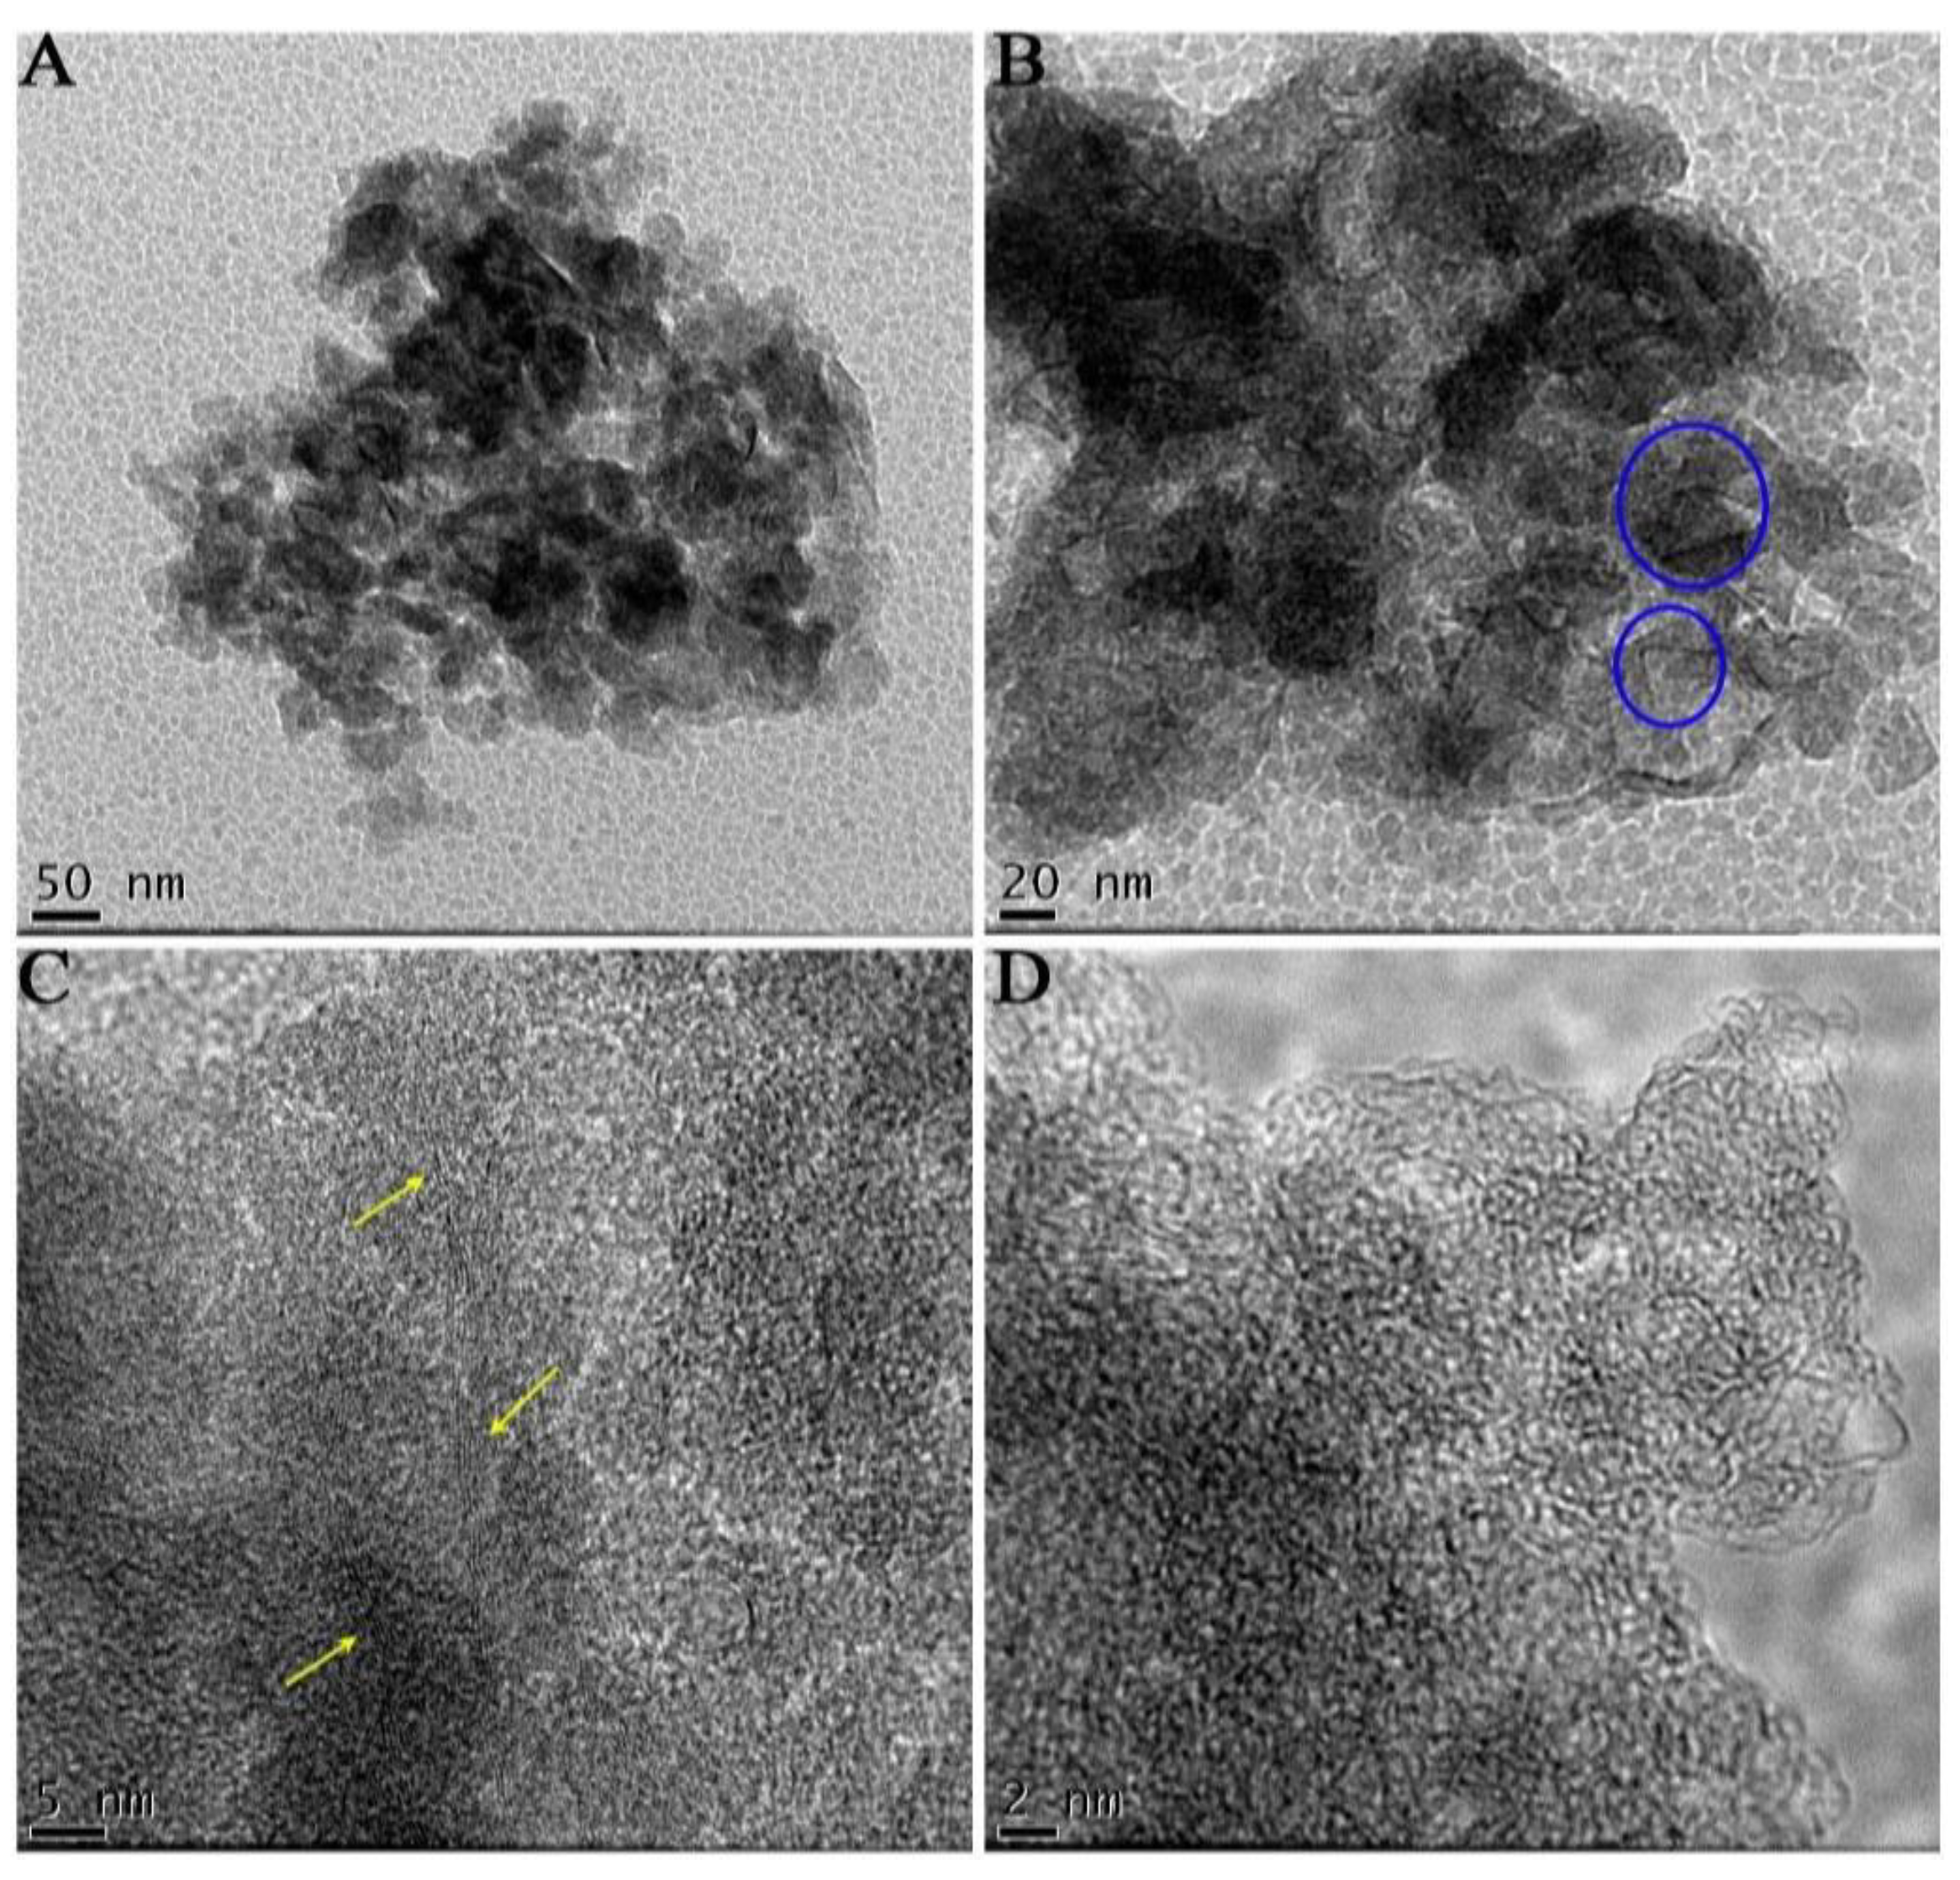
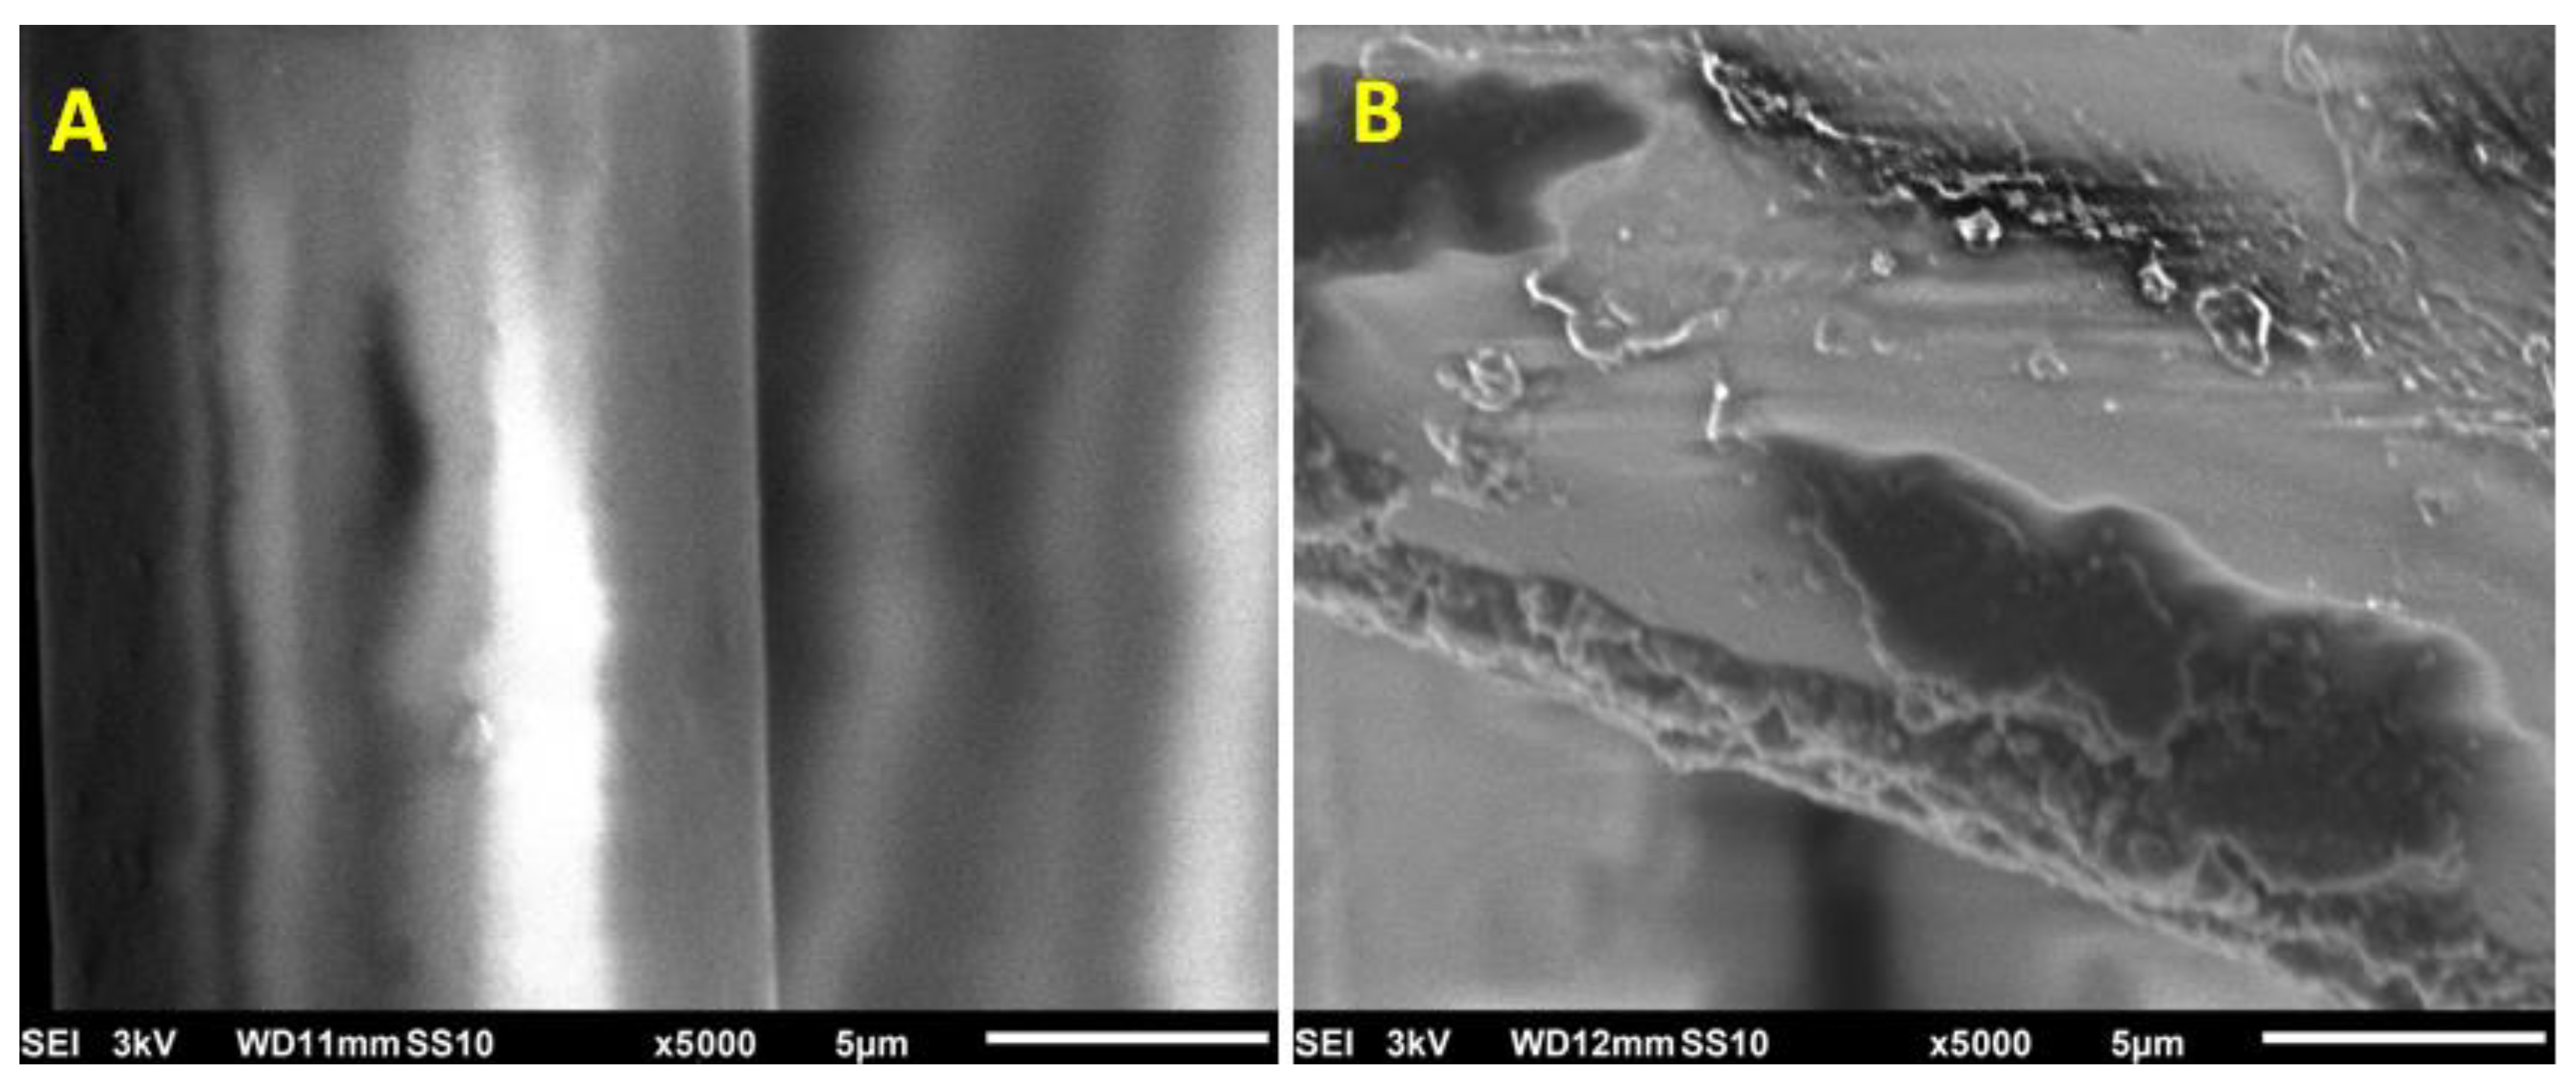
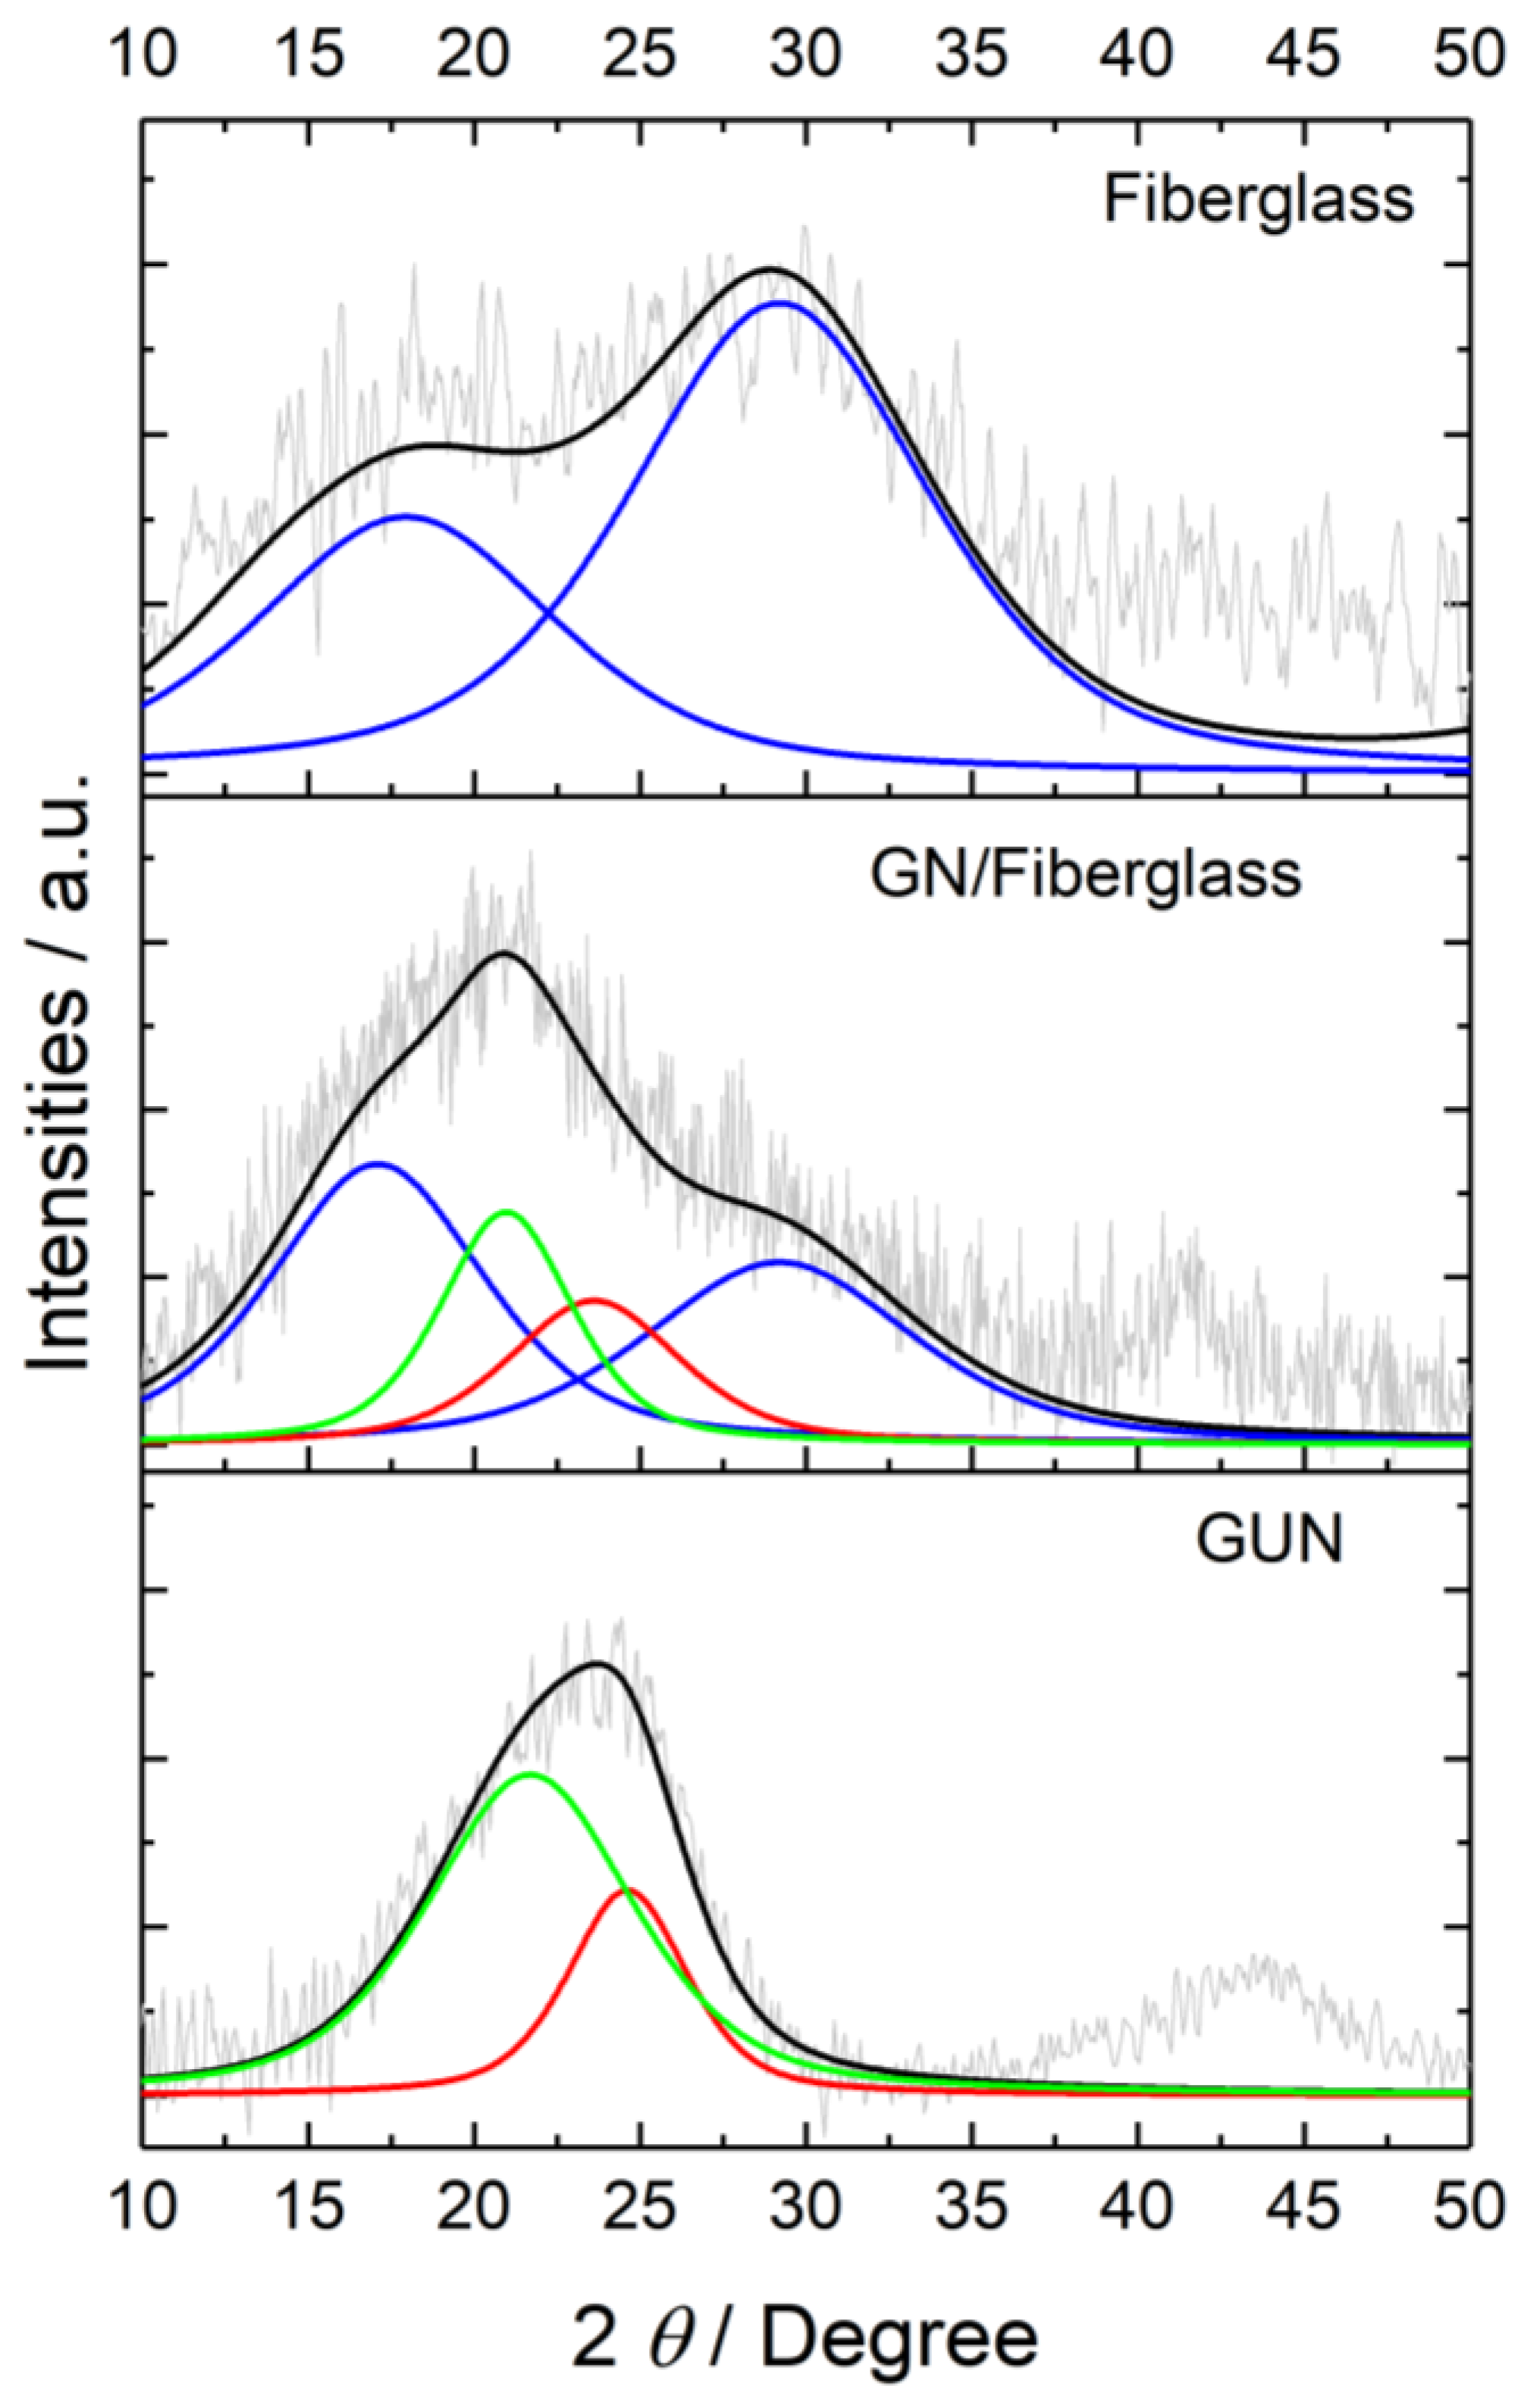
3. Results and Discussion
4. Conclusions
Author Contributions
Funding
Institutional Review Board Statement
Informed Consent Statement
Data Availability Statement
Conflicts of Interest
References
- Antonova, I.V.; Shavelkina, M.B.; Ivanov, A.I.; Soots, R.A.; Ivanov, P.P.; Bocharov, A.N. Graphene Flakes for Electronic Applications: DC Plasma Jet-Assisted Synthesis. Nanomaterials 2020, 10, 2050. [Google Scholar] [CrossRef] [PubMed]
- Zhu, Y.; Qu, B.; Andreeva, D.V.; Ye, C.; Novoselov, K.S. Graphene standardization: The lesson from the East. Mater. Today 2021, 47, 9–15. [Google Scholar] [CrossRef]
- Dato, A. Graphene synthesized in atmospheric plasmas—A review. J. Mater. Res. 2019, 34, 214–230. [Google Scholar] [CrossRef] [Green Version]
- Paton, K.R.; Varrla, E.; Backes, C.; Smith, R.J.; Khan, U.; O’Neill, A.; Boland, C.; Lotya, M.; Istrate, O.M.; King, P.; et al. Scalable production of large quantities of defect-free few-layer graphene by shear exfoliation in liquids. Nat. Mater. 2014, 13, 624–630. [Google Scholar] [CrossRef] [PubMed]
- Chu, J.; Marsden, A.J.; Young, R.J.; Bissett, M.A. Graphene-Based Materials as Strain Sensors in Glass Fiber/Epoxy Model Composites. ACS Appl. Mater. Interfaces 2019, 11, 31338–31345. [Google Scholar] [CrossRef] [Green Version]
- Hadden, C.M.; Klimek-McDonald, D.R.; Pineda, E.J.; King, J.A.; Reichanadter, A.M.; Miskioglu, I.; Gowtham, S.; Odegard, G.M. Mechanical properties of graphene nanoplatelet/carbon fiber/epoxy hybrid composites: Multiscale modeling and experiments. Carbon 2015, 95, 100–112. [Google Scholar] [CrossRef] [Green Version]
- Fang, M.; Xiong, X.; Hao, Y.; Zhang, T.; Wang, H.; Cheng, H.-M.; Zeng, Y. Preparation of highly conductive graphene-coated glass fibers by sol-gel and dip-coating method. J. Mater. Sci. Technol. 2019, 35, 1989–1995. [Google Scholar] [CrossRef]
- Ismail, A.; Zubaydi, A.; Piscesa, B.; Tuswan, T. A novel fiberglass-reinforced polyurethane elastomer as the core sandwich material of the ship–plate system. J. Mech. Behav. Mater. 2023, 32, 20220288. [Google Scholar] [CrossRef]
- Groo, L.; Nasser, J.; Zhang, L.; Steinke, K.; Inman, D.; Sodano, H. Laser induced graphene in fiberglass-reinforced composites for strain and damage sensing. Compos. Sci. Technol. 2020, 199, 108367. [Google Scholar] [CrossRef]
- Gupta, S.; Joshi, P.; Narayan, J. Electron mobility modulation in graphene oxide by controlling carbon melt lifetime. Carbon 2020, 170, 327–337. [Google Scholar] [CrossRef]
- Shavelkina, M.B.; Filimonova, E.A.; Amirov, R.K. Effect of helium/propane–butane atmosphere on the synthesis of graphene in plasma jet system. Plasma Sources Sci. Technol. 2020, 29, 025024. [Google Scholar] [CrossRef]
- De Souza, R.F.B.; Maia, V.A.; Zambiazzi, P.J.; Otubo, L.; Lazar, D.R.R.; Neto, A.O. Facile, clean and rapid exfoliation of boron-nitride using a non-thermal plasma process. Mater. Today Adv. 2021, 12, 100181. [Google Scholar] [CrossRef]
- Zhang, X.; Li, K.; Li, H.; Lu, J.; Fu, Q.; Chu, Y. Graphene nanosheets synthesis via chemical reduction of graphene oxide using sodium acetate trihydrate solution. Synth. Met. 2014, 193, 132–138. [Google Scholar] [CrossRef]
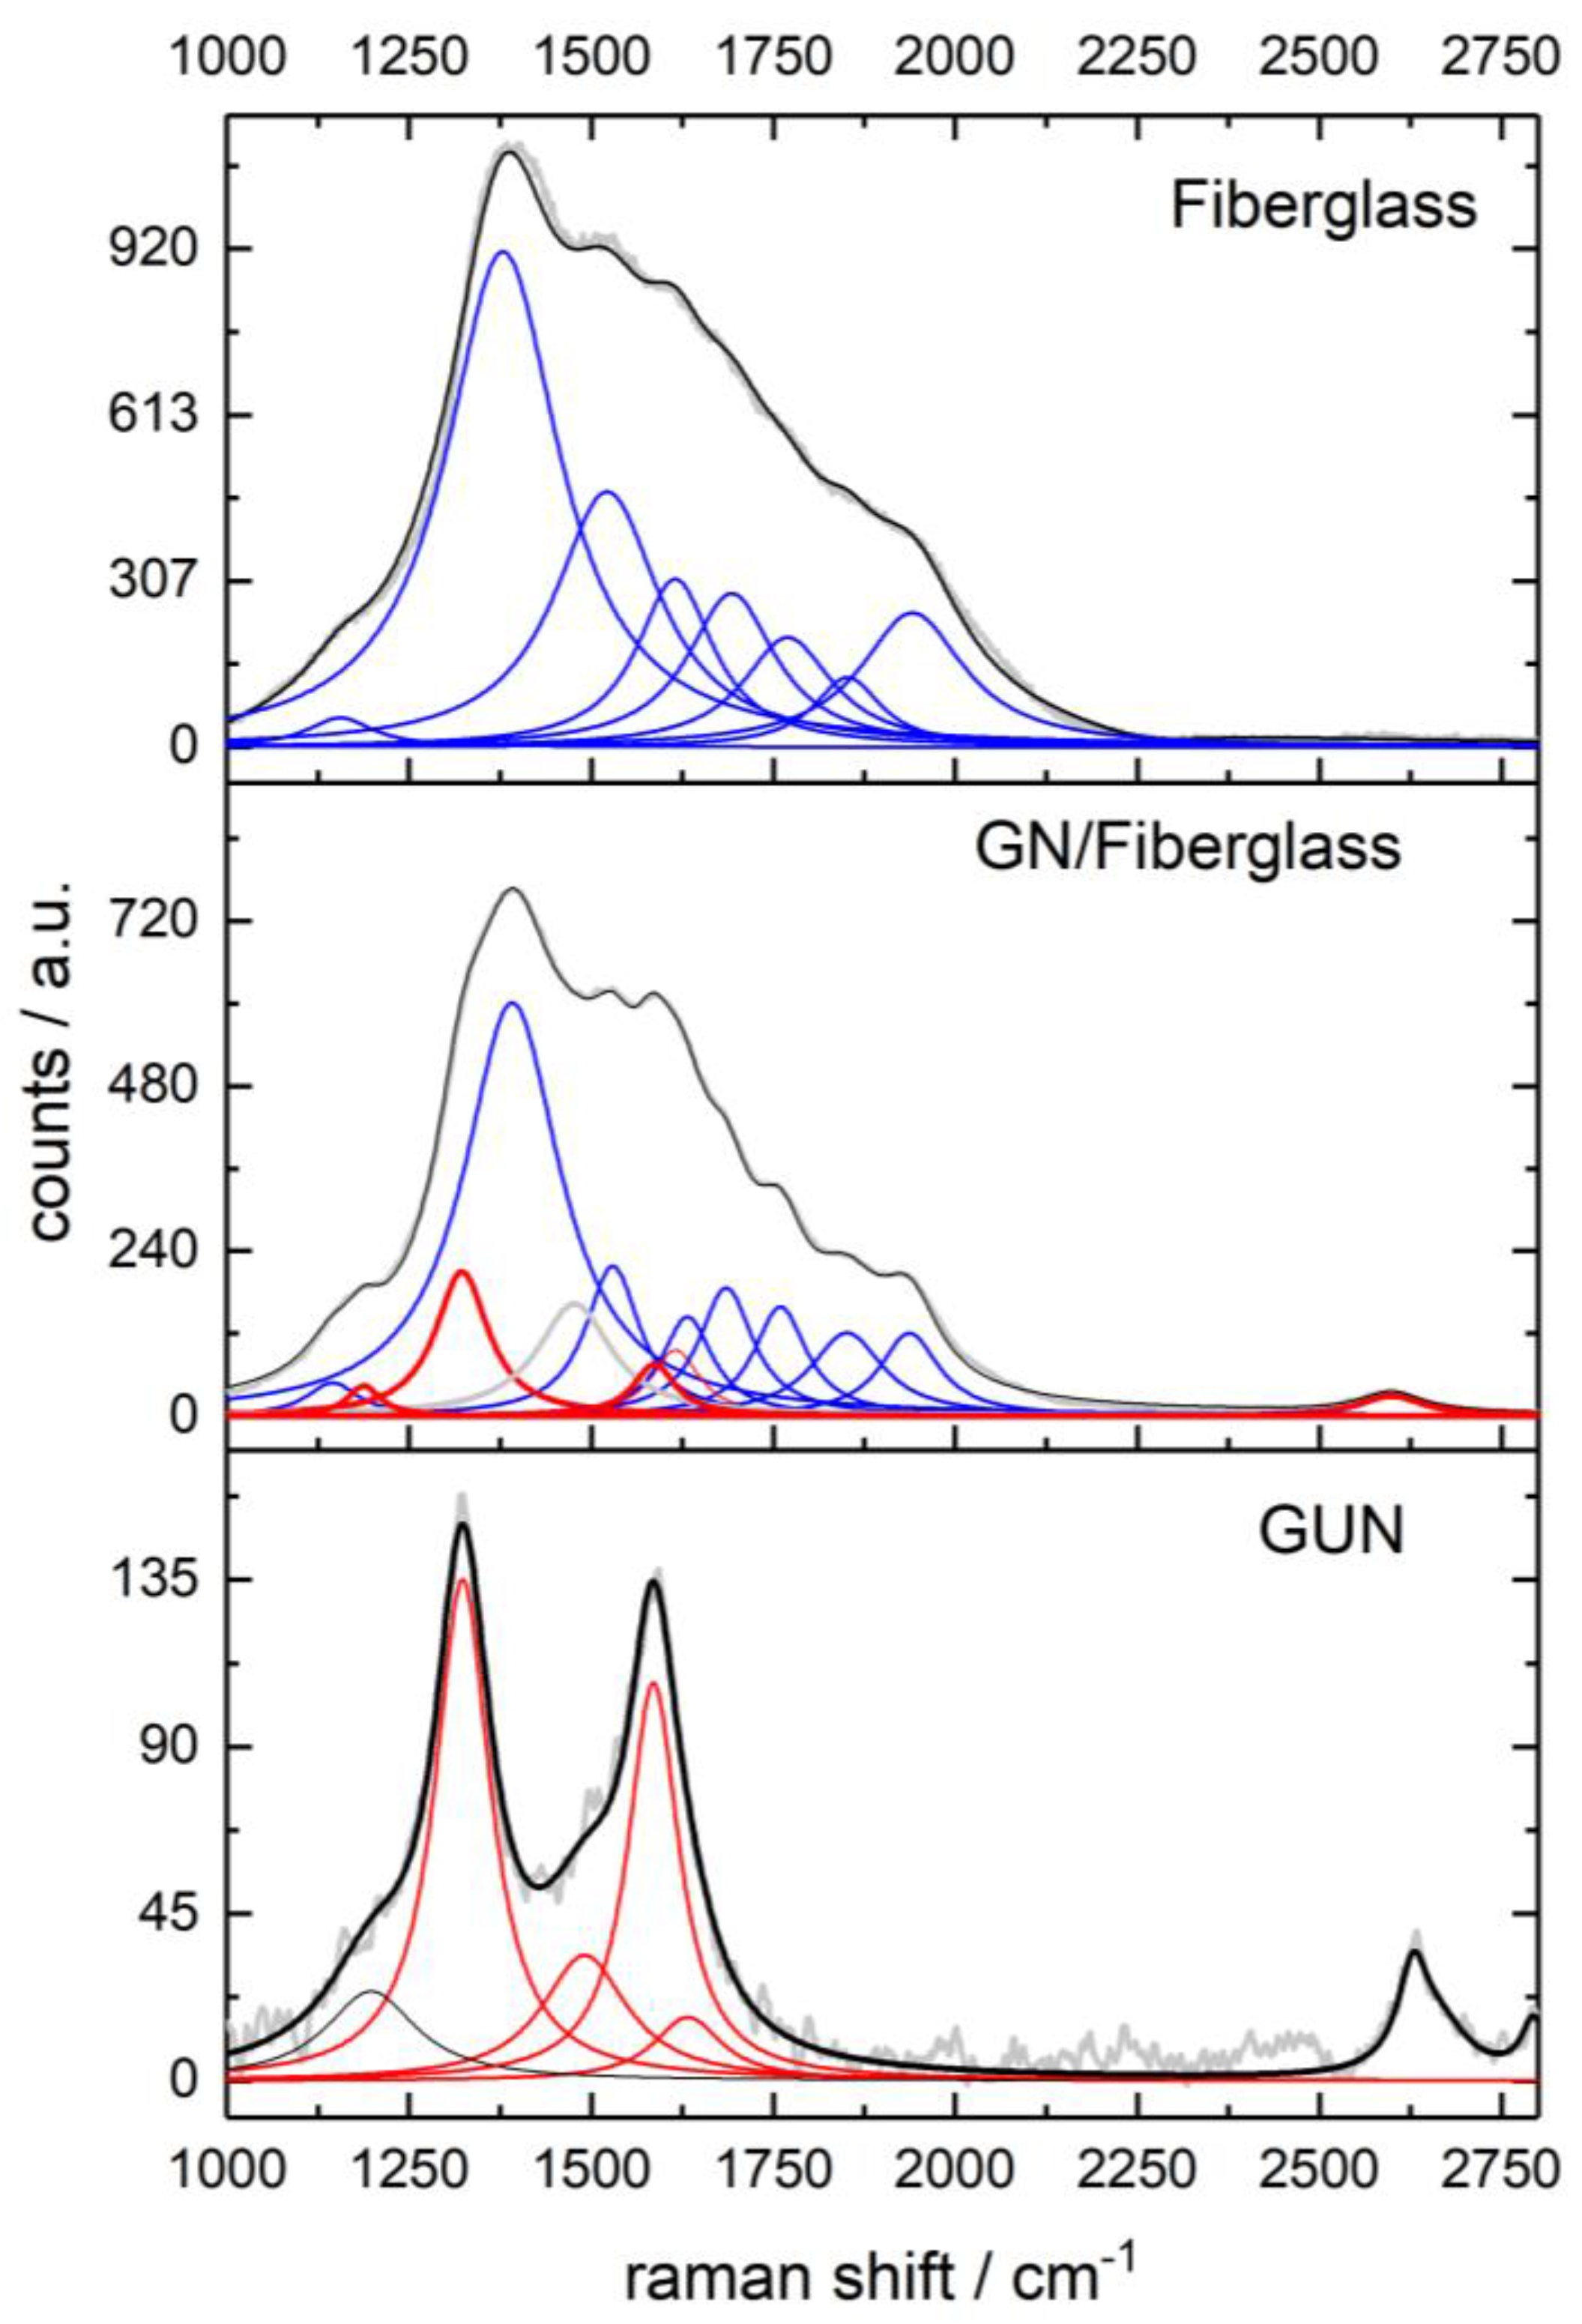
- Pimenta, M.A.; Dresselhaus, G.; Dresselhaus, M.S.; Cançado, L.G.; Jorio, A.; Saito, R. Studying disorder in graphite-based systems by Raman spectroscopy. Phys. Chem. Chem. Phys. 2007, 9, 1276–1290. [Google Scholar] [CrossRef]
- Vitorino, L.S.; Oréfice, R.L. Layer-by-Layer technique employed to construct multitask interfaces in polymer composites. Polímeros 2017, 27, 330–338. [Google Scholar] [CrossRef] [Green Version]
- Matrenichev, V.; Belone, M.C.L.; Palola, S.; Laurikainen, P.; Sarlin, E. Resizing Approach to Increase the Viability of Recycled Fibre-Reinforced Composites. Materials 2020, 13, 5773. [Google Scholar] [CrossRef] [PubMed]
- Wu, Y.; Wang, B.; Ma, Y.; Huang, Y.; Li, N.; Zhang, F.; Chen, Y. Efficient and large-scale synthesis of few-layered graphene using an arc-discharge method and conductivity studies of the resulting films. Nano Res. 2010, 3, 661–669. [Google Scholar] [CrossRef] [Green Version]
- Zhu, Q.; Wang, H.; Tian, Y.; Gao, R.; Zhao, S.; Huang, L.; Xu, S.; Zhang, X. The forming region and mechanical properties of CaO-Al2O3-SiO2 system. Ceram. Int. 2017, 43, 13810–13816. [Google Scholar] [CrossRef]
- McMillan, P.F.; Poe, B.T.; Stanton, T.R.; Remmele, R.L. A Raman spectroscopic study of H/D isotopically substituted hydrous aluminosilicate glasses. Phys. Chem. Miner. 1993, 19, 454–459. [Google Scholar] [CrossRef]
- Potts, A.W.; Price, W.C. The photoelectron spectra of methane, silane, germane and stannane. Proc. R. Soc. Lond. A 1997, 326, 165–179. [Google Scholar] [CrossRef]
- Akagi, R.; Ohtori, N.; Umesaki, N. Raman spectra of K2O–B2O3 glasses and melts. J. Non-Cryst. Solids 2001, 293–295, 471–476. [Google Scholar] [CrossRef]
- Yano, T.; Kunimine, N.; Shibata, S.; Yamane, M. Structural investigation of sodium borate glasses and melts by Raman spectroscopy.: I. Quantitative evaluation of structural units. J. Non-Cryst. Solids 2003, 321, 137–146. [Google Scholar] [CrossRef]
- Webb, A.N.; Neu, J.T.; Pitzer, K.S. The Infra-Red and Raman Spectra and the Thermodynamic Properties of Diborane. J. Chem. Phys. 2004, 17, 1007–1011. [Google Scholar] [CrossRef]
- Burkholder, T.R.; Andrews, L. Reactions of boron atoms with molecular oxygen. Infrared spectra of BO, BO2, B2O2, B2O3, and BO − 2 in solid argon. J. Chem. Phys. 1991, 95, 8697–8709. [Google Scholar] [CrossRef]
- Ferrari, A.C.; Basko, D.M. Raman spectroscopy as a versatile tool for studying the properties of graphene. Nat. Nanotechnol. 2013, 8, 235–246. [Google Scholar] [CrossRef] [Green Version]
- Lu, Z.; Wang, C.; Chen, X.; Song, M.; Xia, W. Effects of buffer gas on N-doped graphene in a non-thermal plasma process. Diam. Relat. Mater. 2021, 118, 108548. [Google Scholar] [CrossRef]
- Wu, J.-B.; Lin, M.-L.; Cong, X.; Liu, H.-N.; Tan, P.-H. Raman spectroscopy of graphene-based materials and its applications in related devices. Chem. Soc. Rev. 2018, 47, 1822–1873. [Google Scholar] [CrossRef] [PubMed] [Green Version]
- Zhang, L.-H.; Yu, F.; Shiju, N.R. Carbon-Based Catalysts for Selective Electrochemical Nitrogen-to-Ammonia Conversion. ACS Sustain. Chem. Eng. 2021, 9, 7687–7703. [Google Scholar] [CrossRef]
- Hao, Y.; Wang, Y.; Wang, L.; Ni, Z.; Wang, Z.; Wang, R.; Koo, C.K.; Shen, Z.; Thong, J.T.L. Probing Layer Number and Stacking Order of Few-Layer Graphene by Raman Spectroscopy. Small 2010, 6, 195–200. [Google Scholar] [CrossRef]

Disclaimer/Publisher’s Note: The statements, opinions and data contained in all publications are solely those of the individual author(s) and contributor(s) and not of MDPI and/or the editor(s). MDPI and/or the editor(s) disclaim responsibility for any injury to people or property resulting from any ideas, methods, instructions or products referred to in the content. |
© 2023 by the authors. Licensee MDPI, Basel, Switzerland. This article is an open access article distributed under the terms and conditions of the Creative Commons Attribution (CC BY) license (https://creativecommons.org/licenses/by/4.0/).
Share and Cite
Gomes, P.V.R.; Bonifacio, R.N.; Silva, B.P.G.; Ferreira, J.C.; de Souza, R.F.B.; Otubo, L.; Lazar, D.R.R.; Neto, A.O. Graphene Deposited on Glass Fiber Using a Non-Thermal Plasma System. Eng 2023, 4, 2100-2109. https://doi.org/10.3390/eng4030119
Gomes PVR, Bonifacio RN, Silva BPG, Ferreira JC, de Souza RFB, Otubo L, Lazar DRR, Neto AO. Graphene Deposited on Glass Fiber Using a Non-Thermal Plasma System. Eng. 2023; 4(3):2100-2109. https://doi.org/10.3390/eng4030119
Chicago/Turabian StyleGomes, Paulo V. R., Rafael N. Bonifacio, Barbara P. G. Silva, João C. Ferreira, Rodrigo F. B. de Souza, Larissa Otubo, Dolores R. R. Lazar, and Almir O. Neto. 2023. "Graphene Deposited on Glass Fiber Using a Non-Thermal Plasma System" Eng 4, no. 3: 2100-2109. https://doi.org/10.3390/eng4030119