Article

Preimplantation Endometrial Transcriptomics in Natural Conception Cycle of the Rhesus Monkey

1
Department of Biochemistry, All India Institute of Medical Sciences, New Delhi 110029, India
2
Program in Translational Medicine, Peter Gilgan Centre for Research and Learning, The Hospital for Sick Children, Toronto, ON M5G 0A4, Canada
3
Department of Laboratory Medicine and Pathobiology, University of Toronto, Toronto, ON M5G 0A4, Canada
4
Department of Women’s and Children’s Health, Karolinska Institutet, 17176 Stockholm, Sweden
5
Department of Physiology, All India Institute of Medical Sciences, New Delhi 110029, India
*
Author to whom correspondence should be addressed.
Presently retired.
Reprod. Med. 2022, 3(1), 16-35; https://doi.org/10.3390/reprodmed3010003
Submission received: 11 January 2022 / Revised: 26 January 2022 / Accepted: 28 January 2022 / Published: 31 January 2022

Abstract

:
There is no report on preimplantation phase endometrial transcriptomics in natural conception cycles of primates. In the present study, the whole-genome expression array of endometrium on Days 2, 4, and 6 post-ovulation (pov) in proven natural conception (Group 1; n = 12) and non-mated, ovulatory (Group 2; n = 12) cycles of rhesus monkeys was examined, compared, and validated. Of fifteen (15) genes showing differential expression (>2-fold; pFDR < 0.05), six genes (CHRND, FOXD3, GJD4, MAPK8IP3, MKS1, and NUP50) were upregulated, while eight genes (ADCY5, ADIPOR1, NNMT, PATL1, PIGV, TGFBR2, TOX2, and VWA5B1) were down regulated on Day 6 pov as compared to Day 2 pov in conception cycles. On Day 6 pov, four genes (ADCY5, NNMT, TOX2, and VWA5B1) were down regulated, and AVEN was upregulated in conception cycles compared with the non-conception cycle. These observations were orthogonally validated at protein expression level. Group-specifically expressed unique genes in conception cycles influence the process of induction of immune-tolerance, while the genes expressed in both groups influence processes of protein targeting and metabolism. A triad of timed-actions of progesterone, seminal plasma, and preimplantation embryo putatively regulate several input molecules to CREB, NF-kB, and STAT regulatory networks during secretory phase towards evolution of endometrial receptivity in the rhesus monkey.

1. Introduction

The biology of endometrium during embryo implantation in the human is a ‘black box’ [1,2]. Progress in this field has been limited largely due to non-availability of human endometrial samples due to ethical and practical constraints. There are also serious restrictions and scarcity in using human embryos for in vitro experimental purposes and in the study of early events in implantation. In an alternate model to supplant this obstacle, investigators examined the physiological changes occurring in endometrium in the ‘window of implantation’ in normal, non-conception cycles of women [3,4]. Licht et al. (1998) employed an interesting model to investigate the nature of endometrial responses following intrauterine infusion of putative embryonic factors in the secretory phase of cycle [5]. Although these studies revealed many interesting facets of implantation biology, the complete absence of a dynamic relationship between a developing preimplantation stage embryo and the primed endometrium as it attains its receptive status for nidation was a major limitation in these experimental approaches [2,6,7].
There are several excellent reviews on the nature of embryo–endometrial dialogue and establishment of receptivity for ovo-implantation using rodents, lagomorph, ruminants, and ungulates as experimental models [8,9,10,11,12]. However, the endocrine basis and the temporo-spatial aspects of embryo implantation in these species bear little resemblance to that in the human. During the past few decades, the rhesus macaque (Macaca mulatta) as a non-human primate has been one of the animals of choice for preclinical and biomedical research because monkeys and humans share significant developmental, immunological, anatomical, biochemical, and physiological similarities [13,14]. The rhesus macaque bears marked similarities to the human in their reproductive characteristics, which bear special relevance in the study of human embryo implantation and pregnancy. These include similarities in (i) the characteristics of menstrual cycle [15,16], (ii) the endocrine requirements for pregnancy establishment [17,18,19,20], (iii) the preimplantation embryonic factors [21,22,23], (iv) the temporo-spatial features of initial interaction between trophoblast and implantation-stage endometrium and establishment of subsequent lacunar stage of gestation [24,25,26,27,28], and, (v) finally, the establishment of villous placenta and the interaction between trophoblast and spiral arterioles [29,30,31]. These considerations led us to examine the differential display of biochemical characteristics between the preimplantation stage endometrium in proven conception cycles and secretory phase endometrium of non-conception cycles of fertile rhesus monkeys [2]. In the present study, we have examined the whole-genome expression of preimplantation stage endometrium in natural conception cycle and compared the former with the secretory phase of normo-ovulatory non-mated cycles of proven fertile rhesus monkeys and observed that functional networks involving CREB, NF-kB, and STAT regulatory modules in implantation stage endometrium may be operative in natural conception cycle.

2. Materials and Methods

2.1. General Procedures

Healthy, mature, and proven fertile female and male rhesus monkeys (Macaca mulatta) housed in a semi-natural condition at the Primate Research Facility of the All India Institute of Medical Sciences (New Delhi, India) were used in the study. The study was conducted in accordance with the guidelines of the Committee for the Purpose of Control and Supervision of Experiments on Animals and was approved by the Ethics Committee for the Use of Primates in Biomedical Research of the All India Institute of Medical Sciences (No.F.1-8/PRF/2004/780922/2021). The details of animal selection, housing, management, monitoring of cycles, mating, laparotomy, endometrial sampling, serum collection, and immunoassays for hormones have been described elsewhere [23].

2.2. Animal Groups and Tissue Collection

A total number of 71 proven fertile female monkeys showing at least two consecutive ovulatory menstrual cycles of normal length (26–32 days) were allocated to either of the two groups. One group of females (n = 35) were allowed to cohabit with proven fertile males during days 8 to 16 of their menstrual cycles (mated group), and the second group of females (n = 36) were not allowed to cohabit but were housed in close proximity to proven fertile males (non-mated group). Vaginal smears were checked daily. The day of ovulation was assessed from immunopositive profiles of estradiol-17β and progesterone in peripheral serum samples as described earlier [23]. The females (n = 10) who failed to show clear indication of ovulation were removed from the study.
Endometrial samples were collected on Days 2, 4, and 6 after ovulation from both groups of animals as described elsewhere [32]. Briefly, retrievable endometrial samples were collected on Days 2, 4, and 6 after ovulation from animals following laparotomy and fundal hysterotomy under ketamine (12 mg/kg body weight, Vetlar, Parke-Davis, Mumbai, India) anesthesia. Out of 35 females in the mated group, endometrial samples obtained from 31 females who yielded viable, preimplantation stage-matched embryos on uterine flushing were categorized under the conception cycle group (Group 1), having three sub-groups: Group 1A (Day 2 after ovulation; n = 10), Group 1B (Day 4 after ovulation; n = 11), and Group 1C (Day 6 after ovulation; n = 10). The recovered embryos from this group were immediately assessed for their developmental status under stereozoom microscope, as described earlier [2,23,32], and were employed in a different study. In the non-mated group, endometrial samples obtained from females (n = 30) who showed normal ovulatory cycles were categorized in the non-fecund cycle group (Group 2) with three subgroups: Group 2A (Day 2 after ovulation; n = 10), Groups 2B (Day 4 after ovulation; n = 10), and Group 2C (Day 6 after ovulation; n = 10). A total of 31 tissue samples from both groups were washed in ice-cold PBS and immediately processed for RNA extraction. Another set of 24 samples from both groups were processed for chemical fixation in 4% (w/v) buffered paraformaldehyde for making their paraffin blocks, which were used for immunohistochemistry [30]. Table 1 shows the details of the tissue samples from both groups used for different experiments.

2.3. RNA Extraction

Total RNAs from selected endometrial samples (n = 31) from the conception cycle group (Group 1; n = 15) and the non-fecund cycle group (Group 2; n = 16) were extracted using Trizol and cleaned up with DNase 1 [33]. The yield and purity of the extracted RNA was checked using standard protocols of absorbance ratio between 260 and 280 nm and 1% agarose gel electrophoresis [34]. Furthermore, the RIN score of individual samples was determined using Agilent 2100 Bioanalyzer, RNA 6000 Nano Lab Chip kit, and Agilent 2100 Expert Software (version 02/2000, Agilent Technologies, Inc., Santa Clara, CA, USA) as described elsewhere [35]. Samples (n = 7) that could not yield either adequate amount of RNA or RIN score > 8.0 were discarded from the study (Table 1). Thus, RNA samples obtained from 24 females were obtained from two groups (Group 1, n = 12; Group 2, n = 12) of animals for downstream experiments. All accessory chemicals were purchased from Sigma-Aldrich (St. Louis, MI, USA) and Agilent Technologies (Shung Avenue, Singapore).

2.4. Whole-Genome Expression Array

The samples having RIN scores > 8.0 were subjected to a whole transcriptome array using the Rhesus Monkey Whole Genome 60-mer 4X44K expression microarray slides purchased from Agilent Technologies, Inc. (Santa Clara, CA, USA) and according to the procedures provided by the manufacturer. Hybridized arrays were scanned using the Agilent G2505B microarray scanner system, and the raw data were imported into GeneSpring v14.9.1 software (Agilent Technologies, Santa Clara, CA, USA) for further analysis. Pearson’s correlation coefficients were used to assess the reliability of data obtained from two separate hybridization runs for same RNA preparations to confirm the reproducibility assurance among hybridizations. Analysis of the data retrieved from separate chips with the same RNA samples yielded QC statistics highly concordant with those of the manufacturer, and it revealed more than 95% confidence level. Table 2 provides basic features of the expression microarray chips and data, the details of which are available at GEO repository accession number GSE108760.

2.5. Array Data Analysis and Post-Hoc Enrichment Analysis

The array data were subjected to exploratory analysis using unsupervised and supervised hierarchical clustering analysis (HCA) and non-hierarchical K-mean cluster analysis. Further, the data were analyzed using Welch ANOVA followed by pair-wise analysis using Tukey’s HSD test with Benjamini–Hochberg multiple testing corrections for false discovery rate to identify differentially (>2-fold at pFDR < 0.05) expressed (DE) genes among various groups and subgroups. All data processing and analysis were performed using the GeneSpring software v14.9.1. For post-hoc enrichment analysis, candidate genes were matched with known products into the sets of functional ontologies. The probability of a random intersection between a candidate on the target list and ontology entities was estimated in terms of p-values. Thus, a lower p-value meant higher relevance of the entity to the data set due to a higher rating for the entity. Enrichment analyses were performed using a standard cut-off threshold (pFDR = 0.05) for the unique genes perennially expressed only in one of the two groups investigated, as well as, for genes which expressed in both groups. The enrichment analysis for gene ontology (GO) was achieved using a MetaCore bioinformatics platform (GeneGO, St. Joseph, MI, USA) as described elsewhere [35,36,37].

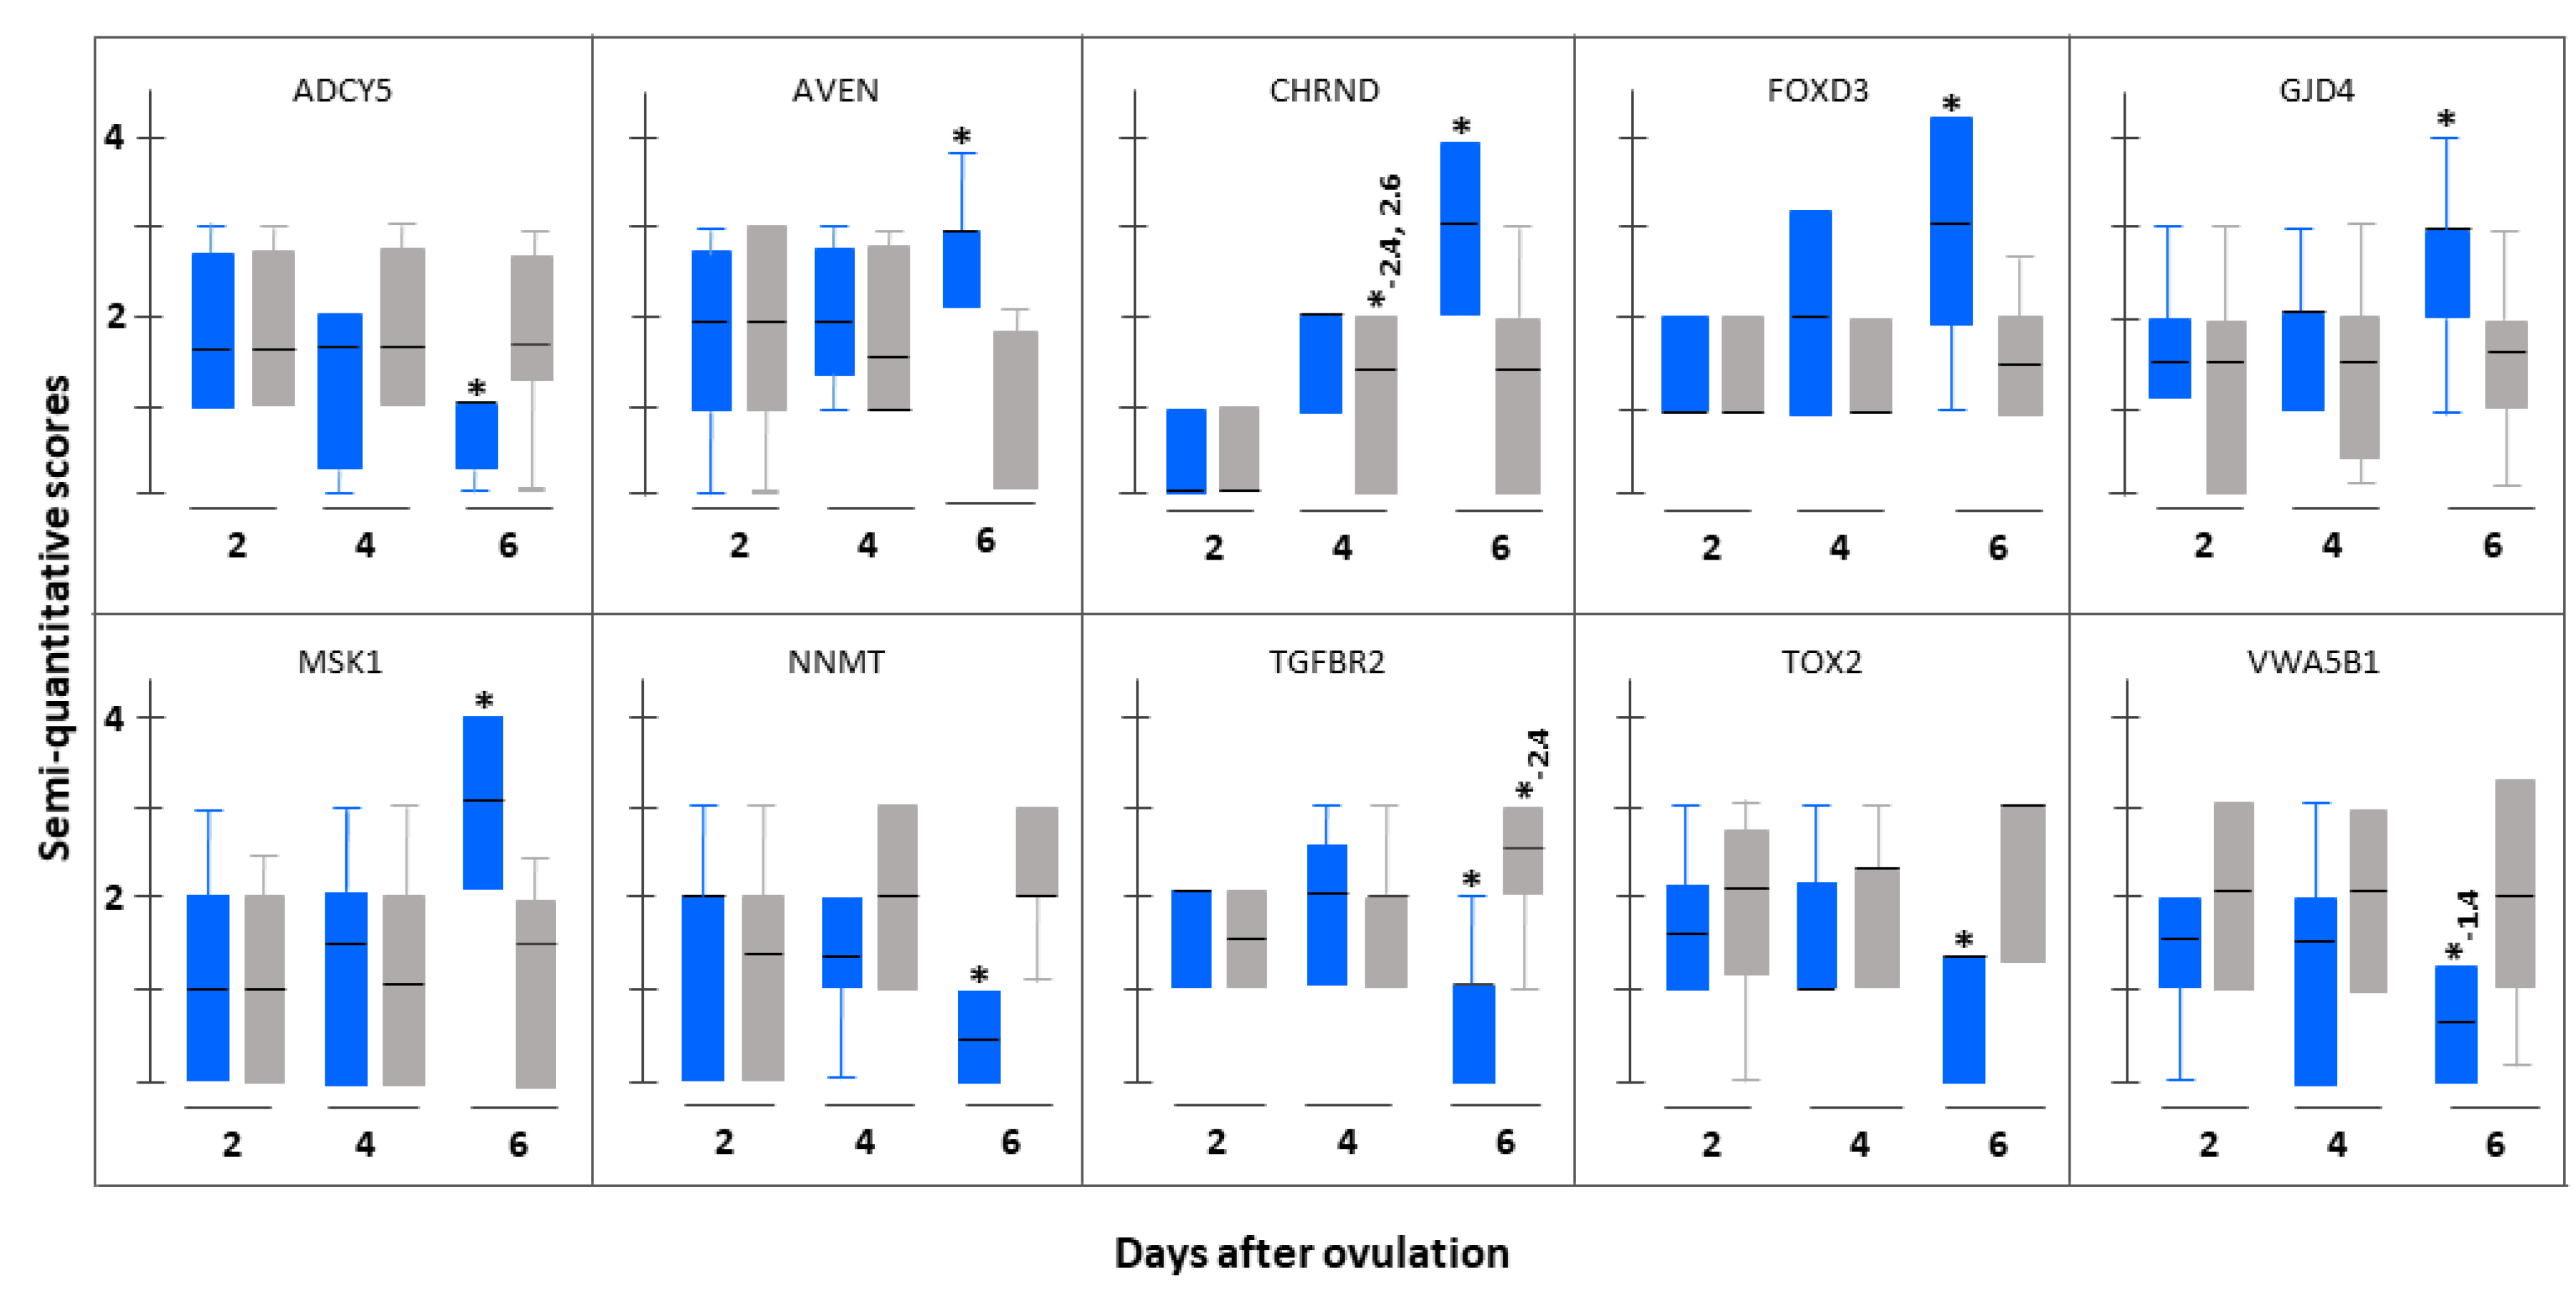
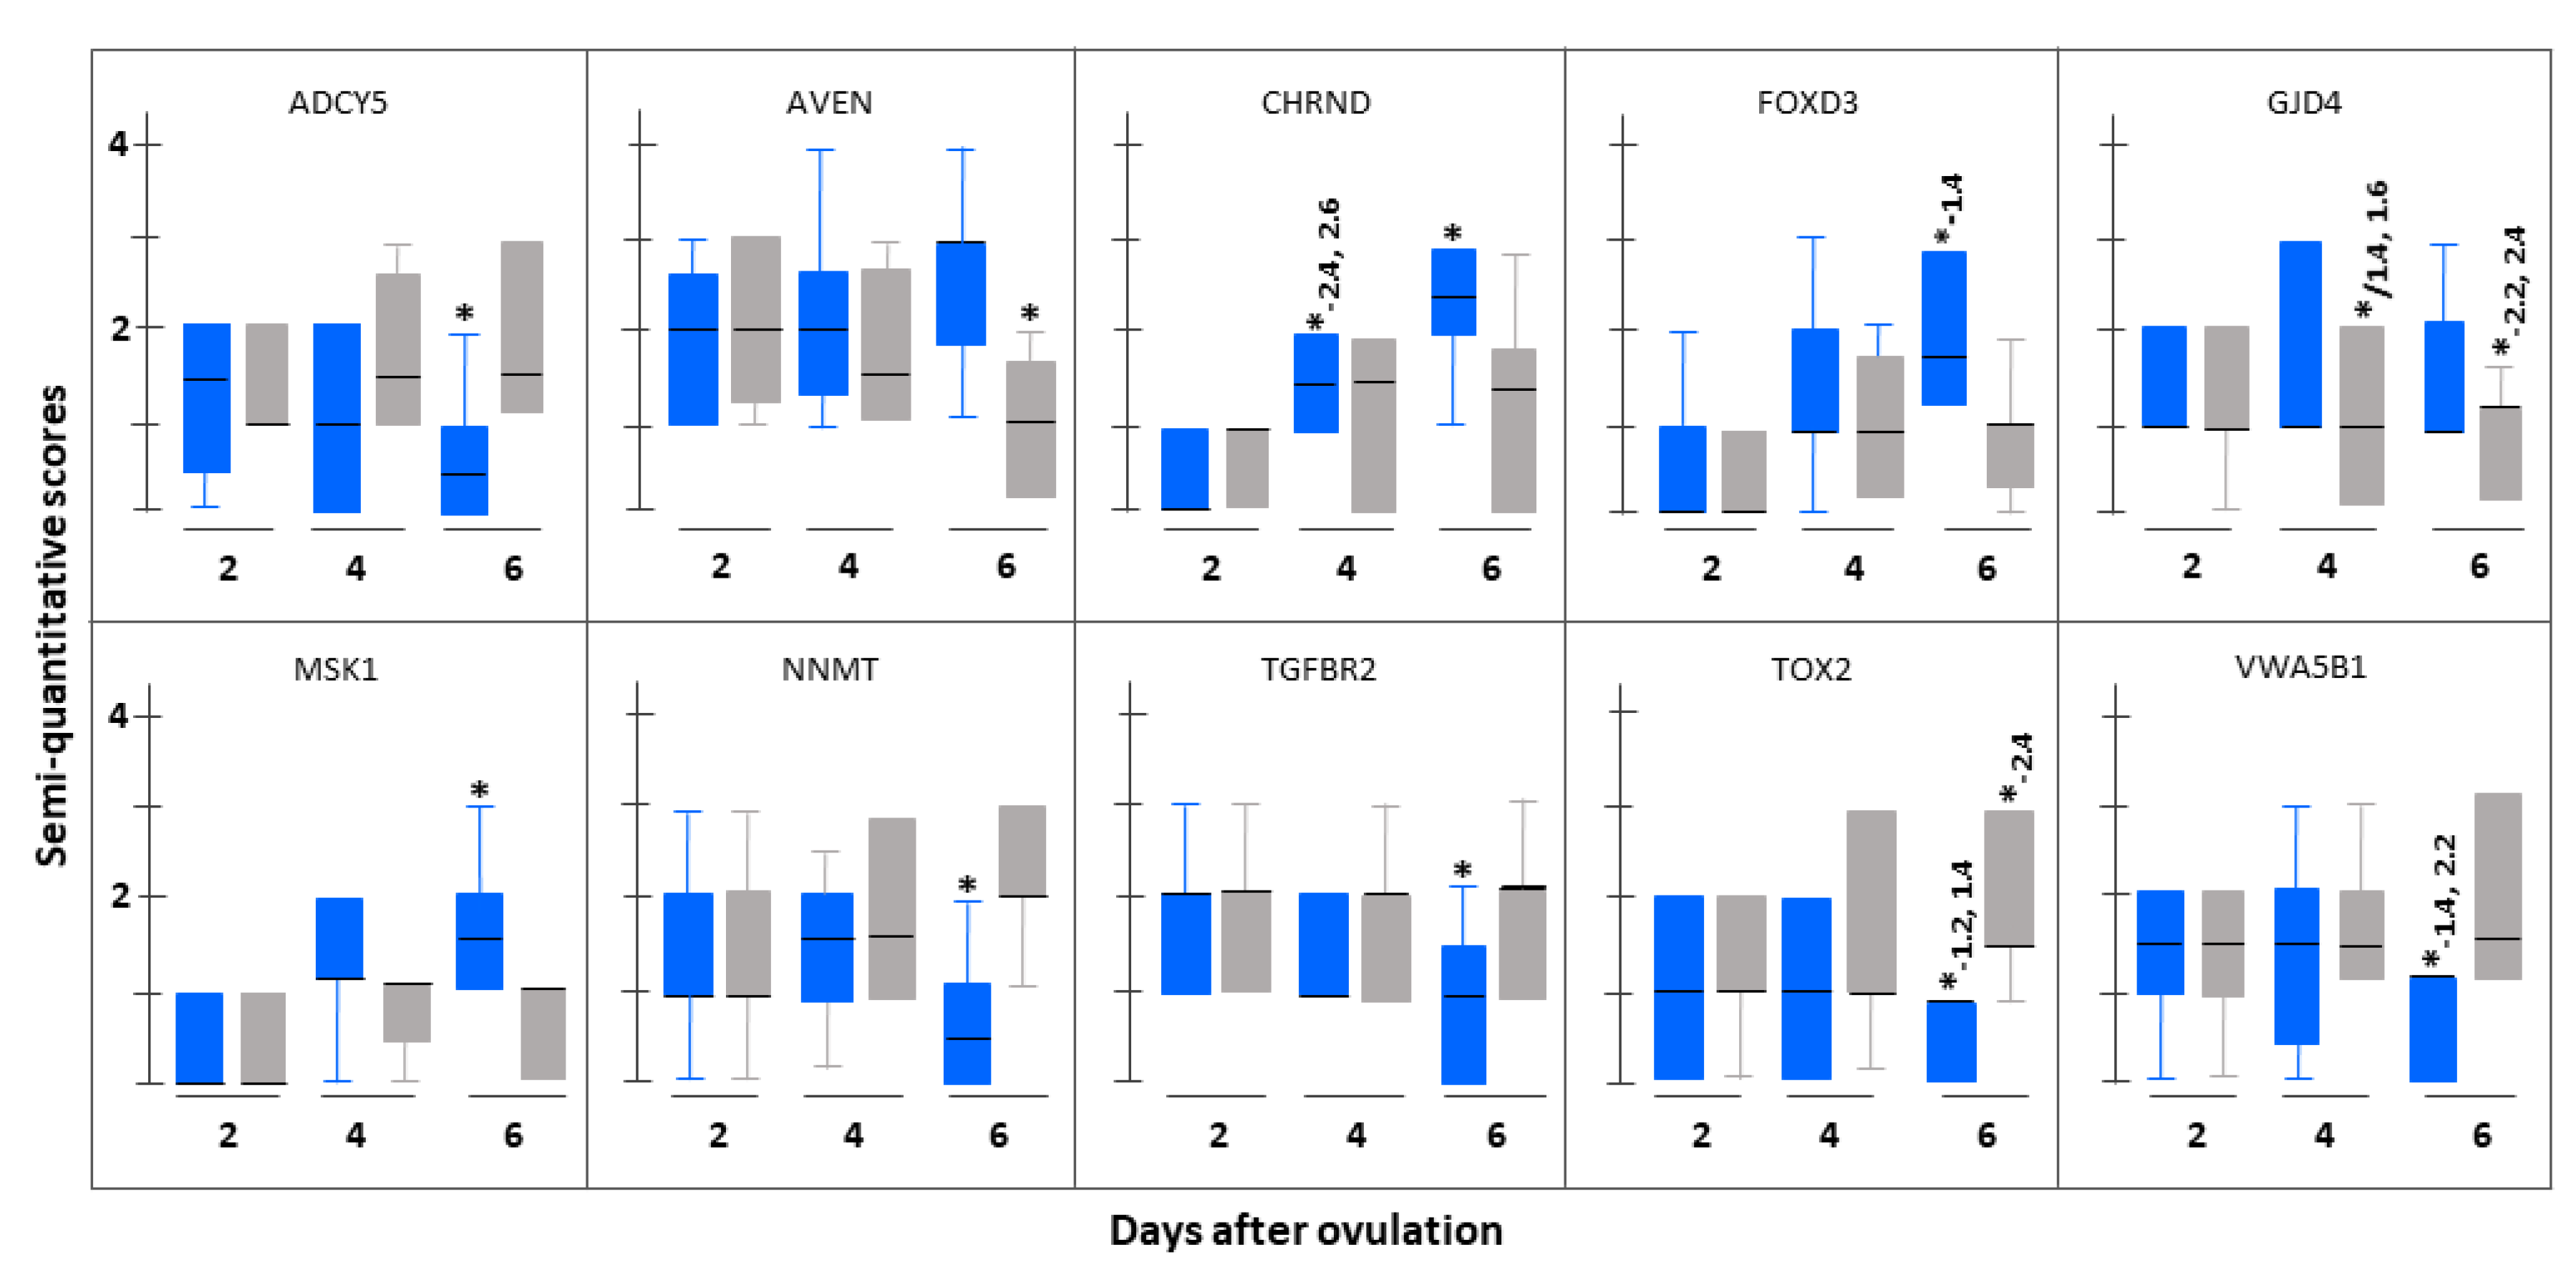
2.6. Quantification of Candidate Gene Expression by Real-Time RT-PCR

In order to validate the DE data from microarray experiments, relative expression of fifteen (15) genes (ADCY5, ADIPOR1, AVEN, CHRND, FOXD3, GJD4, MAPK8IP3, MKS1, NNMT, NUP50, PATL1, PIGV, TGFBR2, TOX2, and VWA5B1) was assessed on a real-time RT-PCR platform using SYBR green chemistry and a CFX96 real-time RT-PCR detection system (BioRad, Hercules, CA, USA). The genes were selected based on results from the expression array experiment. Glyceraldehyde 3-phosphate dehydrogenase (GAPDH), beta-actin (ACTB) and beta-2-microglobulin (B2M) were selected as endogenous controls based on the observed expressional consistency according to MIQE guidelines [38]. Primers (see Supplementary Materials Table S1 for details) were designed using Beacon Designer software 7 (Labware Scientific Inc., Milipitas, CA, USA) and obtained from Integrated DNA Technologies (Coralville, IA, USA). The ratio of estimated efficiency of the primers for the selected genes and the endogenous control genes was ~1.0. An optimized kit (Revert AID First strand cDNA synthesis kit K1612, Thermo Fisher Scientific, Vilnius, Lithuania) was used to synthesize cDNA from respective RNA (2 µg) samples and subsequent amplification was done using SYBR Green master mix obtained from BioRad (Hercules, CA, USA). The procedural details have been described elsewhere [37], and fold changes between groups were calculated using a standard model [39] and statistically evaluated using the Mann–Whitney U-test with Bonferroni correction [38]. A cut-off value of >2-fold change and pFDR < 0.05 were used to identify DE genes.

2.7. Immunohistochemical Localisation of Candidate Proteins for Orthogonal Validation

As shown in Table 1, 24 endometrial samples collected from different sets of animals of both groups (Group 1: n = 12 and Group 2: n = 12) were used for immunohistochemical staining for detection of ten (10) proteins (ADCY5, AVEN, CHRND, FOXD3, GJD4, MKS1, NNMT, TGFBR2, TOX2, and VWA5B1), which were selected based on results from post-hoc enrichment analysis. Immunohistochemistry was performed using specific antibodies commercially obtained from Abcam (Cambridge, MA, USA) and according to the methods provided by the manufacturer. Dilutions of stock primary antibodies for incubation were pre-calibrated based on five-point titration and the information provided by the manufacturer. The sources of primary antibodies and the dilutions at which those antibodies were used in this study are provided in Supplementary Materials Table S2. The procedural details of immunohistochemistry has been described elsewhere [30]. Briefly, deparaffinized and hydrated tissue sections were subjected to microwave heating in 0.1 M sodium citrate buffer (pH 6.0) for the retrieval of antigens. The endogenous peroxidase activity was quenched, and non-specific binding was blocked with non-immune sera. Final visualization was achieved using the ABC peroxidase Elite kits (Vector Laboratories, Burlingame, CA, USA) and freshly prepared 3,3′-diaminobenzidine hydrochloride with hydrogen peroxide. All immunostaining procedures for a given antigen were performed in a single run along with primary antibody and secondary antibody controls. The images were (i) viewed and documented using a Leica DMRD microscope (Leica Microsystems, Wetzlar GmbH, Germany), (ii) analyzed by a computer-assisted image analysis system (Leica QWIN DC 200, Cambridge, UK), and (iii) scored for different compartments independently by three trained observers using a simple standardized five scale combinative semi-quantitative scoring system (0 (<5%), 1 (5–25%), 2 (26–50%), 3 (51–75%), 4 (>75%)) and positive controls as references, as described earlier [40,41]. All scores provided by the observers were entered into data sheets on Excel platform and were analyzed using weighted κ-statistics for assessment of inter-observer errors yielding a mean κ-score of 0.65, suggesting a good agreement beyond chance [42]. Statistical analysis was done using (i) a Scheirer–Ray–Hare test, which is a non-parameter alternative to multi-factorial ANOVA for data from samples in different sub-groups, (ii) a Kruskal–Wallis test as a non-parameter alternative to ANOVA for data from samples in different sub-groups in a specific group, and (iii) a Mann–Whitney U-test with Bonferroni correction for post-hoc analysis of data between any two sub-groups [43,44]. Standard statistical packages, viz., SPSS for Windows version 16 (SPSS Inc., Chicago, IL, USA) and Graph Pad version 9 (GraphPad Software Inc., La Jolla, CA, USA) were used.

3. Results

3.1. General

A total of 71 proven fertile female animals were used in two groups. A total of 35 animals were allowed to cohabit with proven fertile males during days 8 to 16 of the cycle. However, four animals failed to exhibit clear indication of ovulation, and two animals failed to yield any embryo despite ovulation, while another two animals yielded delayed embryos; thus 27 mated, ovulated animals yielded age-and-stage matched embryos during Days 2, 4, and 6 after ovulation. This group of animals was categorized under the conception cycle group (Group 1). Total RNAs from endometrial obtained from those 15 animals during peri-implantation period (Days 2, 4, and 6 after ovulation) in proven conception cycles were extracted followed by their quality and quantity assessments. Samples from three (3) animals were not used due to inadequate RNA quality and quantity, thus yielding RNA samples from 12 animals for the whole-genome expression array experiment. The tissue samples obtained from rest of animals in Group 1 (n = 12) were used for immunohistochemistry. Of the 36 animals who were not allowed to cohabit with proven fertile males, six animals failed to exhibit a clear indication of ovulation. Tissue samples obtained from 16 animals in this group categorized in the non-fecund cycle group (Group 2) were used for total RNA extraction followed by their quality and quantity assessments, and four samples could not be used since their RIN scores were less than 8.0. The tissue samples obtained from rest of animals in Group 2 (n = 12) were used for immunohistochemistry. Thus, 24 individual samples in different subgroups in duplicates were used for expression array experiments and a different set of 24 samples for immunohistochemistry towards orthogonal validation (see Table 1 for details).

3.2. Expression Array

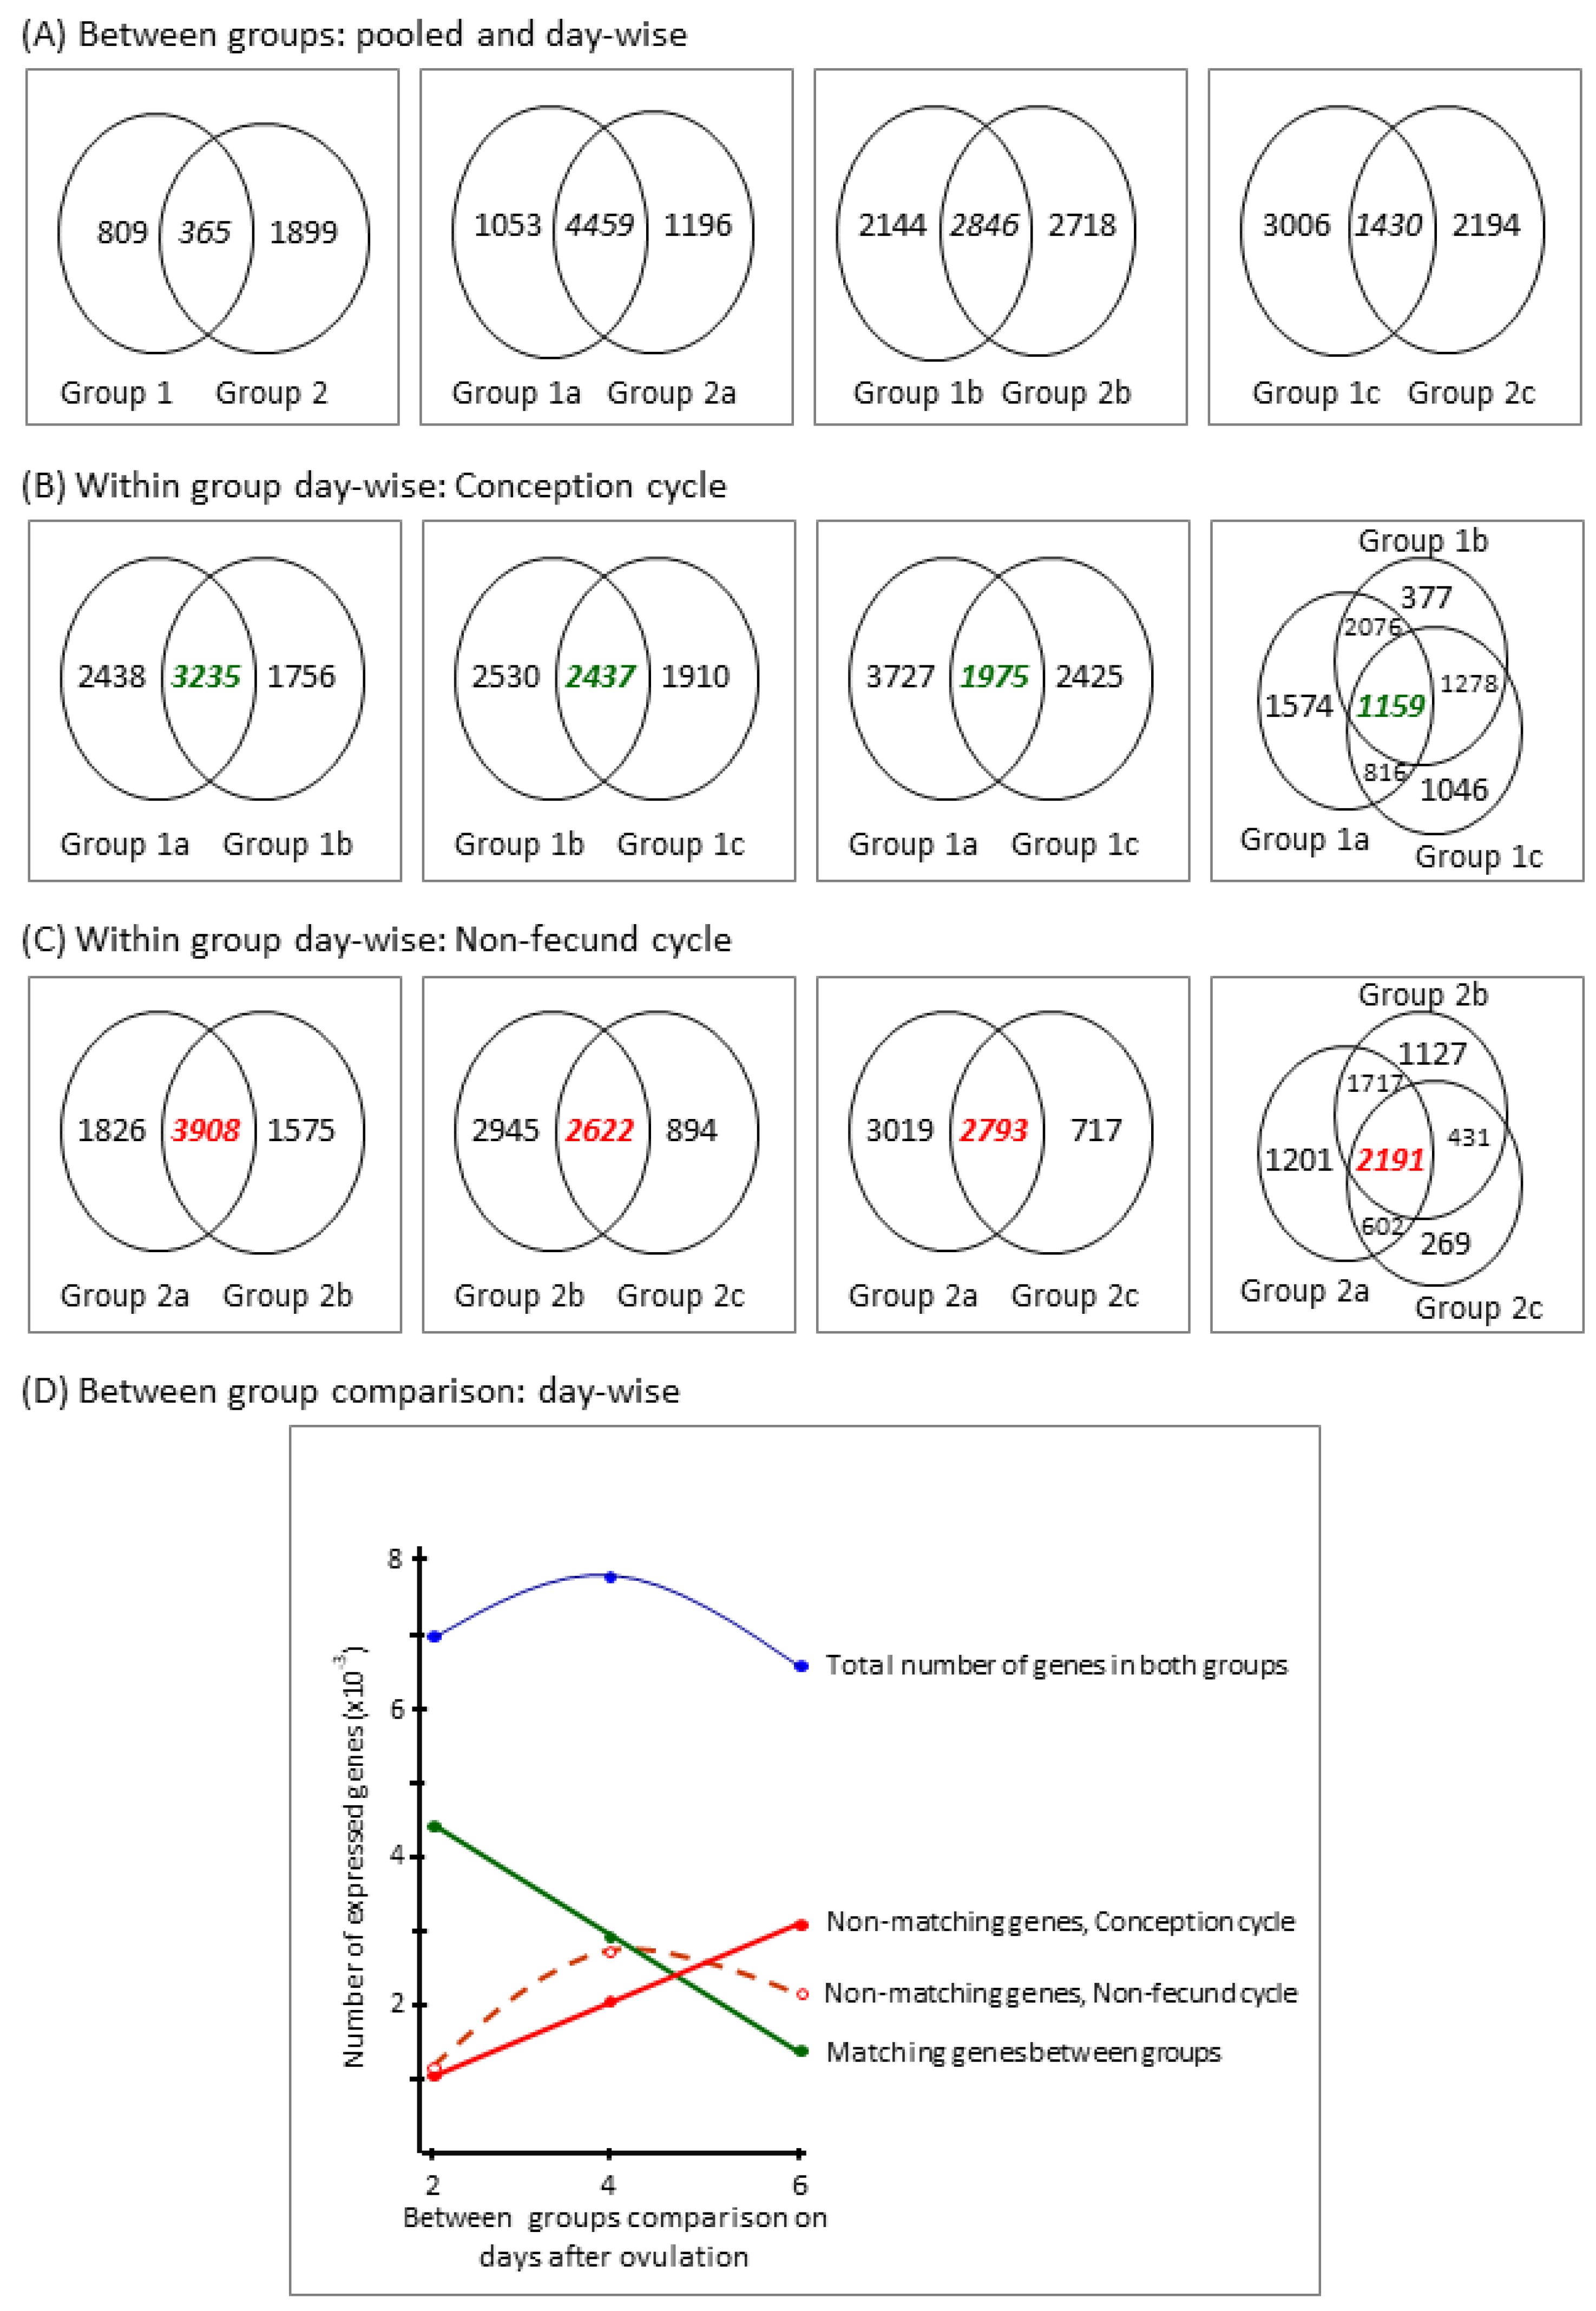
3.2.1. Descriptive Data Analysis

A distribution analysis of the number of probes and genes for different ranges of microarray expression obtained from 24 proven fertile female rhesus with confirmed indication of ovulation revealed normal distribution individually and in group-wise analyses with acceptable and consistent background and signal-to-noise ratio. For total numbers and percent estimates of probes and genes expressed and estimated in an optimized scale for samples from different groups, see Table 2. On average, ~60% and ~68% of total genes were expressed in endometrial samples obtained from the conception cycle group (Group 1) and non-fecund cycle group (Group 2), respectively.
Group-wise HCA yielded highest segregation between the peri-implantation stage (Groups 1b and 1c) and other (Groups 2a–c and Group 1a) samples with cluster distance (cd) 0.9, when cd = 1.0 denotes complete segregation. On the other hand, least segregation was seen between Groups 1a and 2a with cd 0.2, when cd = 0 denotes complete aggregation. The results obtained from K-means cluster analysis also revealed two distinctive clusters: Cluster 1 comprised Groups 1a and 2a–c, while Cluster 2 comprised Groups 1b and 1c. Supplementary Materials Figure S1 shows the results of two-way HCA and K-means cluster analysis.
Figure 1 shows the synopsis of comparative profiles of genes expressed in different subgroups as revealed from Venn analysis of expression data with the details provided in Supplementary Materials Tables S3–S5. There were a few notable observations. Firstly, between-groups analysis revealed that the numbers of expressed genes matching between groups displayed a clear declining trend with increasing number of expressed non-matching genes with time, maximal (~50%) non-matching genes (e.g., 3006 out of total 6617 expressed genes in Groups 1c and 2c) being observed on Day 6 after ovulation in conception cycle, i.e., Group 1c (Figure 1D). Secondly, within-group analysis revealed that about one out of four expressed genes were matching on different days after ovulation in the conception cycle group (viz. 1159 out of total 4176), while about one out of two expressed genes were matching on different days after ovulation in the non-fecund cycle group (viz. 2191 out of total 4866). Thirdly, within-group analysis also revealed that the numbers of expressed genes common on different days in Group 1 (i.e., conception cycle group) showed a declining trend with days (see values in green italics in Figure 1B) viz., 3.2 × 10³, 2.5 × 10³ and 1.9 × 10³ genes on Days 2, 4, and 6 after ovulation, respectively. This feature was not observed in Group 2, i.e., the non-fecund cycle group (see values in red italics in Figure 1C), viz., 3.9 × 10³, 2.6 × 10³ and 2.8 × 10³ genes on Days 2, 4, and 6 after ovulation, respectively.

3.2.2. Differentially Expressed (DE) Genes

The analysis for DE matching genes in all subgroups based on ANOVA of data sets obtained from whole-genome expression arrays identified fifteen (15) DE genes. Of these 15 genes displaying differential expression, in Group 1c, the expression of six (6) genes (CHRND, FOXD3, GJD4, MAPK8IP3, MKS1, and NUP50) was upregulated as compared to Group 1a, and one (1) gene (AVEN) as compared to Group 2c. In Group 1c, on the other hand, eight (8) genes (ADCY5, ADIPOR1, NNMT, PATL1, PIGV, TGFBR2, TOX2, and VWA5B1) displayed downregulation as compared to Group 1a; of those genes, four (4), e.g., ADCY5, NNMT, TOX2, and VWA5B1, were also seen to be down regulated as compared to 2c. The results obtained from whole-genome expression arrays were validated by real-time RT-PCR. Table 3 provides the summary of the results.

3.2.3. Group-Specific Expression of Non-Matching Genes

Table 4 and Supplementary Materials Table S6 details the results of the GO analysis of group-specific unique expression data sets. It revealed that (i) all ten top-scored GO processes in the conception cycle group (Group 1) were aligned to the processes related to tolerance induction to non-self antigen involving T-cells, and (ii) all ten top-scored GO processes in the non-fecund cycle group (Group 2) were aligned to the metabolic processes, both with very high level of significance. Further, the genes found to be expressed in both groups aligned with GO processes such as protein targeting to membrane (p-value = 1.1 × 10²¹) and endoplasmic reticulum (p-value = 3.7 × 10²¹), as well as metabolic process (p-value = 4.0 × 10²¹), however, at much lower levels of significance compared to those uniquely expressed in Groups 1 and 2. It is notable that these processes could not be identified in top ten-scored GO processes in the conception cycle group (Group 1), while the metabolic process was identified at a much higher significance (p-value = 5.6 × 1055) in the non-fecund cycle group (Group 2).

3.3. Immunohistochemistrical Validation

Figure 2 and Figure 3 present representative photomicrographs of immunopositivity for ten (10) target antigens in epithelial and stromal compartments of rhesus monkey endometrium. Figure 4 and Figure 5 and Supplementary Materials Table S7 record the results of the semi-quantitative scores of immunopositivity for target antigens in epithelial and stromal compartments of monkey endometrium. Collectively, it appears that the degree of immunoprecipitation for AVEN, CHRND, FOXD3, GJD4, and MKS1 was markedly higher, while that for ADCY5, NNMT, TGFBR2, TOX2, and vWA5B1 was markedly lower in Group 1c compared with other sub-groups, particularly Group 2c. Thus, the protein expression profile of target genomic products validated the primary transcriptomics data. Some of these proteins were predominantly detected in epithelial cells (viz. FOXD3, GJD4, and MKS1), while a few of them were detected in both epithelium and stroma (viz. AVEN and CHRND). Endothelial cells of spiral arterioles showed a marked immunopositive stain for ADCY5 (see Figure 3) and VWA5B1 (see Figure 3) in the Group 2c (i.e., non-fecund cycle group, Day 6 after ovulation) samples, and for AVEN (see Figure 2) in the Group 1c (i.e., conception cycle group, Day 6 after ovulation) samples.

4. Discussion

Blastocyst implantation in several primates including the rhesus monkey and the human proceeds through timed attachment and adhesion to the uterine luminal epithelial wall in the receptive phase of the pregnancy cycle followed by disruption of junctional complexes between luminal epithelial cells by invasive trophoblasts [25]. In the period preceding embryo attachment, maternal endometrium in the natural conception cycle around Days 5–6 after ovulation when preimplantation embryos (PIEs) are mostly zona-encased reportedly display differential physiology as compared with that from a normal ovulatory cycle [2,7,19]. In the following stage, zona shedding and attachment–adhesion of the embryo occurs around Days 7–8 of gestation [2]. The possibility that genomic expression of receptive endometrium in such natural conception cycles exhibit differential display as compared to non-fecund cycles remained unexplored. In the present study, we have examined this possibility using rhesus monkey whole-genome expression in endometrium collected from mated monkeys yielding viable, synchronous preimplantation embryos and non-mated female monkeys with normal ovulatory cycles on Days 2, 4, and 6 after ovulation.

4.1. Genes Expressed in Both Groups and Involved in Protein Synthesis and Secretion along with Metabolic Processes Might Be Regulated by Progesterone

The GO analysis of endometrial transcriptomics in the present study revealed that the secretory phase endometrium of both conception and non-fecund cycles was perennially engaged in the protein synthesis and secretion along with marked involvement of metabolic processes. Table 4 and Supplementary Materials Table S6 substantiate the notion. A large number of genes related to protein synthesis and metabolism in endometrium are regulated in the estrogen-primed, progesterone-dominated secretory phase in several eutherian mammals including primates [2,45,46,47,48]. Progesterone-dependent differentially regulated expressions in endometrium take place presumably to support embryo growth and endometrial preparation for blastocyst implantation [2,49].

4.2. Genes Uniquely Expressed in Natural Conception Cycle and Involved in Induction of Immunotolerance to Non-Self Antigens Might Be Regulated by Factors in Seminal Plasma

Post-hoc analysis of the genes markedly expressed only in the preimplantation stage endometrium of mated animals, resulting in viable conception potentially reflect a characteristic bias towards processes involved in the major histocompatibility factor (MHC)-1. (i.e., MAMU-A and MAMU-E in the rhesus monkey) dependent induction of immunotolerance to non-self antigens [50,51]. This observation leads us to propose the following points in relation to the phenomenon of non-rejection of embryonic allograft by the receptive stage maternal endometrium during blastocyst implantation and establishment of pregnancy.
  • Immunotolerance to ovo-implantation in a natural pregnancy cycle is a primary process triggered in receptive endometrium, and it is not exclusively dependent on trophoblastic input, although it has—in all likelihood—reinforcing action to the process for successful establishment of pregnancy [52,53].
  • The regulation of underlying genomic expression of this process is not primarily dependent on progesterone, as the levels of progesterone in maternal circulation during the preimplantation period generally do not show any difference between fecund and non-fecund groups of animals [54,55].
  • The underlying genomic expression of the immunotolerance process in secretory phase endometrium is unlikely to be regulated by the preimplantation stage embryo because, in primates including the rhesus macaque, embryos seldom reach uterine lumen on Day 2 after ovulation [56]. Still, in the present study, we observed from transcriptomic expressions, endometrium geared towards immune tolerance to non-self antigens on Day 2 post-fertilization onwards.
  • A plausible explanation for the observed differentiation towards immunotolerance in the secretory phase endometrium of mated and proven fecund group of animals could be due to the presence of seminal plasma inducing the observed genomic expression. In fact, evidence based on a series of elegant experiments is now available across various mammalian species to indicate that seminal plasma exerts substantial modifying action on endometrium towards receptivity, ovo-implantation, immunotolerance, embryo development, and establishment of pregnancy [38,52,57,58,59,60,61,62]. To our knowledge, this is the first report supporting the notion that seminal plasma could induce at the genomic expression level a process bias for immunotolerance to non-self antigens in the secretory phase endometrium of natural conception cycle in the rhesus macaque.
The questions related to how and why seminal plasma might influence immune-tolerance in the endometrium of a pregnancy cycle appear challenging. Based on observed enrichment analysis of input data for GO processes in the present study, our hunch is that a shift in the reproductive tract cytokine milieu by factors present in seminal plasma induced peripheral anergy engaging MHC molecules along with suppression of co-stimulatory signals [52,63]. While understanding such proximate causation shall indeed provide direct leads for IVF-ET technology [47], the studies on supportive role of seminal plasma on endometrial receptivity in eutherian mammals from the viewpoints of reproductive ecology and evolution may yield knowledge of far-reaching significance [64,65]. These issues deserve attention in the future.

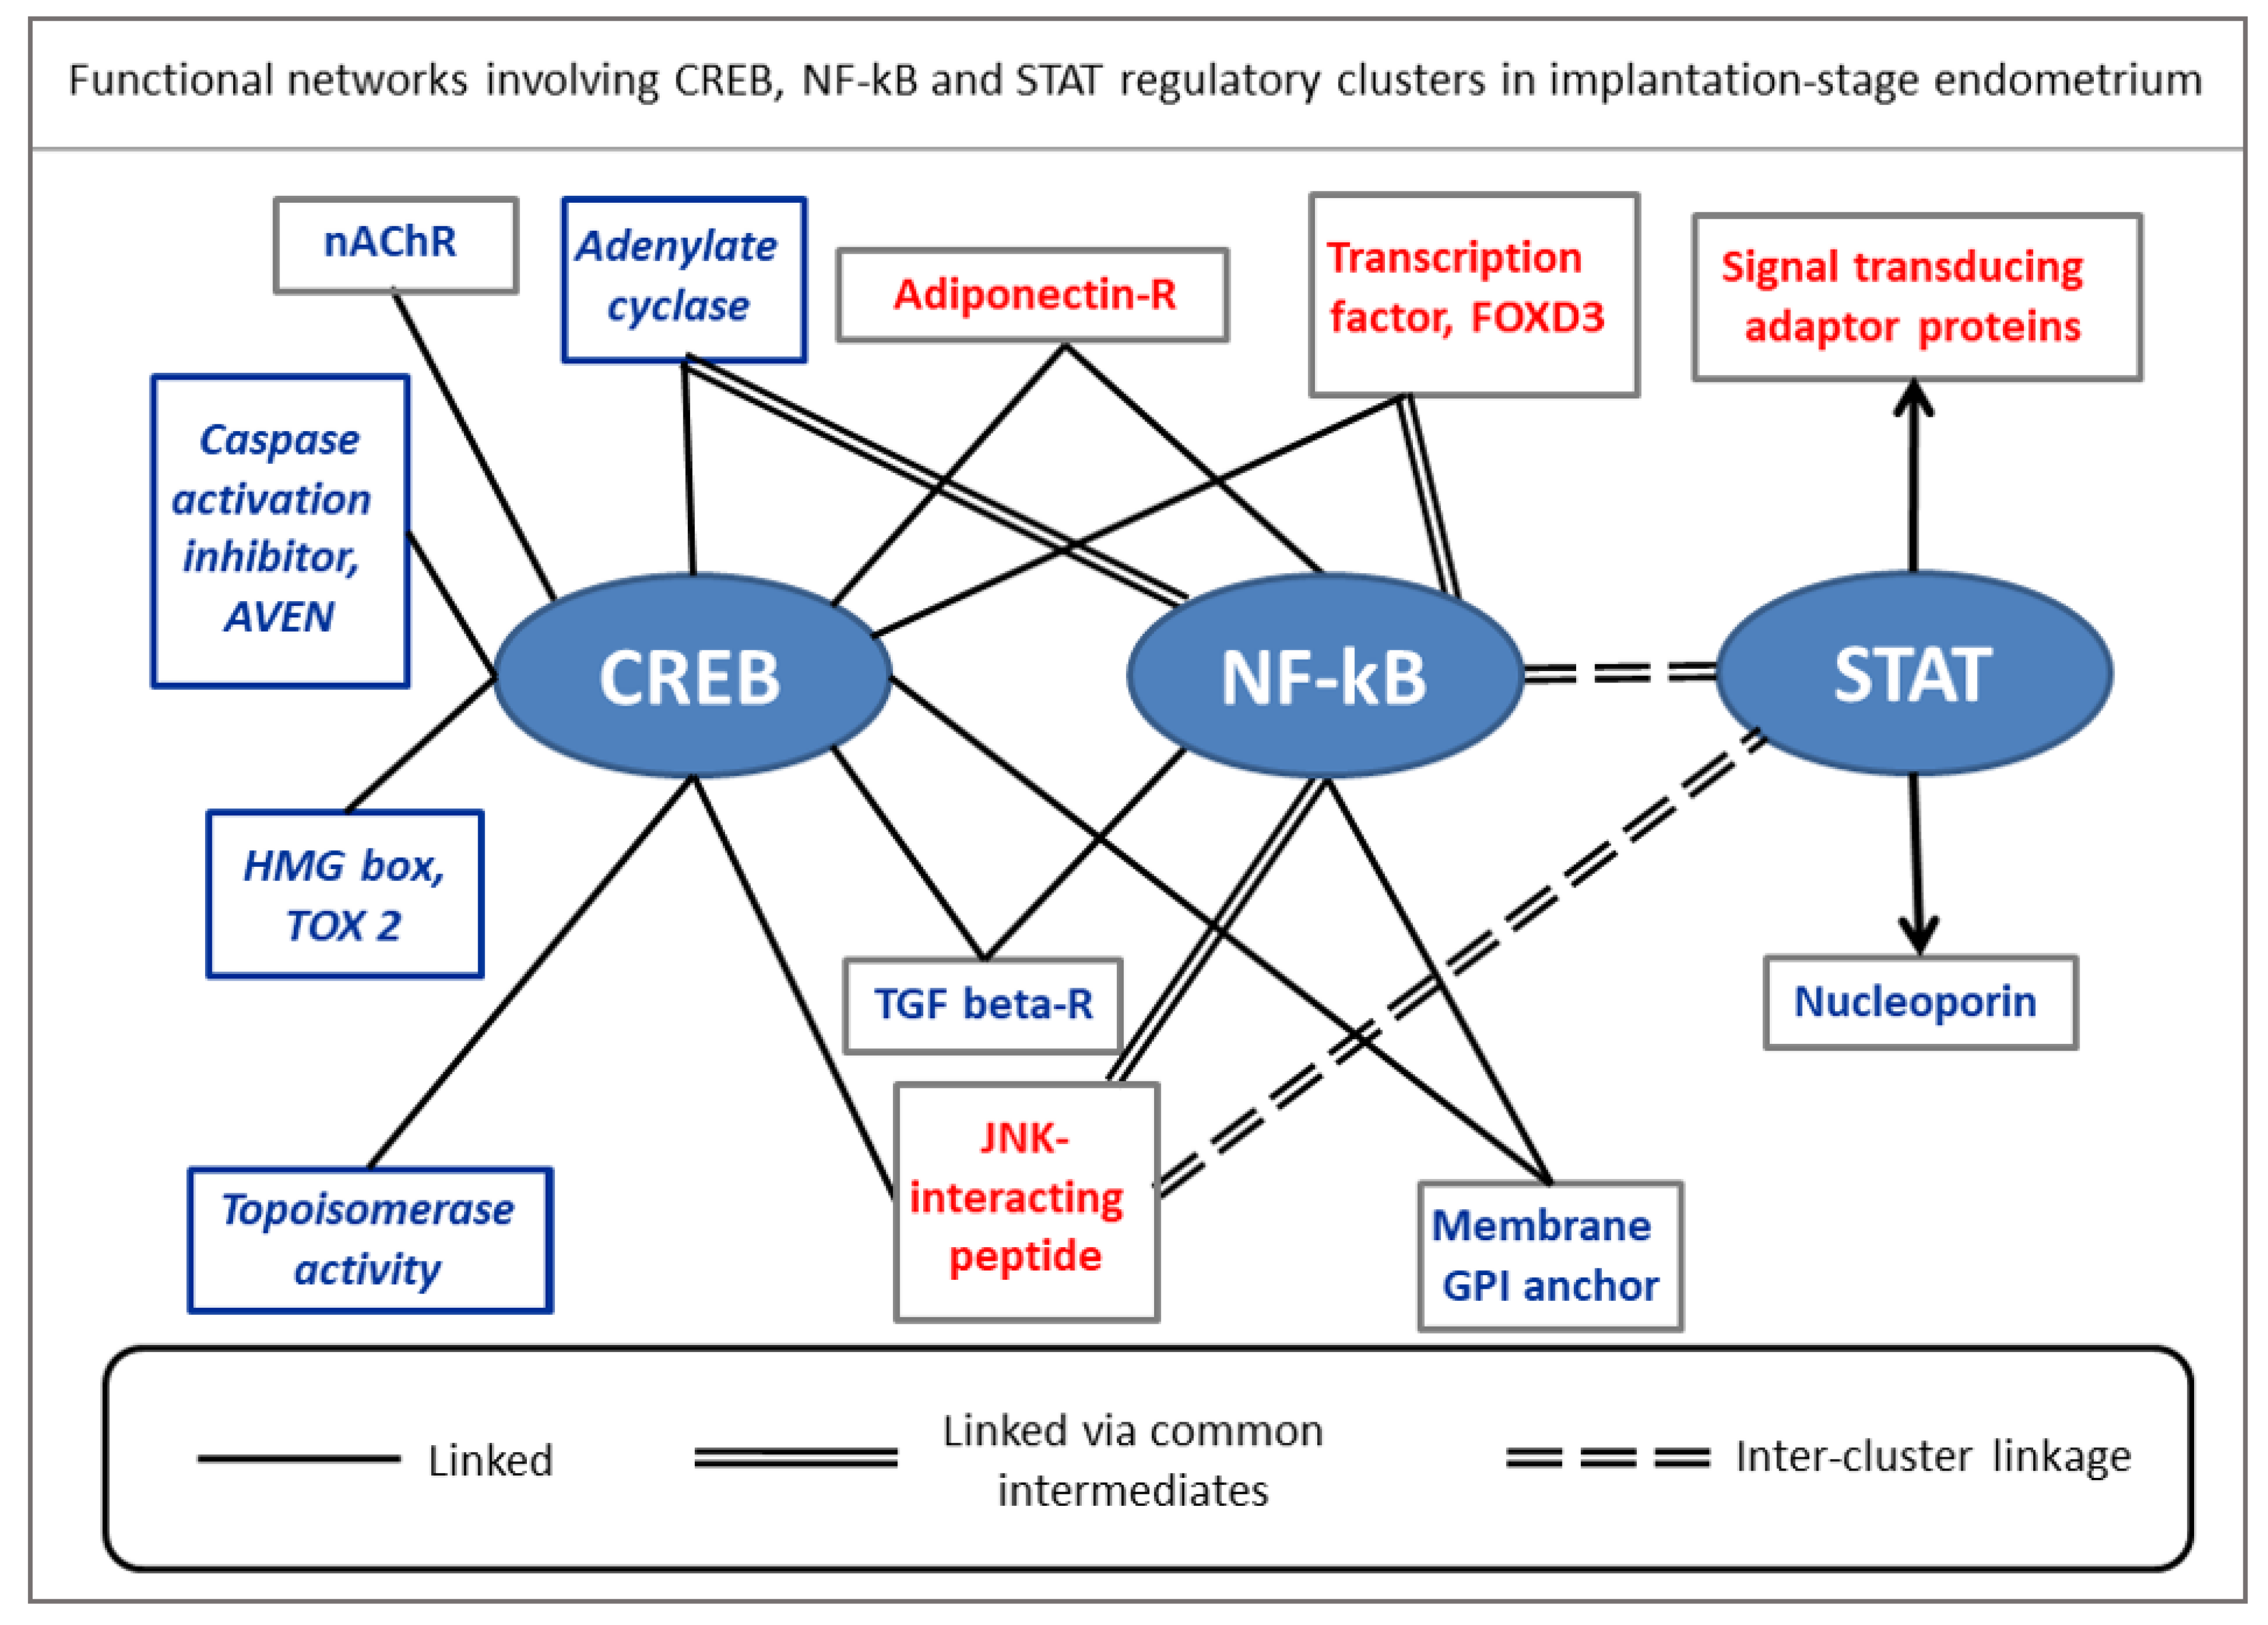
4.3. Genes Involved in Cell Polarity, Differentiation, Signaling, Fate, and Immunomodulation Might Be Regulated by Embryo-Derived Signals

The observation that a specific group of genes (AVEN, CHRND, FOXD3, GJD4, MAPK8IP3, MKS1, and NUP50) displayed upregulation, while another set of genes (ADCY5, NNMT, PATL1, PIGV, TGFBR2, TOX2, and VWA5B1) displayed down regulation in the endometrium on Day 6 after ovulation in the conception cycle only in the presence of retrievable, stage-matched embryos appears intriguing. Indeed, quantitative RT-PCR and immunohistochemical analysis of the candidate markers substantiated the observations of their differential regulation in steady state transcript expression on Day 6 after ovulation of conception cycle. These factors are reportedly involved in regulation of epithelial cell polarity (GJD4 and MKS1), stromal cell differentiation (ADCY5 and TOX2), cell fate (AVEN, FOXD3 and NNMT), signal transduction and transfer (GJD4 and MAPK8IP3), and immunomodulation (CHRND and TGFBR2). Table 5 enumerates the physiological functions of some of these proteins. Many of these factors are being reported for the first time to be differentially regulated in the implantation-stage endometrium in the fecund cycle of the rhesus macaque. The physiological modules to which these factors belong are putatively involved in the process of implantation [2,19,66,67,68,69,70,71,72,73,74]. Collectively, the results of the present study corroborate well with the notion that a preimplantation stage blastocyst on Day 6 of gestation imparts regulatory action, possibly via chemical mediators, on the physiology of receptive stage endometrium towards blastocyst implantation in the rhesus monkey [2,19].
Finally, based on the results obtained from the present study and available bioinformatics knowledge, we employed a causality clustering approach by grouping nodes into clusters according to their similarity in the overall information dynamics to obtain a simplified networking model [75]. This process yielded a functional network involving CREB, NF-kB, and STAT regulatory hubs as seen in Figure 6, and it appears to be operative in the implantation-stage endometrium. Previously reported several studies indeed have documented the critical importance of these regulatory clusters in the endometrium during blastocyst implantation [76,77,78,79].
Despite yielding novel leads regarding the transcriptomic expression of preimplantation stage maternal endometrium in natural conception cycle in a non-human primate species, the present study has limitations. Differential display analysis of expression data and histological features in immunohistochemistry in the present study did not indicate any marked variations in relative proportions of various cell types (viz., epithelial cells, endothelial cells, mesenchymal cells, smooth muscle cells, etc.) in the test samples. Nevertheless, quantitative immunopositivity scoring using specific antibodies against the repertoire of phenotypic markers, which would further validate the prediction, was missing in the present study [80,81,82]. Furthermore, the present study is a descriptive study conducted in semi-natural conditions and does not provide any direct proof of the concepts forwarded.

5. Conclusions

In conclusion, we infer that a triad of timed-actions of progesterone, seminal plasma, and preimplantation stage embryo on the genomic expression of secretory stage endometrium potentially involving a functional network of CREB, NF-kB, and STAT regulatory modules is integral to the evolution of its receptive stage for blastocyst implantation in the rhesus monkey. Further studies with more focused questions shall unravel the underlying core mechanism and the combinative impact of actions of individual elements of the proposed triad on secretory phase endometrium to gather usable knowledge towards endometrial approach to fertility regulation and control.

Supplementary Materials

The following supporting information can be downloaded at: https://www.mdpi.com/article/10.3390/reprodmed3010003/s1, Figure S1: Group-wise two-way hierarchical cluster analysis of expression array data yielding highest segregation between peri-implantation stage (groups 1b and 1c) and other (groups 2a–c and group 1a) samples (A), while K-means cluster analysis revealing two distinctive clusters: cluster 1 comprised of groups 1a and 2a–c, while cluster 2 comprised of groups 1b and 1c (B). Note cluster distance (cd) 1.0 denotes complete segregation, while cd = 0 denotes complete aggregation. Truncated expression data are shown.; Table S1: List of genes and their primers used for quantitative real time RT-PCR; Table S2: Details of primary antibodies against target antigens, Table S3: List of expressed genes in the endometrium of Conception cycle, Table S4: List of expressed genes in the endometrium of Non-fecund cycle, Table S5: List of expressed genes in the endometrium, Table S6, List of input genes in network objects of top-scored GO processes for two groups, Table S7: Scores a of immunohistochemical staining in epithelial and stromal compartments of endometrial functionalis of different sub-groups.

Author Contributions

Conceptualization: J.S. and D.G.; methodology: M.A.B., M.A.K., P.G.L.L. and D.G.; software: M.A.B., M.A.K., P.G.L.L. and J.P.; validation: M.A.B., J.P. and D.G.; formal analysis: M.A.B., J.P., J.S. and D.G.; investigation: P.G.L.L., J.S. and D.G.; resources: J.S. and D.G.; data curation: M.A.B., M.A.K. and D.G.; writing—original drafting: J.S. and D.G.; writing—review and editing: M.A.B., M.A.K., P.G.L.L., J.P., J.S. and D.G.; visualization: J.S. and D.G.; supervision: J.S. and D.G.; project administration: J.S. and D.G.; funding acquisition: J.S. and D.G. All authors have read and agreed to the published version of the manuscript.

Funding

Supports received from Department of Science and Technology, Government of India (SB/SO/HS-0036), the Rockefeller Foundation (94025#21) and the WHO-Rockefeller Foundation (96020#81).

Institutional Review Board Statement

Not applicable.

Informed Consent Statement

Not applicable.

Data Availability Statement

The original data are available at GEO repository accession number GSE108760.

Acknowledgments

The authors acknowledge the support received from the Primate Research Facility and the Cell and Molecular Physiology Laboratory of the Department of Physiology of the All India Institute of Medical Sciences Delhi, and the infrastructural support received from the All India Institute of Medical Sciences Delhi in the conduct of this research study.

Conflicts of Interest

The authors declare no conflict of interest.

References

  1. Macklon, N.S.; Geraedts, J.P.M.; Fauser, B.C.J.M. Conception to ongoing pregnancy: The ‘black box’ of early pregnancy loss. Hum. Reprod. Update 2002, 8, 333–343. [Google Scholar] [CrossRef] [PubMed] [Green Version]
  2. Sengupta, J.; Ghosh, D. Multi-level and multi-scale integrative approach to the understanding of human blastocyst implantation. Prog. Biophys. Mol. Biol. 2014, 114, 49–60. [Google Scholar] [CrossRef] [PubMed]
  3. Diedrich, K.; Fauser, B.C.; Devroey, P.; Griesinger, G. The role of the endometrium and embryo in human implantation. Hum. Reprod. Update 2007, 13, 365–377. [Google Scholar] [CrossRef] [PubMed]
  4. Monad, M.; Marsh, C.; Schumacher, K.; Nothnick, W. Secretory phase of menstruation and implantation. Front. Womens Health 2018, 3, 1–5. [Google Scholar] [CrossRef]
  5. Licht, P.; Lösch, A.; Dittrich, R.; Neuwinger, J.; Siebzehnrübl, E.; Wildt, L. Novel insights into human endometrial paracrinology and embryo-maternal communication by intrauterine microdialysis. Hum. Reprod. Update 1998, 4, 532–538. [Google Scholar] [CrossRef] [Green Version]
  6. Kim, S.M.; Kim, J.S. A review of mechanisms of implantation. Dev. Reprod. 2017, 21, 351–359. [Google Scholar] [CrossRef] [Green Version]
  7. Ochoa-Bernal, M.A.; Fazleabas, A.T. Physiologic events of embryo implantation and decidualization in human and non-human primates. Int. J. Mol. Sci. 2020, 21, 1973. [Google Scholar] [CrossRef] [Green Version]
  8. Roberts, R.M.; Xie, S.; Mathialagan, N. Maternal recognition of pregnancy. Biol. Reprod. 1996, 54, 294–302. [Google Scholar] [CrossRef] [Green Version]
  9. Lee, K.Y.; DeMayo, F.J. Animal models of implantation. Reproduction 2004, 128, 679–695. [Google Scholar] [CrossRef] [Green Version]
  10. Reese, J.; Wang, H.; Ding, T.; Paria, B.C. The hamster as a model for embryo implantation: Insights into a multifaceted process. Semin. Cell Dev. Biol. 2008, 19, 194–203. [Google Scholar] [CrossRef] [Green Version]
  11. Bazer, F.W. Pregnancy recognition signaling mechanisms in ruminants and pigs. J. Anim. Sci. Biotechnol. 2013, 4, 23. [Google Scholar] [CrossRef] [Green Version]
  12. Ka, H.; Heewon, H.; Choi, Y.; Yoo, I.; Han, J. Endometrial response to conceptus derived estrogen and interleukin-1β at the time of implantation in pigs. J. Anim. Sci. Biotechnol. 2018, 9, 44. [Google Scholar] [CrossRef]
  13. Harding, J.D. Nonhuman primates and translational research: Progress, opportunities, and challenges. ILAR J. 2017, 58, 141–150. [Google Scholar] [CrossRef] [Green Version]
  14. Friedman, H.; Ator, N.; Haigwood, N.; Newsome, W.; Allan, J.S.; Golos, T.G.; Kordower, J.H.; Shade, R.E.; Goldberg, M.E.; Bailey, M.R.; et al. The critical role of nonhuman primates in medical research. Pathog. Immun. 2017, 2, 352–365. [Google Scholar] [CrossRef] [Green Version]
  15. Neill, J.D.; Johansson, E.D.; Knobil, E. Patterns of circulating progesterone concentrations during the fertile menstrual cycle and the remainder of gestation in the rhesus monkey. Endocrinology 1969, 84, 45–48. [Google Scholar] [CrossRef]
  16. Lenton, E.A.; Sulaiman, R.; Sobowale, O.; Cooke, I.D. The human menstrual cycle: Plasma concentrations of prolactin, LH, FSH, oestradiol and progesterone in conceiving and non-conceiving women. J. Reprod. Fertil. 1982, 65, 131–139. [Google Scholar] [CrossRef] [Green Version]
  17. Ghosh, D.; De, P.; Sengupta, J. Luteal phase ovarian oestrogen is not essential for implantation and maintenance of pregnancy from surrogate embryo transfer in the rhesus monkey. Hum. Reprod. 1994, 9, 629–637. [Google Scholar] [CrossRef]
  18. Zegers-Hochschild, F.; Altieri, E. Luteal estrogen is not required for the establishment of pregnancy in the human. J. Assist. Reprod. Genet. 1995, 12, 224–228. [Google Scholar] [CrossRef]
  19. Ghosh, D.; Sengupta, J. Recent developments in endocrinology and paracrinology of blastocyst implantation in the primate. Hum. Reprod. Update 1998, 4, 153–168. [Google Scholar] [CrossRef] [Green Version]
  20. Ng, E.H.Y.; Yeung, W.S.B.; Lau, E.Y.L.; So, W.W.K.; Ho, P.C. A rapid decline in serum oestradiol concentrations around the mid-luteal phase had no adverse effect on outcome in 763 assisted reproduction cycles. Hum. Reprod. 2000, 15, 1903–1908. [Google Scholar] [CrossRef] [Green Version]
  21. Fishel, S.B.; Edwards, R.G.; Evans, C.J. Human chorionic gonadotropin secreted by preimplantation embryos cultured in vitro. Science 1984, 223, 816–818. [Google Scholar] [CrossRef] [Green Version]
  22. Hearn, J.P.; Webley, G.E.; Gidley-Baird, A.A. Chorionic gonadotrophin and embryo-maternal recognition during the peri-implantation period in primates. J. Reprod. Fertil. 1991, 92, 497–509. [Google Scholar] [CrossRef] [Green Version]
  23. Ghosh, D.; Stewart, D.R.; Nayak, N.R.; Lasley, B.L.; Overstreet, J.W.; Hendrickx, A.G.; Sengupta, J. Serum concentrations of oestradiol-17β, progesterone, relaxin and chorionic gonadotrophin during blastocyst implantation in natural pregnancy cycle and in embryo transfer cycle in the rhesus monkey. Hum. Reprod. 1997, 12, 914–920. [Google Scholar] [CrossRef] [Green Version]
  24. Hertig, A.T.; Rock, J.; Adams, E.C. A description of 34 human ova within the first 17 days of development. Am. J. Anat. 1956, 98, 435–493. [Google Scholar] [CrossRef]
  25. Enders, A.C.; Welsh, A.O.; Schlafke, S. Implantation in the rhesus monkey: Endometrial responses. Am. J. Anat. 1985, 173, 147–169. [Google Scholar] [CrossRef]
  26. Enders, A.C. Trophoblast differentiation during the transition from trophoblastic plate to lacunar stage of implantation in the rhesus monkey and human. Am. J. Anat. 1989, 186, 85–98. [Google Scholar] [CrossRef]
  27. Sengupta, J.; Ghosh, D. Blastocyst-endometrium interaction at implantation in the rhesus monkey. J. Reprod. Immunol. 2002, 53, 227–239. [Google Scholar] [CrossRef]
  28. Carter, A.M.; Allen, C.; Enders, A.C.; Pijnenborg, R. The role of invasive trophoblast in implantation and placentation of primates. Philos. Trans. R Soc. B Biol. Sci. 2015, 370, 20140070. [Google Scholar] [CrossRef]
  29. Enders, A.C.; Welsh, A.O. Structural interactions of trophoblast and uterus during hemochorial placenta formation. J. Exp. Zool. 1993, 266, 578–587. [Google Scholar] [CrossRef]
  30. Dhara, S.; Lalitkumar, P.G.L.; Sengupta, J.; Ghosh, D. Immunohistochemical localization of insulin-like growth factors I and II at the primary implantation site in the Rhesus monkey. Mol. Hum. Reprod. 2001, 7, 365–371. [Google Scholar] [CrossRef] [Green Version]
  31. Benirschke, K.; Burton, G.J.; Baergen, R.N. Nonvillous parts and trophoblast invasion. In Pathology of the Human Placenta, 6th ed.; Springer: New York, NY, USA, 2012; pp. 157–240. [Google Scholar]
  32. Ghosh, D.; Sengupta, J.; Hendrickx, A.G. Effect of single-dose, early luteal phase administration of mifepristone (RU486) on implantation stage endometrium in the rhesus monkey. Hum. Reprod. 1996, 11, 2026–2035. [Google Scholar] [CrossRef] [PubMed]
  33. Ghosh, D.; Sharkey, A.M.; Charnock-Jones, D.S.; Smith, S.K.; Sengupta, J. Effect of low-dose mifepristone administration on Day 2 after ovulation on transcript profiles in implantation-stage endometrium of rhesus monkeys. Reproduction 2009, 138, 357–370. [Google Scholar] [CrossRef] [PubMed] [Green Version]
  34. Farrell, R.E. RNA Methodologies—A Laboratory Guide for Isolation and Characterization, 4th ed.; Academic Press: San Diego, CA, USA, 2009; pp. 179–216. [Google Scholar]
  35. Khan, M.A.; Sengupta, J.; Mittal, S.; Ghosh, D. Genome-wide expressions in autologous eutopic and ectopic endometrium of fertile women with endometriosis. Reprod. Biol. Endocrinol. 2012, 10, 84. [Google Scholar] [CrossRef] [PubMed] [Green Version]
  36. Srivastava, A.; Sengupta, J.; Kriplani, A.; Roy, K.K.; Ghosh, D. Profiles of cytokines secreted by isolated human endometrial cells under the influence of chorionic gonadotropin during the window of embryo implantation. Reprod. Biol. Endocrinol. 2013, 11, 116. [Google Scholar] [CrossRef] [Green Version]
  37. Bhat, M.A.; Sharma, J.B.; Roy, K.K.; Sengupta, J.; Ghosh, D. Genomic evidence of Y chromosome microchimerism in the endometrium during endometriosis and in cases of infertility. Reprod. Biol. Endocrinol. 2019, 17, 22. [Google Scholar] [CrossRef] [Green Version]
  38. Bustin, S.A.; Benes, V.; Garson, J.A.; Hellemans, J.; Huggett, J.; Kubista, M.; Mueller, R.; Nolan, T.; Pfaffl, M.W.; Shipley, G.L.; et al. The MIQE guidelines: Minimum information for publication of quantitative real-time PCR experiments. Clin. Chem. 2009, 55, 611–622. [Google Scholar] [CrossRef] [Green Version]
  39. Livak, K.J.; Schmittgen, T.D. Analysis of relative gene expression data using real-time quantitative PCR and the 2(-Delta Delta C(T)) method. Methods 2001, 25, 402–408. [Google Scholar] [CrossRef]
  40. Adams, E.J.; Green, J.A.; Clark, A.H.; Youngson, J.H. Comparison of different scoring systems for immunohistochemical staining. Clin. Pathol. 1999, 52, 75–77. [Google Scholar] [CrossRef] [Green Version]
  41. Bondarenko, A.; Angrisani, N.; Meyer-Lindenberg, A.; Seitz, J.M.; Waizy, H.; Reifenrath, J. Magnesium-based bone implants: Immunohistochemical analysis of peri-implant osteogenesis by evaluation of osteopontin and osteocalcin expression. J. Biomed. Mater. Res. Part A 2014, 102, 1449–1457. [Google Scholar] [CrossRef]
  42. Sim, J.; Wright, C.C. The kappa statistic in reliability studies: Use, interpretation, and sample size requirements. Phys. Ther. 2005, 85, 257–268. [Google Scholar] [CrossRef] [Green Version]
  43. Sokal, R.R.; Rohlf, F.J. Biometry: The principles and practice of statistics. In Biological Research, 3rd ed.; Freeman: New York, NY, USA, 1995; pp. 445–447. [Google Scholar]
  44. Dytham, C. Choosing and Using Statistics: A Biologist’s Guide, 3rd ed.; Wiley-Blackwell: Hoboken, NJ, USA, 2010; pp. 145–150. [Google Scholar]
  45. Cummings, A.M.; Yochim, J.M. Differentiation of the uterus in preparation for gestation: A model for the action of progesterone. J. Ther. Biol. 1984, 106, 353–374. [Google Scholar] [CrossRef]
  46. Talbi, S.; Hamilton, A.E.; Vo, K.C.; Tulac, S.; Overgaard, M.T.; Dosiou, C.; Le Shay, N.; Nezhat, C.N.; Kempson, R.; Lessey, B.A.; et al. Molecular phenotyping of human endometrium distinguishes menstrual cycle phases and underlying biological processes in normo-ovulatory women. Endocrinology 2006, 147, 1097–1121. [Google Scholar] [CrossRef] [Green Version]
  47. Strowitzki, T.; Germeyer, A.; Popovici, R.; von Wolff, A. The human endometrium as a fertility-determining factor. Hum. Reprod. Update 2006, 12, 617–630. [Google Scholar] [CrossRef] [Green Version]
  48. Greening, D.W.; Nguyen, H.P.; Evans, J.; Simpson, R.J.; Salamonsen, L.A. Modulating the endometrial epithelial proteome and secretome in preparation for pregnancy: The role of ovarian steroid and pregnancy hormones. J. Proteom. 2016, 144, 99–112. [Google Scholar] [CrossRef]
  49. Edwards, R.G. Conception in the Human Female; Academic Press: London, UK, 1980; pp. 767–826. [Google Scholar]
  50. Daza-Vamenta, R.; Glusman, G.; Rowen, L.; Guthrie, B.; Geraghty, D.E. Genetic divergence of the rhesus macaque major histocompatibility complex. Genome Res. 2004, 14, 1501–1515. [Google Scholar] [CrossRef] [Green Version]
  51. Maccari, G.; Robinson, J.; Bontrop, R.E.; Otting, N.; Natasja, G.; de Groot, N.G.; Ho, C.S.; Ballingall, K.T.; Marsh, S.G.E.; Hammond, J.A. IPD-MHC: Nomenclature requirements for the non-human major histocompatibility complex in the next-generation sequencing era. Immunogenetics 2018, 70, 619–623. [Google Scholar] [CrossRef] [Green Version]
  52. Robertson, S.A.; Moldenhauer, L.M. Immunological determinants of implantation success. Int. J. Dev. Biol. 2014, 58, 205–217. [Google Scholar] [CrossRef] [Green Version]
  53. PrabhuDas, M.; Bonney, E.; Caron, K.; Caron, K.; Dey, S.; Erlebacher, A.; Fazleabas, A.; Fisher, S.; Golos, T.; Matzuk, M.; et al. Immune mechanisms at the maternal-fetal interface: Perspectives and challenges. Nat. Immunol. 2015, 16, 328–334. [Google Scholar] [CrossRef]
  54. Enders, A.C.; Hendrickx, A.G. Implantation in non-human primates-I. In Non-Human Primate Models for Study of Human Reproduction; Anand Kumar, T.C., Ed.; Karger: Basel, Switzerland, 1980; pp. 99–108. [Google Scholar]
  55. Ghosh, D.; Sengupta, J. Delineating the prime mover action of progesterone for endometrial receptivity in primates. Indian J Med Res. 2014, 140, S130–S136. [Google Scholar]
  56. Croxatto, B.H.; Diaz, S.; Fuentealba, B.; Croxatto, H.D.; Carrillo, D.; Fabres, C. Studies on the duration of egg transport in the human oviduct. I. The time interval between ovulation and egg recovery from the uterus in normal women. Fertil. Steril. 1972, 27, 447–458. [Google Scholar] [CrossRef]
  57. Bromfield, J.J. Seminal fluid and reproduction: Much more than previously thought. J. Assist. Reprod. Genet. 2014, 31, 627–636. [Google Scholar] [CrossRef] [PubMed] [Green Version]
  58. Nederlof, I.; Meulemana, T.; van der Hoorn, M.L.P.; Claas, F.H.J.; Eikmans, M. The seed to success: The role of seminal plasma in pregnancy. J. Reprod. Immunol. 2017, 123, 24–28. [Google Scholar] [CrossRef] [PubMed]
  59. Martinez, C.A.; Cambra, J.M.; Parrilla, I.; Roca, J.; Ferreira-Dias, G.; Pallares, F.J.; Lucas, X.; Vazquez, J.M.; Martinez, E.A.; Gil, M.A.; et al. Seminal plasma modifies the transcriptional pattern of the endometrium and advances embryo development in pigs. Front. Vet. Sci. 2019, 6, 465. [Google Scholar] [CrossRef] [PubMed] [Green Version]
  60. Morgan, H.L.; Watkins, A.J. The influence of seminal plasma on offspring development and health. Semin. Cell Dev. Biol. 2020, 97, 131–137. [Google Scholar] [CrossRef]
  61. Mayoral Andrade, G.; Vásquez Martínez, G.; Pérez-Campos Mayoral, L.; Hernández-Huerta, M.T.; Zenteno, E.; Pérez-Campos Mayoral, E.; Martínez Cruz, M.; Martínez Cruz, R.; Matias-Cervantes, C.A.; Meraz Cruz, N.; et al. Molecules and prostaglandins related to embryo tolerance. Front. Immunol. 2020, 11, 555414. [Google Scholar] [CrossRef]
  62. Mateo-Otero, Y.; Sánchez, J.M.; Recuero, S.; Bagés-Arnal, S.; McDonald, M.; Kenny, D.A.; Yeste, M.; Lonerga, P.; Fernandez-Fuertes, B. Effect of exposure to seminal plasma through natural mating in cattle on conceptus length and gene expression. Front. Cell Dev. Biol. 2020, 8, 341. [Google Scholar] [CrossRef]
  63. Mueller, D.L. Mechanisms maintaining peripheral tolerance. Nat Immunol. 2010, 11, 21–27. [Google Scholar] [CrossRef]
  64. Parham, P.; Moffett, A. Variable NK cell receptors and their MHC class I ligands in immunity, reproduction and human evolution. Nat. Rev. Immunol. 2013, 13, 133–144. [Google Scholar] [CrossRef] [Green Version]
  65. De Groot, N.; Blokhuis, J.H.; Doxiadis, G.G.M.; Bontrop, R.E. Co-evolution of the MHC class I and KIR gene families in rhesus macaques: Ancestry and plasticity. Immunol. Rev. 2015, 267, 228–245. [Google Scholar] [CrossRef]
  66. Tanaka, N.; Miyazaki, K.; Tashiro, H.; Mizutani, H.; Okamura, H. Changes in adenylyl cyclase activity in human endometrium during the menstrual cycle and in human decidua during pregnancy. J. Reprod. Fertil. 1993, 98, 33–39. [Google Scholar] [CrossRef]
  67. Jones, R.L.; Stoikos, C.; Findlay, J.K.; Salamonsen, L.A. TGF-beta superfamily expression and actions in the endometrium and placenta. Reproduction 2006, 132, 217–232. [Google Scholar] [CrossRef]
  68. Kuokkanen, S.; Chen, B.; Ojalvo, L.; Benard, L.; Santoro, N.; Pollard, J.W. Genomic profiling of microRNAs and messenger RNAs reveals hormonal regulation in microRNA expression in human endometrium. Biol. Reprod. 2010, 82, 791–801. [Google Scholar] [CrossRef] [Green Version]
  69. Sales, K.J.; Grant, V.; Catalano, R.D.; Jabbour, H.N. Chorionic gonadotrophin regulates CXCR4 expression in human endometrium via E-series prostanoid receptor 2 signalling to PI3K-ERK1/2: Implications for fetal-maternal crosstalk for embryo implantation. Mol. Hum. Reprod. 2011, 17, 22–32. [Google Scholar] [CrossRef] [Green Version]
  70. Emera, D.; Romero, R.; Wagner, G. The evolution of menstruation: A new model for genetic assimilation: Explaining molecular origins of maternal responses to fetal invasiveness. BioEssays 2012, 34, 26–35. [Google Scholar] [CrossRef] [Green Version]
  71. Altmäe, S.; Martinez-Conejero, J.A.; Esteban, F.J.; Ruiz-Alonso, M.; Stavreus-Evers, A.; Horcajadas, J.A.; Salumets, A. MicroRNAs miR-30b, miR-30d, and miR-494 regulate human endometrial receptivity. Reprod. Sci. 2013, 20, 308–317. [Google Scholar] [CrossRef] [Green Version]
  72. Kusama, K.; Yoshie, M.; Tamura, K.; Kodaka, Y.; Hirata, A.; Sakurai, T.; Bai, H.; Imakawa, K.; Nishi, H.; Isaka, K.; et al. Regulation of decidualization in human endometrial stromal cells through exchange protein directly activated by cyclic AMP (Epac). Placenta 2013, 34, 212–221. [Google Scholar] [CrossRef]
  73. Aplin, J.D.; Ruane, P.T. Embryo-epithelium interactions during implantation at a glance. J. Cell Sci. 2017, 130, 15–22. [Google Scholar] [CrossRef] [Green Version]
  74. Zanin, M. Simplifying functional network representation and interpretation through causality clustering. Sci. Rep. 2021, 11, 15378. [Google Scholar] [CrossRef]
  75. Page, M.; Tuckerman, E.M.; Li, T.C.; Laird, S.M. Expression of nuclear factor kappa B components in human endometrium. J. Reprod. Immunol. 2002, 54, 1–13. [Google Scholar] [CrossRef]
  76. Ersahin, A.; Acet, M.; Acet, T.; Yavuz, Y. Disturbed endometrial NF-kB expression in women with recurrent implantation failure. Eur. Rev. Med. Pharm. Sci. 2016, 20, 5037–5040. [Google Scholar]
  77. Sakowicz, A. The role of NFκB in the three stages of pregnancy—Implantation, maintenance, and labour: A review article. BJOG 2018, 125, 1379–1387. [Google Scholar] [CrossRef] [Green Version]
  78. Massimiani, M.; Lacconi, V.; Civita, F.L.; Ticconi, C.; Rago, R.; Campagnolo, L. Molecular signaling regulating endometrium–blastocyst crosstalk. Int. J. Mol. Sci. 2019, 21, 23. [Google Scholar] [CrossRef] [Green Version]
  79. Mrozikiewicz, A.E.; Ozarowski, M.; Jedrzejczak, P. Biomolecular markers of recurrent implantation failure—A review. Int. J. Mol. Sci. 2021, 22, 10082. [Google Scholar] [CrossRef]
  80. Shen-Orr, S.S.; Gaujoux, R. Computational deconvolution: Extracting cell type-specific information from heterogeneous samples. Curr. Opin. Immunol. 2013, 25, 571–578. [Google Scholar] [CrossRef] [Green Version]
  81. Newman, A.M.; Liu, C.L.; Green, M.R.; Gentles, A.J.; Feng, W.; Xu, Y.; Hoang, C.D.; Diehn, M.; Alizadeh, A.A. Robust enumeration of cell subsets from tissue expression profiles. Nat. Methods 2015, 12, 453–457. [Google Scholar] [CrossRef] [Green Version]
  82. Breschi, A.; Muñoz-Aguirre, M.; Wucher, V.; Davis, C.A.; Garrido-Martín, D.; Djebali, S.; Gillis, J.; Pervouchine, D.D.; Vlasova, A.; Dobin, A.; et al. A limited set of transcriptional programs define major cell types. Genom. Res. 2020, 30, 1047–1059. [Google Scholar] [CrossRef]
  83. Gellersen, B.; Brosens, J.J. Cyclic decidualization of the human endometrium in reproductive health and failure. Endocr. Rev. 2014, 35, 851–905. [Google Scholar] [CrossRef]
  84. Thandapani, P.; O’Connor, T.R.; Bailey, T.L.; Richard, S. Defining the RGG/RG motif. Mol. Cell. 2013, 50, 613–623. [Google Scholar] [CrossRef] [Green Version]
  85. Stokes, C.; Treinin, M.; Papke, R.L. Looking below the surface of nicotinic acetylcholine receptors. Trends Pharm. Sci. 2015, 36, 514–523. [Google Scholar] [CrossRef] [Green Version]
  86. Saez, J.C.; Berthoud, V.M.; Branes, M.C.; Martinez, A.D.; Beyer, E.C. Plasma membrane channels formed by connexins: Their regulation and functions. Physiol. Rev. 2003, 83, 1359–1400. [Google Scholar] [CrossRef] [Green Version]
  87. Krishnakumar, R.; Chen, A.F.; Pantovich, M.G.; Danial, M.; Parchem, R.J.; Labosky, P.A.; Blelloch, R. FOXD3 regulates pluripotent stem cell potential by simultaneously initiating and repressing enhancer activity. Cell Stem Cell. 2016, 18, 104–117. [Google Scholar] [CrossRef] [PubMed] [Green Version]
  88. Singh, J.; Mlodzik, M. Planar cell polarity signaling: Coordination of cellular orientation across tissues. Wiley Interdiscip. Rev. Dev. Biol. 2012, 1, 479–499. [Google Scholar] [CrossRef] [PubMed] [Green Version]
  89. Ulanovskaya, O.A.; Zuhl, A.M.; Cravatt, B.F. NNMT promotes epigenetic remodelling in cancer by creating a metabolic methylation sink. Nat. Chem. Biol. 2013, 9, 300–306. [Google Scholar] [CrossRef] [PubMed] [Green Version]
  90. Vong, Q.P.; Leung, W.H.; Houston, J.; Li, Y.; Rooney, B.; Holladay, M.; Oostendorp, R.A.; Leung, W. TOX2 regulates human natural killer cell development by controlling T-BET expression. Blood 2014, 124, 3905–3913. [Google Scholar] [CrossRef]
Figure 1. Schematic presentation of comparative expression data for matching and non-matching genes in between groups (A) and within-group analysis for conception cycle (B) and non-fecund cycle (C), and presentation of the fact that numbers of expressed genes matching between groups displayed a clear declining trend with increasing number of expressed non-matching genes with time in between-groups analysis (D). Numbers of expressed genes common on different days in Group 1 (i.e., conception cycle group) are shown in green italics (B) and in Group 2 (i.e., the non-fecund cycle group) are shown in red italics (C). Note that the dimensions of Venn circles are not in scale. For details, see Section 3 and Supplementary Materials Tables S3–S5.
Reprodmed 03 00003 g001
Figure 2. Micrographs of immunohistochemical staining for AVEN (1–7), CHRND (8–14), FOXD3 (15–21), GJD4 (22–28), and MKS1 (29–35) in endometrial tissue samples collected from mated conception cycles (Group 1; 1–3, 8–10, 15–17, 22–24, and 29–31) and non-mated cycles (Group 2; 4–6, 11–13, 18–20, 25–27, 32–34) on Days 2 (Groups 1a and 2a), 4 (Groups 1b and 2b), and 6 (Groups 1c and 2c) after ovulation. Control immunostainings were performed by omitting primary antibodies (7, 35), or secondary antibody (14), by adsorbing the primary antibodies with the primary antigens (21, 28). Marked immunostaining for AVEN (3), CHRND (10), GJD4 (24), and MKS1 (31) is detected in the luminal and glandular epithelium on Day 6 of gestation in Group 1 samples. Immunopositivity for AVEN is also present in cells of the stromal compartment (3). Marked AVEN positivity is notable in blood vessels in Day 6 post-ovulation conception cycle (Group 1c). Bar: 10 μm (8–12, 15, 16, 18, 19), and 20 μm (1–7, 10, 13, 14, 17, 20–35).
Reprodmed 03 00003 g002
Figure 3. Micrographs of immunohistochemical staining for ADCY5 (1–7), NNMT (8–14), TGFBR2 (15–21), TOX2 (22–28), and VWA5B1 (29–35) in endometrial tissue samples collected from mated conception cycles (Group 1; 1–3, 8–10, 15–17, 22–24, 29–31) and non-mated cycles (Group 2; 4–6, 11–13, 18–20, 25–27, 32–34) on Days 2 (Groups 1a and 2a), 4 (Groups 1b and 2b), and 6 (Groups 1c and 2c) after ovulation. Control immunostainings were performed by omitting primary antibodies (7, 14), or secondary antibodies (21, 28) or by adsorbing the primary antibody with the primary antigen (35). Marked immunostaining for ADCY5 (6), NNMT (13), TGFBR2 (20), and TOX2 (27) is seen in Day 6 post-ovulation Group 2c samples primarily in the apical borders of luminal and glandular epithelium. Immunopositive staining for TGFBR2 (20) is also present in cells of the stromal compartment, while endothelial cells of spiral arterioles show immunopositivity for ADCY5 (6) and VWA5B1 (34) in the Group 2. Bar: 10 μm (1, 4, 8, 9, 11, 12, 16, 19, 23, 26) and 20 μm (2, 3, 5–7, 10, 13–15, 17, 18, 20–22, 24, 25, 27–35).
Reprodmed 03 00003 g003
Figure 4. Box plots showing 10–90 percentile distribution of scores along with median values obtained from semi-quantitative assessments of immunopositivity for ADCY5, AVEN, CHRND, FOXD3, GJD4, MKS1, NNMT, TGFBR2, TOX2, and VWA5B1 in the epithelial compartment of secretory phase endometrium obtained from pre-implantation phase of conception cycle (Group 1, blue box) and from non-mated non-fecund cycle (Group 2, grey box). * significantly different from other subgroups. * −1.4, significantly different from other subgroups except Day 4 after ovulation in the Group 1 (conception cycle). * −2.4, significantly different from other subgroups except Day 4 after ovulation in the Group 2 (non-fecund cycle). * −2.4, 2.6, significantly different from other subgroups except Days 4 and 6 after ovulation in the Group 2 (non-fecund cycle), respectively. For methodological details, see Section 2. For further details, see Supplementary Materials Table S7.
Reprodmed 03 00003 g004
Figure 5. Box plots showing 10–90 percentile distribution of scores along with median values obtained from semi-quantitative scores of immunopositivity for ADCY5, AVEN, CHRND, FOXD3, GJD4, MKS1, NNMT, TGFBR2, TOX2, and VWA5B1 in the stromal compartment of secretory phase endometrium obtained from pre-implantation phase of conception cycle (Group 1, blue box) and from non-fecund cycle (Group 2, grey box). * significantly different from other subgroups. * /1.4, 1.6, significantly different from Days 4 and 6 after ovulation in the Group 1 (conception cycle). * −1.4, significantly different from other subgroups except Day 4 after ovulation in the Group 1 (conception cycle). * −2.4, significantly different from other subgroups except Day 4 after ovulation in the Group 2 (non-fecund cycle). * −1.2, 1.4, significantly different from other subgroups except Days 2 and 4 after ovulation in the Group 1 (conception cycle), respectively. * −2.4, 2.6, significantly different from other subgroups except Days 4 and 6 after ovulation in the Group 2 (non-fecund cycle), respectively. For methodological details, see Section 2. For further details, see Supplementary Materials Table S7.
Reprodmed 03 00003 g005
Figure 6. Proposed functional networks involving CREB, NF-kB, and STAT regulatory clusters in implantation-stage endometrium. A causality clustering approach by grouping nodes into clusters according to their similarity in the overall information dynamics was employed to obtain a simplified networking model. Upregulated genes reportedly under progesterone regulation are shown in blue fonts in grey boxes, while up-regulated genes putatively under regulation of embryo-derived signals are shown in blue italic fonts in blue boxes, and downregulated genes under progesterone regulation are shown in red fonts in grey boxes.
Reprodmed 03 00003 g006
Table 1. Details of number distribution of animals in different experimental groups for different experiments.
Group a (Subgroup)Day after Ovulation bNumber of
Animals RecruitedOvulatedRNA Samples Obtained/Extracted cUsed in Array/Qrtpcr dTissue Samples Used Immunohistochemistry e
1(A)21210544
1(B)41211544
1(C)61110544
Total3531151212
2(A)21210644
2(B)41210544
2(C)61210544
Total3630161212
a females in Group 1 were allowed to mate with proven fertile males during days 8 to 16 of ovulatory cycles, while females in Group 2 were not allowed to cohabit with any male. b day of ovulation was assessed from the profiles of estradiol-17β and progesterone in peripheral serum samples. c samples from animals that failed to ovulate or failed to yield age- and staged-matched preimplantation embryos were not included. d based on RNA yield and RIN score. e different set of samples used in this experiment. For details, see Section 2.
Table 2. General information of array experiments.
1. GEO accession number GSE108760
2. Microarray details
 Product name: Rhesus (V2) Macaque gene expression microarray
 Product format per slide: 4 × 44 K; 60-mer printed oligonucleotides
 Total number of probes/chip: 45,018
 Total number of genes/chip: 17,987
 Content source: RefSeq Release 37, UCSC mRNA,
UniGene Build 13,ENSEMBL Release
56, rheMac2
3. Descriptive details of microarray data
 Total number of hybridized a
Probes: 20,277
Genes: 12,489
4. Details of hybridized probes (genes), Group-wise
Group detailsNumber of samples arrayedQuantitative description of hybridized a probes (genes)
Estimate bPer cent
Group 1(a) 411,218 ± 376 (7922 ± 214)55.3 (63.4)
Group 1(b) 49574 ± 372 (7645 ± 85)47.2 (61.2)
Group 1(c) 412,603 ± 592 (7394 ± 216)62.2 (59.2)
Group 2(a) 411,386 ± 337 (8805 ± 261)56.2 (70.5)
Group 2(b) 411,230 ± 462 (8294 ± 298)55.4 (66.4)
Group 2(c) 411,684 ± 334 (8374 ± 260)57.6 (67.0)
a hybridization signal more than mean (optimized with background signal) + 2SD. b >0 in normalized log2 scale shown as means ± SDs.
Table 3. Genes showing differential expression in pair-wise analysis between subgroups.
Serial Number Gene Name (Gene Symbol)Fold Change Based on (pFDR)
Expression ArraysRT-PCR
Between Day 6 and Day 2 after ovulation in conception cycle group (Group 1c vs. Group 1a)
Up-regulated
1.Cholinergic receptor, nicotinic, delta (CHRND)18.68 (0.046)3.80 (0.011)
2.Forkhead box D3 (FOXD3)5.91 (0.024)5.76 (0.006)
3.Gap Junction Protein, delta 4, 40.1 kDa (GJD4)3.79 (0.019)26.29 (0.006)
4.Mitogen-activated protein kinase 8 interacting protein 3 (MAPK8IP3)5.39 (0.020)3.99 (0.014)
5.Meckel syndrome, type 1 (MKS1)6.29 (0.023)3.98 (0.029)
6.Nucleoporin 50 kDa (NUP50)2.18 (0.021)2.39 (0.011)
Down-regulated
1.Adenylate cyclase 5 (ADCY5)5.95 (0.028)4.13 (0.026)
2.Adiponectin receptor 1 (ADIPOR1)4.45 (0.018)2.12 (0.030)
3.Nicotinamide N-methyltransferase (NNMT)16.77 (0.046)3.08 (0.018)
4.Protein associated with topoisomerase II (PATL1)2.01 (0.001)2.65 (0.012)
5.Phosphatidylinositol glycan anchor biosynthesis, class V (PIGV)2.01 (0.003)3.86 (0.007)
6.Transforming growth factor, beta receptor II (TGFBR2)3.24 (0.009)2.16 (0.013)
7.TOX high mobility group box family member 2 (TOX2)18.92 (0.015)13.85 (0.015)
8.von Willebrand factor A domain containing 5B1 (VWA5B1)10.58 (0.003)19.48 (0.001)
Between conception cycle and non-fecund cycle groups on Day 6 after ovulation (Group 1c vs. Group 2c)
Up-regulated
1.Apoptosis, caspase activation inhibitor (AVEN)2.02 (0.011)17.20 (0.012)
Down-regulated
1.Adenylate cyclase 5 (ADCY5)6.14 (0.011)18.00 (0.007)
2.Nicotinamide N-methyltransferase (NNMT)18.02 (0.015)4.74 (0.002)
3.TOX high mobility group box family member 2 (TOX2)20.54 (0.039)2.10 (0.012)
4.von Willebrand factor A domain containing 5B1 (VWA5B1)11.27 (0.036)52.00 (0.001)
Table 4. Cardinal features in top-scored GO processes based on enrichment analysis of expressed genes in two groups *.
Group Number (Group Description)(Number of Genes Group Specifically Expressed)GO Process (p-Value)Number of Network Objects
TotalInput Data
Group 1 (Conception cycle) [809]Positive regulation of tolerance induction to non-self antigen (2.4 × 10⁻³¹)2523 a
Group 2 (Non-fecund cycle) [1899]Metabolic process 5.6 × 10−5511,8511275 a
Groups 1 and 2 [370]Protein targeting to membrane (1.1 × 10⁻²¹)/and endoplasmic reticulum (3.7 × 10⁻²¹)109/11425 a
Metabolic process 4.0 × 10−2115515 a
* from top-scored ten entries based on analysis on MetaCore portal from Thomson Reuters (https://portal.genego.com accessed on 13 December 2020). a vide Supplementary Materials Table S6.
Table 5. Known physiological functions of proteins differentially expressed in endometrium in presence of zonal blastocyst on Day 6 of gestation.
Marker Proteins (Alias)Physiological FunctionsReference
Adenylate cyclase 5 (ADCY5)Class III adenylate cyclase gene family expressed as transmembrane protein catalyzing the formation of cAMP in response to G-protein signaling. Required for stromal cell decidualization in mammals.Gellersen and Brosens [83]
Apoptosis, caspase activation (AVEN)Involved in cell fate regulation, stabilizes pro-survival protein BclxL, inhibits pro-apoptosis protein Apaf-1 function, exhibits cell cycle regulatory function.Thandapani et al. [84]
Cholinergic receptor nicotinic, delta (CHRND)Family of pentameric acetylcholine-gated ion channels expressed in both neuronal, non-neuronal cells. Mediates signal transduction independent of generating ion currents in non-neuronal cells. Suppresses pro-inflammatory cytokines in the cholinergic anti-inflammatory pathway (CAP) in epithelial and endothelial cells.Stokes et al. [85]
Connexin 40.1 (GJD4)Involved in formation of gap junctional intercellular of communication (GJIC) for direct intercellular transfer ions and small molecules, cAMP, and cGMP and propagation of inositol trisphosphate-dependent calcium waves, involved in growth control, differentiation, and apoptosis of normal cells.Saez et al. [86]
Foxhead box D3 (FOXD3)Tumor suppressor. Member of forkhead box (FOX) family of transcription factors bearing helix-turn-helix DNA binding motif that interacts with DNA consensus sequences for nuclear localization and transcriptional regulation. Required for maintenance of cellular pluripotency and epigenetic priming of enhancers.Krishnakumar et al. [87]
Meckel syndrome1 (MKS1)Structural protein required for ciliogenesis. Also involved in planar cell polarity of epithelium and directional cell migration.Singh and Mlodzik [88]
Nicotinamide-N-methyl (NNMT)Catalyses S-adenosyl-L-methionine (SAM) to generate S-adenosyl-homocysteine (SAH). SAM donates methyl groups to substrates including histones. High NNMT expression results in hypomethylated histone proteins.Ulanovskaya et al. [89]
Transforming growth receptor 2 (TGFBR2)Mediates pleiotropic functions of TGFb (beta). isoforms 1–3. Involved in implantation stage immune surveillance through functioning of endometrium and placenta including their immuno-modulatory/anti-inflammatory actions.Jones et al. [64]
TOX high mobility group, box family member 2 (TOX2)Transcription factor belonging to TOX family domain, involved in differentiation and maturation of different cell types.Vong et al. [90]
Publisher’s Note: MDPI stays neutral with regard to jurisdictional claims in published maps and institutional affiliations.

