Article

Monitoring Water Balance to Predict Hospitalization in Patients with Chronic Heart Failure: A Retrospective Study

1
Department of Internal Medicine, Hirose Hospital, Sagamihara 252-0105, Kanagawa, Japan
2
Department of Forest Management, Forestry and Forest Products Research Institute, Tsukuba 305-8687, Ibaraki, Japan
3
Clinical Research Center, Hirose Hospital, Sagamihara 252-0105, Kanagawa, Japan
4
Department of Home Care Medicine Hirose Hospital, Sagamihara 252-0105, Kanagawa, Japan
*
Author to whom correspondence should be addressed.
Hearts 2023, 4(3), 48-58; https://doi.org/10.3390/hearts4030006
Submission received: 14 June 2023 / Revised: 3 July 2023 / Accepted: 4 July 2023 / Published: 7 July 2023

Abstract

:
Background: Patients with chronic heart failure often experience repeated acute exacerbations leading to high rates of rehospitalization. Therefore, the management of patients to prevent rehospitalization and retain their physical function is important. Brain natriuretic peptide (BNP) and N-terminal-pro BNP are used to estimate the conditions of patients with chronic heart failure, but some hospitals cannot measure these levels in real time. To overcome this, we used bioelectrical impedance analysis as an alternative. Methods and results: Between April 2017 and December 2019, we measured water balance in the outpatient department of Hirose Hospital in three groups: those who had been hospitalized for chronic heart failure (257 patients), those with chronic heart failure who had not been hospitalized (224 patients), and controls with other chronic diseases (275 patients). We found that water balance was significantly correlated to the history of hospitalization, and age was a confounding bias in this correlation, regardless of whether patients have been hospitalized with chronic heart failure. Moreover, patients who have high extracellular water content/total body water content ratios, even in a stable period, are at risk of becoming unstable and experiencing rehospitalization. Conclusion: Water balance monitoring could be a useful indicator to estimate patient condition in real time and predict improvement in chronic heart failure. This easy-to-use indicator may enable timely management of exacerbation of patient condition and reduce hospitalization events.

1. Introduction

Patients with chronic heart failure often experience repeated acute exacerbations leading to high rates of rehospitalization [1,2,3,4,5]. Therefore, the management of patients to prevent rehospitalization and retain physical function is important. This requires a simple and quick assessment of the condition of the patient with chronic heart failure.
Brain natriuretic peptide (BNP) and N-terminal-pro BNP (NT-proBNP) have recently been used to assess chronic heart failure [6,7,8]. However, BNP and NT-proBNP require special apparatus for real-time measurement. Since these cannot be quickly measured in hospitals that do not have this equipment, assessing patient condition in real time and preventing exacerbation of chronic heart failure becomes difficult. Additionally, owing to the health insurance regime, BNP and NT-proBNP assessments cannot be performed frequently in Japan.
To overcome these problems, we used bioelectrical impedance analysis (BIA) as an alternative. Patients with chronic heart failure do not effectively circulate blood to the whole body because of a drop in cardiac function, which can easily lead to congestion and/or edema. [9,10]. Therefore, water balance monitoring can be used to estimate the state of chronic heart failure in real time.
BIA is a non-invasive, stable, easy-to-handle, and low-cost method for measuring body composition, including fat, muscle, and water [11,12]. Moreover, BIA can be performed on patients frequently. BIA includes single-frequency BIA (SFBIA) and multiple frequencies BIA (MFBIA). Since extracellular water content (ECW) is predicted at zero frequency and the total human body water (TBW) at infinite frequency, the bioelectrical impedance spectroscopy method (BIS) [13] that uses several tens to hundreds of frequencies to draw a Cole-Cole curve, is often used to measure impedance to assess ECW and intracellular water content (ICW) separately [14,15]. Since the length and cross-sectional area of the human body differ from part to part, the measured impedance also differs. Although the trunk accounts for about 50% of the muscle mass of the whole body, the measured impedance is low, and the measured values may contain large errors unless the trunk is measured alone [15]. The BIA method used by InBody is direct segmental multi-frequency BIA (DSM-BIA) [16,17]. This method is a technology that can separately measure the impedance of five parts (right arm, left arm, trunk, right leg, and left leg) by multi-frequency measurement that mixes several low and high frequencies (1, 5, 50, 250, 500 and 1000 kHz). During the development of Inbody, Cha et al. demonstrated the usefulness of this method for measuring hydration in chronic renal failure patients with edema [16]. In addition, after the launch of Inbody, comparisons with other standard methods, such as D2O and NaBr dilution, were conducted by a third party, and the usefulness of Inbody was demonstrated. [18,19]. Thus, InBody has been widely used recently.
The ECW/TBW ratio is usually maintained at approximately 0.38 in physically unimpaired persons [20,21,22]. However, when a drop in cardiac function leads to congestion and/or edema, the water balance collapses, and ECW increases, leading to an increase in this ratio [9,23,24]. Thus, a detailed and objective evaluation of the patient using BIA will allow real-time detection of any aggravation in the patient’s condition, immediate management of any exacerbation, and reduction in hospitalization events.
This study aimed to clarify the serviceability of water balance monitoring using InBody to assess the condition of patients with chronic heart failure in the stable phase.

2. Materials and Methods

2.1. Ethics Statement

This study was reviewed and approved by the Medical Ethics Board of Hirose Hospital (approval number: 202201).

2.2. Study Subjects

In this retrospective study, all patient assessments were conducted in the outpatient department of Hirose Hospital between April 2017 and December 2019. All patients were outpatients in the stable phase and did not require hospitalization.

2.3. BIA

BIA is a non-invasive method for measuring body composition, including fat, muscle, and water. As mentioned, the BIA method used by InBody is the DSM-BIA. InBody can directly measure the impedance of each of the five points on the left and right upper and lower limbs and the trunk using the 8-electrode method in which contact electrodes are attached to the left and right upper and lower limbs. It is possible to accurately measure body water content even in patients with edema [16]. Thus, we used the InBody S10 water analyzer (InBody Japan, Tokyo, Japan) to obtain several BIA measurements, including ICW, ECW, BFM, SLM, and FFM.

2.4. Measures

We obtained several DSM-BIA measures, including ICW, ECW, body fat mass (BFM), soft lean mass (SLM), and fat-free mass (FFM). Additionally, we obtained data, such as age, height, weight, and body mass index (BMI), of 481 patients with chronic heart failure from the Hirose Hospital database. Furthermore, some patients had multiple diseases, such as diabetes mellitus, dyslipidemia, hypercholesterolemia, and hyperlipidemia.

2.5. Statistical Analysis

Linear regression and correlation analyses were performed on BIA data, such as ECW/TBW, and other data, such as height, weight, and age, using R 3.6.0 (R Core Team, Vienna, Austria). A history of several diseases or hospitalization was replaced with a categorical value, and we assigned them a value of 1 if experienced and 0 if not. Moreover, these data were used in the analysis. The quantile-quantile (Q-Q) plot was used to confirm whether each group was normally distributed. Bartlett’s test was used to compare the distributions among the three groups. The Mann–Whitney U Test was used for comparison between two groups, and the Bonferroni correction was used to adjust the level of significance for multiple comparisons. Significance was set at 5%. Regression lines were determined using the least squares method. To remove the influence of age as a confounding bias from the analyses between ECW/TBW ratio and history of hospitalization, an analysis of covariance (ANCOVA) [25] was performed using Easy R, which is a graphical user interface for R [26].

3. Results

3.1. Patient Characteristics

In total, 756 outpatients were enrolled, of which 481 patients had chronic heart failure. The mean age was 74.8 ± 12.83 years. Several items had a small gender gap. Additionally, we obtained data from 275 patients who did not have chronic heart failure but had other chronic diseases. The details are shown in Table 1.
To evaluate the relationship between the history of hospitalization (whether patients had experienced hospitalization with chronic heart failure) and BIA data, we divided the patients into three groups. The experienced group included 257 patients with a history of hospitalization for chronic heart failure and a mean age of 82.9 ± 10.00 years. The inexperienced group included 224 patients with chronic heart failure who had not been hospitalized, and a mean age was 74.2 ± 11.90 years. The control group included 275 people who had not experienced chronic heart failure but had other chronic diseases, and the mean age was 67.4 ± 11.47 years.
The same patients were examined several times and were included in all analyses. The number of inspections (data counts) was 1318, 1288, and 1316 for the experienced, inexperienced, and control groups, respectively. The details are shown in Table 2.

3.2. Correlation Analysis

Table 3 shows the correlation coefficients between the variables. Many correlations were observed between different variables. For example, BFM was strongly correlated with BMI (r = 0.92, p < 0.01) but not with the history of hospitalization. However, both the ECW/TBW ratio (r = 0.44, p < 0.01) and age (r = 0.44, p < 0.01) had a significant correlation with the history of hospitalization. Moreover, there was a strong correlation between ECW/TBW ratio and age (r = 0.71, p < 0.01).

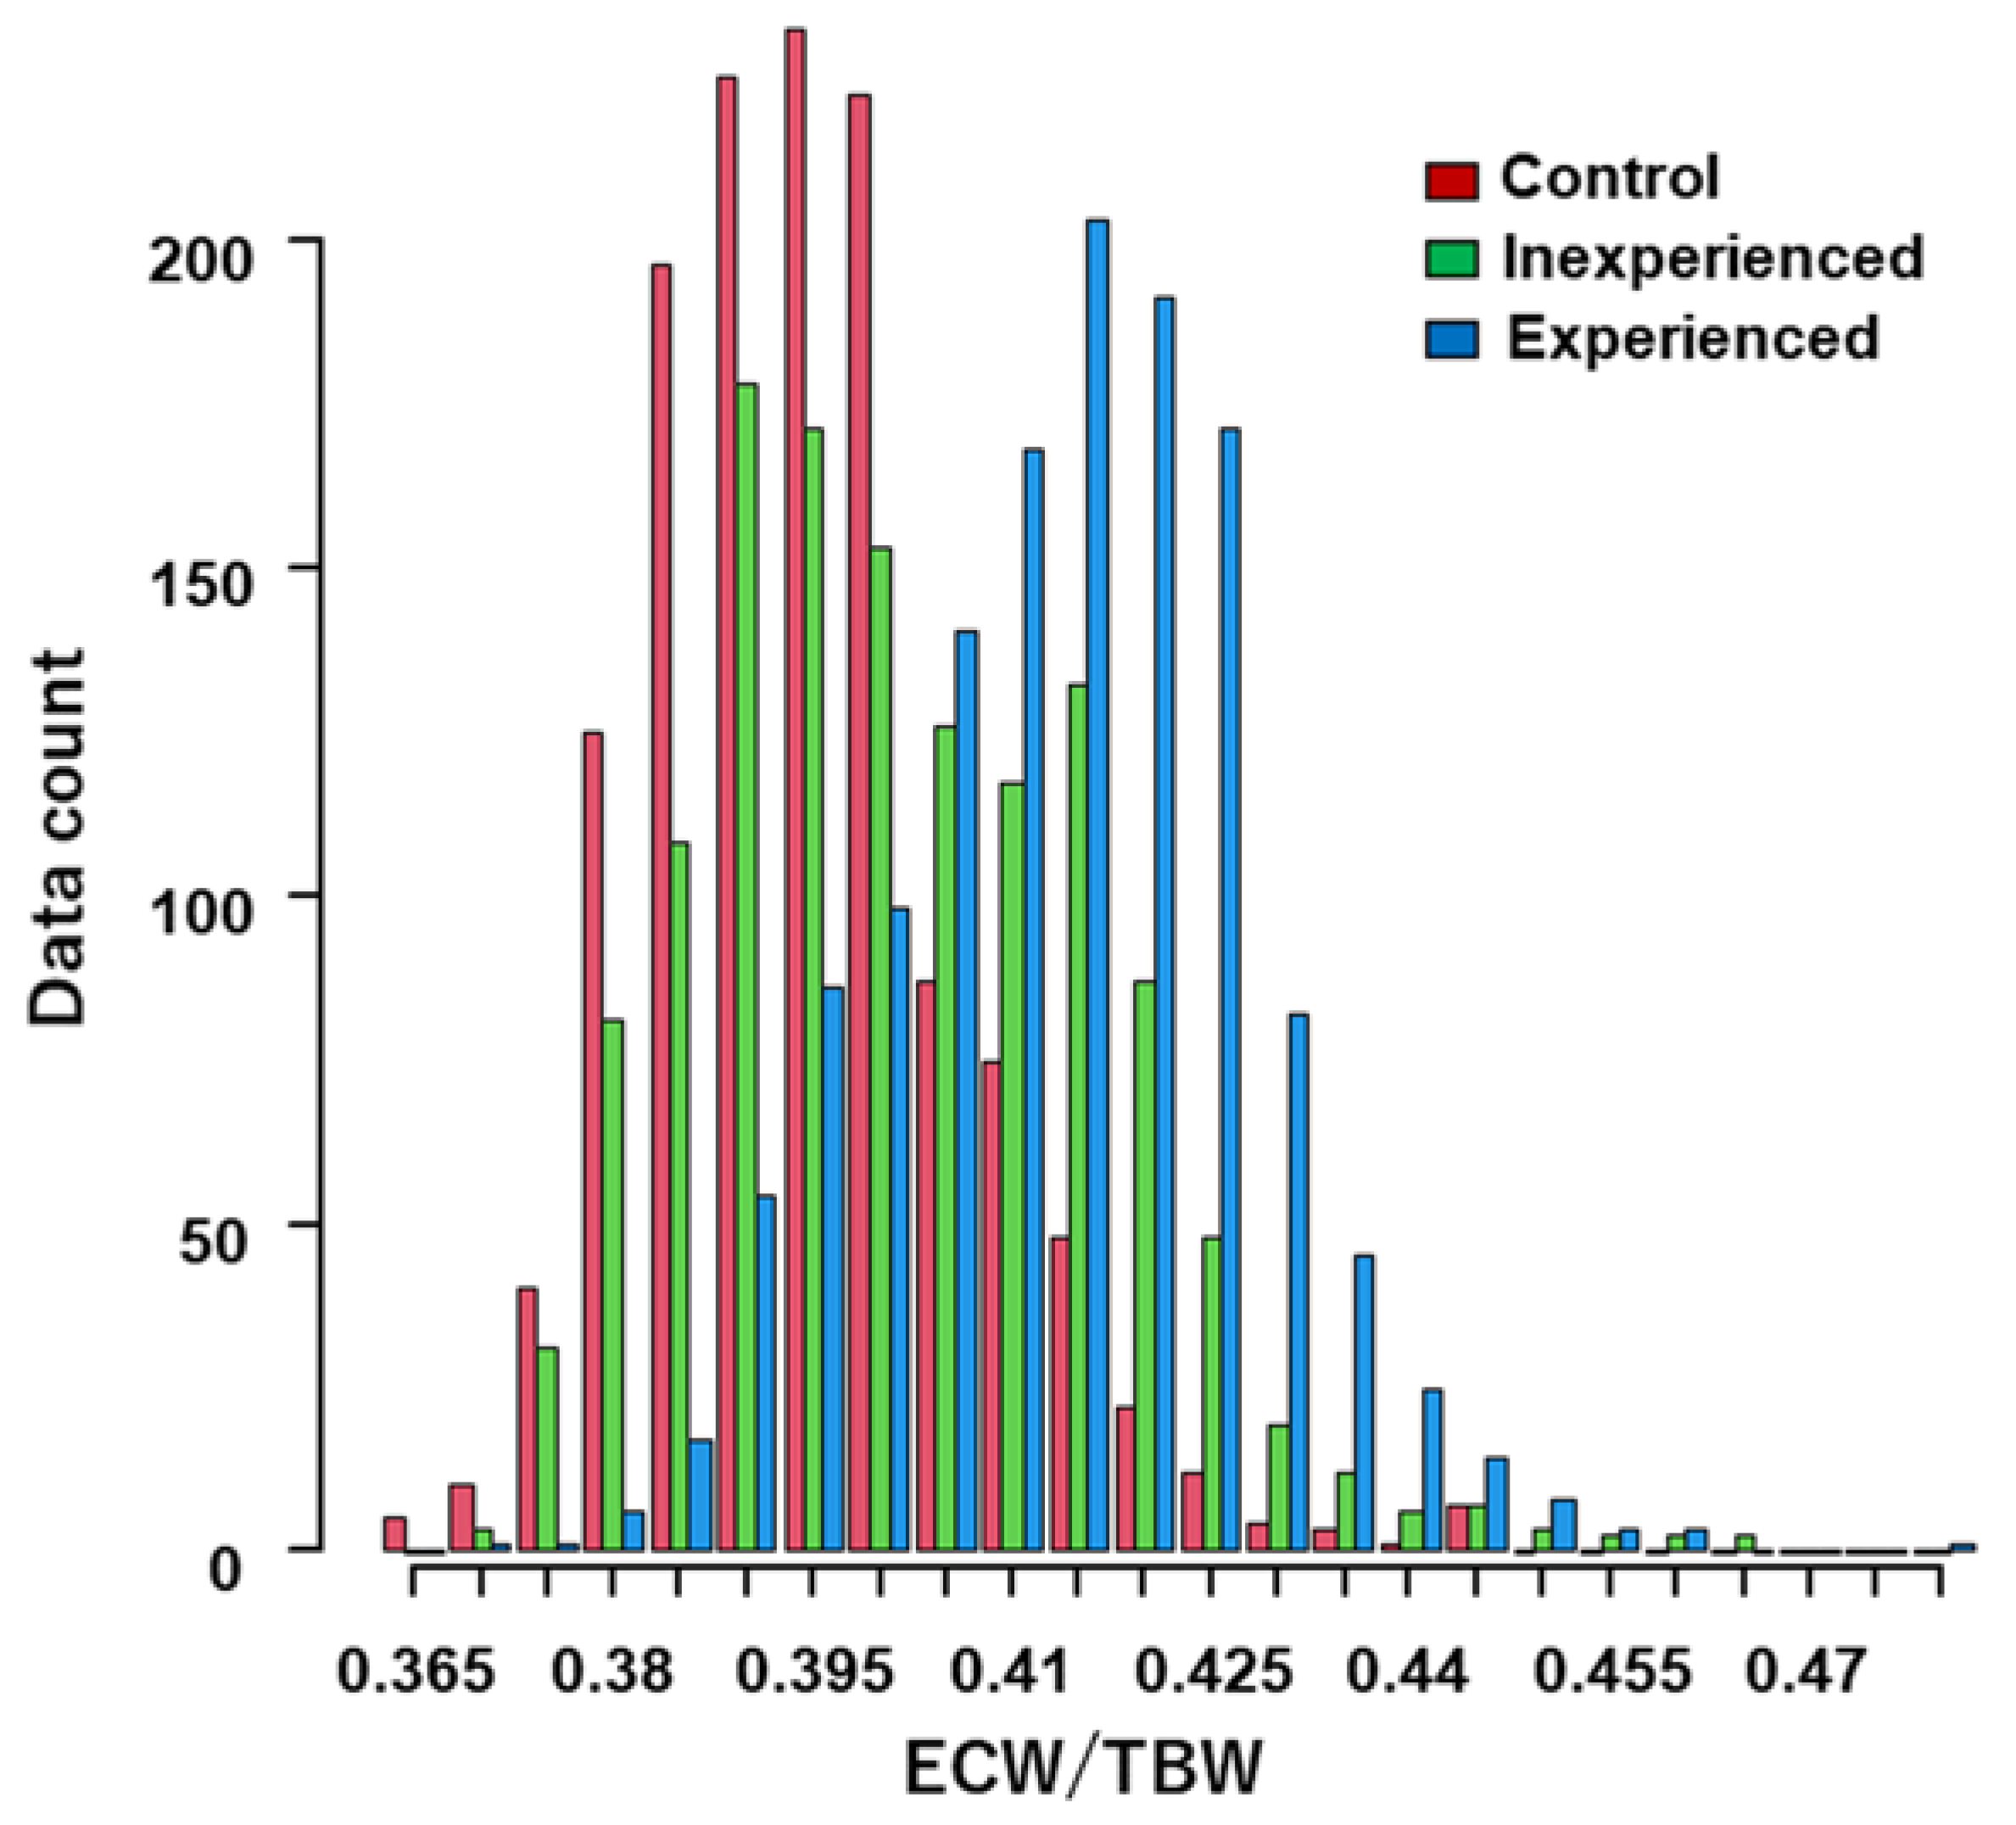
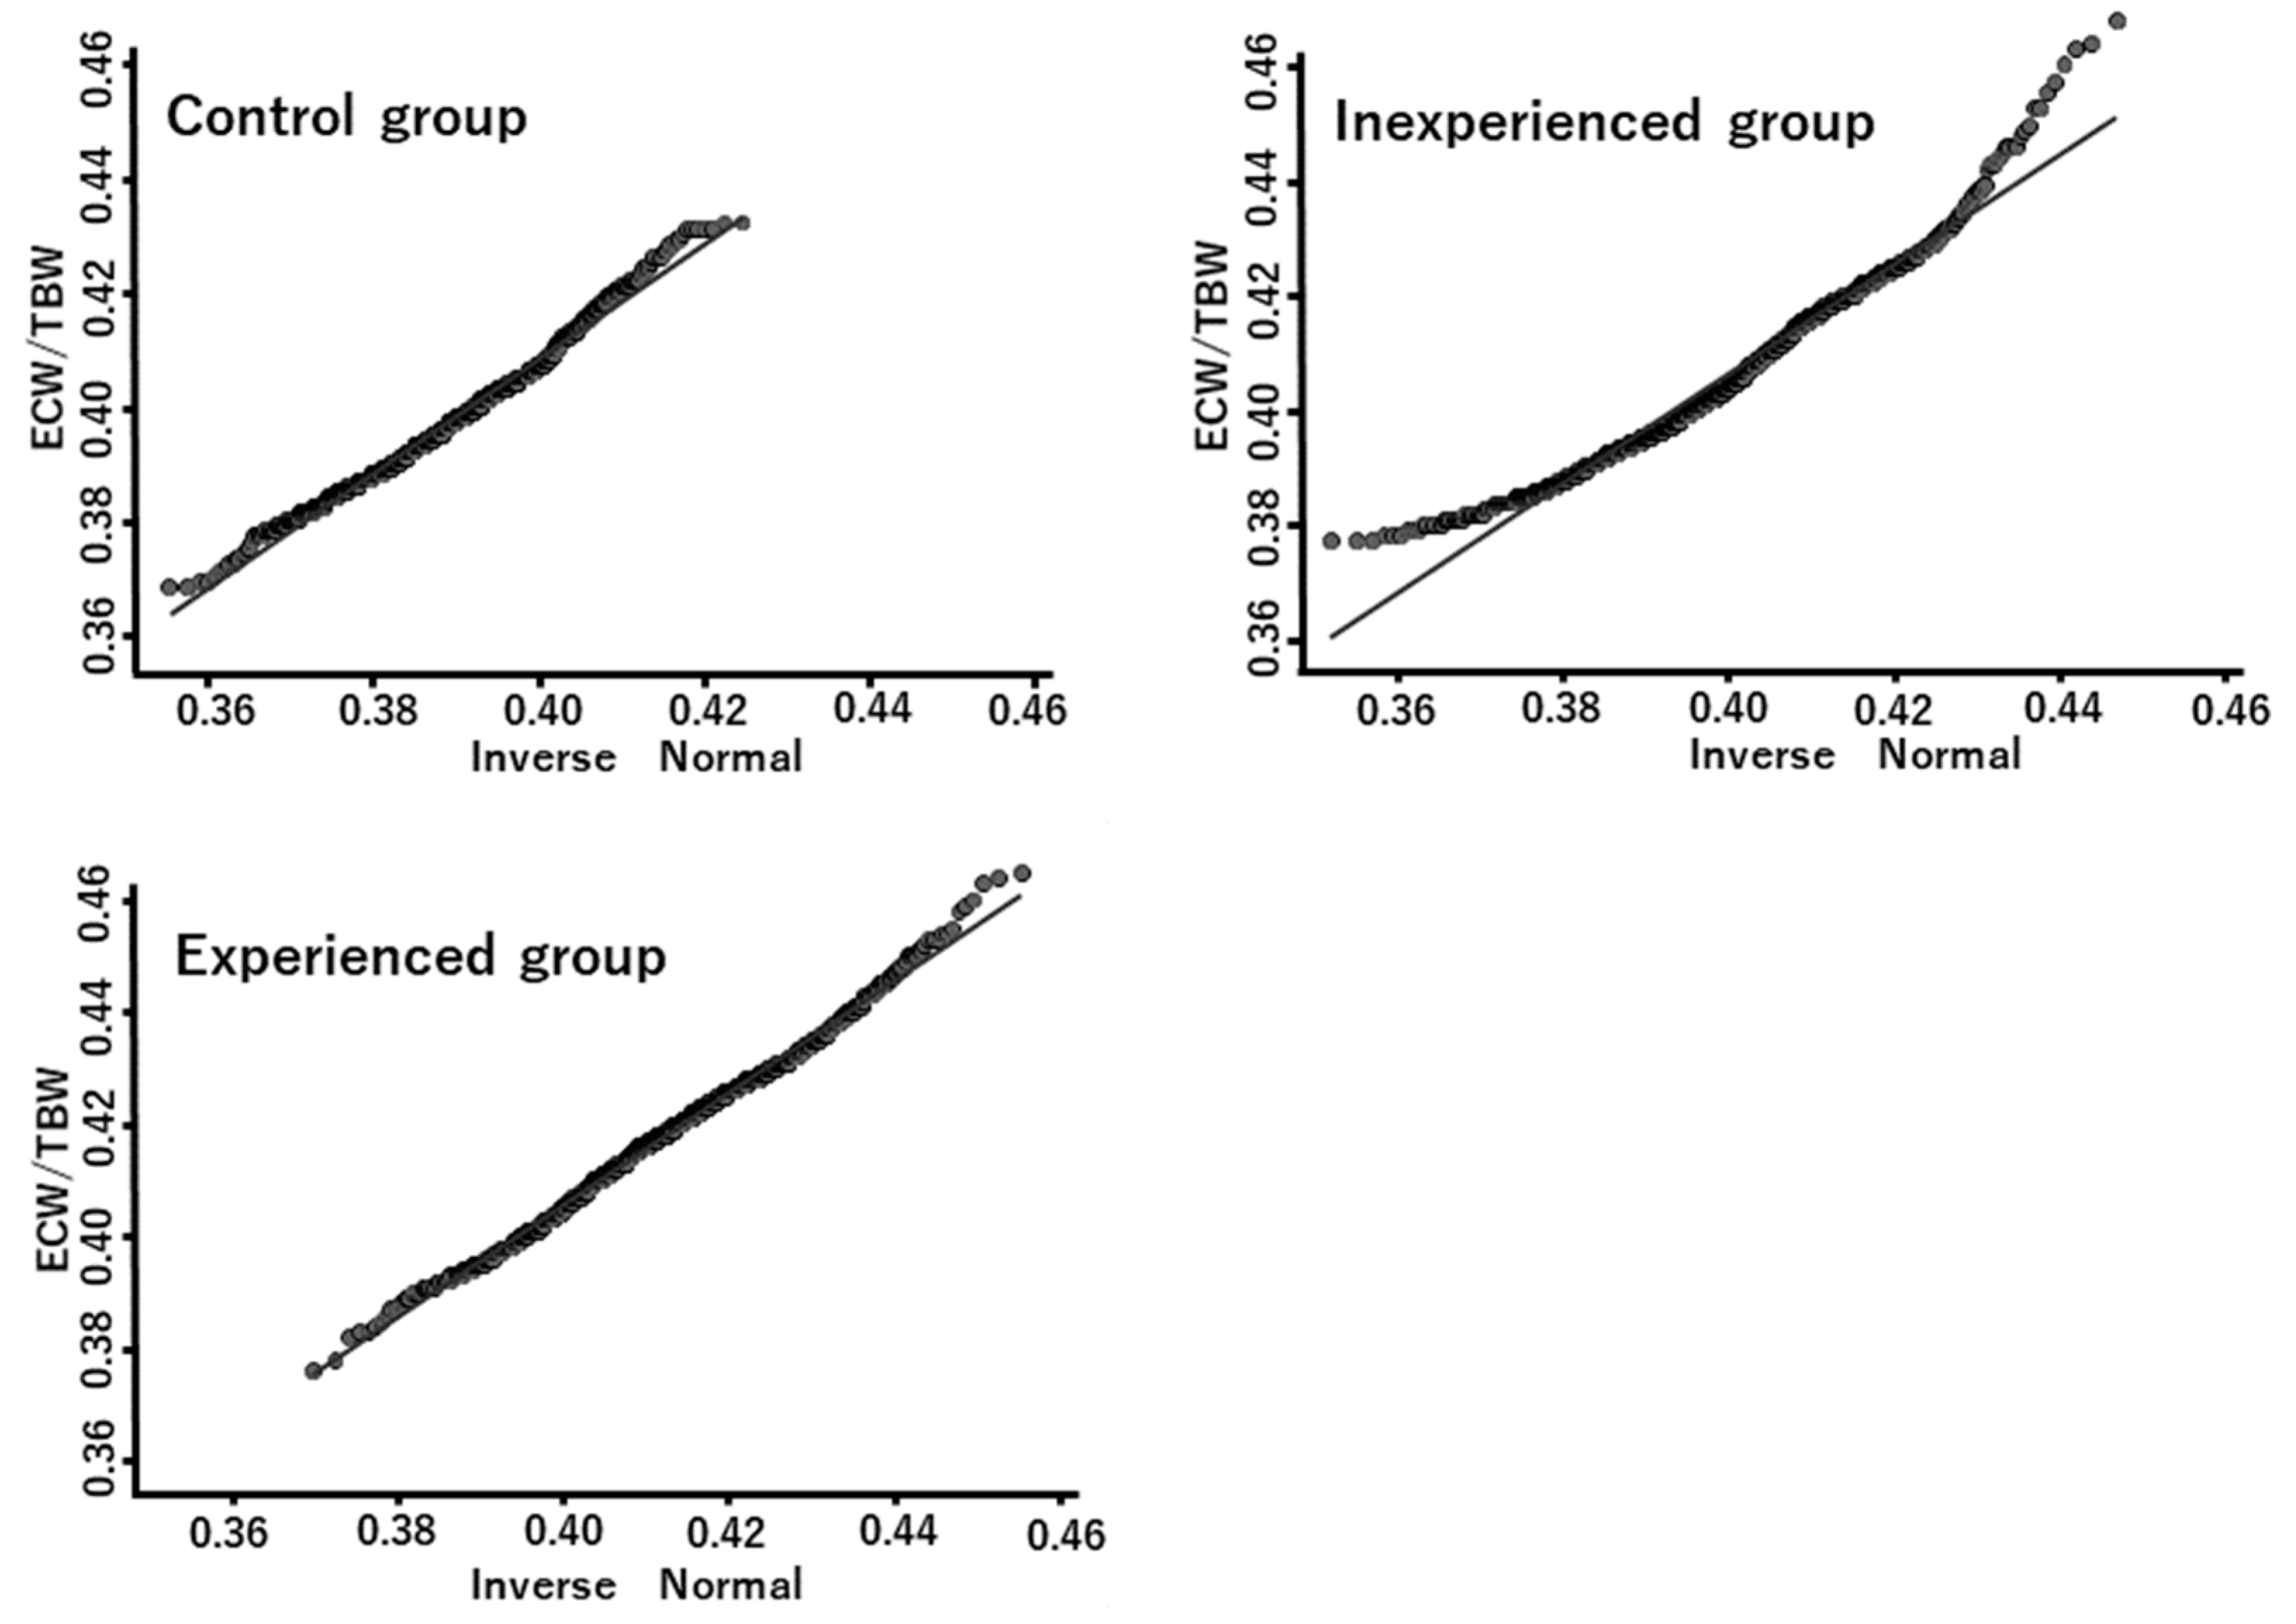
3.3. Distributions of the ECW/TBW Ratio

The histograms in Figure 1 show the differences in the distributions of the ECW/TBW ratio between the three study groups. The ECW/TBW distribution for the inexperienced group was non-normal and had at least two peaks. However, the distribution of the ECW/TBW ratio in both the experienced and control groups seemed to be approximately normal. These results were confirmed by Q-Q plots. As shown in Figure 2, the plots for both the control and experienced groups were nearly straight lines, suggesting that both groups were approximately normally distributed. On the other hand, the plot for the inexperienced group was not linear, indicating that it was not normally distributed. Bartlett’s test showed significant differences in the distribution of the three groups (p < 0.001). Thus, the distributions among the three groups were significantly different. In addition, when the Mann–Whitney U Test was performed between the two groups, the p-value for all groups A and B, B and C, and C and A was less than 0.001, also indicating that the three groups had different distributions.

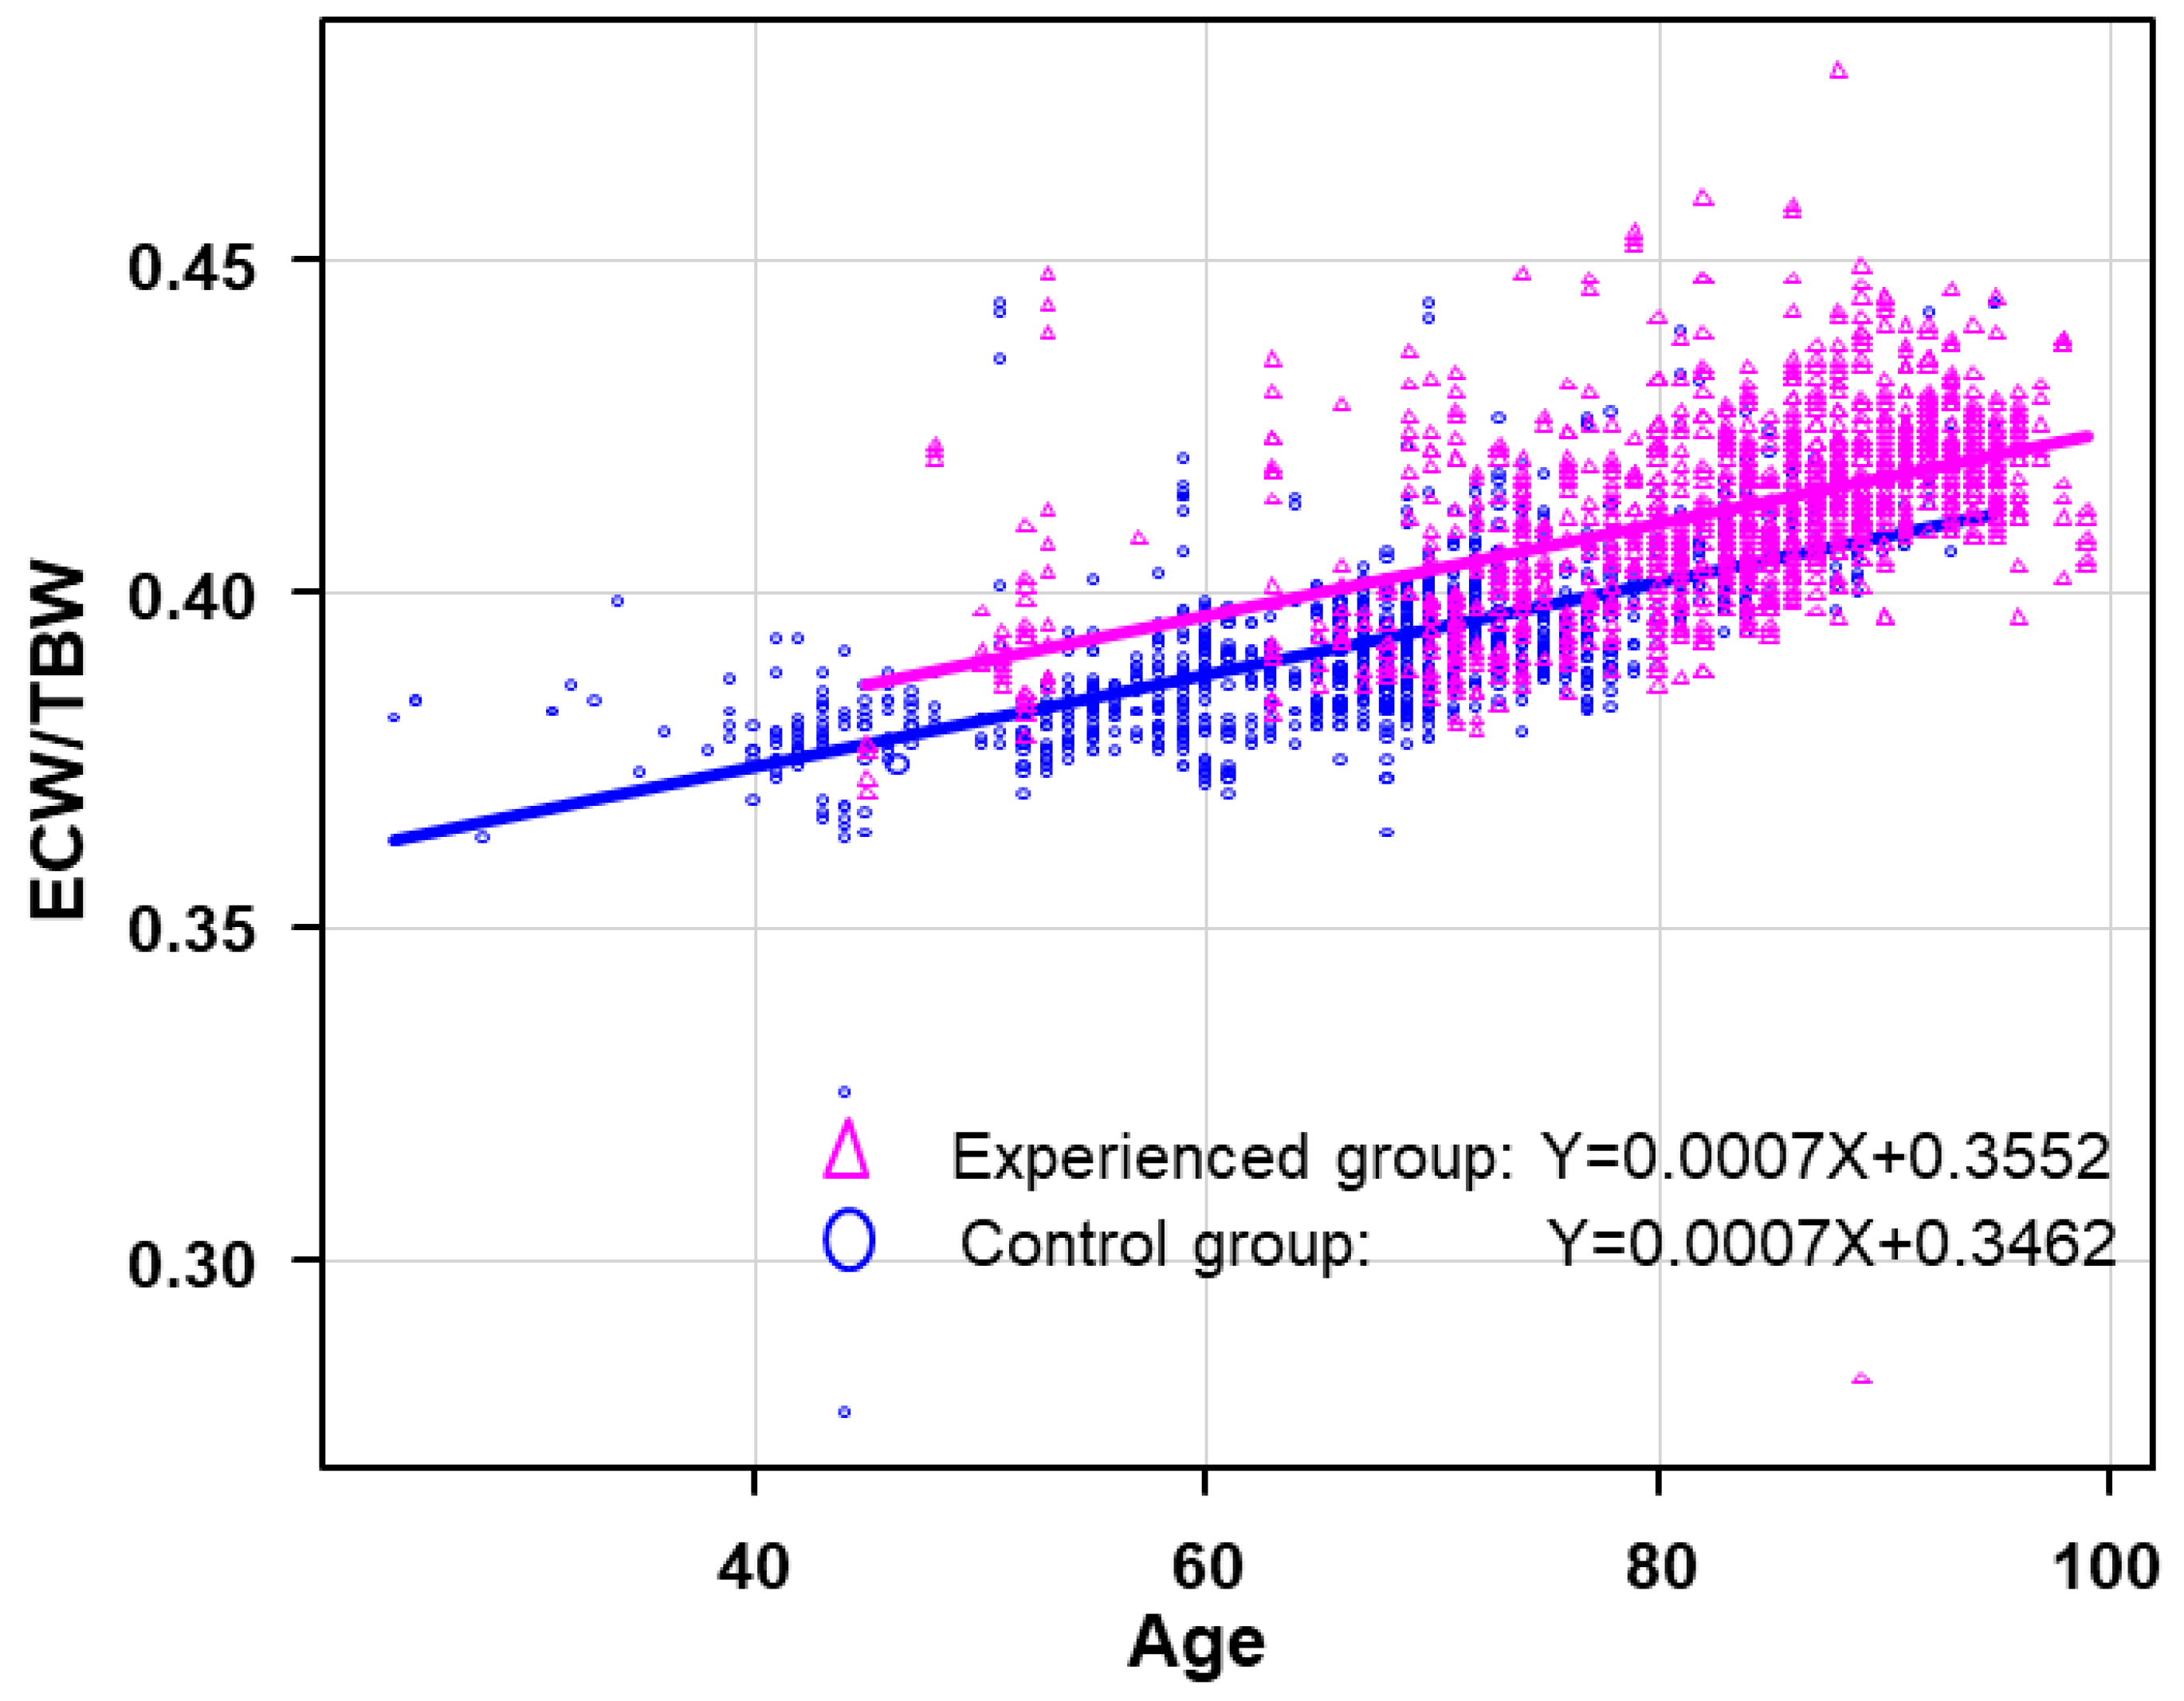
3.4. Regression Analysis and ANCOVA

Regression analysis was used to calculate the coefficient of regression between age and ECW/TBW ratio in each group. Regression lines were determined using the least squares method with variable X as age and variable Y as the ECW/TBW ratio. The equation of the regression line for the experienced and control group was Y = 0.0007X + 0.3552 and Y = 0.0007X + 0.3462, respectively; therefore, the units of the horizontal axis and the vertical axis differ by a factor of 400, and the apparent numbers become smaller. (Figure 3). However, the equation for the inexperienced group was Y = 0.0009X + 0.3346. Thus, the coefficient of regression of both the experienced and control groups was approximately the same (0.0007) but was different for the inexperienced group (0.0009).
Since the coefficient of regression of the inexperienced group was different (0.0009) from that of the other two groups, we performed an ANCOVA between the experienced and control groups but not the inexperienced group. The p-value of the interaction between the group variable and the covariate was 0.98; thus, there was no significant interaction between the group variable and the covariate. As the p-value of the ANCOVA was less than 0.01, there was a significant difference in the ECW/TBW ratio between these two groups (p < 0.01). As shown in Figure 3, from 50 to 90 years of age, the average difference in the ECW/TBW ratio between the regression line of the experienced group and control group was 0.09.

4. Discussion

4.1. Statistical Aspects

There was a significant correlation between the ECW/TBW ratio and a history of hospitalization (r = 0.44, p < 0.01). Additionally, we found a considerable correlation between age and history of hospitalization (r = 0.44, p < 0.01) and a strong correlation between ECW/TBW ratio and age (r = 0.71, p < 0.01) (Table 3).
We considered two possibilities. First, the correlation between the ECW/TBW ratio and history of hospitalization is owing to the correlation of age with both the ECW/TBW ratio and history of hospitalization. Second, age is a confounding bias between the ECW/TBW ratio and history of hospitalization, and there was a significant difference in the ECW/TBW ratio between the three groups.
We created a histogram to test these two possibilities. As shown in Figure 1, we found a difference in the distribution of the ECW/TBW ratio between the three patient groups. Indeed, Bartlett’s test and the Mann–Whitney U test showed that the three groups have different distributions of ECW/TBW ratio (p < 0.01). These comparisons suggest the possibility that the correlation between the ECW/TBW ratio and history of hospitalization is significant, and age is a confounding bias between the ECW/TBW ratio and history of hospitalization, except for the inexperienced group.
In addition, the coefficient of regression of both the experienced and control groups was approximately the same (0.0007), but that of the inexperienced group was different (0.0009). As the distribution of the inexperienced group was non-normal (Figure 2), it was unsuitable for the ANCOVA [19]. Therefore, to reduce the effect of age, we performed ANCOVA between the experienced and control groups. The p-value of the interaction between the group variable and covariate was 0.98; thus, there was no significant interaction between group variables and covariates, suggesting that age was a confounding bias between the ECW/TBW ratio and history of hospitalization. As the p-value of ANCOVA was less than 0.01, there was a significant difference in ECW/TBW ratios between these two groups, and on average, the ECW/TBW ratio in the experienced group was 0.09 higher than that in the control group for patients aged 44–95 years (Figure 3).

4.2. Clinical Utility of Water Balance Monitoring

Recently, it has been recognized that the measurement of body fluid volume by BIA is effective in various diseases. In acute heart failure, BIA is considered a useful method of inferring congestive status [27,28,29]. Indeed, using emergency department patients, Park et al. showed that the cut-off value of the ECW/TBW ratio to predict acute heart failure was >0.412 [30]. In addition, Sakaguchi et al. show that ECW in patients hospitalized with acute heart failure is significantly high but decreases during hospitalization due to diuresis [31].
However, most of the reports are on acute heart failure in the acute phase, and there is little knowledge of chronic heart failure in the stable phase. Therefore, we focused analysis on patients with chronic heart failure in the stable phase. The ECW/TBW ratio was significantly higher in the experienced group than in the control group (Figure 3). These results suggest that patients who have a high ECW/TBW ratio, even when stable, may be unstable and at risk of exacerbation and rehospitalization.

4.3. Comparison with Other Assessment Methods

It is well known that worsening chronic heart failure leads to gradual weight gain as a consequence of fluid retention [32,33]. In addition, weight gain has been reported to be associated with hospitalization for chronic heart failure [34,35]. Although weight gain is used as an indicator of chronic heart failure aggravation [36,37], the sensitivity of body weight monitoring is low [28]. A study showed that even congestion that is not detected using the composite congestion score could influence convalescence [38]. The sensitivity of BIA is high, and the ECW/TBW ratio directly expresses the quantity of congestion and/or edema. Thus, the ECW/TBW ratio may be a good indicator for exacerbation in patients with chronic heart failure.
BNP and NT-proBNP are used to estimate the condition of chronic heart failure [6,7,8], but it is not easy to measure these in real time at some hospitals. The mean NT-proBNP level in the experienced group (8353 pg/mL) was extremely high and probably saturated in high-risk patients such as those in the experienced group. This might explain the weak correlation between NT-proBNP levels and ECW/TBW ratio (r = 0.275, p < 0.01) that we observed. Therefore, the ECW/TBW ratio seems to be useful as an additive indicator for high-risk patients because it is significantly correlated with the history of hospitalization in high-risk patients.

4.4. ECW/TBW Ratio

The ECW/TBW ratio appears to be useful when patients are in a stable period. More than 80% of the experienced group had an ECW/TBW ratio greater than 0.401. In contrast, less than 20% of the control group had an ECW/TBW ratio greater than 0.401. The ECW/TBW ratio is usually maintained at approximately 0.380 in a physically unimpaired person [20,21,22]. Therefore, it is thought that high-risk patients have ECW/TBW ratios greater than 0.401. These patients are more likely to experience worsening convalescence and rehospitalization. Thus, ECW/TBW ratio is a simple and easy-to-use indicator.
We found that age is a confounding bias in the relationship between the ECW/TBW ratio and history of hospitalization. Thus, in a strict sense, we cannot estimate patient conditions with high accuracy using the ECW/TBW ratio without considering the effect of age. In this case, the regression lines of the experienced and control groups should be useful (Figure 3). If the ECW/TBW ratio of the patient is below the regression line of the control group, it would suggest that continued monitoring is sufficient. However, an ECW/TBW ratio located above the regression line of the experienced group would indicate that the patient may be unstable, and their clinical symptoms could easily worsen. These patients may be considered high-risk.
Previous studies found that if the interval between medical examinations becomes longer than 1 month, the rehospitalization rate can suddenly increase [39]. Therefore, high-risk patients should be frequently examined to detect any exacerbation of their condition as soon as possible.

4.5. Limitations of This Study

This study has some limitations. Since this study is not a randomized controlled trial but a retrospective study, the possibility of some sort of bias cannot be denied. In addition, at our hospital, multiple physicians treat patients with chronic heart failure in the outpatient department of general medicine. Thus, blood sampling and BIA data acquisition intervals are not necessarily constant. There are some unknowns about the patient’s condition and medication at the time of InBody measurement.
Although the age difference between the groups was already mentioned in the paper, ECW/TBW ratio increases with age, even in healthy subjects. This study was a retrospective observational study, and similar analyses cannot be performed by dividing patients into many groups by age due to an insufficient number of subjects. Thus, ANCOVA was used to address this issue. If we collect a sufficient number of patients of the same age group and conduct the same analyses as this time, it is highly possible that we will be able to accurately determine the cut-off value of the ECW/TBW ratio for each age group. As the next step, we will try to make a comparison between the same age group and determine a clear cut-off value for each age group.
In addition, BIA cannot be used for patients with pacemakers due to strict medical device standards in some countries, including Japan.

5. Conclusions

This study showed a significant difference in ECW/TBW ratio between the experienced and control group. Moreover, age is a confounder of this relationship. When that effect is reduced, the experienced group and the control group still had significantly different ECW/TBW ratios. Patients who have a high ECW/TBW ratio, even in a stable period, may be unstable and easily worsen, leading to repeat hospitalization. Therefore, the ECW/TBW ratio may be a useful indicator to estimate patient condition in real time and can be used to predict the improvement in chronic heart failure. Thus, we can manage the aggravation of the patient’s condition in a timely manner and reduce the number of hospitalization events.

Author Contributions

Conceptualization, K.H., Writing, K.H. and K.N., data analysis K.H., K.N. and S.S., data curation K.O., G.H., M.S., T.H. and S.K. All authors have read and agreed to the published version of the manuscript.

Funding

This study was supported by the private funding of Hirose Hospital (Hirose Hospital: funding number 202201).

Institutional Review Board Statement

This study was reviewed and approved by the Medical Ethics Board of Hirose Hospital (approval number: 202201).

Informed Consent Statement

Though this article does not contain any studies with the direct involvement of human participants, the ethical standards of the institutional and national research committee were in accordance with the 1975 Helsinki Declaration.

Data Availability Statement

The data presented in this study are available on request from the corresponding author.

Acknowledgments

We would like to thank all members of the Hirose Hospital who helped us.

Conflicts of Interest

The authors declare no conflict of interest.

References

  1. Shiba, N.; Watanabe, J.; Shinozaki, T.; Koseki, Y.; Sakuma, M.; Kagaya, Y.; Shirato, K. Analysis of Chronic Heart Failure Registry in the Tohoku District-Third Year Follow-up-. Circ. J. 2004, 68, 427–434. [Google Scholar] [CrossRef] [Green Version]
  2. Tsuchihashi-Makaya, M.; Hamaguchi, S.; Kinugawa, S.; Yokota, T.; Goto, D.; Yokoshiki, H.; Kato, N.; Takeshita, A.; Tsutsui, H. Characteristics and Outcomes of Hospitalized Patients with Heart Failure and Reduced Vs Preserved Ejection Fraction. Report from the Japanese Cardiac Registry of Heart Failure in Cardiology (Jcare-Card). Circ. J. 2009, 73, 1893–1900. [Google Scholar] [CrossRef] [Green Version]
  3. Desai, A.S.; Stevenson, L.W. Rehospitalization for Heart Failure. Circulation 2012, 126, 501–506. [Google Scholar] [CrossRef] [PubMed] [Green Version]
  4. Ross, J.S.; Chen, J.; Lin, Z.; Bueno, H.; Curtis, J.P.; Keenan, P.S.; Normand, S.-L.T.; Schreiner, G.; Spertus, J.A.; Vidán, M.T.; et al. Recent National Trends in Readmission Rates After Heart Failure Hospitalization. Circ. Hear. Fail. 2010, 3, 97–103. [Google Scholar] [CrossRef] [Green Version]
  5. Chun, S.; Tu, J.V.; Wijeysundera, H.C.; Austin, P.C.; Wang, X.; Levy, D.; Lee, D.S. Lifetime Analysis of Hospitalizations and Survival of Patients Newly Admitted With Heart Failure. Circ. Heart Fail. 2012, 5, 414–421. [Google Scholar] [CrossRef] [PubMed] [Green Version]
  6. Mukoyama, M.; Nakao, K.; Saito, Y.; Ogawa, Y.; Hosoda, K.; Suga, S.; Shirakami, G.; Jougasaki, M.; Imura, H. Increased Human Brain Natriuretic Peptide in Congestive Heart Failure. N. Engl. J. Med. 1990, 323, 757–758. [Google Scholar] [CrossRef]
  7. Maisel, A.S.; Krishnaswamy, P.; Nowak, R.M.; McCord, J.; Hollander, J.E.; Duc, P.; Omland, T.; Storrow, A.B.; Abraham, W.T.; Wu, A.H.; et al. Rapid Measurement of B-Type Natriuretic Peptide in the Emergency Diagnosis of Heart Failure. N. Engl. J. Med. 2002, 347, 161–167. [Google Scholar] [CrossRef]
  8. Weber, M.; Hamm, C. Role of B-Type Natriuretic Peptide (Bnp) and Nt-Probnp in Clinical Routine. Heart 2006, 92, 843–849. [Google Scholar] [CrossRef] [PubMed]
  9. McKee, P.A.; Castelli, W.P.; McNamara, P.M.; Kannel, W.B. The Natural History of Congestive Heart Failure: The Framingham Study. N. Engl. J. Med. 1971, 285, 1441–1446. [Google Scholar] [CrossRef] [PubMed]
  10. Parrinello, G.; Greene, S.J.; Torres, D.; Alderman, M.; Bonventre, J.V.; Di Pasquale, P.; Gargani, L.; Nohria, A.; Fonarow, G.C.; Vaduganathan, M.; et al. Water and sodium in heart failure: A spotlight on congestion. Heart Fail. Rev. 2015, 20, 13–24. [Google Scholar] [CrossRef] [Green Version]
  11. Kyle, U.G.; Bosaeus, I.; De Lorenzo, A.D.; Deurenberg, P.; Elia, M.; Gómez, J.M.; Heitmann, B.L.; Kent-Smith, L.; Melchior, J.C.; Pirlich, M.; et al. Pichard, and Espen Working Group Composition of the. Bioelectrical Impedance Analysis—Part I: Review of Principles and Methods. Clin. Nutr. 2004, 23, 1226–1243. [Google Scholar] [CrossRef]
  12. Kyle, U.G.; Bosaeus, I.; De Lorenzo, A.D.; Deurenberg, P.; Elia, M.; Gómez, J.M.; Heitmann, B.L.; Kent-Smith, L.; Melchior, J.-C.; Pirlich, M.; et al. Bioelectrical impedance analysis—Part II: Utilization in clinical practice. Clin. Nutr. 2004, 23, 1430–1453. [Google Scholar] [CrossRef] [PubMed]
  13. Dylke, E.S.; Ward, L.C. Three Decades of Bioelectrical Impedance Spectroscopy in Lymphedema Assessment: An Historical Perspective. Lymphat. Res. Biol. 2021, 19, 206–214. [Google Scholar] [CrossRef] [PubMed]
  14. Michel, Y.; Jaffrin, M.Y.; Morel, H. Body fluid volumes measurements by impedance: A review of bioimpedance spectroscopy (BIS) and bioimpedance analysis (BIA) methods. Med. Eng. Phys. 2008, 30, 1257–1269. [Google Scholar]
  15. Moonen, H.P.F.X.; Van Zanten, A.R.H. Bioelectric impedance analysis for body composition measurement and other potential clinical applications in critical illness. Curr. Opin. Crit. Care 2021, 27, 344–353. [Google Scholar] [CrossRef]
  16. Cha, K.; Chertow, G.M.; Gonzalez, J.; Lazarus, J.M.; Wilmore, D.W. Multifrequency bioelectrical impedance estimates the distribution of body water. J. Appl. Physiol. 1995, 79, 1316–1319. [Google Scholar] [CrossRef]
  17. Cha, K.; Shin, S.; Shon, C.; Choi, S.; Wilmore, D.W. Evaluation of segmental bioelectrical impedance analysis for measuring muscle distribution. J. ICHPER SD-ASIA 1997, 1, 11–14. [Google Scholar]
  18. Sartorio, A.; Malavolti, M.; Agosti, F.; Marinone, P.G.; Caiti, O.; Battistini, N.; Bedogni, G. Body water distribution in severe obesity and its assessment from eight-polar bioelectrical impedance analysis. Eur. J. Clin. Nutr. 2004, 59, 155–160. [Google Scholar] [CrossRef] [Green Version]
  19. Bedogni, G.; Malavolti, M.; Severi, S.; Poli, M.; Mussi1, C.; Fantuzzi1, A.L.; Battistini, N. Accuracy of an eight-point tac-tile-electrodeimpedance method in the assessment of total bodywater. Eur. J. Clin. Nutr. 2002, 56, 1143–1148. [Google Scholar] [CrossRef] [Green Version]
  20. Sato, M.; Inai, K.; Shimizu, M.; Sugiyama, H.; Nakanishi, T. Bioelectrical impedance analysis in the management of heart failure in adult patients with congenital heart disease. Congenit. Heart Dis. 2019, 14, 167–175. [Google Scholar] [CrossRef]
  21. Wang, Z.M.; Pierson, R.N., Jr.; Heymsfield, S.B. The Five-Level Model: A New Approach to Organizing Body-Composition Research. Am. J. Clin. Nutr. 1992, 56, 19–28. [Google Scholar] [CrossRef]
  22. Davenport, A.; Sayed, R.H.; Fan, S. Is Extracellular Volume Expansion of Peritoneal Dialysis Patients Associated with Greater Urine Output? Blood Purif. 2011, 32, 226–231. [Google Scholar] [CrossRef] [PubMed]
  23. Nohria, A.; Tsang, S.W.; Fang, J.C.; Lewis, E.F.; A Jarcho, J.; Mudge, G.H.; Stevenson, L.W. Clinical assessment identifies hemodynamic profiles that predict outcomes in patients admitted with heart failure. J. Am. Coll. Cardiol. 2003, 41, 1797–1804. [Google Scholar] [CrossRef] [PubMed] [Green Version]
  24. Conraads, V.M.; Bosmans, J.M.; Vrints, C.J. Chronic heart failure: An example of a systemic chronic inflammatory disease resulting in cachexia. Int. J. Cardiol. 2002, 85, 33–49. [Google Scholar] [CrossRef]
  25. Lang, T.A.; Altman, D.G. Basic statistical reporting for articles published in Biomedical Journals: The “Statistical Analyses and Methods in the Published Literature” or the SAMPL Guidelines. Int. J. Nurs. Stud. 2015, 52, 5–9. [Google Scholar] [CrossRef]
  26. Kanda, Y. Investigation of the freely available easy-to-use software ‘EZR’ for medical statistics. Bone Marrow Transpl. 2013, 48, 452–458. [Google Scholar] [CrossRef] [Green Version]
  27. Thanapholsart, J.; Khan, E.; Lee, G.A. A Current Review of the Uses of Bioelectrical Impedance Analysis and Bioelectrical Impedance Vector Analysis in Acute and Chronic Heart Failure Patients: An Under-valued Resource? Res. Nurs. 2023, 25, 240–249. [Google Scholar] [CrossRef] [PubMed]
  28. De Ieso, F.; Mutke, M.R.; Brasier, N.K.; Raichle, C.J.; Keller, B.; Sucker, C.; Abdelhamid, K.; Bloch, T.; Reissenberger, P.; Schönenberg, L.; et al. Body composition analysis in patients with acute heart failure: The Scale Heart Failure trial. ESC Heart Fail. 2021, 8, 4593–4606. [Google Scholar] [CrossRef] [PubMed]
  29. Mayne, K.J.; Shemilt, R.; Keane, D.F.; Lees, J.S.; Mark, P.B.; Herrington, W.G. Bioimpedance Indices of Fluid Overload and Cardiorenal Outcomes in Heart Failure and Chronic Kidney Disease: A Systematic Review. J. Card. Fail. 2022, 28, 1628–1641. [Google Scholar] [CrossRef]
  30. Park, C.S.; Lee, S.-E.; Cho, H.-J.; Kim, Y.-J.; Kang, H.-J.; Oh, B.-H.; Lee, H.-Y. Body fluid status assessment by bio-impedance analysis in patients presenting to the emergency department with dyspnea. Korean J. Intern. Med. 2018, 33, 911–921. [Google Scholar] [CrossRef] [Green Version]
  31. Sakaguchi, T.; Yasumura, K.; Nishida, H.; Inoue, H.; Furukawa, T.; Shinouchi, K.; Miura, H.; Miyazaki, K.; Hamano, G.; Koide, M.; et al. Quantitative Assessment of Fluid Accumulation Using Bioelectrical Impedance Analysis in Patients With Acute Decompensated Heart Failure. Circ. J. 2015, 79, 2616–2622. [Google Scholar] [CrossRef] [PubMed] [Green Version]
  32. Webel, A.R.; Frazier, S.K.; Moser, D.K.; Lennie, T.A. Daily Variability in Dyspnea, Edema and Body Weight in Heart Failure Patients. Eur. J. Cardiovasc. Nurs. 2007, 6, 60–65. [Google Scholar] [CrossRef] [PubMed]
  33. Voors, A.A.; Kremer, D.; Geven, C.; Maaten, J.M.T.; Struck, J.; Bergmann, A.; Pickkers, P.; Metra, M.; Mebazaa, A.; Düngen, H.D.; et al. Adrenomedullin in Heart Failure: Pathophysiology and Therapeutic Application. Eur. J. Heart Fail. 2019, 21, 163–171. [Google Scholar] [CrossRef]
  34. Chaudhry, S.I.; Wang, Y.; Concato, J.; Gill, T.M.; Krumholz, H.M. Patterns of Weight Change Preceding Hospitalization for Heart Failure. Circulation 2007, 116, 1549–1554. [Google Scholar] [CrossRef]
  35. Zhang, J.; Goode, K.M.; Cuddihy, P.E.; Cleland, J.G.; TEN-HMS Investigators. Predicting hospitalization due to worsening heart failure using daily weight measurement: Analysis of the Trans-European Network-Home-Care Management System (TEN-HMS) study. Eur. J. Heart Fail. 2009, 11, 420–427. [Google Scholar] [CrossRef]
  36. Vader, J.M.; Drazner, M.H. Clinical Assessment of Heart Failure: Utility of Symptoms, Signs, and Daily Weights. Heart Fail. Clin. 2009, 5, 149–160. [Google Scholar] [CrossRef]
  37. Yancy, C.W.; Jessup, M.; Bozkurt, B.; Butler, J.; Casey, D.E., Jr.; Drazner, M.H.; Fonarow, G.C.; Geraci, S.A.; Horwich, T.; Januzzi, J.L.; et al. 2013 Accf/Aha Guideline for the Management of Heart Failure: A Report of the American College of Cardiology Foundation/American Heart Association Task Force on Practice Guidelines. J. Am. Coll. Cardiol. 2013, 62, e147–e239. [Google Scholar] [CrossRef] [Green Version]
  38. Ambrosy, A.P.; Pang, P.S.; Khan, S.; Konstam, M.A.; Fonarow, G.C.; Traver, B.; Maggioni, A.P.; Cook, T.; Swedberg, K.; Burnett, J.C.; et al. Clinical course and predictive value of congestion during hospitalization in patients admitted for worsening signs and symptoms of heart failure with reduced ejection fraction: Findings from the EVEREST trial. Eur. Heart J. 2013, 34, 835–843. [Google Scholar] [CrossRef] [Green Version]
  39. Tsuchihashi, M.; Tsutsui, H.; Kodama, K.; Kasagi, F.; Setoguchi, S.; Mohr, M.; Kubota, T.; Takeshita, A. Medical and socioenvironmental predictors of hospital readmission in patients with congestive heart failure. Am. Heart J. 2001, 142, 20A–26A. [Google Scholar] [CrossRef] [PubMed]
Figure 1. Histograms showing the difference in the distribution of ECW/TBW ratios in the three groups. The vertical axis represents data counts (number of examinations) that reflect frequency. The horizontal axis represents the ratio of ECW/TBW. Red, blue, and green bars show the control, experienced, and inexperienced groups, respectively. Note that the distribution in the inexperienced group has at least two peaks.
Hearts 04 00006 g001
Figure 2. Q-Q plots showing whether the three groups are normally distributed. The vertical axis represents the ECW/TBW ratio, and the horizontal axis represents the inverse normal. The plots for both the control and experienced groups were nearly straight lines, suggesting that both groups were approximately normally distributed. On the other hand, the plot for the inexperienced group was not linear, indicating that it was not normally distributed.
Hearts 04 00006 g002
Figure 3. Scatter diagram showing regression lines of the two groups. The vertical axis represents the ECW/TBW ratio, and the horizontal axis represents the age. Red denotes the experienced group, and blue denotes the control group. When variable X is age and variable Y is ECW/TBW ratio, the equation of the regression line of the experienced and control group is given by Y = 0.0007X + 0.3552, and Y = 0.0007X + 0.3462, respectively, and the regression lines are parallel. On average, the ECW/TBW ratio in the experienced group was 0.09 higher than that in the control group, from 44 to 95 years old.
Hearts 04 00006 g003
Table 1. Characteristics of the study population and differences between females and males.
Female + MaleFemaleMale
Number of outpatients756370 (48.9%)386 (51.1%)
Data count39221865 (47.6%)2057 (52.4%)
Number of examinations6.8 ± 8.42 7.4 ± 10.02 6.3 ± 6.62
Age74.8 ± 12.83 77.3 ± 12.29 72.5 ± 12.88
Height (cm)156.84 ± 10.49 148.97 ± 7.28 163.97 ± 7.41
weight (kg)59.68 ± 15.36 52.67 ± 13.66 66.00 ± 13.88
BFM (Body Fat Mass)19.19 ± 8.87 19.09 ± 9.47 19.29 ± 8.28
SLM (Soft Lean Mass)38.29 ± 11.68 31.56 ± 5.82 44.17 ± 7.76
FFM (Fat Free Mass)40.49 ± 9.90 33.58 ± 6.06 46.71 ± 8.14
BMI (Body Mass Index)24.16 ± 8.35 23.59 ± 5.21 24.46 ± 4.41
ECW/TBW0.4014 ± 0.0161 0.4050 ± 0.0147 0.3981 ± 0.0165
Chronic heart failure481234247
Renal failure14410
Chronic renal failure933855
Diabetes mellitus380168212
Dyslipidemia653134
Hyperlipidemia203101102
Hypercholesterolemia311160151
Numbers are presented n (%) or mean ± standard deviation. ECW, extracellular water; TBW, total body water.
Table 2. Characteristics of the study population and differences between the three groups.
ExperiencedInexperiencedControl
Number of outpatients257 (34.1%)224 (29.6%)275 (36.3%)
Data count1318 (33.6%)1288 (32.8%)1316 (33.6%)
Number of examinations4.6 ± 10.93 4.2 ± 8.68 4.7 ± 3.55
Age82.9 ± 10.00 74.2 ± 11.90 67.4 ± 11.47
Height (cm)153.16 ± 10.58 157.19 ± 9.74 160.17 ± 9.93
Weight (kg)52.39 ± 15.78 63.25 ± 14.789 63.48 ± 12.66
BFM (Body Fat Mass)16.04 ± 9.36 21.38 ± 8.38 20.20 ± 7.90
SLM (Soft Lean Mass)34.19 ± 8.9339.55 ± 9.08 41.15 ± 14.82
FFM (Fat Free Mass)36.35 ± 9.30 41.87 ± 9.50 43.28 ± 9.51
BMI (Body Mass Index)22.07 ± 4.99 25.44 ± 4.71 24.99 ± 12.42
ECW/TBW0.4121 ± 0.0141 0.3996 ± 0.0150 0.3924 ± 0.0123
Chronic heart failure2572240
Renal failure914
Chronic renal failure602310
Diabetes mellitus104113163
Dyslipidemia101936
Hyperlipidemia527774
Hypercholesterolemia78117116
Numbers are presented n (%) or mean ± standard deviation. ECW, extracellular water; TBW, total body water.
Table 3. Coefficients of correlations in various combinations of each data.
WeiBFMSLMFFMBMIE/TGenAgeCHFRFCRFDMDLHLHSHH
Height0.63 *0.16 *0.85 *0.85 *0.16 *−0.41 *0.71 *−0.52 *−0.23 *−0.10 *−0.07 *0.23 *0.06 *-0.02 0.12 *−0.24 *
Wei0.80 *0.84 *0.84 *0.86 *−0.48 *0.44 *−0.61 *−0.16 *−0.18 *−0.12 *0.27 *0.08 *0.11 *0.29 *−0.34 *
BFM0.35 *0.35 *0.92 *−0.35 *0.01 −0.38 *−0.08 *−0.17 *−0.15 *0.18 *0.06 *0.14 *0.29 *−0.26 *
SLM0.99 *0.51 *−0.43 *0.67 *−0.61 *−0.19 *−0.13 *−0.07 *0.26 *0.07 *0.04 *0.19 *−0.30 *
FFM0.50 *−0.43 *0.67 *−0.61 *−0.18 *−0.12 *−0.06 *0.26 *0.07 *0.04 *0.18 *−0.30 *
BMI−0.34 *0.09 *−0.43 *−0.08 *−0.18 *−0.12 *0.20 *0.06 *0.15 *0.29 *−0.30 *
E/T −0.21 *0.71 *0.39 *0.09 *0.37 *−0.31 *−0.13 *−0.18 *−0.29 *0.44 *
Gen−0.19 *−0.01 −0.08 *0.03 *0.15 *0.01 −0.03 0.01 −0.06 *
Age0.41 *0.17 *0.23 *−0.30 *−0.08 *−0.10 *−0.22 *0.44 *
CHF0.09 *0.29 *−0.26 *−0.20 *0.00 −0.11 *0.34 *
RF0.19 *0.08 *−0.06 *0.10 *−0.04 *0.18 *
CRF−0.11 *−0.07 *−0.06 *−0.19 *0.27 *
DM0.09 *0.17 *0.19 *−0.20 *
DL−0.16 *−0.01 −0.11 *
HL0.17 *−0.15 *
HS−0.21 *
The numbers show coefficients of correlation in various combination. * shows p < 0.01. Wei, weight; BFM, body fat mass; SLM, soft lean mass; FFM, fat-free mass; BMI, body mass index; E/T, extracellular water/total body water; Gen, gender; CHF, chronic heart failure; RF, renal failure; CRF, chronic renal failure; DM, diabetes mellitus; DL, dyslipidemia; HL, hyperlipidemia; HS, hypercholesterolemia: HH, History of hospitalization (whether patients have experienced being hospitalized with chronic heart failure or not.).
Disclaimer/Publisher’s Note: The statements, opinions and data contained in all publications are solely those of the individual author(s) and contributor(s) and not of MDPI and/or the editor(s). MDPI and/or the editor(s) disclaim responsibility for any injury to people or property resulting from any ideas, methods, instructions or products referred to in the content.

