
A Sensor (Optode) Based on Cellulose Triacetate Membrane for Fe(III) Detection in Water Samples


Department of Chemistry, Faculty of Mathematics and Natural Sciences, IPB University, Dramaga, Bogor 16680, Indonesia
*
Author to whom correspondence should be addressed.
Chemistry 2024, 6(1), 81-94; https://doi.org/10.3390/chemistry6010005
Submission received: 23 October 2023
/
Revised: 14 December 2023
/
Accepted: 15 December 2023
/
Published: 27 December 2023
(This article belongs to the Section Green and Environmental Chemistry)
Abstract
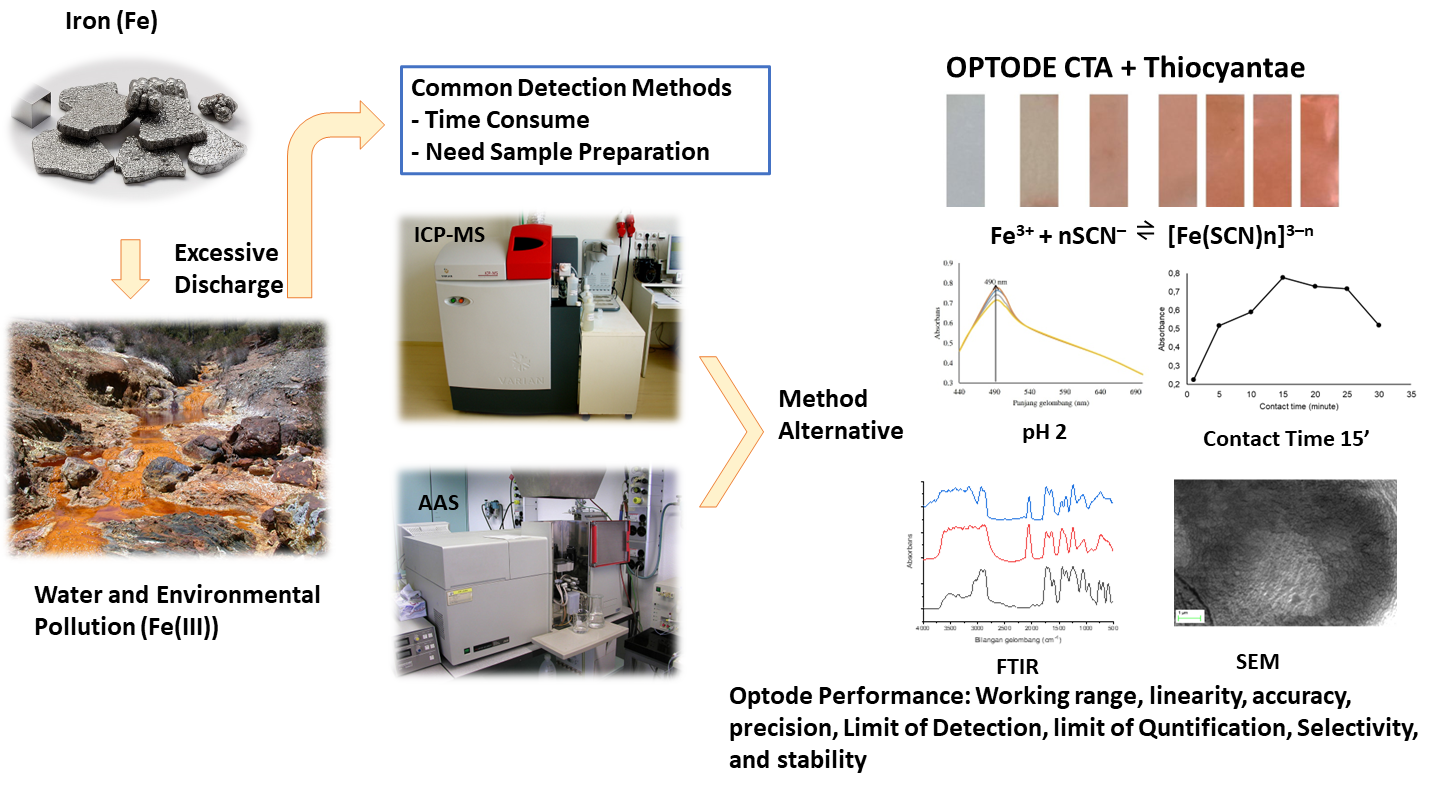
:Iron is a heavy metal that often contaminates water. High iron concentrations are toxic to human health, so monitoring its presence in water is necessary. Iron in water can be detected using an optical sensor (optode). This research aims to fabricate an optode based on a cellulose triacetate membrane with a selective reagent against Fe(III). The optode was fabricated by mixing cellulose triacetate polymer, a plasticiser (a mixture of oleic acid and acetophenone), aliquot-336, and thiocyanate as a selective reagent. Membrane performance was tested based on working range, linearity, limit of detection and quantitation, precision, and accuracy. The performance of the membrane showed a linear response in the concentration range of 0.1–4 mg/L with a coefficient of determination (R2) of 0.9937, limit of detection of 0.0250 mg/L, limit of quantitation of 0.0757 mg/L, repeatability precision with a relative standard deviation of 3.31%, and an accuracy of 100.49%. Optode selectivity was good for interfering ions Cr(VI) and Pb(II). The colour complex of the optode was stable until the 10th day. The application of iron detection in water samples shows an average concentration of 0.2541 mg/L with good precision and accuracy.

1. Introduction
Iron in the ionic state II/III is essential for living organisms. Iron is functionally vital in haemoglobin, myoglobin, haemenzymes, and many other cofactors involved in biological reactivity. In addition, iron is also one of the heavy metals commonly found in water. Excessive iron concentration in water affects the food chain, leading to the accumulation of heavy metals in organisms. The accumulation of high iron levels is associated with an increased risk of heart disease, cancer, and other diseases such as hemochromatosis. Therefore, there is a need for reliable, selective, and specific probes and methods to detect and monitor levels of Fe3+/Fe2+ iron species to prevent the effects of excess iron in the body [1,2]. The Minister of Health Regulation Number 32 of 2017 established the iron threshold in clean water sanitation at one mg/L [3].
Sensor development technology is an analytical methods which is sensitive, selective, and rapid, and is currently the most studied in detecting or determining ions in experimental samples. The sensor used is an optode membrane (optical sensor). The optode utilises the reaction of a ligand with an analyte to produce a specific colour allowing us to detect the analyte. The resulting colour complex is proportional to the analyte concentration. Cellulose triacetate (CTA) is used as the primary polymer for making optode membranes because it has advantages over other polymers. It does not absorb water, so the colour in the complex is better produced. Thiocyanate ion is added as an active component, reacting with Fe(III) and forming a red complex. Thiocyanate will form a red complex with iron(III). The formation of colour-complex solutions produced from Fe(III) and thiocyanate became more intense as the iron concentration increased and showed a correlation. The reaction of Fe(III) with thiocyanate is specific, producing a red colour, while the response of thiocyanate with Fe(II) does not create a significant colour [4,5,6].
The creation of an optode for iron(III) detection was carried out by Shamsipur et al. using the ionophore 5-(8-hydroxy-2-quinolinylmethyl)-2,8-dithia-5-aza-2,6-pyridinophane and was used for speciation because it is specific to iron(III). Łukasik and Wagner-Wysiecka developed an optode for iron sensing equipped with the chromo ionophore α,α-bis(salicylimino)-m-xylene. The Optode used CTA-based membrane optodes for use as iron detectors and produced detection limit of 2.73 × 10⁻⁶ M. Problems arise because the chromo ionophore first needs to be synthesised and characterised before use, so it requires a longer process. Therefore, this research utilises thiocyanate (SCN−) as a more straightforward and specific chromoionophore [7].
This study aims to fabricate, characterise, and determine the optimum state of the optode’s CTA membrane in detecting Fe(III), as well as to test the performance of the membranes that have been made. The proposed optode is new approach and is expected to have a reasonable detection limit, be sensitive, and be selectively used to determine the iron content in samples using thiocyanate as a specific reagent and Aliquot-336 as an ionophore and be successfully used to determine iron ions in the sample.
2. Experimental Section
2.1. Materials
Distilled water, CTA (Merck, Damstard, Germany), NH4SCN 1 M (Merck, Damstard, Germany), aliquot-336 (trioctylmethylammonium chloride), oleic acid, chloroform p.a, acetophenone p.a, solid FeCl3 (Merck, Damstard, Germany), solid K2Cr2O7 (Merck, Damstard, Germany), solid Pb(NO3)2 (Merck, Damstard, Germany), 0.1 M NaOH, and 0.1 M HCl.
2.2. Instrumentation
Glassware, magnetic stirrer (MG-78-1, Changzhou Xiangtian Experimental Instrument Factory, Jiangzhou, China), analytical balance (OHAUS AX224/E, Ohaus Instrument, Shanghai, China), pipette, pH meter (Hanna HI 2211, Hanna Instrument, Smithfield, RI, USA), sonicator (AS ONE, As One Corporation, Osaka, Japan), screw micrometre (Fowler 52-224, Fowler Hig Precision, Canton, MA, USA), FTIR spectroscopy (ABB Ltd., Zurich, Switzerland), scanning electron microscope (Carl Zeiss EVO MA10, Carl Zeiss Microscopy Deutschland GmbH, Oberkochen, Germany), and solid UV-Vis spectrophotometer (Ocean Optics Vis-NIR USB4000, Ocean Optics Asia, Shanghai, China).
2.3. Procedure
2.3.1. NH4SCN Optimisation and CTA Optode Membrane Fabrication
A total of 0.1350 g of CTA was dissolved in 10 mL of chloroform solution. Then, the plasticiser containing a mixture of oleic acid and acetophenone with a ratio of (0.03:0.27) and 0.07 mL aliquot-336 was added to the CTA solution. The mixture was stirred for 15 min. Next, 1.5 mL of NH4SCN was added to the CTA optode membrane mixture and stirred for 15 min. The solution was homogenised with a sonicator for 5 min. After becoming homogeneous, the solution was poured evenly into a Petri dish and allowed to stand at room temperature for 24 h. The membrane that formed was cut to a size of 3 × 1 cm. The thickness of the membrane was measured with a micrometre screw. The procedure was repeated with variations in NH4SCN concentrations of 0.1, 0.5, and 1 M. Each membrane with variations in NH4SCN was immersed in a standard Fe(III) solution. The absorbance value was measured using a solid UV-Vis spectrophotometer. The concentration of NH4SCN, which gave the maximum absorbance value, was used to fabricate the CTA optode membrane with the same procedure.
2.3.2. Characterisation of CTA Optode Membrane
Optode membrane characterization using FTIR: As a solid sample, the CTA optode membrane was inserted into the sample container and placed in the FTIR. Measurements were carried out in the 800–4000 cm−1 wave number range to analyse functional groups [7]. The membranes were characterised as CTA only, CTA + SCN, and CTA + SCN + Fe(III).
Characterization of membrane structure and pores using SEM: The CTA membranes were characterised using SEM at 5000×, 20,000× and 30,000× magnifications. SEM analysis was carried out to determine the structure and pores of the resulting membrane. Optode membrane thickness measurement: As many as five optode membranes were prepared, each from three different moulds and cut to a size of 3 × 1 cm. After that, the thickness of the optode membrane was measured using a micrometre screw.
2.3.3. Determination of Optimum pH and Contact Time
The CTA optode membrane was tested in a pH range of 1–7 in a standard Fe(III) solution with a concentration of 2 mg/L. Then, 0.1 M HCl solution was used for acid conditioning, while 0.1 M NaOH solution was used for alkaline conditioning. Absorbance values were recorded at different pH values using a solid UV-Vis spectrophotometer.
The CTA optode membrane was immersed in 25 mL of Fe(III) solution with a concentration of 2 mg/L under pH 2 conditions. The contact time was varied between 1, 5, 10, 15, 20, 25, and 30 min.
2.3.4. Determination of Working Range and Optode Membrane Linearity Test
First, the working range was determined by immersing the CTA optode membrane in 25 mL of standard Fe(III) solution in a concentration range of 0.1–15 mg/L for 15 min at pH 2 conditions. The resulting colour complex was measured using a UV-Vis spectrophotometer for solids at wavelength of 400–700 nm.
The linearity test was carried out by using a standard solution of Fe(III) with the six best concentrations was used to determine the working range of the membrane. The CTA optode membrane was immersed in 25 mL of standard Fe(III) solution for 15 min at pH 2. A solid UV-Vis spectrophotometer measured the absorbance value to make a linear regression curve. The analysis was carried out by repeating measurements three times on different membranes.
2.3.5. Limit of Detection and Limit of Quantity Test
The limit of detection (LoD) and limit of quantitation (LoQ) were measured based on ICH [8]. LoD is measured to determine the lowest amount of analyte in the sample without having to be quantified as an exact value, whereas LoQ is measured to determine the lowest amount of analyte that can be determined quantitatively with appropriate precision and accuracy. The standard deviation and slope values of the linear regression curve are required in this calculation. The following Equations are used (1):
where s is standard deviation of the intercept from a calibration curve and S is mean of slope from calibration curve.
2.3.6. Precision and Accuracy Test
Accuracy test is calculated through percent recovery (Equation (2)). The analyte concentration is made into specific ranges, such as 50%, 100%, and 200%. Fe(III) solutions with concentrations of 1, 2, and 4 mg/L were prepared. The CTA optode membrane was then immersed for 15 min under pH 2 conditions and was repeated 3 times. After that, the colour of the complex on the CTA optode membrane was measured by a solid UV-Vis spectrophotometer.
The precision test is carried out repeatedly, namely testing on the same day with the same analyst, reagent, and instrument. Measurement of Fe(III) 2 mg/L samples was repeated 6 times. Measurements were carried out for 15 min at pH 2 conditions. According to Harmita, the precision test can be measured as standard deviation or relative standard deviation (coefficient of variation, Equation (3)) [9].
Accuracy test:
Precision test:
where SD is standard deviation, RSD relative standar deviation.
2.3.7. Selectivity Test
The selectivity test for interfering ions refers to Harvey [10]. This test was carried out to measure the freedom of the CTA optode membrane from interference. The CTA optode membrane was immersed in a standard solution of Fe(III) without interfering ions, a mixture of the standard solution of Fe(III) and interfering Cr(VI), and a mixture of the standard solution of Fe(III) and interfering Pb(II). The membrane was immersed for 15 min in pH 2 conditions. The absorbance was measured with a solid UV-Vis spectrophotometer three times each. The selectivity for interfering ions against the analyte can be determined by the selectivity coefficient (Equation (4)).
where KA is analyte coefficient an KI interference coefficient.
2.3.8. Colour Complex Stability Test
The optode membrane was cut to 3 × 1 cm and then immersed in 25 mL of standard Fe(III) solution for 15 min at pH 2. The colour of the complex formed was measured daily with a solid UV-Vis spectrophotometer, starting from day 0 to day 10.
2.3.9. Detection of Fe(III) in Water Samples with CTA Optode Membrane
Fe(III) was detected in water samples by immersing the CTA optode membrane in 15 mL of water sample diluted in 10 mL of distilled water at pH 2 for 15 min. The resulting colour complex was measured for absorbance with a solid UV-Vis spectrophotometer. The sample concentration was obtained from the absorbance measurement, which was substituted into the linear equation of the Fe(III) standard calibration curve. The data obtained was then tested for precision and accuracy.
3. Results and Discussion
3.1. Optimisation of NH4SCN and CTA Optode Membrane Fabrication
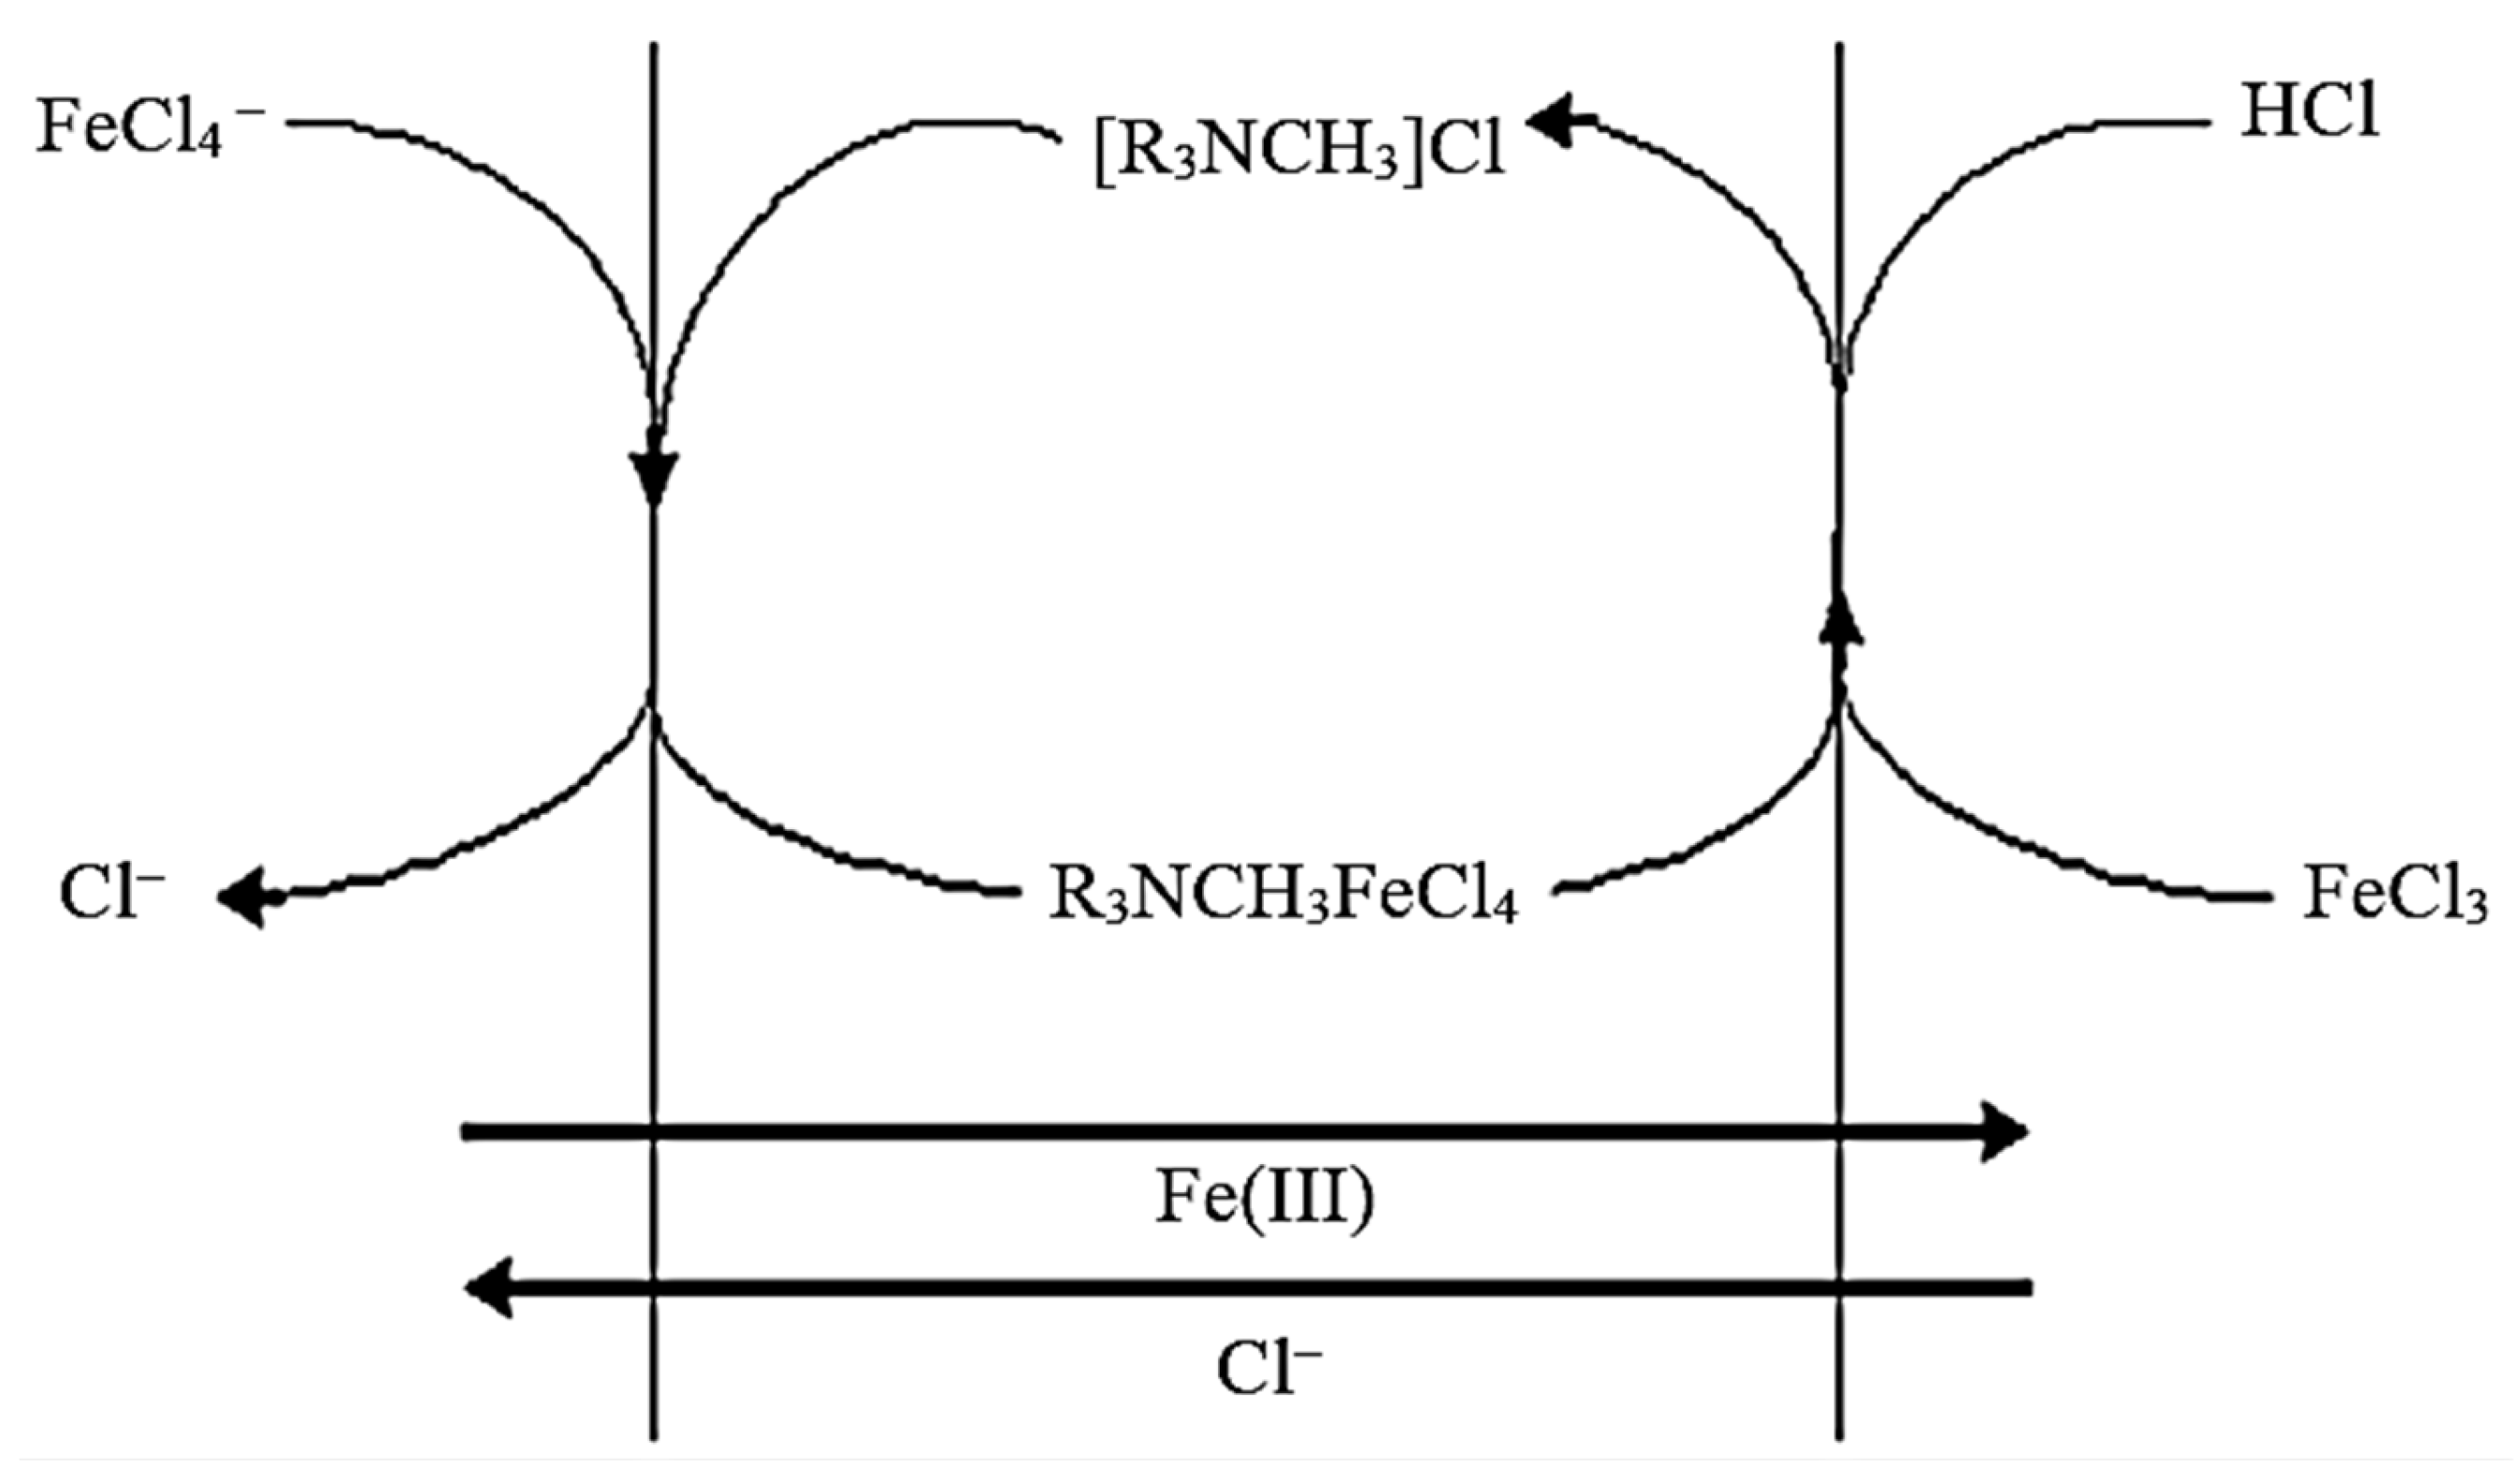
Optode membrane fabrication uses CTA as the primary material, a hydrophobic polymer that functions as a carrier matrix for active components to recognise Fe(III) as an analyte. Adding a flexible plasticizing macromolecular chain reduces the rigidity of the CTA membrane. The higher flexibility of the CTA membrane results in lower resistance in the process of mass transfer of analytes into the membrane [11]. Aliquot-336 extracts or carries Fe(III) ions into the CTA membrane so that it can react with the active components [12]. The reaction of Fe(III) and aliquot-336 can be seen in Reaction (5), while the interaction mechanism is shown in Figure 1.
Figure 1.
Mechanism of interaction between Fe(III) and aliquot-336.

The active component used is NH4SCN; the thiocyanate ion in ammonium thiocyanate is used as a selective chromoionophore against Fe(III) ions. Thiocyanate is used because it is a suitable ligand and easily forms complexes with transition metals [13]. Iron(III) reacts with the thiocyanate ion to produce a red–orange colour range with the reaction in Reaction (6).
The letter n indicates the number of thiocyanate ions; this proves that the required stoichiometric concentration of thiocyanate ions is two to six times the Fe(III) ions’ concentration, depending on the chemical environment. The standard concentration of Fe(III) used is 2 mg/L or 3.57 × 10⁻⁵ M, so it takes at least 7.14 × 10⁻⁵ up to 2.14 × 10⁻⁴ M concentration of NH4SCN.
NH4SCN optimization in the CTA membrane produces the maximum absorbance value at the concentration of NH4SCN 1 M in Table 1. NH4SCN concentration at 0.1 M resulted in a negative absorbance value, which means the CTA optode membrane was not able to absorb Fe(III) ions. Fe(III) levels were not detected in the CTA optode membrane because the concentration of NH4SCN 0.1 M is too small. It required an enormous concentration of NH4SCN, which was 1 M, or 2800× greater than the concentration of Fe(III). This is caused by the chemical environment surrounding the sample, both from the pH conditions and the contact time between the sample and the active components that are not yet at their optimum values.
3.2. Characterisation of the Optode Membrane
3.2.1. Physical Characteristics
A suitable optode membrane has the characteristics of being able to recognise analytes well and being able to work without interference, even if there are disturbances around it. A suitable optode membrane can transmit or reflect light, immobilise reagents and ionophore ions well, and provide good colouring pores for fulfilling the principles of spectrophotometry when performed quantitatively [5,14,15,16]. The physical characteristics of the resulting optode membrane were analysed from uniformity of size, thickness, and pores. The optode membrane size is cut to the same length and width, 3 × 1 cm, and the thickness of the optode membrane measured using a screw micrometre is expected to be constant. The measurement results from three different plates showed an average optode membrane thickness of 0.044 mm with a %RSD of 4.07% in Table 2. The uniformity of thickness is expected to help the thiocyanate as the active component to be evenly distributed in the optode membrane.
3.2.2. SEM
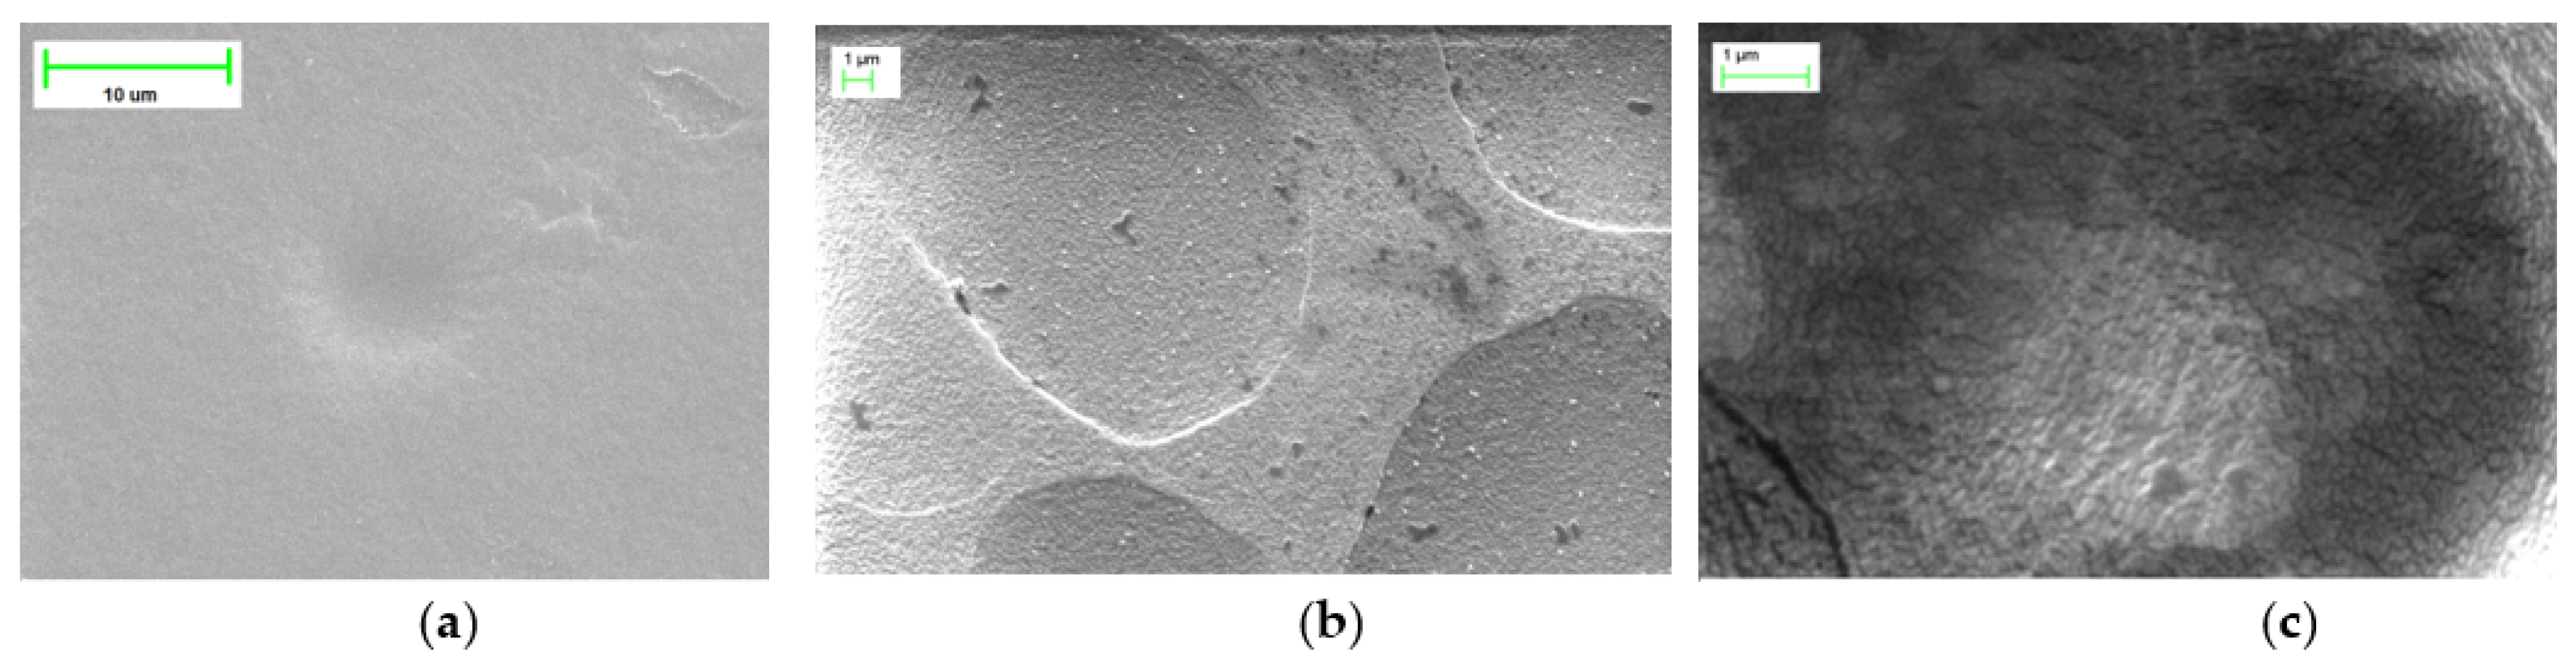
Optode membrane pores were analysed using SEM to determine the surface morphology of the resulting membrane. CTA optode membranes were characterised using SEM with different magnifications, and the results are presented in Figure 2. The surface morphology of the CTA optode membrane was observed to have a homogeneous surface. There was a visible cavity at 30,000× magnification on the membrane surface due to the interaction between the CTA polymer and thiocyanate. The thiocyanate is well distributed across the membrane cross-section [13]. A well-distributed active component is expected to be able to bind Fe(III) stably so that the absorbance measurement corresponds to the measured analyte concentration.
The SEM images did not show any significant changes due to the presence of thiocyanate and heavy metals. A membrane containing thiocyanate ligands before contact with heavy metals can be seen in Figure 2a (5000×); CTA membrane after contact with heavy metals and the colours formed at magnifications of 20,000× and 30,000× can be seen in Figure 2b,c. The level of homogeneity on the membrane surface is maintained, even though reactions occur between ligands and metals on the membrane surface. A homogeneous surface will facilitate the formation of a uniform colour after contact with heavy metals. The interaction of heavy metals with dye ligands does not affect membrane homogeneity.
3.2.3. FTIR
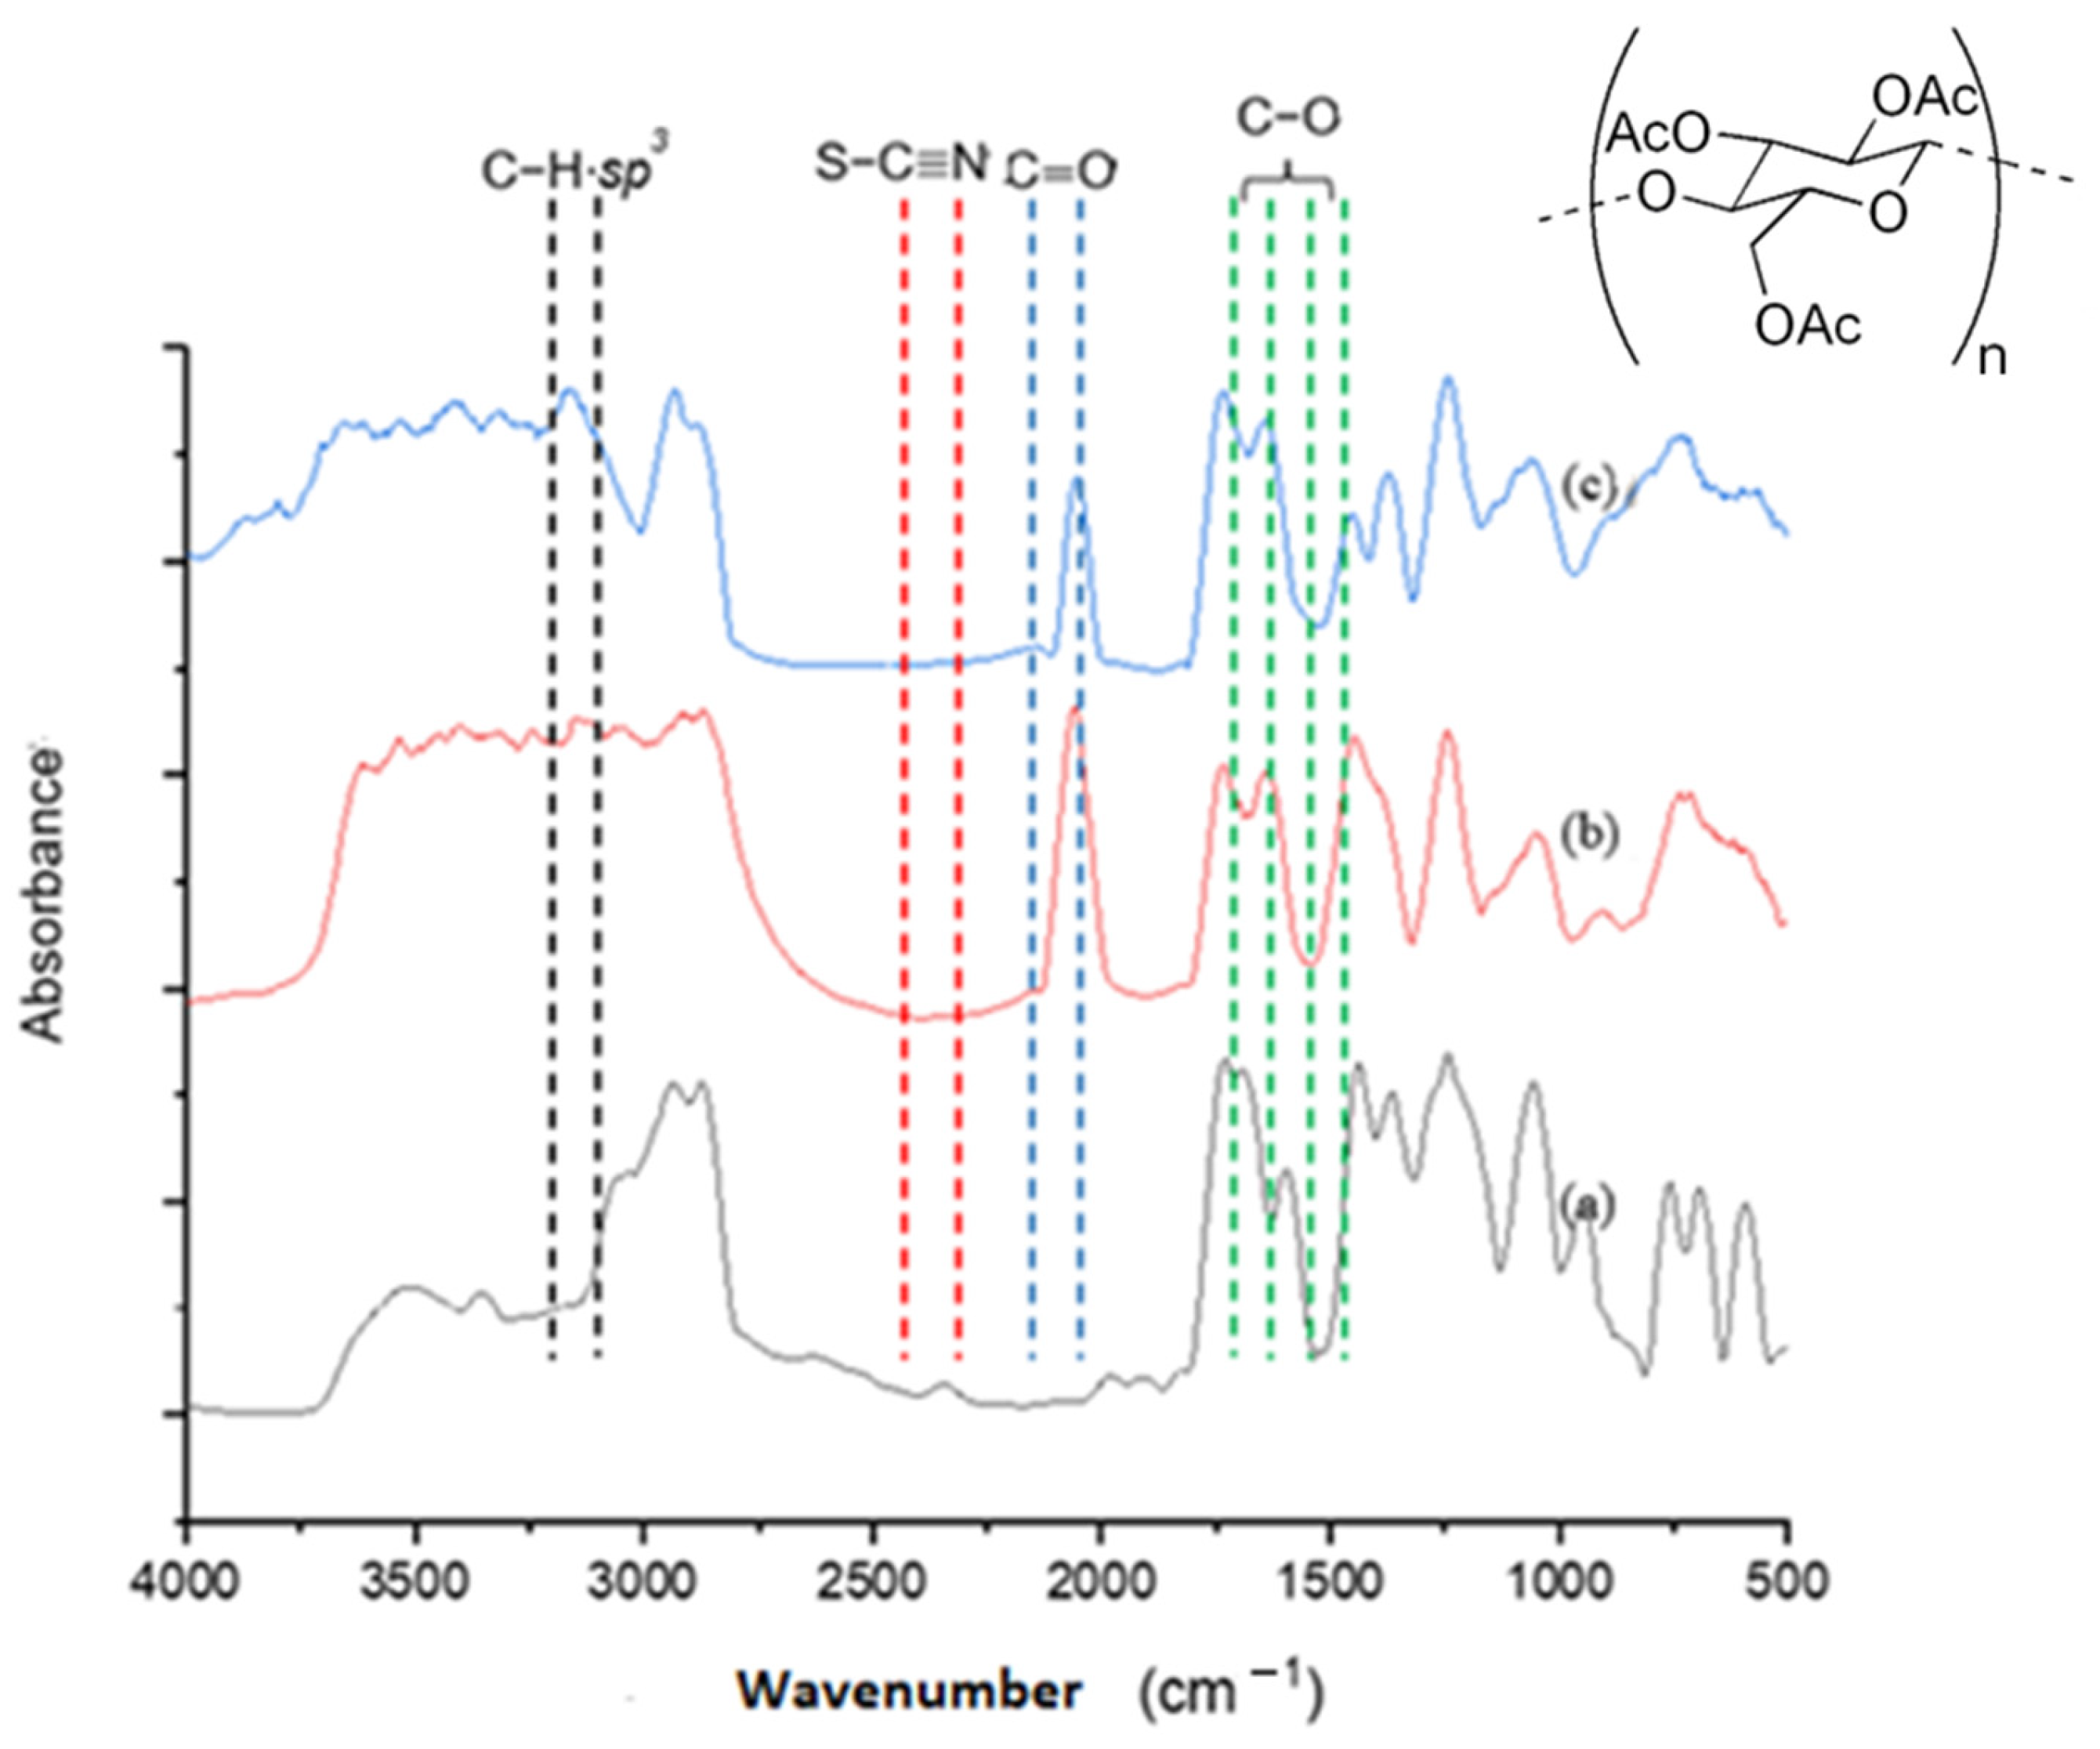
FTIR analysis was conducted in the 500–4000 cm−1 wavenumber range. CTA has C–H, C–O, and C=O bonding functional groups. Based on Figure 3, the peak in the wavenumber can be seen at 2935 cm−1, which represents the strain CH sp3, wavenumbers 1055 and 1245 cm−1 represent the C–O strain, as well as a wavenumber of 1735 cm−1 indicates the presence of the C=O strain. The addition of the active component, thiocyanate ion, causes a change in the IR spectrum and an increase in the wave number peak at 2061 cm−1, which indicates the presence of the S−CN strain. Immersion of the optode membrane in standard Fe(III) solution also did not cause chemical changes in the optode membrane or shift of the resulting IR spectrum (Figure 3). The wavenumbers for the fabricated optode membranes that are read in the IR spectrum meet the range according to the literature shown in Table 3.
3.3. Optimization of pH and Contact Time
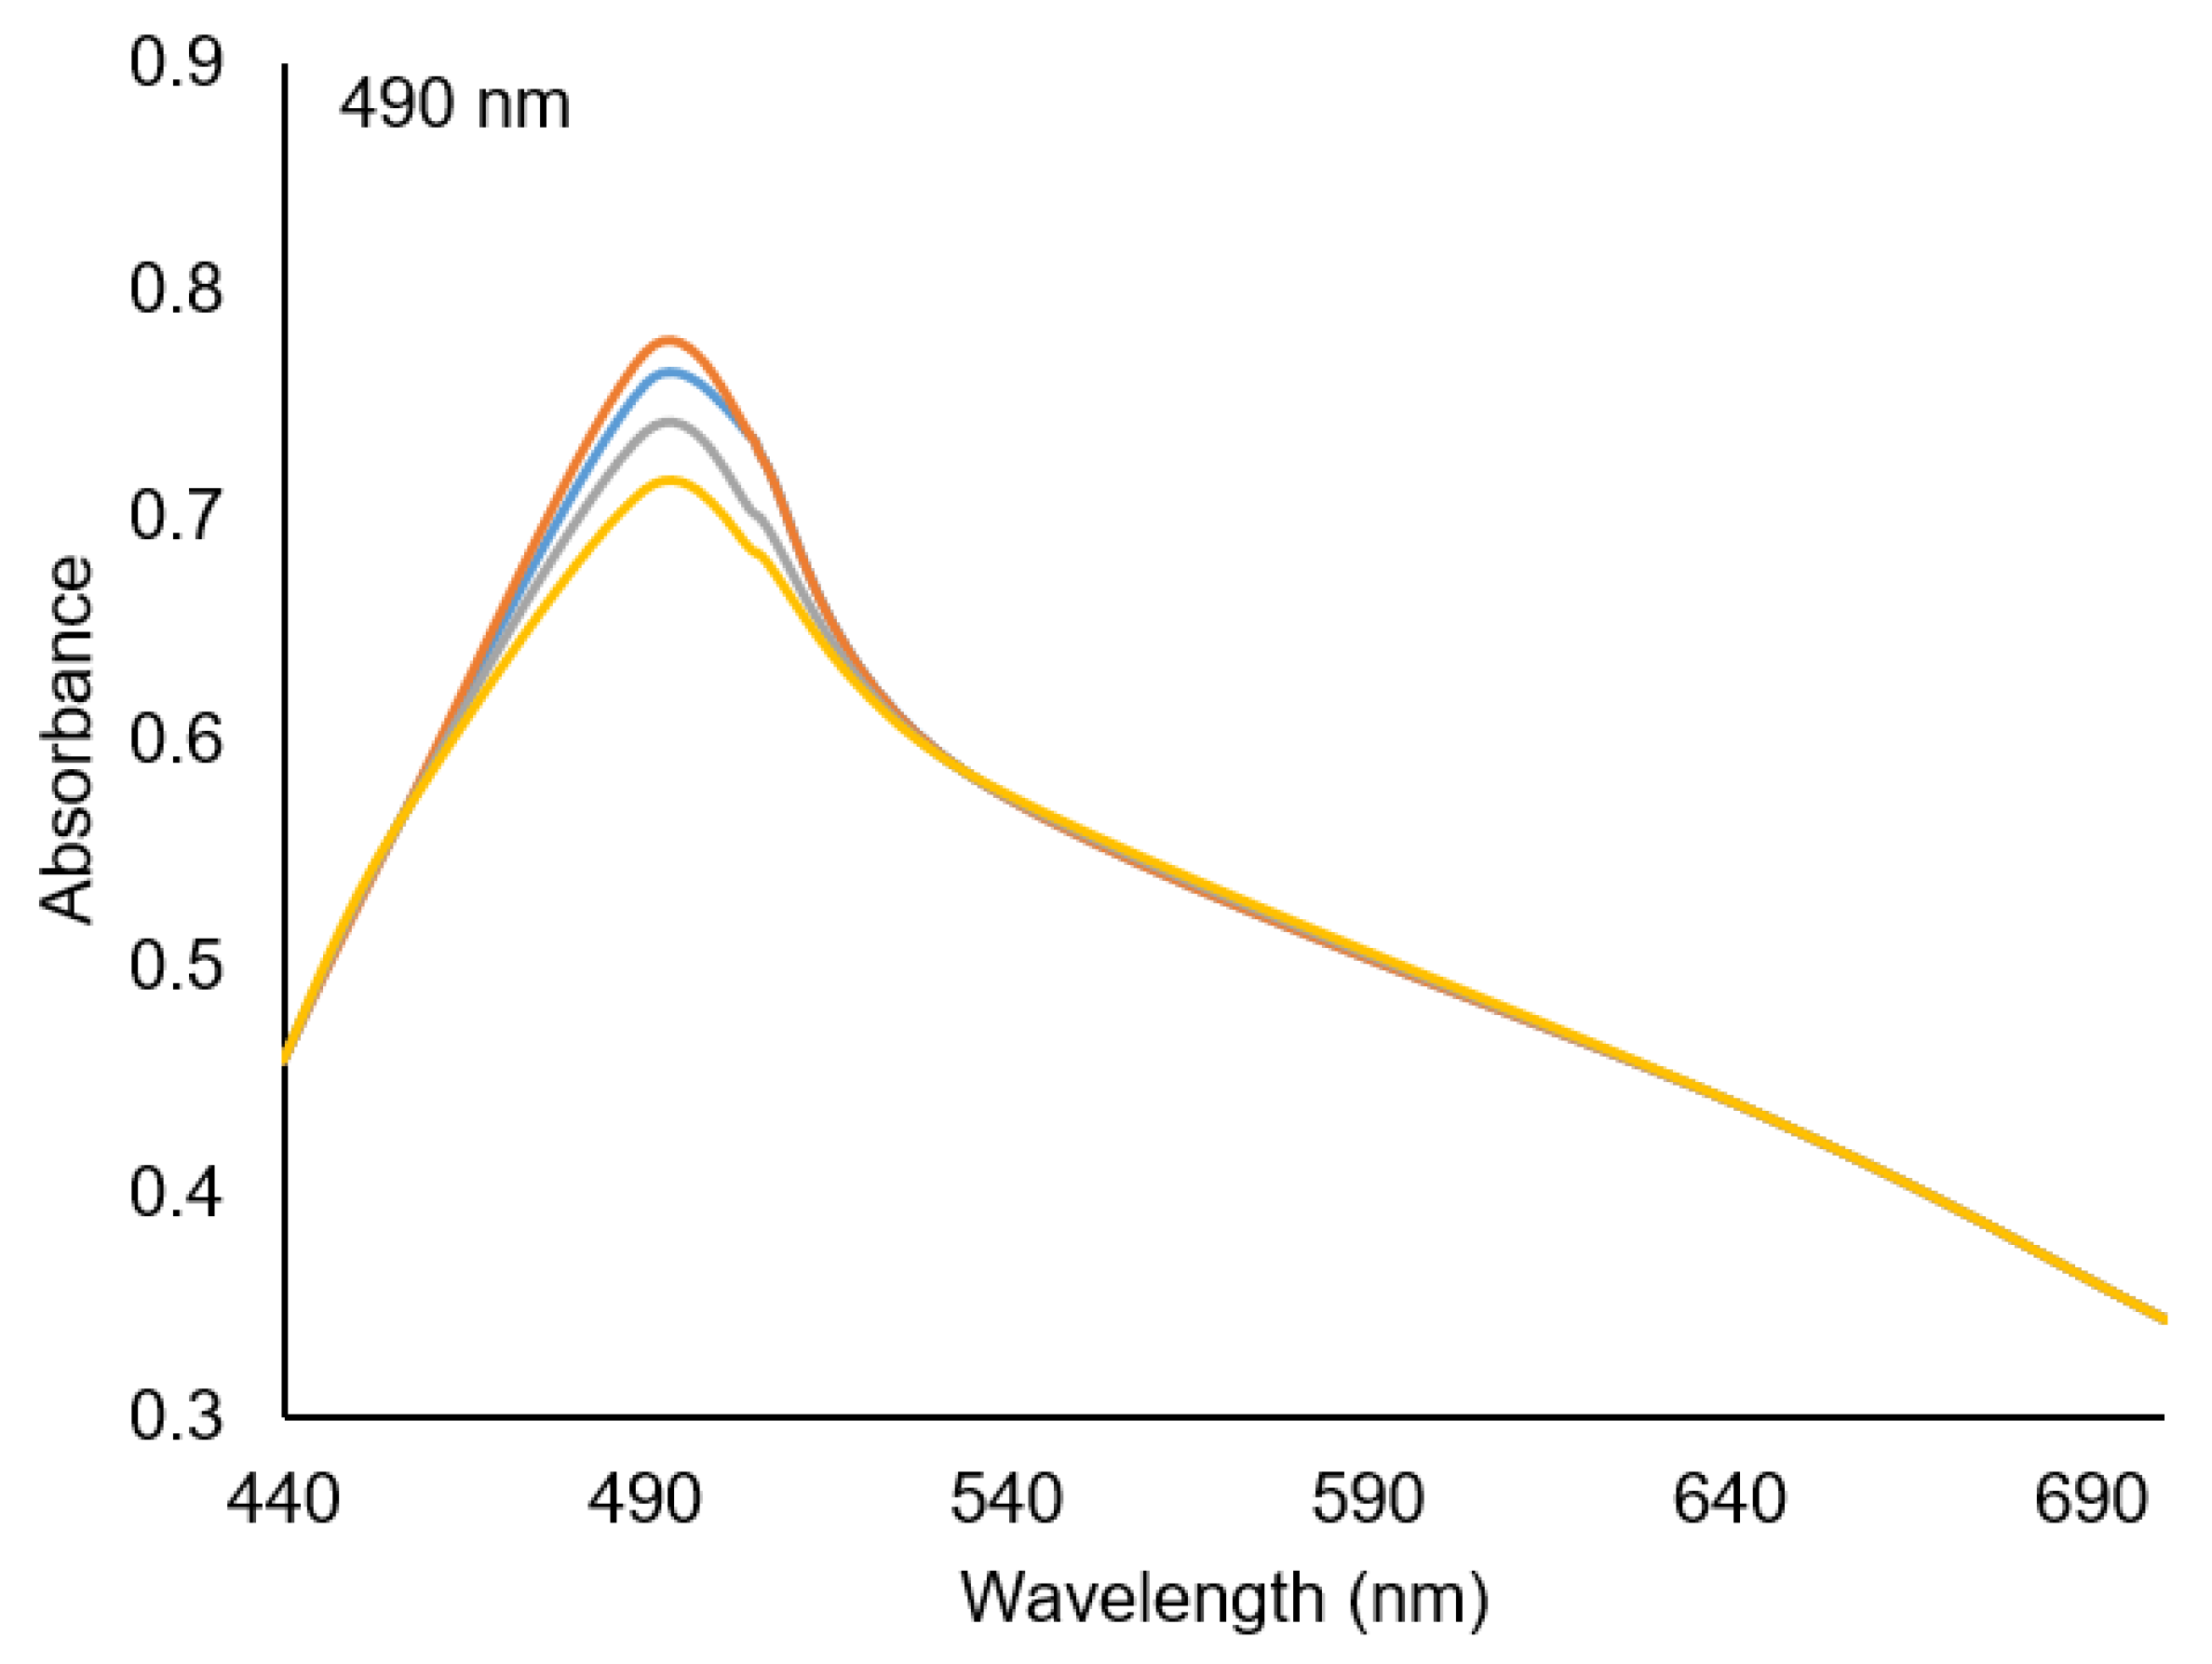
The chemical environment of the sample, the pH value, and the contact time between the sample and active component must reach the optimum conditions. The wavelength range used is in the range of 440–700 nm. The maximum wavelength was 490 nm, obtained from the measurement of pH optimization in the range 1–4 (Figure 4). The maximum wavelength in this research is greater than the research conducted by Rastegarzadeh, with a max of 472 nm [14]. The iron thiocyanate complex includes complexes that have a charge, so it generally absorbs at longer wavelengths. This is due to the increase in electron transfer, which requires less energy.
The maximum absorbance of 0.7725 was obtained at pH 2. The complex formed was more stable at pH 2 than at pH 1, which was too acidic. These results are in accordance with Verma’s statement that iron complexes and thiocyanate ions occur in acidic conditions [6]. The absorbance then decreases at pH 3 and 4 with reduced acidity. This is because the number of complexes formed is more stable and reacts under acidic conditions of pH 2 [18]. The pH 5–7 condition was achieved by adding NaOH to Fe(III) standard solution. This treatment was carried out because the measured pH value of the Fe(III) 2 mg/L standard solution was 4.3. The colour of the complex at the resulting optode at pH 5–7 becomes yellow. Different complex colours may occur because of the exchange between ligands SCN− and OH−. The statement is directly proportional to the increase in the concentration of OH− [19]. The optimum pH is pH two, so conditions will be acidic. The acidic conditions will ensure that Fe(III) is not precipitated with OH− anions, so the Fe(III) reaction will be optimal with thiocyanate, which corresponds to Reaction (6).
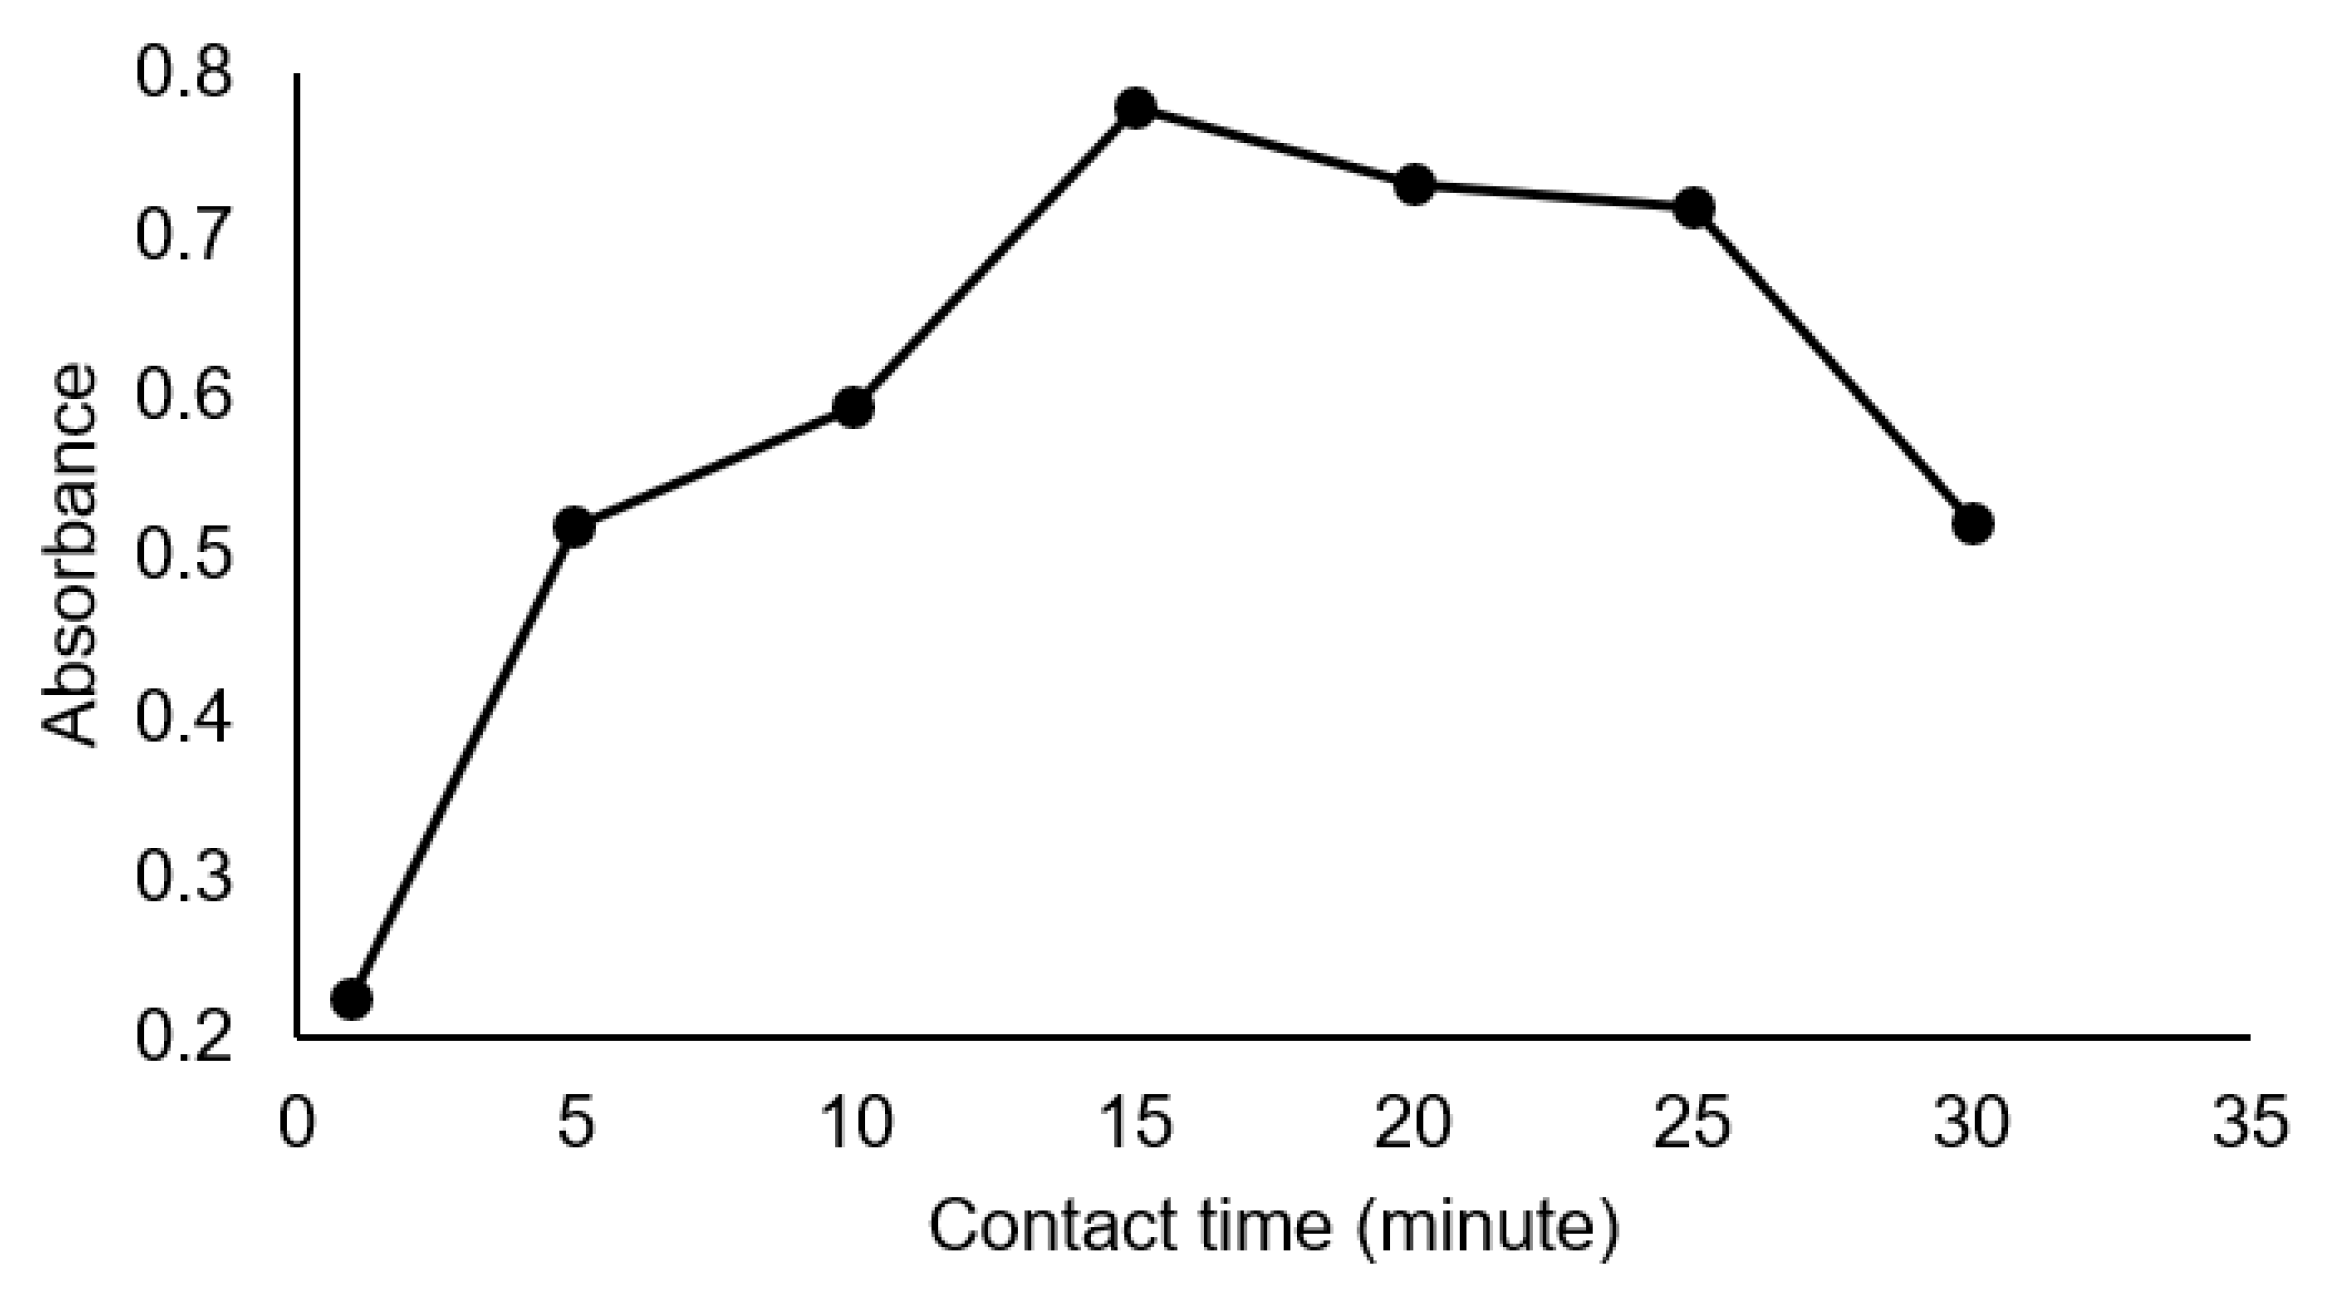
Determination of the contact time performed at intervals of 1, 5, 10, 15, 20, 25, and 30 min. The optimum optode contact time was obtained at 15 min because it produced the highest absorbance value, meaning that the most stable complex was formed at that time (Figure 5). The absorbance value continued to increase from the 1st minute to the 15th minute. After 15 min, the absorbance value began to decrease, and the colour of the complex formed slowly faded. A contact time that is too fast causes the complex formation to not yet maximum, while the faded colour of the complex is caused by the complex that has been formed redissolving into the solution [20].
3.4. Working Range and Linearity
The working range is measured at an analyte concentration of 0.1–15 mg/L. The colour of the optode membrane gets stronger as the analyte concentration increases, which is directly proportional to the absorbance value obtained. The measurement results produce a linearity value that is not good because the value of the coefficient of determination (R2) is obtained at 0.7588. The linearity is less than 0.9900. Therefore, the best six absorbances were selected to measure the optode membrane linearity parameter with three replicates.
The linear response of the membrane was evaluated in the concentration range of 0.1–4 mg/L because this produced the best value of R2. The results obtained for three consecutive measurements were 0.9937, 0.9909, and 0.9886. According to the AOAC, the R2 can be said that the linearity is improving if it is close to 1 or >0.9900 [19]. The results of the linear response indicate that the optode can produce a linear relationship between the absorbance and the concentration of the measured solution. The resulting optode is in good condition, and the obtained straight-line equation is used to calculate the concentration of the sample solution.
3.5. Limit of Detection and Limit of Quantity
The detection and quantitation limits were 0.0250 mg/L and 0.0757 mg/L, respectively (Table 4). The optode membrane’s LoQ is 0.0757 mg/L, less than the iron threshold limit for drinking water purposes of 0.1 mg/L and clean water sanitation at 1 mg/L [3,21]. This shows that optode membranes can detect iron in drinking water and clean water sanitation because they are still within the detection range. The detection limit produced in this study is better than that produced in the literature, and the detection is good enough. It can be used to detect iron that contaminates drinking water and clean water sanitation, according to the Minister of Health of the Republic of Indonesia.
3.6. Precision and Accuracy
This study uses repeatability to determine precision, which is carried out with a minimum of six measurement repetitions. The %RSD value of the research results is 3.31% (Table 5). Based on the AOAC, the acceptable %RSD value for a concentration of 2 mg/L or <10 mg/L is <7.3%. This shows that the optode has good accuracy in detecting Fe(III) in standard solutions because the %RSD value meets the requirements of the AOAC. According to Harmita, accuracy is highly dependent on the distribution of systematic errors in all stages of analysis. A high accuracy can be achieved by using tools that have been calibrated, using suitable reagents and solvents, carefully implementing and following procedures. The average %recovery obtained at three different concentrations of 1, 2, and 4 mg/L were 100.13%, 102.33%, and 99.01% (Table 6). The percentage recovery obtained met the requirements of the AOAC. The percentage recovery achieved for the concentration range of 1–10 mg/L was 80–110% [9,22]. Several situations show that precision and recovery exceed 100%. Exceeding this value could be due to system readings. According to AOAC, a range value with a value of more than 100 is allowed because it is a system response that can be more or less than this value and can be influenced by the system; as long as it is within the permitted range it can be used as valid data [23].
3.7. Selectivity and Complex Colour Stability
The selectivity test is a measurement to determine a method’s freedom from interference. The selectivity for interference with the analyte is determined with the selectivity coefficient (KA,I) [10]. The interference used in this study is another metal that is commonly found in polluted water and can form complexes with thiocyanate ions. Thiocyanates can form complexes with metals other than Fe, such as Ag, Au, Cd, Co, Cr, Cu, Hg, Ni, and Pb [24,25]. Interferences tested in this study were Cr(VI) and Pb(II) ions. The results of the selectivity test show the values of KA,I Fe(III) + Cr(VI) and Fe(III) + Pb(II) are –0.3595 and –0.4733 (Table 7). According to Harvey, the value of KA,I can be positive or negative depending on the sign of the interference coefficient (KI) and analyte coefficient (KA). If the value of coefficient, −1 < KA,I < 0 or 0 < KA,I < 1, the method is more selective against interference than analyte. The KA,I value of the presence interference Cr(VI) and Pb(II) was >–1, meaning that the method is more selective towards analytes than interference, so it can be said that the selectivity of the optode membrane is good [10].
The colour stability of the optode complex was evaluated by calculating the percentage decrease in absorbance every day, from day 0 to day 10. For ten days, the absorbance increased and decreased with an average of 0.6677, a standard deviation of 0.0209, and a %RSD of 3.14% (Table 8). The magnitude of the decrease in absorbance is not very significant, which is in the range of 0.04–8.32%. This was supported by the small standard deviation value, which indicates that the distribution of absorbance data is close to each other with the average absorbance value. According to Suah, plasticisers also play a role because they bind components in the optode to form good physical and chemical stability. Overall, the stability of the colour complex produced by the optode membrane for ten days can be said to be stable [26].
3.8. Detection of Fe(III) in Water Samples with CTA Optode Membrane
The detection of Fe(III) in water samples with the CTA optode membrane was carried out by taking samples from residential artesian well water, which is generally used for sanitation and clean water in households. Water samples came from residential boreholes with a depth of 23 m in the Cibinong District. Qualitatively, the water sample is colourless and odourless. The water sample has a pH of 6.35. The pH value of the water sample does not meet the requirements for clean, sanitary water that has been determined. A good pH value for clean water for daily sanitation in accordance with the Regulation of the Minister of Health Number 32 of 2017 is 6.5–8.5 [3].
Detection using the optode membrane showed that Fe(III) content met the requirements of clean water sanitation with an average concentration of 0.2541 mg/L, as shown in Table 9. The optode membrane’s performance in the sample was also tested and yielded good values; the precision test scored a %RSD of 3.07% and an accuracy with an average %recovery of 95.64% (Table 10 and Table 11). According to AOAC, the accepted %RSD value for levels <1 mg/L is <11% and the %recovery for acceptable levels of 0.1–10 mg/L is 80–110%. The detection results show that the water sample is still below the iron threshold set by the Minister of Health Regulation Number 32 of 2017 of 1 mg/L [3,22]. Tests were also compared using a reference method: a UV-Vis spectrophotometer using thiocyanate modified from the procedure [16] with identical conditions for measurements using an optode. The results of testing the mean values in Table 9 show that the results are similar. The Student’s t-test (95% confidence) was carried out to the result of measurement with results not statistically different from those using the reference method. Significant tests show that the measurement method using an optode for heavy metals has the potential to be an alternative method for determining heavy metals in the environment.
4. Conclusions
A CTA optical sensor (optode) to detect Fe(III) has been successfully fabricated with the active component of thiocyanate. The thickness, pore, and functional groups resulting from the characterisation of the specific characteristics of the CTA optode membrane. CTA optode membrane works optimally to detect Fe(III) at acidic pH conditions (pH 2) within 15 min. The evaluation of the optode membrane’s performance resulted in the LoD and LoQ being below the predetermined iron threshold value. The selectivity, precision, and accuracy obtained also have a good value. Thus, the optode membrane has the ability to detect Fe(III) in water samples and is proven to produce an acceptable precision and accuracy.
Author Contributions
Conceptualization, Z.A., S.S., E.R. and I.B.; Methodology, Z.A. and I.B.; Software, Z.A.; Validation, E.R., I.B. and Z.A.; Formal Analysis, Z.A.; Resources, Z.A. and I.B.; Data Curation, Z.A.; Writing—Original Draft Preparation, Z.A. and I.B.; Writing—Review and Editing, I.B. and S.S. Visualization, Z.A.; Supervision, I.B., E.R. and S.S.; Project Administration, I.B., E.R. and S.S.; Funding Acquisition, I.B. All authors have read and agreed to the published version of the manuscript.
Funding
This research was funded by Directorate General of Higher Education, Research and Technology Ministry of Education, Culture, Research and Technology of the Republic of Indonesia with contract number 102/E5/PG.02.00/PL/2023 and The APC was funded by the same grant.
Data Availability Statement
Any request for further data should contact the author.
Acknowledgments
The authors give many thanks to the analytical chemistry laboratory staffs and the joint laboratory Staffs, Department of Chemistry, IPB University for the help of instrument measurements.
Conflicts of Interest
The authors declare no conflicts of interest.
References
- Shamsipur, M.; Sadeghi, M.; Garau, A.; Lippolis, V. An efficient and selective fluorescent chemical sensor based on 5-(8-hydroxy-2-quinolinylmethyl)-2,8-dithia-5-aza-2,6-pyridinophane as a new fluoroionophore for determination of iron(III) ions a novel probe for iron speciation. Anal. Chim. Acta 2013, 761, 169–177. [Google Scholar] [CrossRef] [PubMed]
- Prianto, E.; Husnah, H. Penambangan timah inkonvensional: Dampaknya terhadap kerusakan biodiversitas perairan umum di pulau bangka. BAWAL 2009, 2, 193–198. [Google Scholar] [CrossRef]
- Regulation the Minister of Health of the Republic of Indonesia. Regulation of the Minister of Health of the Republic of Indonesia Number 32 of 2017 Concerning Environmental Health Quality Standards and Water Health Requirements for Sanitary Hygiene, Swimming Pools, Solus Per Aqua, and Public Baths; Minister of Health of the Republic of Indonesia: Jakarta, Indonesia, 2017.
- Ghaedi, M.; Shahamiri, A.; Hajati, S.; Mirtamizdoust, B. A novel PVC-membrane optical sensor for high sensitive and selective determination of Cu2+ ion based on synthesized (E)-N′-(pyridin-2-ylmethylene)isonicotin-ohydrazide. J. Mol. Liquids 2014, 199, 483–488. [Google Scholar] [CrossRef]
- Scindia, Y.M.; Pandey, A.K.; Reddy, A.V.R.; Manohar, S.B. Chemically selective membrane optode for Cr(VI) determination in aqueous samples. J. Anal. Chem. Acta 2004, 515, 311–321. [Google Scholar] [CrossRef]
- Verma, C.; Tapadia, K.; Soni, A.B. Determination of iron(III) in food, biological and environmental samples. Food Chem. 2017, 221, 1415–1420. [Google Scholar] [CrossRef] [PubMed]
- Łukasik, N.; Wagner-Wysiecka, E. Salicylaldimine-based receptor as a material for iron(III) selective optical sensing. J. Photochem. Photobiol. A Chem. 2017, 346, 318–326. [Google Scholar] [CrossRef]
- ICH Expert Working Group. ICH Harmonised Tripartite Guideline. Validation of Analytical Procedures: Text and Methodology. In Proceedings of the International Conference on Harmonisation of Technical Requirements for Registration of Pharmaceuticals for Human Use, Geneva, Switzerland, 2 June 2014. [Google Scholar]
- Harmita, H. Petunjuk pelaksanaan validasi metode dan cara perhitungannya. Maj. Ilmu Kefarmasian 2004, 1, 117–135. [Google Scholar] [CrossRef]
- Harvey, D. Analytical Chemistry 2.1; McGraw-Hill Companies: New York, NY, USA, 2016. [Google Scholar]
- Sellami, F.; Kebiche-Senhadji, O.; Marais, S.; Couvrat, N.; Fatyeyeva, K. Polymer inclusion membranes based on CTA/PBAT blend containing aliquot 336 as extractant for removal of Cr(VI): Efficiency, stability and selectivity. React. Funct. Polym. 2019, 139, 120–132. [Google Scholar] [CrossRef]
- Suah, F.B.M.; Ahmad, A.; Heng, L.Y. An optical sensor for Al3+ ion based on immobilized eriochrome cyanine r in polymer inclusion membrane using absorption sensing principle. Malay. J. Anal. Sci. 2021, 25, 296–310. [Google Scholar]
- Regmi, C.; Ashtiani, S.; Sofer, Z.; Hrdlička, Z.; Průša, F.; Vopička, O.; Friess, K. CeO2-blended cellulose triacetate mixed-matrix membranes for selective CO2 separation. Membranes 2021, 11, 632. [Google Scholar] [CrossRef] [PubMed]
- Rastegarzadeh, S.; Nahid, P.; Zahra, J. Design of a sensitive membrane optode for iron determination. Instrum. Sci. Technol. 2013, 41, 290–300. [Google Scholar] [CrossRef]
- Pedreno-Sanches, C.; Ortuno, J.A.; Albero, M.I.; Garcia, M.S.; Valero, M.V. Development of a new bulk optode membrane for the determination of mercury(II). Anal. Chim. Acta 2000, 414, 195–203. [Google Scholar] [CrossRef]
- Luke, C.L. New Spectrophomotometric Thiocyanate Determination of Iron In Metals, Alloys, Acids, and Salts. Anal. Chim. Acta 1966, 36, 122–126. [Google Scholar] [CrossRef]
- Pavia, D.L.; Lampman, G.M.; Kriz, G.S.; Vyvyan, J.A. Introduction to Spectroscopy, 4th ed.; Cengange Learning: Washington, DC, USA, 2009. [Google Scholar]
- Nyasulu, F.; Barlag, R. Colorimetric Determination of the Iron(III)-Thiocyanate Reaction Equilibrium Constant with Calibration and Equilibrium Solutions Prepared in a Cuvette by Sequential Additions of One Reagent to the Other. J. Chem. Edu. 2011, 88, 313–314. [Google Scholar] [CrossRef]
- Lestari, I.; Afrida, A.; Sanova, A. Sintesis dan karakterisasi senyawa kompleks logam kadmium(II) dengan ligan kufperon. J. Penelit. Univ. Jambi Seri Sains 2014, 16, 1–8. [Google Scholar]
- Kong, F.; Ni, Y. Determination of Cr(VI) concentration in diluted samples based on the paper test strip method. Water Sci. Technol. 2009, 60, 1088–1097. [Google Scholar] [CrossRef] [PubMed]
- Regulation the Minister of Health of the Republic of Indonesia. Regulation of the Minister of Health of the Republic of Indonesia Number 492 of 2010 Concerning Requirements for Drinking Water Quality; Minister of Health of the Republic of Indonesia: Jakarta, Indonesia, 2010.
- Association of Official Analytical Chemist. Official Method of Analysis of AOAC International, 20th ed.; AOAC Pr: Washington, DC, USA, 2013. [Google Scholar]
- Bakker, E.; Simon, W. Selectivity of ion-sensitive bulk optodes. Anal Chem. 1992, 64, 1805–1812. [Google Scholar] [CrossRef]
- Muirhead, K.A.; Haight, G.P. Kinetics and mechanism of the oxidation of thiocyanate ion by chromium(VI). Inorg. Chem. 1973, 12, 1116–1120. [Google Scholar] [CrossRef]
- Nashukha, H.L.; Sulistyarti, H.; Sabarudin, A. Uji linieritas, selektivitas, dan validitas metode analisis merkuri(ii) secara spektrofotometri berdasarkan penurunan absorbansi kompleks besi(iii) tiosianat. Kim. Stud. J. 2014, 2, 492–498. [Google Scholar]
- Suah, F.B.M.; Ahmad, M.; Heng, L.Y. A novel polymer inclusion membranes based optode for sensitive determination of Al3+ ions. Spectrochim. Acta Part A Mol. Biomol. Spectrosc. 2015, 144, 81–87. [Google Scholar] [CrossRef] [PubMed]
Figure 2.
Surface morphology of CTA optode membrane at magnification (a) 5000×, (b) 20,000×, and (c) 30,000×.
Figure 2.
Surface morphology of CTA optode membrane at magnification (a) 5000×, (b) 20,000×, and (c) 30,000×.

Figure 3.
FTIR spectra of optode membrane characterization (a) CTA only, (b) CTA + SCN, and (c) CTA + SCN + Fe(III).
Figure 3.
FTIR spectra of optode membrane characterization (a) CTA only, (b) CTA + SCN, and (c) CTA + SCN + Fe(III).

Figure 4.
Absorbance curve of pH variation in Fe(III) standard solution ![Chemistry 06 00005 i001]() pH 1,
pH 1, ![Chemistry 06 00005 i002]() pH 2,
pH 2, ![Chemistry 06 00005 i003]() pH 3,
pH 3, ![Chemistry 06 00005 i004]() pH 4.
pH 4.
 pH 1,
pH 1,  pH 2,
pH 2,  pH 3,
pH 3,  pH 4.
pH 4.
Figure 5.
Absorbance graph for contact time variation of optode and standard solution Fe(III).


Table 1.
The absorbance of NH4SCN optimization in CTA optode membrane.
| Standard Concentration of Fe(III) (mg/L) | Concentration NH4SCN (M) | Corrected Absorbance |
|---|---|---|
| 12 | 0.1 | −0.0085 |
| 0.5 | 0.5950 | |
| 1 | 0.7324 |
Table 2.
Optode membrane thickness measurement data.
| Membrane | Repetition | Thickness | Average | ||
|---|---|---|---|---|---|
| Inch | mm | Inch | mm | ||
| 1 | 1 | 0.0017 | 0.043 | 0.0017 | 0.042 |
| 2 | 0.0016 | 0.041 | |||
| 3 | 0.0017 | 0.043 | |||
| 4 | 0.0016 | 0.041 | |||
| 5 | 0.0017 | 0.043 | |||
| 2 | 1 | 0.0018 | 0.046 | 0.0018 | 0.046 |
| 2 | 0.0018 | 0.046 | |||
| 3 | 0.0019 | 0.048 | |||
| 4 | 0.0017 | 0.043 | |||
| 5 | 0.0018 | 0.046 | |||
| 3 | 1 | 0.0017 | 0.043 | 0.0017 | 0.044 |
| 2 | 0.0017 | 0.043 | |||
| 3 | 0.0016 | 0.041 | |||
| 4 | 0.0018 | 0.046 | |||
| 5 | 0.0018 | 0.046 | |||
| Average | 0.0017 | 0.044 | |||
| SD | 7.02 × 10⁻⁵ | 1.78 × 10⁻³ | |||
| %RSD | 4.07 | 4.07 | |||
Table 3.
Comparison of research wavenumber with the literature.
| Wavenumber (cm−1) | Wavenumber (cm−1) [17] | |
|---|---|---|
| C−O stretching | 1055 | 1300–1000 |
| 1245 | ||
| C=O streching | 1735 | 1750–1730 |
| S−CN streching | 2061 | 2200–2000 |
| C−H streching | 2935 | 3000–2850 |
Table 4.
Determination limit of detection and quantitation in the working range of Fe(III) concentration 0.1–4 mg/L.
Table 4.
Determination limit of detection and quantitation in the working range of Fe(III) concentration 0.1–4 mg/L.
| Repetition | Slope | Intercept |
|---|---|---|
| 1 | 0.2966 | 0.1088 |
| 2 | 0.2983 | 0.1116 |
| 3 | 0.2950 | 0.1061 |
| Average | 0.2966 | 0.1088 |
| SDi | 0.0022 | |
| LoD | 0.0250 | |
| LoQ | 0.0757 |
Table 5.
Determination of CTA optode membrane precision in Fe(III) standard solution.
| Repetition | Corrected Absorbance |
|---|---|
| 1 | 0.7064 |
| 2 | 0.7480 |
| 3 | 0.7691 |
| 4 | 0.7186 |
| 5 | 0.7111 |
| 6 | 0.7380 |
| Average | 0.7319 |
| SD | 0.0242 |
| %RSD | 3.31 |
Table 6.
Determination of CTA optode membrane accuracy in Fe(III) standard solution.
| [Fe(III)]standard (mg/L) | Repetition | Corrected Absorbance | [Fe(III)]experiment (mg/L) | %R | Average %R |
|---|---|---|---|---|---|
| 1 | 1 | 0.4044 | 0.9966 | 99.66 | 100.13 112 |
| 2 | 0.4034 | 0.9933 | 99.33 | ||
| 3 | 0.4096 | 1.0142 | 101.42 | ||
| 2 | 1 | 0.7144 | 2.0418 | 102.09 | 102.33 0.56 |
| 2 | 0.7134 | 2.0384 | 101.92 | ||
| 3 | 0.7196 | 2.0593 | 102.97 | ||
| 4 | 1 | 1.1948 | 3.6615 | 91.54 | 99.01 6.61 |
| 2 | 1.3122 | 4.0573 | 101.43 | ||
| 3 | 1.3435 | 4.1628 | 104.07 |
Table 7.
Selectivity data of CTA optode membrane in the presence of interference Pb(III) and Cr(VI).
Table 7.
Selectivity data of CTA optode membrane in the presence of interference Pb(III) and Cr(VI).
| Ion Standard Solution | Corrected Absorbance | KA | KI | KA,I | |||
|---|---|---|---|---|---|---|---|
| U1 | U2 | U3 | Average | ||||
| Fe(III) | 0.6980 | 0.7605 | 0.7644 | 0.7410 | 0.3705 | ||
| Fe(III) + Cr(VI) | 0.5572 | 0.4704 | 0.3961 | 0.4746 | −0.1332 | −0.3595 | |
| Fe(III) + Pb(II) | 0.3468 | 0.3560 | 0.4680 | 0.3903 | −0.1754 | −0.4733 | |
Table 8.
Stability colour complex data for CTA optode membrane in 10 days.
| Day | Corrected Absorbance | Average | Decreased of Absorbance | % Decreased Colour Stability | ||
|---|---|---|---|---|---|---|
| U1 | U2 | U3 | ||||
| 0 | 0.7812 | 0.5368 | 0.7388 | 0.6856 | - | - |
| 1 | 0.7219 | 0.4999 | 0.6639 | 0.6286 | 0.0570 | 8.32 |
| 2 | 0.7695 | 0.5134 | 0.7635 | 0.6821 | 0.0035 | 0.51 |
| 3 | 0.7599 | 0.5239 | 0.7399 | 0.6746 | 0.0110 | 1.61 |
| 6 | 0.7699 | 0.6110 | 0.6751 | 0.6853 | 0.0003 | 0.04 |
| 7 | 0.6859 | 0.5781 | 0.6961 | 0.6534 | 0.0322 | 4.70 |
| 8 | 0.6645 | 0.6081 | 0.6553 | 0.6426 | 0.0430 | 6.27 |
| 9 | 0.6989 | 0.5949 | 0.7302 | 0.6747 | 0.0109 | 1.59 |
| 10 | 0.6951 | 0.5995 | 0.7514 | 0.6820 | 0.0036 | 0.53 |
| Average | 0.6677 | |||||
| SD | 0.0209 | |||||
| %RSD | 3.14 | |||||
Table 9.
Measurement data of Fe(III) levels in sample solution using CTA optode membrane and UV-Vis.
Table 9.
Measurement data of Fe(III) levels in sample solution using CTA optode membrane and UV-Vis.
| Sample Solution | Corrected Absorbance | [Fe(III)]optode (mg/L) | [Fe(III)]UV-Vis (mg/L) |
|---|---|---|---|
| U1 | 0.1523 | 0.2449 | 0.2499 |
| U2 | 0.1534 | 0.2511 | 0.2555 |
| U3 | 0.1561 | 0.2663 | 0.2550 |
| Average | 0.2541 | 0.2535 | |
| SD | 0.0110 | 0.0030 |
Table 10.
Determination of precision CTA optode membrane in Fe(III) sample solution.
| Repetition | Corrected Absorbance |
|---|---|
| 1 | 0.1380 |
| 2 | 0.1315 |
| 3 | 0.1399 |
| 4 | 0.1378 |
| 5 | 0.1387 |
| 6 | 0.1447 |
| Average | 0.1384 |
| SD | 0.0042 |
| %RSD | 3.07 |
Table 11.
Determination of accuracy CTA optode membrane in Fe(III) sample solution.
| Solution (mg/L) | Corrected Absorbance | [Fe(III)]obtained (mg/L) | %R | Average %R |
|---|---|---|---|---|
| Sample U1 | 0.1506 | 0.1409 | - | - |
| Sample U2 | 0.1513 | 0.1433 | ||
| Sample U3 | 0.1527 | 0.1480 | ||
| Sample + 1 | 0.4299 | 1.0826 | 93.73 | 106.25 13.39 |
| Sample + 1 | 0.4624 | 1.1922 | 104.67 | |
| Sample + 1 | 0.5090 | 1.3493 | 120.36 | |
| Sample + 2 | 0.7689 | 2.2256 | 101.71 | 105.10 4.22 |
| Sample + 2 | 0.7813 | 2.2674 | 103.75 | |
| Sample + 2 | 0.8182 | 2.3918 | 109.83 | |
| Sample + 4 | 1.0388 | 3.1355 | 75.53 | 75.58 0.21 |
| Sample + 4 | 1.0421 | 3.1467 | 75.81 | |
| Sample + 4 | 1.0373 | 3.1305 | 75.40 |
Disclaimer/Publisher’s Note: The statements, opinions and data contained in all publications are solely those of the individual author(s) and contributor(s) and not of MDPI and/or the editor(s). MDPI and/or the editor(s) disclaim responsibility for any injury to people or property resulting from any ideas, methods, instructions or products referred to in the content. |
© 2023 by the authors. Licensee MDPI, Basel, Switzerland. This article is an open access article distributed under the terms and conditions of the Creative Commons Attribution (CC BY) license (https://creativecommons.org/licenses/by/4.0/).
Share and Cite
MDPI and ACS Style
Arif, Z.; Sugiarti, S.; Rohaeti, E.; Batubara, I. A Sensor (Optode) Based on Cellulose Triacetate Membrane for Fe(III) Detection in Water Samples. Chemistry 2024, 6, 81-94. https://doi.org/10.3390/chemistry6010005
AMA Style
Arif Z, Sugiarti S, Rohaeti E, Batubara I. A Sensor (Optode) Based on Cellulose Triacetate Membrane for Fe(III) Detection in Water Samples. Chemistry. 2024; 6(1):81-94. https://doi.org/10.3390/chemistry6010005
Chicago/Turabian StyleArif, Zulhan, Sri Sugiarti, Eti Rohaeti, and Irmanida Batubara. 2024. "A Sensor (Optode) Based on Cellulose Triacetate Membrane for Fe(III) Detection in Water Samples" Chemistry 6, no. 1: 81-94. https://doi.org/10.3390/chemistry6010005