

Catalytic Performances of Co/TiO2 Catalysts in the Oxidative Dehydrogenation of Ethane to Ethylene: Effect of CoTiO3 and Co2TiO4 Phase Formation
 , , , and
Abstract
:1. Introduction
2. Materials and Methods
2.1. Chemical Products
2.2. Preparation of Catalysts
2.3. Characterization Techniques
2.4. Catalytic Tests
3. Results and Discussion
3.1. Characterization
3.2. Catalytic Results and Discussion
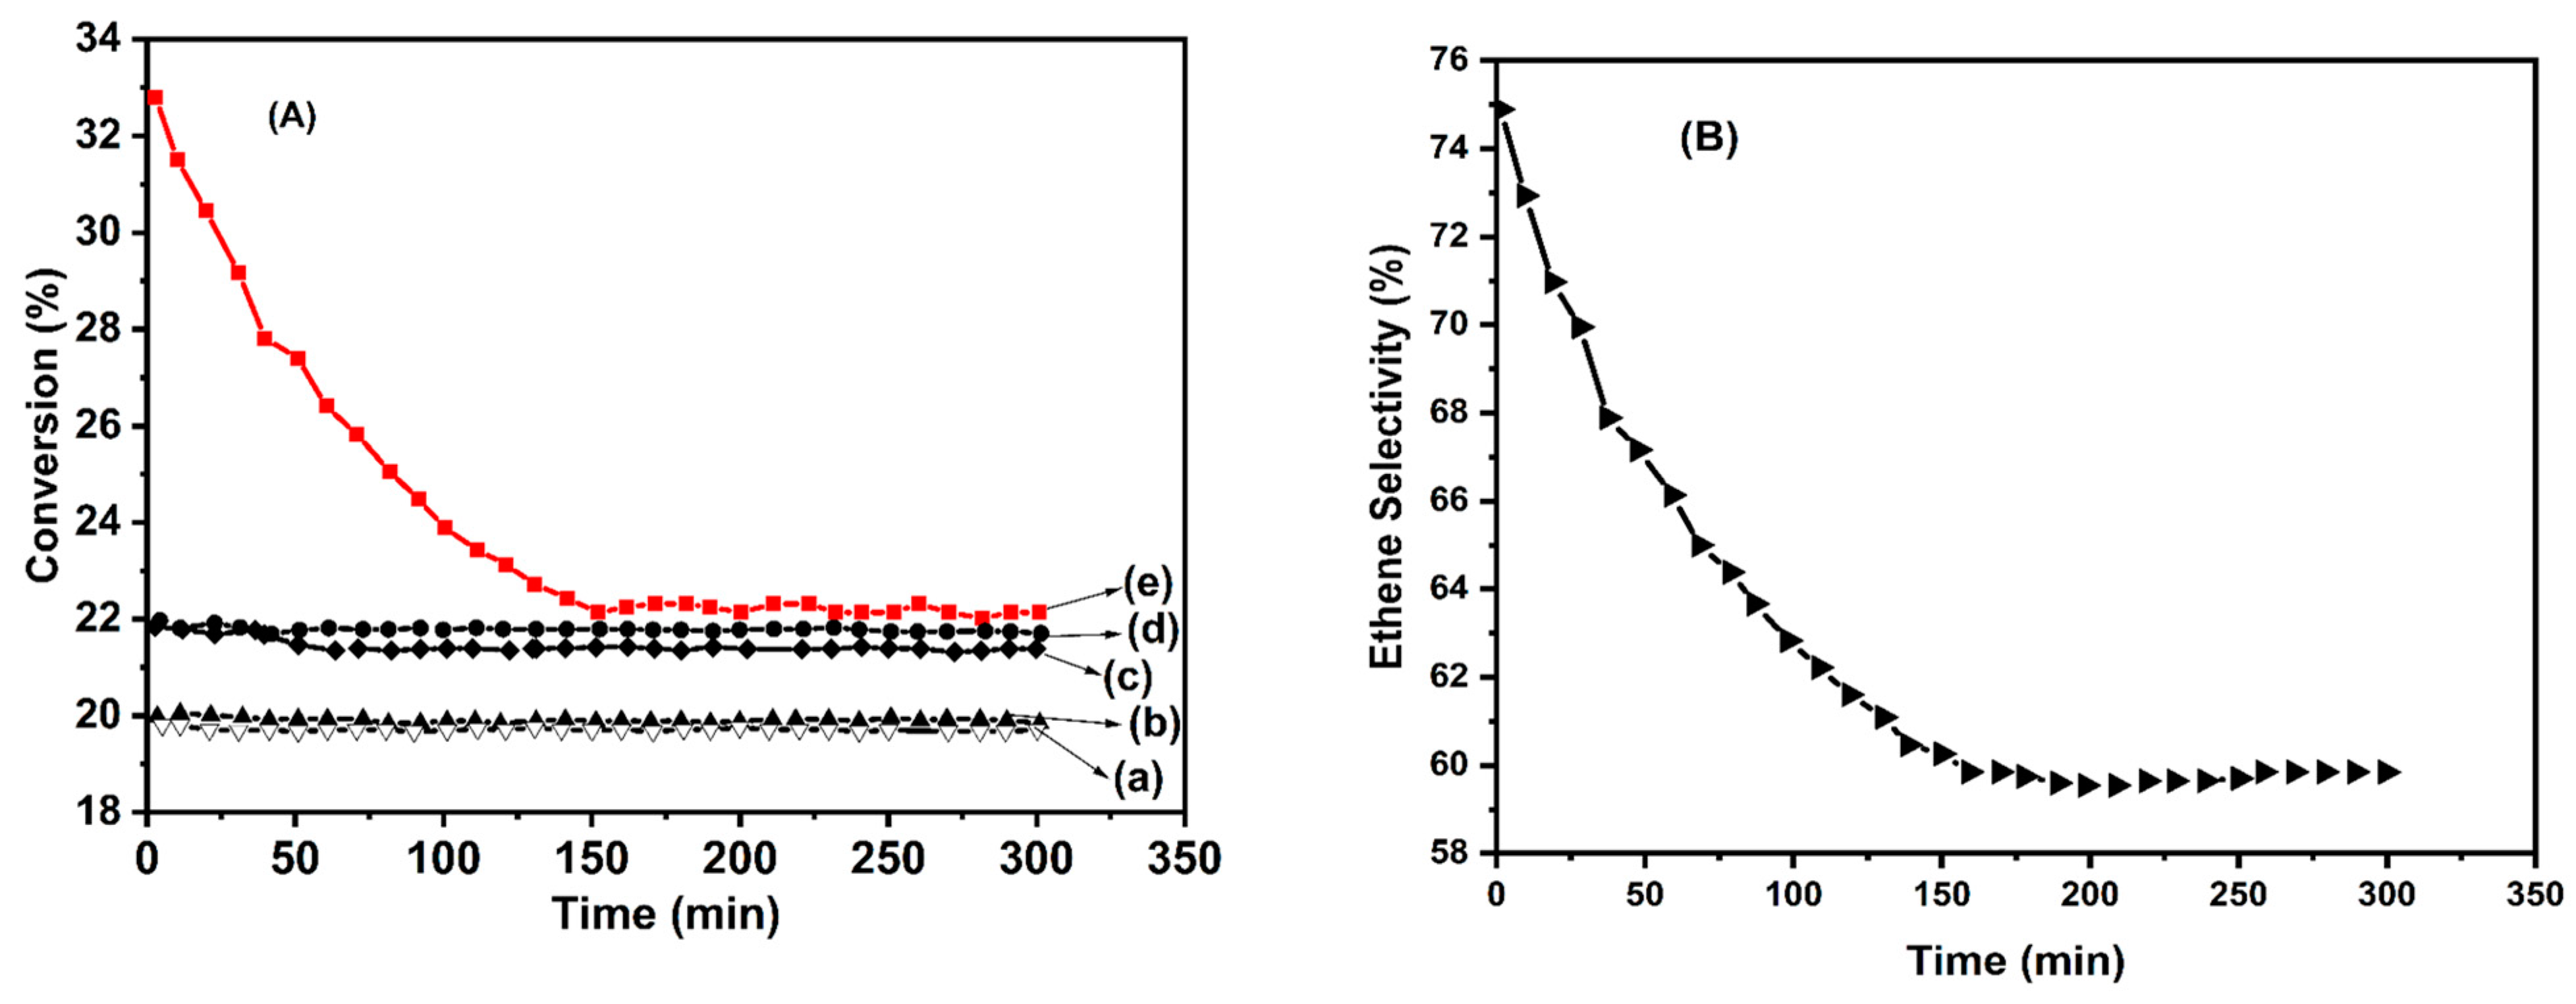
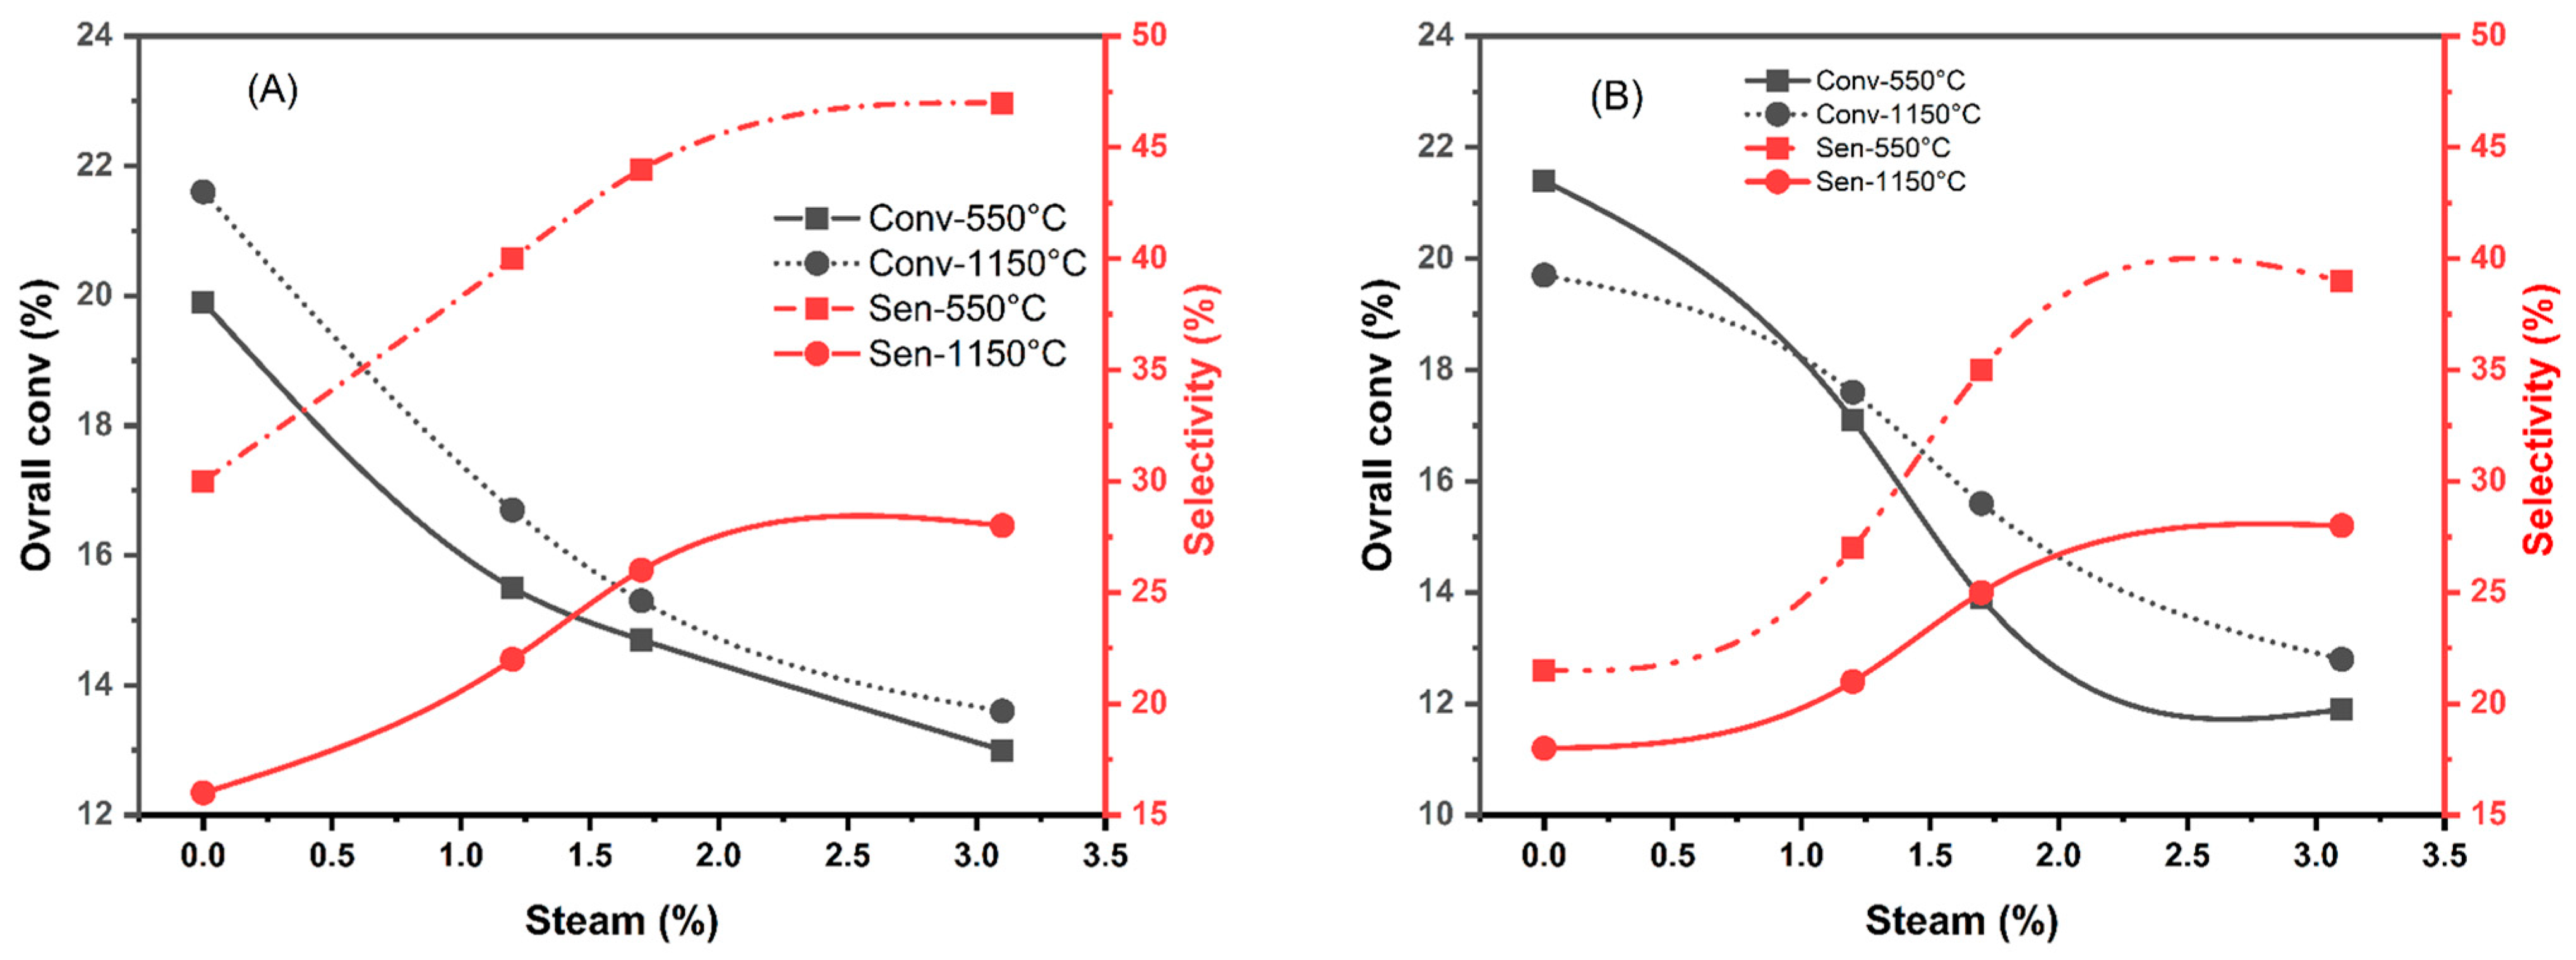
- The evolution of overall conversion (Figure 10) shows that these materials are stable over time regardless of their calcination temperature. At 550 °C, the overall conversion of ethane is on the same order of magnitude as that measured with the Co(7.5)/TiO2 sample (αg = 22.2%).
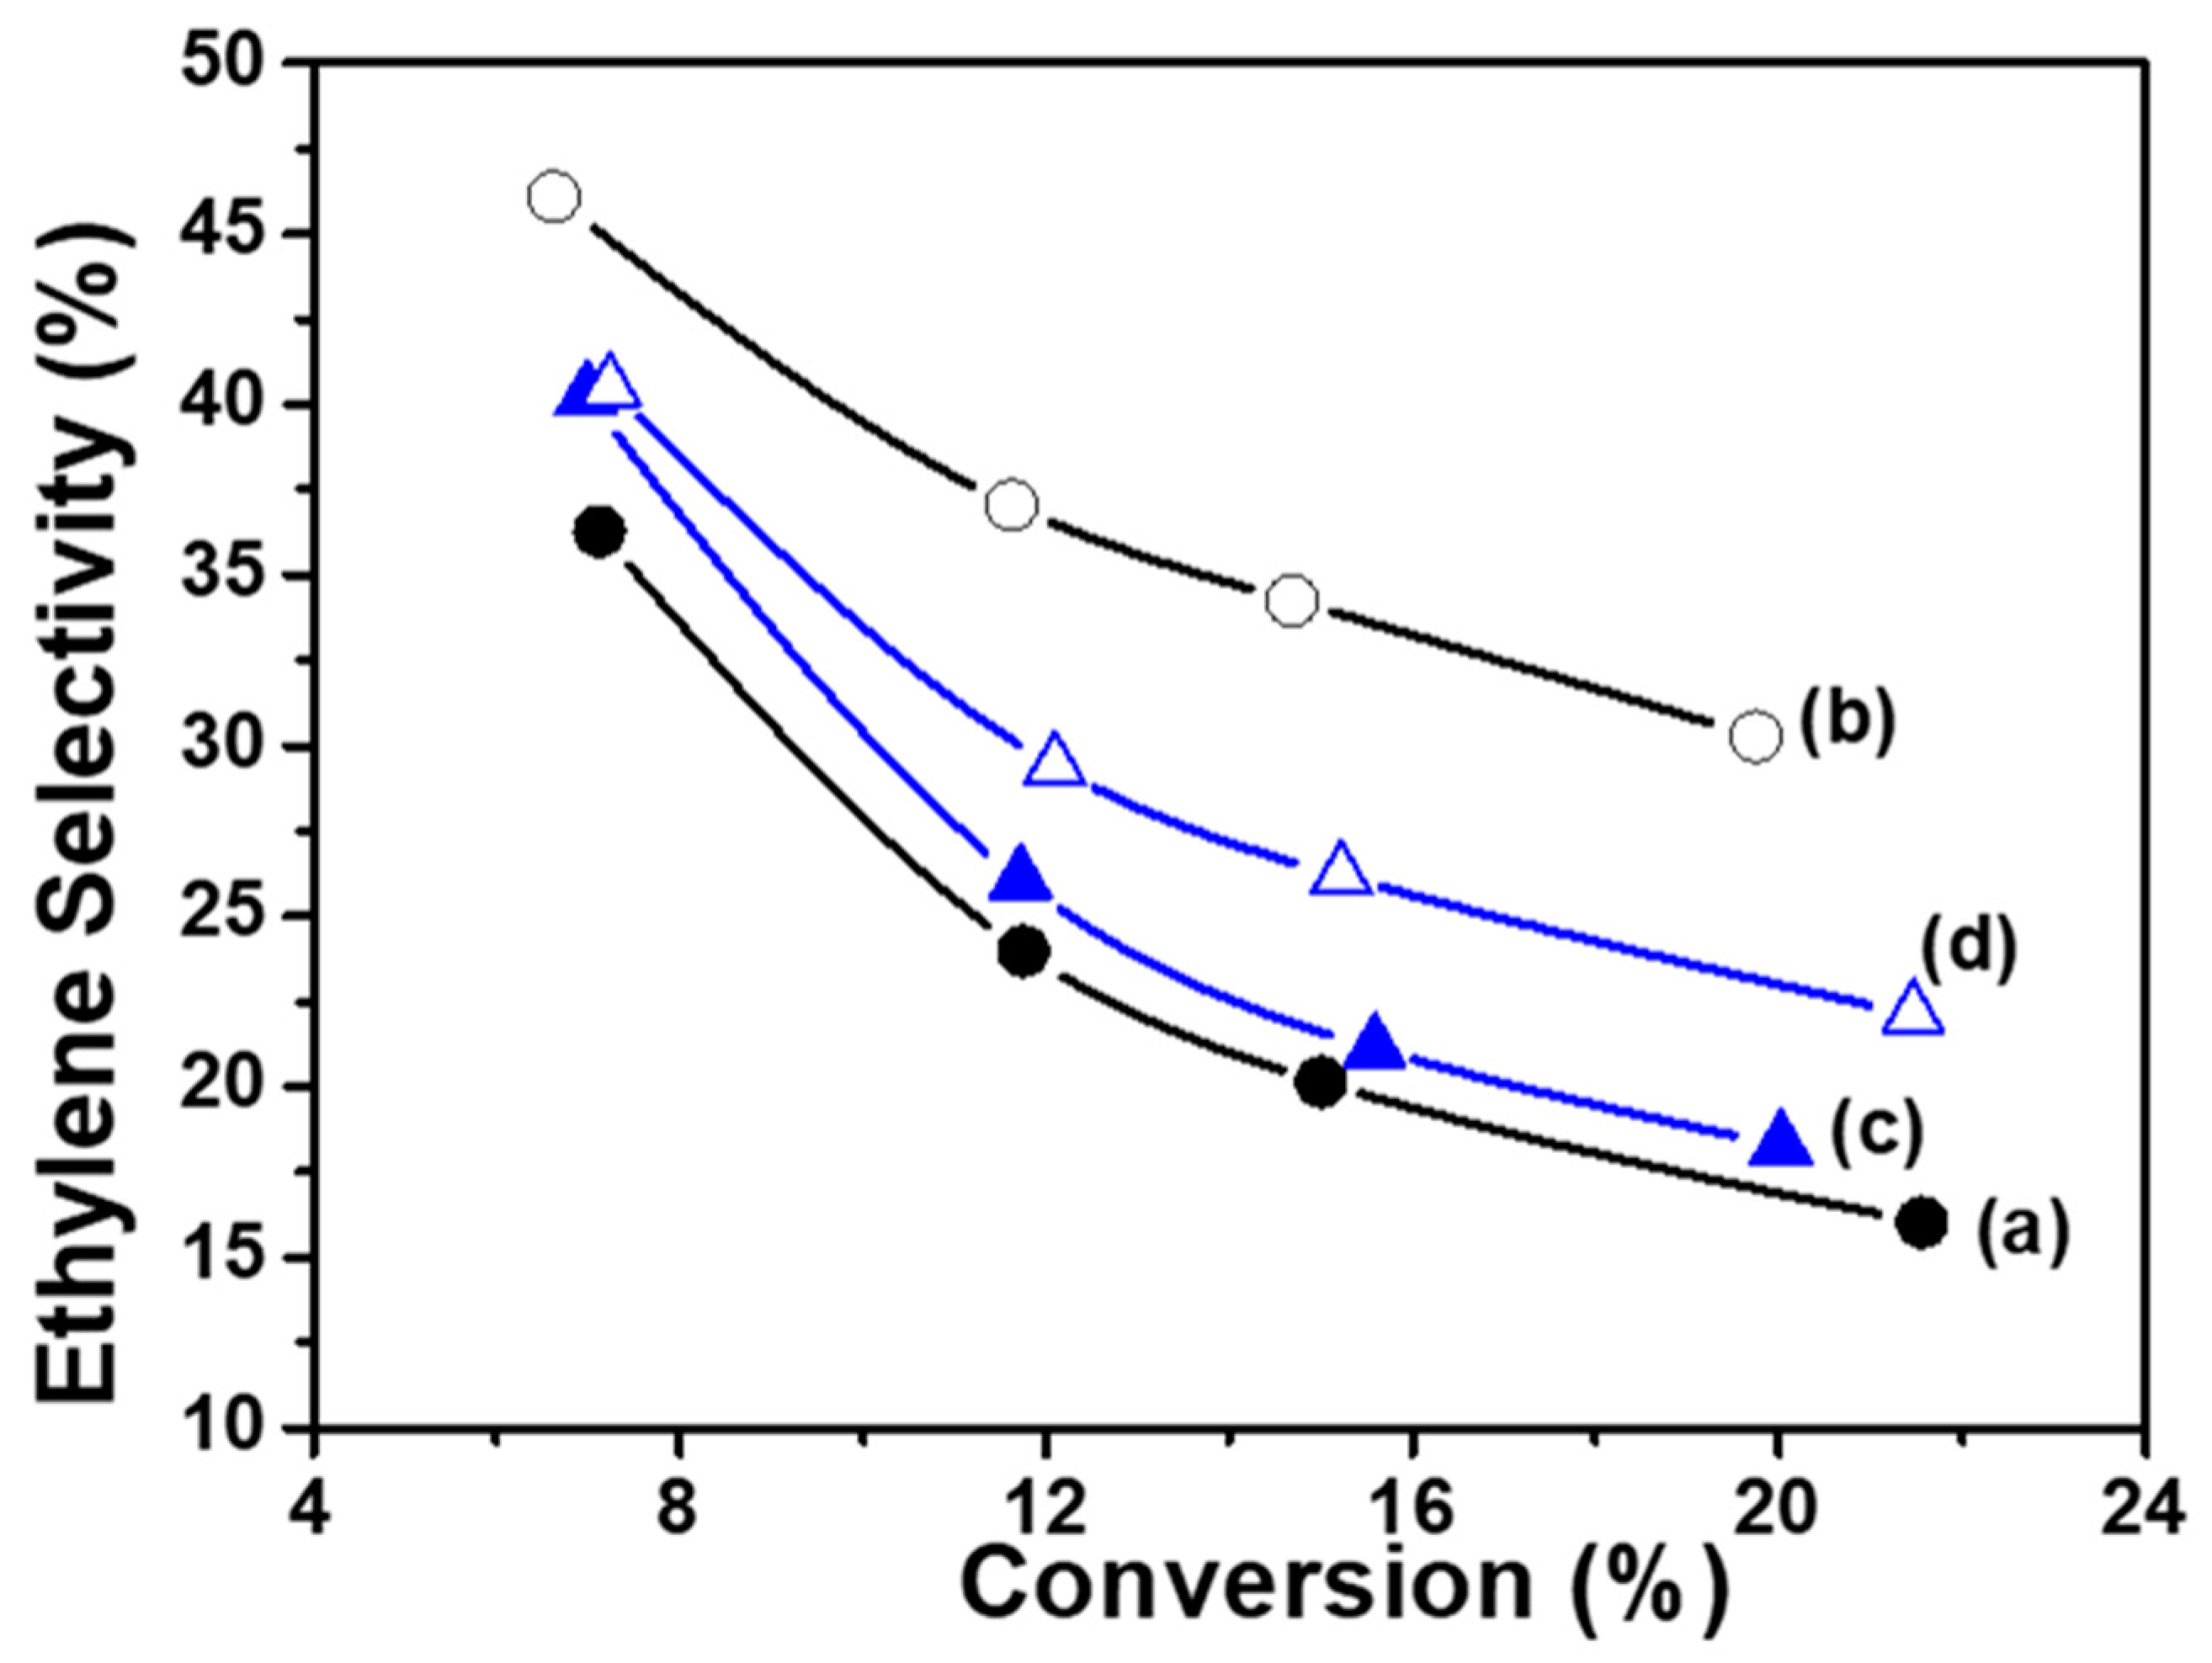
- For the calcination temperature of 550 °C, selectivity towards ethylene (Table 3) was slightly higher in the case of CoTiO3 in comparison with Co2TiO4, while the superior behavior of the Co(7.5)/TiO2 sample was confirmed.
- No significant modification of catalytic activity was observed after calcination at 1150 °C, but the production of COx became higher, while selectivity to ethylene dropped down.
4. Conclusions
Author Contributions
Funding
Data Availability Statement
Conflicts of Interest
References
- Blay, V.; Epelde, E.; Miravalles, R.; Perea, L.A. Converting olefins to propene: Ethene to propene and olefin cracking. Catal. Rev. 2018, 60, 278–335. [Google Scholar] [CrossRef]
- Cnudde, P.; De Wispelaere, K.; Vanduyfhuys, L.; Demuynck, R.; Van der Mynsbrugge, J.; Waroquier, M.; Van Speybroeck, V. How Chain Length and Branching Influence the Alkene Cracking Reactivity on H-ZSM-5. ACS Catal. 2018, 8, 9579–9595. [Google Scholar] [CrossRef] [PubMed]
- Gholami, Z.; Gholami, F.; Tišler, Z.; Tomas, M.; Vakili, M. A Review on Production of Light Olefins via Fluid Catalytic Cracking. Energies 2021, 14, 1089. [Google Scholar] [CrossRef]
- Usman, A.; Siddiqui, M.A.B.; Hussain, A.; Aitani, A.; Al-Khattaf, S. Catalytic cracking of crude oil to light olefins and naphtha: Experimental and kinetic modeling. Chem. Eng. Res. Des. 2017, 120, 121–137. [Google Scholar] [CrossRef]
- Sun, M.; Zhang, J.; Putaj, P.; Caps, V.; Lefebvre, F.; Pelletier, J.; Basset, J.-M. Catalytic Oxidation of Light Alkanes (C1–C4) by Heteropoly Compounds. Chem. Rev. 2014, 114, 981–1019. [Google Scholar] [CrossRef]
- Owusu, P.A.; Asumadu-Sarkodie, S. A review of renewable energy sources, sustainability issues and climate change mitigation. Cogent Eng. 2016, 3, 1167990. [Google Scholar] [CrossRef]
- Wu, X.; Tian, Z.; Guo, J. A review of the theoretical research and practical progress of carbon neutrality. Sustain. Oper. Comput. 2022, 3, 54–66. [Google Scholar] [CrossRef]
- Sattler, J.J.H.B.; Ruiz-Martinez, J.; Santillan-Jimenez, E.; Weckhuysen, B.M. Catalytic Dehydrogenation of Light Alkanes on Metals and Metal Oxides. Chem. Rev. 2014, 114, 10613–10653. [Google Scholar] [CrossRef]
- Monai, M.; Gambino, M.; Wannakao, S.; Weckhuysen, B.M. Propane to olefins tandem catalysis: A selective route towards light olefins production. Chem. Soc. Rev. 2021, 50, 11503–11529. [Google Scholar] [CrossRef]
- Melnikov, D.P.; Novikov, A.A.; Glotov, A.P.; Reshetina, M.V.; Smirnova, E.M.; Wang, H.Q.; Vinokurov, V.A. Dehydrogenation of Light Alkanes (A Review). Pet. Chem. 2022, 62, 1027–1046. [Google Scholar] [CrossRef]
- Ai-Zegbayer, Y.S.; Ai- Mayman, S.I.; Ai-Smarei, T.A. Oxidative Dehydrogenation of Ethane to Ethylene Over Mo-V-Nb Catalysts: Effect of Calcination Temperature and Type of Support. J. King Saud Univ. Eng. Sci. 2010, 22, 21–27. [Google Scholar] [CrossRef]
- Brik, Y.; Kacimi, M.; Ziyad, M.; Bozon-Verduraz, F. Titania-Supported Cobalt and Cobalt–Phosphorus Catalysts: Characterization and Performances in Ethane Oxidative Dehydrogenation. J. Catal. 2001, 202, 118–128. [Google Scholar] [CrossRef]
- Zhang, Z.; Ding, J.; Chai, R.; Zhao, G.; Liu, Y.; Lu, Y. Oxidative dehydrogenation of ethane to ethylene: A promising CeO2-ZrO2-modified NiO-Al2O3/Ni-foam catalyst. Appl. Catal. A Gen. 2018, 550, 151–159. [Google Scholar] [CrossRef]
- Loukah, M.; Coudurier, G.; Vedrine, J.C.; Ziyad, M. Oxidative dehydrogenation of ethane on V- and Cr-based phosphate catalysts. Microporous Mater. 1995, 4, 345–358. [Google Scholar] [CrossRef]
- El-Drissi, J.; Kacimi, M.; Loukah, M.; Ziyad, M.J.J.C.P. Activité de V2O5/TiO2 modifié par le phosphore dans la réaction de déshydrogénation oxydante de l’éthane en éthylène. J. De Chim. Phys. 1997, 94, 1984–1992. [Google Scholar] [CrossRef]
- El-Idrissi, J.; Kacimi, M.; Bozon-Verduraz, F.; Ziyad, M. Oxidative dehydrogenation of ethane over Cr/TiO2 modified by phosphorus. Catal. Lett. 1998, 56, 221–225. [Google Scholar] [CrossRef]
- Benzaouak, A.; Mahir, H.; El Hamidi, A.; Kacimi, M.; Liotta, L.F. Investigation of Phosphorus Loaded V2O5/ZrO2 Catalysts for the Oxidative Dehydrogenation of Propane (ODH). Catalysts 2022, 12, 811. [Google Scholar] [CrossRef]
- Munirathinam, R.; Pham Minh, D.; Nzihou, A. Effect of the Support and Its Surface Modifications in Cobalt-Based Fischer–Tropsch Synthesis. Ind. Eng. Chem. Res. 2018, 57, 16137–16161. [Google Scholar] [CrossRef]
- Lögdberg, S.; Yang, J.; Lualdi, M.; Walmsley, J.C.; Järås, S.; Boutonnet, M.; Blekkan, E.A.; Rytter, E.; Holmen, A. Further insights into methane and higher hydrocarbons formation over cobalt-based catalysts with γ-Al2O3, α-Al2O3 and TiO2 as support materials. J. Catal. 2017, 352, 515–531. [Google Scholar] [CrossRef]
- Dreyer, M.; Krebs, M.; Najafishirtari, S.; Rabe, A.; Friedel Ortega, K.; Behrens, M. The Effect of Co Incorporation on the CO Oxidation Activity of LaFe1−xCoxO3 Perovskites. Catalysts 2021, 11, 550. [Google Scholar] [CrossRef]
- Dreyer, M.; Rabe, A.; Budiyanto, E.; Friedel Ortega, K.; Najafishirtari, S.; Tüysüz, H.; Behrens, M. Dynamics of Reactive Oxygen Species on Cobalt-Containing Spinel Oxides in Cyclic CO Oxidation. Catalysts 2021, 11, 1312. [Google Scholar] [CrossRef]
- Aaddane, A.; Kacimi, M.; Ziyad, M. Oxidative dehydrogenation of ethane and propane over magnesium-cobalt phosphates CoxMg3-x(PO4)2. Catal. Lett. 2001, 73, 47–53. [Google Scholar] [CrossRef]
- Aaddane, A.; Kacimi, M.; Ziyad, M. Oxidative dehydrogenation of ethane and propane over Ca-Co-P catalysts. J. De Phys. 2005, 123, 151–154. [Google Scholar] [CrossRef]
- Concepción, P.; Blasco, T.; López Nieto, J.M.; Vidal-Moya, A.; Martínez-Arias, A. Preparation, characterization and reactivity of V- and/or Co-containing AlPO-18 materials (VCoAPO-18) in the oxidative dehydrogenation of ethane. Microporous Mesoporous Mater. 2004, 67, 215–227. [Google Scholar] [CrossRef]
- Čapek, L.; Vaněk, L.; Adam, J.; Smoláková, L. Dehydrogenation of ethane over vanadium, cobalt and nickel based catalysts. Stud. Surf. Sci. Catal. 2008, 174, 1175–1178. [Google Scholar] [CrossRef]
- Alifanti, M.; Bueno, G.; Parvulescu, V.; Parvulescu, V.I.; Cortés, V.C. Oxidation of ethane on high specific surface SmCoO3 and PrCoO3 perovskites. Catal. Today 2009, 143, 309–314. [Google Scholar] [CrossRef]
- Tian, X.; Zheng, C.; Li, F.; Zhao, H. Co and Mo Co-doped Fe2O3 for Selective Ethylene Production via Chemical Looping Oxidative Dehydrogenation. ACS Sustain. Chem. Eng. 2021, 9, 8002–8011. [Google Scholar] [CrossRef]
- Xiao, F.; Guo, D.; Zhao, F.; Zhao, Y.; Wang, S.; Ma, X. Catalytic oxidative dehydrogenation of ethane using carbon dioxide as a soft oxidant over Co-HMS catalysts to ethylene. Asia-Pac. J. Chem. Eng. 2022, 17, e2804. [Google Scholar] [CrossRef]
- Povari, S.; Alam, S.; Somannagari, S.; Nakka, L.; Chenna, S. Oxidative Dehydrogenation of Ethane with CO2 over the Fe-Co/Al2O3 Catalyst: Experimental Data Assisted AI Models for Prediction of Ethylene Yield. Ind. Eng. Chem. Res. 2023, 62, 2573–2582. [Google Scholar] [CrossRef]
- Koirala, R.; Safonova, O.V.; Pratsinis, S.E.; Baiker, A. Effect of cobalt loading on structure and catalytic behavior of CoOx/SiO2 in CO2-assisted dehydrogenation of ethane. Appl. Catal. A Gen. 2018, 552, 77–85. [Google Scholar] [CrossRef]
- Brik, Y.; Kacimi, M.; Bozon-Verduraz, F.; Ziyad, M. Characterization and Comparison of the Activity of Boron-Modified Co/TiO2 Catalysts in Butan-2-ol Conversion and Oxidative Dehydrogenation of Ethane. J. Catal. 2002, 211, 470–481. [Google Scholar] [CrossRef]
- Burton, J.J.; Garten, R.L. (Eds.) Advanced Materials in Catalysis; Academic Press: New York, NY, USA, 1977. [Google Scholar]
- Blasse, G. Optical electron transfer between metal ions and its consequences. Complex Chem. 1991, 1991, 153–187. [Google Scholar]
- Verberckmoes, A.A.; Weckhuysen, B.M.; Schoonheydt, R.A. Spectroscopy and coordination chemistry of cobalt in molecular sieves1 Dedicated to Professor Lovat V.C. Rees in recognition and appreciation of his lifelong devotion to zeolite science and his outstanding achievements in this field.1. Microporous Mesoporous Mater. 1998, 22, 165–178. [Google Scholar] [CrossRef] [Green Version]
- Farhadi, S.; Javanmard, M.; Nadri, G. Characterization of Cobalt Oxide Nanoparticles Prepared by the Thermal Decomposition. Acta Chim. Slov. 2016, 63, 335–343. [Google Scholar] [CrossRef]
- Vennari, C.E.; Williams, Q. A high-pressure Raman study of FeTiO3 ilmenite: Fermi resonance as a manifestation of Fe-Ti charge transfer. Phys. Chem. Miner. 2021, 48, 34. [Google Scholar] [CrossRef]
- Wang, P.; Wang, Z.; Yang, Z.; Liu, Z.; Ran, J.; Guo, M. Selective catalytic and kinetic studies on oxydehydrogenation of ethane with CO2 over lanthanide metal catalysts. Comptes Rendus Chim. 2020, 23, 33–46. [Google Scholar] [CrossRef]
- Zeng, T.; Sun, G.; Miao, C.; Yan, G.; Ye, Y.; Yang, W.; Sautet, P. Stabilizing Oxidative Dehydrogenation Active Sites at High Temperature with Steam: ZnFe2O4-Catalyzed Oxidative Dehydrogenation of 1-Butene to 1,3-Butadiene. ACS Catal. 2020, 10, 12888–12897. [Google Scholar] [CrossRef]


| Samples | Co(3.8)/TiO2 | Co(7.5)/TiO2 | Co(15)/TiO2 | CoTiO3 | Co2TiO4 |
|---|---|---|---|---|---|
| SSA values (m2/g) | 65 | 60 | 56 | a 46 | a 45 |
| - | - | - | b 9.4 | b 10 |
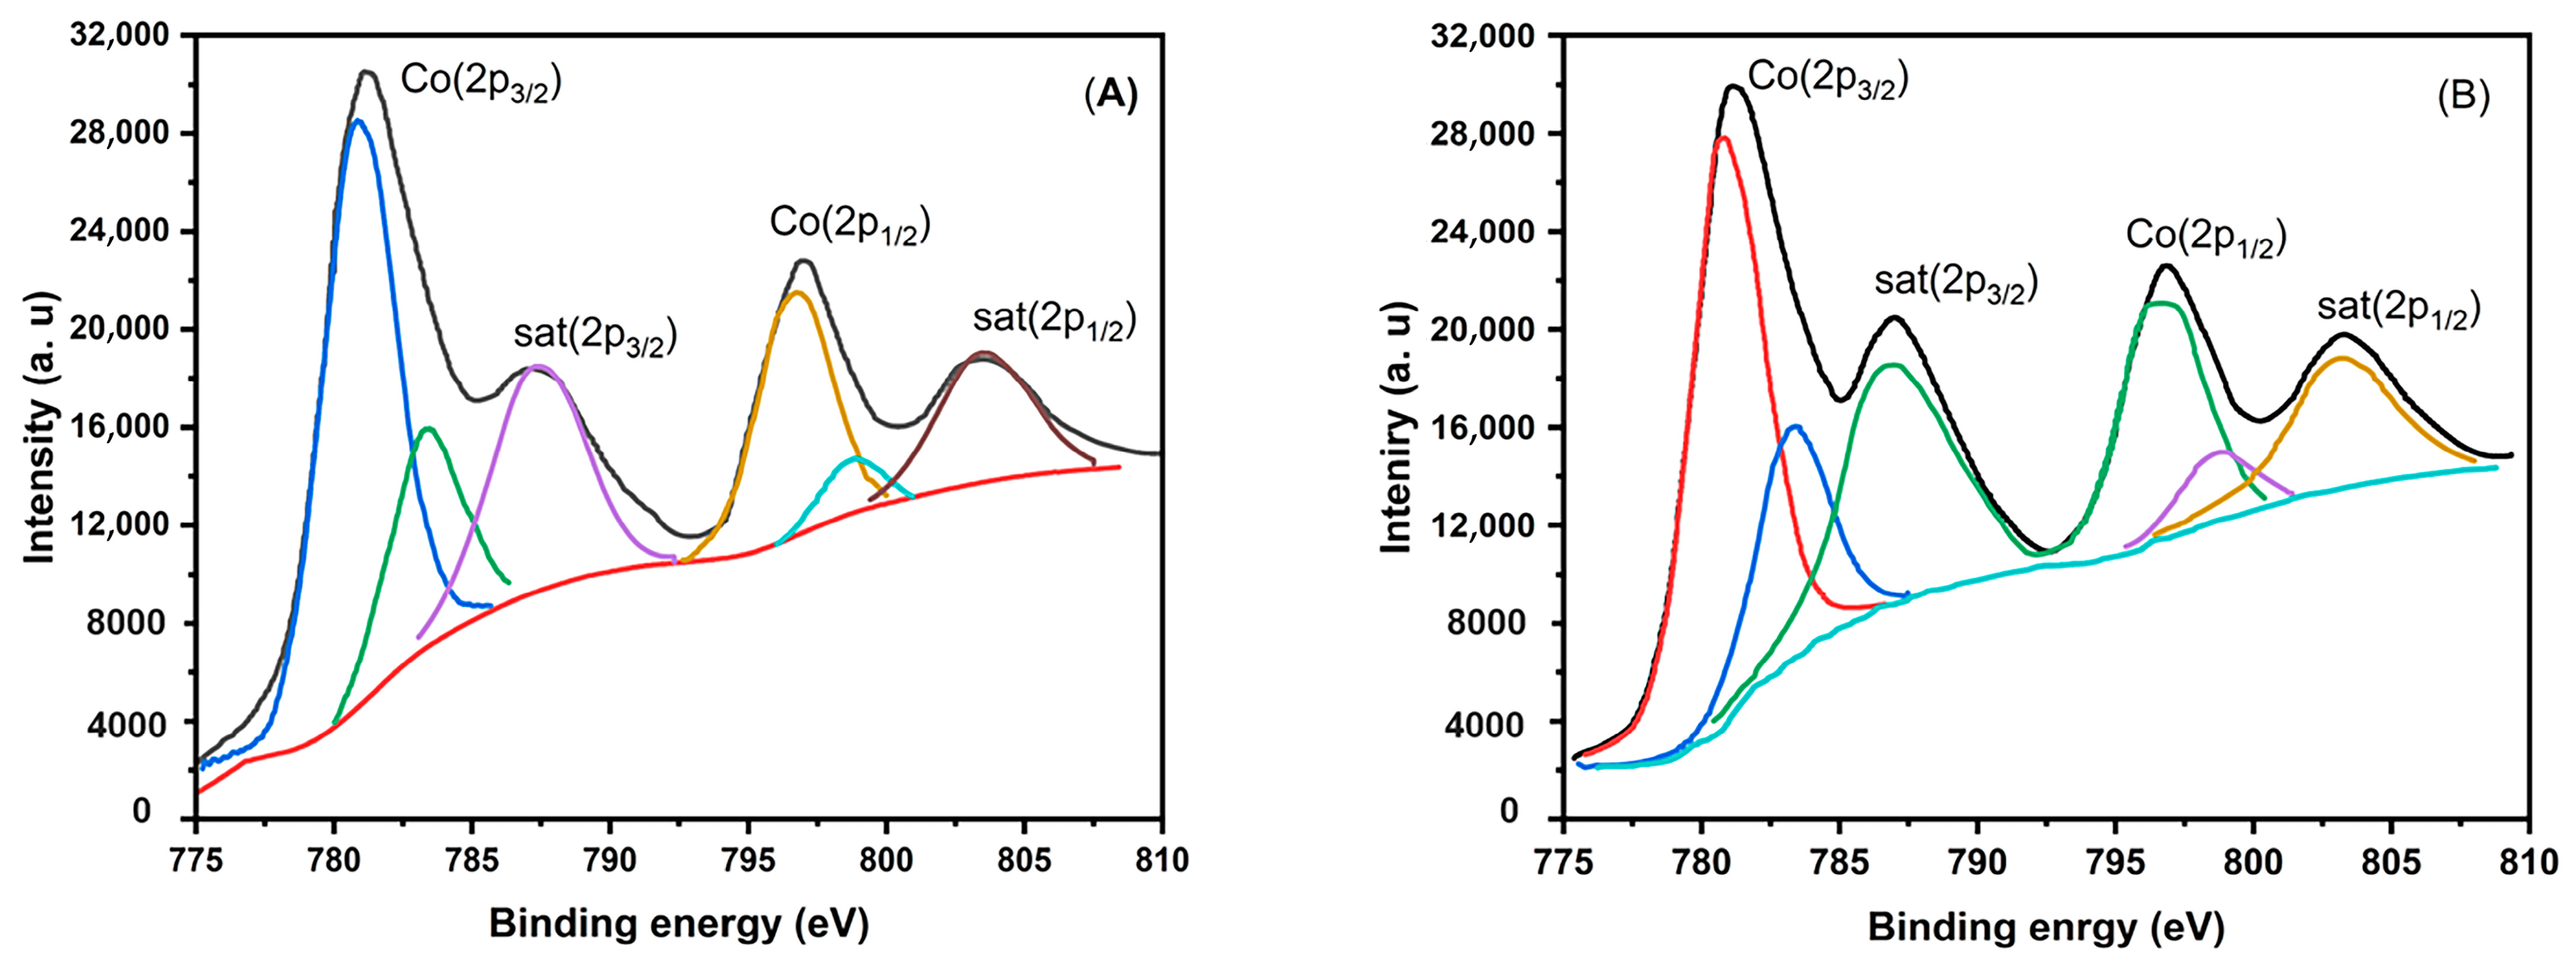
| Samples | Co2p3/2 | ΔE b | |
|---|---|---|---|
| B.E. S/M a Ratio | |||
| Co(3.8)/TiO2 | 781.0 | 0.42 | 15.4 |
| Co(7.5)/TiO2 | 780.2 | 0.27 | 15.2 |
| Co(15)/TiO2 | 779.9 | 0.19 | 15.1 |
| Co2TiO4 | 781 | 0.40 | 15.8 |
| CoTiO3 | 781.2 | 0.47 | 15.9 |
| Co3O4 | 779.9 | 0.18 | 15.1 |
| CoO | 780.4 | 0.4 | 16.0 |
| Samples Calcined at 550 °C | ||||||||
|---|---|---|---|---|---|---|---|---|
| Reaction Temperature | CoTiO3 | Co2TiO4 | ||||||
| αg | αene | Sene | SCOx | αg | αene | Sene | SCOx | |
| 450 °C | 12.9 | 4.1 | 32 | 72 | 13.8 | 3.8 | 28 | 72 |
| 500 °C | 16.8 | 5.2 | 31 | 69 | 16.8 | 4.5 | 27 | 69 |
| 550 °C | 19.9 | 6 | 30 | 70 | 21.4 | 4.6 | 21.5 | 78.5 |
| Activation Energy, Ea (kJ·mol−1) | 21.6 | 21.6 | ||||||
| Samples Calcined at 1150 °C | ||||||||
| Reaction Temperature | CoTiO3 | Co2TiO4 | ||||||
| αg | αene | Sene | SCOx | αg | αene | Sene | SCOx | |
| 450 °C | 13.1 | 2.5 | 19 | 71 | 13.8 | 2.6 | 19 | 81 |
| 500 °C | 17 | 3 | 18 | 72 | 17.7 | 3.3 | 19 | 81 |
| 550 °C | 21.6 | 3.8 | 16 | 84 | 19.7 | 3.8 | 18 | 82 |
| Activation Energy, Ea (kJ·mol−1) | 24.5 | 24.4 | ||||||
| Samples Calcined at 550 °C | ||||||||
|---|---|---|---|---|---|---|---|---|
| Experimental Conditions | CoTiO3 | Co2TiO4 | ||||||
| αg | αene | Sene | SCOx | αg | αene | Sene | SCOx | |
| Dry Mixture | 19.9 | 6 | 30 | 70 | 21.4 | 4.6 | 21.5 | 78.5 |
| 1.2% H2O | 15.5 | 6.2 | 40 | 60 | 17.1 | 4.7 | 27 | 73 |
| 1.7% H2O | 14.7 | 6.5 | 44 | 56 | 13.9 | 4.9 | 35 | 65 |
| 3.1% H2O | 13 | 6.1 | 47 | 53 | 11.9 | 4.6 | 39 | 61 |
| Samples Calcined at 1150 °C | ||||||||
| Experimental Conditions | CoTiO3 | Co2TiO4 | ||||||
| αg | αene | Sene | SCOx | αg | αene | Sene | SCOx | |
| Dry Mixture | 21.6 | 3.8 | 16 | 84 | 19.7 | 3.8 | 18 | 82 |
| 1.2% H2O | 16.7 | 3.7 | 22 | 78 | 17.6 | 3.7 | 21 | 79 |
| 1.7% H2O | 15.3 | 4 | 26 | 74 | 15.6 | 3.9 | 25 | 75 |
| 3.1% H2O | 13.6 | 3.8 | 28 | 72 | 12.8 | 3.6 | 28 | 72 |
Disclaimer/Publisher’s Note: The statements, opinions and data contained in all publications are solely those of the individual author(s) and contributor(s) and not of MDPI and/or the editor(s). MDPI and/or the editor(s) disclaim responsibility for any injury to people or property resulting from any ideas, methods, instructions or products referred to in the content. |
© 2023 by the authors. Licensee MDPI, Basel, Switzerland. This article is an open access article distributed under the terms and conditions of the Creative Commons Attribution (CC BY) license (https://creativecommons.org/licenses/by/4.0/).
Share and Cite
Mahir, H.; Brik, Y.; Benzaouak, A.; La Greca, E.; Consentino, L.; Kacimi, M.; El Hamidi, A.; Liotta, L.F. Catalytic Performances of Co/TiO2 Catalysts in the Oxidative Dehydrogenation of Ethane to Ethylene: Effect of CoTiO3 and Co2TiO4 Phase Formation. Chemistry 2023, 5, 1518-1534. https://doi.org/10.3390/chemistry5030104
Mahir H, Brik Y, Benzaouak A, La Greca E, Consentino L, Kacimi M, El Hamidi A, Liotta LF. Catalytic Performances of Co/TiO2 Catalysts in the Oxidative Dehydrogenation of Ethane to Ethylene: Effect of CoTiO3 and Co2TiO4 Phase Formation. Chemistry. 2023; 5(3):1518-1534. https://doi.org/10.3390/chemistry5030104
Chicago/Turabian StyleMahir, Hanane, Younes Brik, Abdallah Benzaouak, Eleonora La Greca, Luca Consentino, Mohamed Kacimi, Adnane El Hamidi, and Leonarda Francesca Liotta. 2023. "Catalytic Performances of Co/TiO2 Catalysts in the Oxidative Dehydrogenation of Ethane to Ethylene: Effect of CoTiO3 and Co2TiO4 Phase Formation" Chemistry 5, no. 3: 1518-1534. https://doi.org/10.3390/chemistry5030104