
Equilibrium Swelling of Thermo-Responsive Gels in Mixtures of Solvents


Department of Materials and Production, Aalborg University, Fibigerstraede 16, 9220 Aalborg, Denmark
*
Author to whom correspondence should be addressed.
Chemistry 2022, 4(3), 681-700; https://doi.org/10.3390/chemistry4030049
Submission received: 26 June 2022
/
Revised: 7 July 2022
/
Accepted: 11 July 2022
/
Published: 13 July 2022
(This article belongs to the Section Chemistry of Materials)
Abstract
:Thermo-responsive (TR) gels of the LCST (lower critical solution temperature) type swell in water at temperatures below their volume phase transition temperature and collapse above the critical temperature. When water is partially replaced with an organic liquid, these materials demonstrate three different types of equilibrium solvent uptake diagrams at temperatures below, above, in the close vicinity of . A model is developed for equilibrium swelling of TR gels in binary mixtures of solvents. It takes into account three types of phase transitions in TR gels driven by (i) aggregation of hydrophobic side groups into clusters from which solvent molecules are expelled, (ii) replacement of water with cosolvent molecules in cage-like structures surrounding these groups, and (iii) replacement of water with cosolvent as the main element of hydration shells around backbone chains. The model involves a relatively small number of material constants that are found by matching observations on covalently cross-linked poly(N-isopropylacrylamide) macroscopic gels and microgels. Good agreement is demonstrated between the experimental data and results of numerical analysis. Classification is provided of the phase transition points on equilibrium swelling diagrams.

1. Introduction
Hydrogels are three-dimensional networks of polymer chains bridged by chemical and/or physical cross-links. Due to hydrophilicity of chains, gels absorb large amounts of water, but preserve their structural integrity. Thermo-responsive (TR) gels of the LCST (lower critical solution temperature) type swell at temperatures below their volume phase transition temperature (VPTT) and collapse above the critical temperature. These materials found numerical applications in biomedicine, biotechnology and bioelectronics [1,2] due to the similarity of their mechanical and physical properties to those of biological soft tissues.
Partial replacement of water with an organic liquid results in the formation of organohydrogels. They reveal such properties as (i) exceptional stretchability, toughness and self-healing [3], (ii) strong adhesion [4], (iii) anti-freezing and stable mechanical response at sub-zero temperatures [5], (iv) adaptive wettability and resistance to drying and swelling [6], (v) enhanced ionic conductivity [7], and (vi) rapid response to environmental stimuli [8]. Design and preparation of organohydrogels have recently attracted substantial attention being driven by the discoveries of novel areas for their application (low-temperature zinc-organic batteries and capacitors, dynamic interfaces with anti-frosting and anti-icing properties, ice inhibitors for cryopreservation of biosamples, sensors for health monitoring, wearable electronics, human–machine interfaces, etc.) [9,10,11,12]. Other industrial and biomedical applications of binary mixtures of water with organic liquids were discussed in [13,14,15].
An analysis of the equilibrium swelling of thermo-responsive gels in binary mixtures was initiated by Tanaka [16]. Observations on TR gels in mixtures of water with organic liquids were recently reviewed by Dusek and Duskova–Smrckova [17] and Okay [18].
We focus on the swelling of poly(N-isopropylacrylamide) (PNIPAAm) gel, because it is the most studied LCST-type gel that swells in water at temperatures below the critical temperature C, collapses above , and demonstrates good mechanical properties below and above their volume phase transition temperature [19].
When swelling tests are conducted on PNIPAAm gels in mixtures of water with ethanol, methanol, propanol, dioxane, dimethyl sulfoxide, and dimethylformamide at temperatures below , the equilibrium degree of swelling Q decays with , reaches its minimum at some critical value , and grows at [20] (Figure 1). The non-monotonic dependence observed in isothermal swelling tests (a decrease in solubility of a polymer network in a mixture of solvents relative to its solubility in either of the individual solvents) is referred to as the re-entrant phase transition [21,22] or cononsolvency [23,24].
The cononsolvency phenomenon was discovered in swelling tests on ionized PNIPAAm gels in water/dimethyl sulfoxide [21] and non-ionized PNIPAAm gels in water/methanol [22] mixtures. Equilibrium swelling curves with similar shapes were observed in experiments at room temperature on PNIPAAm gels and microgels in water/methanol mixtures [20,25,26,27,28,29,30,31], water/ethanol mixtures [26,30,32,33,34,35], water/propanol mixtures [26,33], water/dioxane mixtures [36,37], water/-dimethylformamide (DMF) mixtures [38,39,40], water/dimethyl sulfoxide (DMSO) mixtures [21,22,41], and aqueous solutions of short PEG chains [42]. Various types of equilibrium swelling curves on TR macroscopic gels and microgels in binary mixtures of solvents have recently been discussed by Scherzinger et al. [43], Kojima [44], and Mukherji et al. [45,46].
Although the cononsolvency phenomenon in TR polymers and gels has attracted noticeable attention in the past forty years, there is no general consensus regarding its physical mechanisms [47]. Preferential adsorption of solvent molecules to polymer chains [48] and competition between them for complexation with hydrophilic segments are conventionally presumed to be the driving force for the collapse of TR gels in mixtures of solvents [49,50,51]. Recent studies reveal, however, that this mechanism is not universal and other types of interactions between segments of chains and solvent molecules are to be taken into account [52,53]. It is worth mentioning among them van der Waals interactions [47], attractive polymer–solvent interactions [54], steric (excluded volume) interactions [55], mutual association of solvent molecules into clusters bridged by hydrogen bonds [56], non-additive solvation phenomena [57], and length-scale effects [58].
A number of models have been developed for the equilibrium and transient swelling of hydrogels in mixtures of solvents. A detailed discussion of mathematical models for the cononsolvency phenomenon is provided in recent reviews [18,46,59]. The models demonstrate good agreement with experimental swelling diagrams on TR gels under isothermal conditions [29,50,60]. Their shortcoming is that the governing equations (i) involve rather a large number of adjustable parameters, (ii) do not allow the volume phase transition points to be determined explicitly, and (iii) fail to predict the solvent uptake by TR gels at arbitrary temperatures. In particular, they cannot explain evolution of the equilibrium swelling curves with the temperature observed in Figure 2.
The objective of this work is threefold: (i) to develop a model with a reasonably small number of material constants for the equilibrium swelling of non-ionic TR gels in binary mixtures of solvents (when the volume fraction of cosolvent changes in the entire interval from 0 to 1), (ii) to determine adjustable parameters by fitting experimental data on PNIPAAm macroscopic gels and microgels, and (iii) to examine how the shapes of equilibrium swelling diagrams and the locations of the phase transition points on these curves are affected by temperature T.
The novelty of this study consists in the following:
(I) Three types of volume phase transitions are distinguished in LCST-type TR gels immersed in mixtures of solvents. Type-I transitions are driven by aggregation of hydrophobic side groups into clusters from which solvent molecules are expelled. Type-II transitions are induced by replacement of water with cosolvent molecules in cage-like structures surrounding hydrophobic side groups. Type-III transitions are associated with replacement of water with cosolvent molecules as the main element of hydration shells around backbone chains. Multiple types of phase transitions in PNIPAAm gels in mixtures of solvents were mentioned in [30,61,62].
(II) It is demontrated that under isothermal swelling of a TR gel in a binary mixture, the number of phase transition points in the interval depends on temperature T. PNIPAAm gels demonstrate (i) one volume phase transition of type-II when T is far below the volume phase transition temperature , (ii) three volume phase transition points when , but the difference is small, and (iii) one volume phase transition of type-I at . The presence of several phase transition points on equilibrium swelling diagrams was confirmed experimentally in [22,63].
2. Materials
We study experimental data in equilibrium swelling tests on poly(N-isopropylacrylamide) (PNIPAAm) macroscopic gels and microgels in binary mixtures of water with methanol [20,25,28,30], ethanol [30], dioxane [36,37], dimethyl formamide (DMF) [40], dimethyl sulfoxide (DMSO) [42], and in aqueous solutions of poly(ethylene glycol) [41]. The addition of these organic liquids to water induces depression of its freezing point, which implies that PNIPAAm organohydrogels can be applied in a wide interval of sub-zero temperatures [64]. Preparation of the gels and experimental conditions are described in detail in the Supplementary Material.
3. Methods
To characterize equilibrium swelling diagrams on TR gels in binary mixtures and to evaluate the influence of temperature T and volume fraction of cosolvent on their response, a constitutive model is developed.
A detailed derivation of the model for equilibrium swelling of TR gels in water is provided in Section 3.1. An extension of the model for the analysis of solvent uptake by TR gels in binary mixtures is discussed in Section 3.2.
3.1. Swelling of TR Gels in Water
A covalently cross-linked TR gel is thought of as a two-phase medium composed of a solid (polymer network) and fluid (water molecules) constituents. The solid and fluid phases are treated as immiscible (mass exchange between the phases is disregarded) interpenetrating continua (any elementary volume contains both phases).
The initial state of a gel coincides with that of an undeformed dry specimen. Transformation of the initial state into the actual state is described by the deformation gradient . Adopting the affine hypothesis, we suppose that the deformation gradient for the polymer network coincides with the deformation gradient for macro-deformation of the gel. The molecular incompressibility condition is accepted in the form [65]
where det stands for the determinant of a tensor. The degree of swelling Q is given by
where C denotes the concentration of water (number of water molecules in the actual state per unit volume in the initial state), and v is the characteristic volume of a molecule. Equation (1) means that the volume deformation of the gel is driven by changes in concentration of water only.
A decrease in the equilibrium degree of swelling Q of a TR gel with temperature T is described within the concept proposed in [66,67], see also review [46]. Chains in the polymer network are presumed to contain hydrophobic backbones and hydrophilic and hydrophobic side groups (for example, amide and isopropyl groups in PNIPAAm). Water molecules attached to hydrophilic side groups by hydrogen bonds form a shell-like structure (hydration shell) around the backbones. At temperatures T far below , each hydrophobic group is surrounded by a cage-like structure formed by water molecules bridged by hydrogen bonds [68]. These cage-like structures “lie” on the surface of the hydration shell, while the latter serves as their support and ensures their stability.
The growth of temperature T induces an increase in intensity of thermal fluctuations. These fluctuations destabilize hydrogen bonds between water molecules and hydrophilic groups, weaken the hydration shell, and, as a consequence, destabilize cage-like structures around hydrophobic side groups. The breakage of cages causes release of these groups. This release induces an increase in the effective hydrophobicity of the network. When concentration of the released groups reaches its critical value at , the hydrophobic side groups aggregate into clusters from which water molecules are expelled. The formation of hydrophobic clusters results in a pronounced increase in the elastic modulus (these clusters serve as extra physical bonds between chains) and deswelling of the gel. Above the critical temperature, when all cage-like structures are broken, a TR gel consists of deswollen hydrophobic clusters wrapped by hydrophilic segments and separated by nano-channels filled by water molecules [69].
According to this scenario, the polymer network in a TR gel involves two components. The first network with covalent bonds is formed under cross-linking polymerization of a pre-gel solution. The other network is built at temperatures due to aggregation of hydrophobic segments into clusters that serve as physical bonds between chains. For simplicity, both networks are treated as permanent.
The deformation gradient for macro-deformation is connected with the deformation gradient for elastic deformation of the mth network by the multiplicative decomposition formula
where denotes deformation gradient for transition from the initial to the reference (stress-free) state of the mth network, and the dot stands for the inner product.
Homogeneous transformation of the initial configuration into the reference configuration of a covalently cross-linked network is described by the deformation gradient
where is the unit tensor, is the concentration of water molecules and is the degree of swelling in the reference state.
Keeping in mind that all water molecules are expelled from hydrophobic clusters, we presume the reference state of the network with physical bonds to coincide with the initial state of the gel,
The Helmholtz free energy of a gel (per unit volume in the initial state) equals the sum of the specific energies of fluid and solid components not interacting with each other and the energy of their interaction [70],
where is the specific energy of water molecules not interacting with segments of chains, is the specific energy of polymer chains not interacting with water, and is the specific energy of mixing of water molecules with segments of chains.
The specific energy of water molecules is given by
where denotes the chemical potential of water molecules not interacting with the polymer network.
The specific energy of the network (consisting of two parts with chemical and physical bonds) reads
The specific mechanical energy stored in chains of the mth network depends on the principal invariants of the corresponding Cauchy–Green tensor for elastic deformation
where ⊤ stands for transpose. For definiteness, the neo–Hookean formulas are accepted for the strain energy densities of polymer networks with covalent and physical bonds,
where and stand for the shear moduli. The physical meaning of Equation (10) was discussed in [71], where this relation was re-derived within the concept of entropic elasticity.
The specific energy of the mixing of water molecules with segments of chains is adopted in the conventional form [70]
where is the Boltzmann constant, is the Flory–Huggins (FH) parameter, and
are volume fractions of water (w) and polymer network (n) in the actual state. The first term in Equation (11) characterizes the entropy and the other term describes the enthalpy of the mixing of water molecules with segments of chains. In a narrow interval of temperatures under consideration, the actual temperature T is replaced with the initial temperature in the thermodynamic factor .
To describe changes in the effective hydrophobicity of a polymer network driven by the temperature-induced breakage of cage-like structures and release of hydrophobic side groups, we introduce the linear function
and postulate that
Here T and are measured in C, the coefficients , characterize an increase in the effective hydrophobicity of the network with temperature T, and is the ultimate value of the FH parameter at the volume phase transition temperature . Equation (14) means that the effective hydrophobicity of the network (characterized by ) grows linearly with temperature when T is below VPTT. When T exceeds , remains constant as released (due to breakage of cages) side groups form hydrophobic clusters covered by segments whose hydrophilicity is independent of temperature.
The coefficients and in Equation (13) are treated as universal. These quantities are determined by the chemical structure of monomers and are independent of polymerization conditions and molar fractions of monomers and cross-linker in pre-gel solutions. These coefficients and obey the continuity condition
to be used for explicit determination of the critical temperature .
The influence of temperature on the elastic modulus of the covalently cross-linked sub-network is disregarded, and is treated as a constant. The modulus of the sub-network with physical bonds vanishes below and grows with the difference above VPTT.
Keeping in mind that the differences and are proportional, we adopt the following expression for :
Here is the shear modulus of the sub-network with physical bonds strongly above VPTT, and is the rate of growth of caused by aggregation of hydrophobic side groups. Equation (16) is equivalent to the differential equation
Keeping in mind that is proportional to concentration of hydrophobic clusters serving as physical bonds between chains, we treat Equation (17) as a kinetic equation for the aggregation process.
Applying the free-energy imbalance inequality, one can show that the equilibrium degree of swelling Q obeys the equation [72]
where
are the dimensionless shear moduli.
Equations (13), (14), (16) and (18) provide governing equations for the equilibrium swelling of a TR gel in water. These relations involve seven adjustable parameters: , , , , , and . When a gel is temperature-insensitive, the coefficients and vanish, and the number of adjustable parameters is reduced to three: , and .
3.2. Swelling of TR Gels in Binary Mixtures
We extend now the model developed in Section 3.1 to the analysis of equilibrium swelling of TR gels in mixtures of water with good cosolvents (whose molecules form cage-like structures connected by hydrogen bonds around hydrophobic side groups). Governing equations for equilibrium solvent uptake are reported in Section 3.2.1–Section 3.2.3. Three cases are considered separately: swelling of a TR gel in binary mixtures (i) when temperature T is far below , (ii) when T exceeds the critical temperature, and (iii) when T is close to .
3.2.1. Equilibrium Swelling at Temperatures Far below
We begin with the analysis of the swelling of TR gels at temperatures T far below , when thermally induced aggregation of hydrohobic side groups into clusters is not observed (which means that the coefficient in Equation (18) vanishes). The equilibrium swelling diagrams under this condition are reported in Figure 1 and Figure 2A. The non-monotonic dependencies of the equilibrium degree of swelling Q on the volume fraction of cosolvent in these figures characterize the cononsolvency (reentrant swelling) phenomenon.
At relatively small volume fractions of cosolvent , when water is the main component of the mixture, hydrophobic side groups are surrounded by cage-like structures formed by water molecules exclusively. An increase in concentration of cosolvent induces the replacement of water with cosolvent molecules in the hydration shells (when the energy of interaction between cosolvent molecules and hydrophilic side groups is higher than the corresponding energy for water molecules) or separation of water molecules from the hydration shells (when their pair-interaction energy with water molecules exceed the energy of interaction between water molecules and hydrophilic side groups of polymer chains). As a result, interactions between the cage-like structures and the hydration shells weaken. The latter causes destabilization and breakage of cages formed by water molecules around hydrophobic side groups (because stability of these structures is ensured by interactions with the hydration shells). Breakage of cages surrounding hydrophobic side groups results in release of these groups (reflected by an increase in the effective hydrophobicity of the network ).
At the volume phase transition point , water molecules in the cage-like structures are totally replaced with the cosolvent molecules. As the affinity of cosolvent molecules in cage-like structures to those in the hydration shells is higher than their affinity to water, further increase in the volume fraction of cosolvent leads to strengthening of interactions between the cage-like structures and supporting hydration shells. The latter is observed as a decrease in the effective hydrophobicity of the network .
According to this scenario, changes in the micro-structure of a TR gel under isothermal conditions driven by an increase in volume fraction of cosolvent (in the interval ) or an increase in the volume fraction of water (in the interval ) resembles those caused by an increase in temperature T when swelling is conducted in pure water. With reference to this picture, changes in the effective FH parameter with in the entire interval of volume fractions of cosolvent are described by the equations similar to Equation (14),
where denotes its critical volume fraction of cosolvent at which the degree of swelling Q reaches its minimum value, and the coefficients , () characterize the hydrophobicity of a network of chains whose hydrophobic side groups are surrounded by cage-like structures formed by molecules of water (the upper index 1) and cosolvent (the upper index 2).
Equation (19) describes the growth of the hydrophobicity of the network driven by the replacement of water molecules in the hydration shells with cosolvent molecules (when cages around hydrophobic side groups are formed by water molecules), whereas Equation (20) accounts for the same growth induced by the replacement of cosolvent molecules in the hydration shells with water molecules (when cage-like structures are formed by cosolvent molecules). The phase transition point reflects replacement of water with cosolvent molecules in cage-like structures. This replacement occurs to avoid a strong increase in the free energy (a pronounced decay in the specific entropy) driven by the aggregation of hydrophobic segments and formation of hydrophobic clusters. The phase transition point is determined from the continuity condition for the FH parameter (or the equilibrium degree of swelling Q),
where and are given by Equations (19) and (20), respectively. Equation (21) ensures that all material parameters evolve continuously with in the interval .
Governing equations for equilibrium swelling of TR gels in binary mixtures far below consist of Equation (18) (where ) for the equilibrium degree of swelling Q and Equations (19) and (20) for the FH parameter . Their advantage (compared with previous models) is that these relations involve only six adjustable parameters: , , , and . The volume phase transition point is determined by Equation (21).
3.2.2. Equilibrium Swelling at Temperatures Far above
To describe equilibrium swelling of TR gels in binary mixtures at temperatures T strongly exceeding (Figure 2C), we adopt the following scenario. When a mixture consists of cosolvent only (), the cage-like structures surrounding hydrophobic side groups and the hydration shells are formed by cosolvent molecules exclusively. A decrease in the volume fraction of cosolvent (or an increase in the volume fraction of water ), leads to the partial replacement of cosolvent molecules in the hydration shells with water molecules. As the affinity of cosolvent molecules in the cage-like structures to those in the hydration shells is higher than their affinity to water, the growth of volume fraction of water in the mixture causes a weakening of interactions between the cage-like structures and supporting hydration shells. This weakening leads to the breakage of cage-like structures around hydrophobic side groups. Breakage of cages induces the release of hydrophobic groups (this process is reflected by an increase in the effective hydrophobicity of the network ) and their aggregation into hydrophobic clusters (when the measure of hydrophobicity of the network reaches its ultimate value).
Bearing in mind the similarity between the effects of (i) temperature under swelling of a TR gel in water and (ii) volume fraction of water molecules under isothermal swelling of this gel in a mixture of solvents on the effective hydrophobicity of the network , we describe changes in with volume fraction of water molecules by the analog of Equations (13) and (14),
where
and is the ultimate value of hydrophobicity of the network at which aggregation starts of the released side groups. The critical volume fraction of cosolvent is determined from the continuity condition similar to Equation (15),
The dimensionless shear modulus of the sub-network with physical bonds formed by hydrophobic clusters in mixtures with is governed by the relation similar to Equation (16),
3.2.3. Equilibrium Swelling at Temperatures in the Vicinity of VPTT
To describe the equilibrium swelling of TR gels in mixtures of water with solvents at temperatures T close to the critical temperature , the equilibrium swelling diagrams are split into three parts (Figure 2B).
At small volume fractions of cosolvent , cage-like structures surrounding hydrophobic side groups are formed by water molecules. Replacement of water with cosolvent molecules in hydration shells (induced by an increase in ) weakens the interaction between the cages and hydration shells. As a result, some hydrophobic groups release from their cages, which leads to a decrease in the equilibrium degree of swelling Q and an increase in hydrophobicity of the network (characterized by the FH parameter ). The effect of the volume fraction of cosolvent on the effective FH parameter is described by the equations similar to Equations (22) and (23),
where
and denotes the critical volume fraction of cosolvent at which aggregation starts of hydrophobic side groups released from the cage-like structures. At , hydrophobic clusters are formed that serve as extra physical cross-links between chains, and the polymer network consists of two sub-networks with covalent and physical bonds. Concentration of physical bonds (characterized by the parameter ) grows monotonically with . This growth is governed by the analog of Equation (25),
with coefficients and .
At large volume fractions of cosolvent (or small volume fractions of water ), cage-like structures are formed by cosolvent molecules. Due to the presence of water molecules in the mixture, some cosolvent molecules are replaced with water molecules in the hydration shells. This replacement weakens interactions between the cages and hydration shells, induces an increase in hydrophobicity of the network governed by Equations (22) and (23), and causes a decrease the equilibrium degree of swelling Q with volume fraction of water . When the volume fraction of cosolvent reaches its critical value ( approaches its ultimate value ), cage-like structures around hydrophobic side groups become unstable, and the side groups (released from cages) form hydrophobic clusters. At , the polymer network consists of two sub-networks with covalent and physical bonds. Concentration of physical bonds (characterized by the parameter ) grows monotonically with volume fraction of water molecules . This growth is described by Equation (25) with parameters (the same as in Equation (28)) and .
The critical volume fractions of cosolvent, , and , at which aggregation of hydrophobic side groups starts when cages around these segments are formed by water and cosolvent molecules, respectively, are given by the equations
In the interval , a TR gel is in the collapsed state, and its polymer network involves two sub-networks with covalent and physical bonds. In the neighborhoods of the left and right boundaries of this interval, hydration shells surrounding polymer chains are mainly formed by water and cosolvent molecules, respectively. We presume the existence of some critical point , at which replacement occurs of the water molecules (as the main element of the hydration shells) with cosolvent molecules [73]. The phase transition point is determined from the continuity condition for the equilibrium degree of swelling Q,
where and are solutions of Equation (18) with the FH parameter determined by Equations (22) and (26), respectively.
When , no special means are needed to ensure that Equation (30) implies the continuity of all functions in the governing equations. However, experimental data on some TR gels show that . This condition means that the aggregation of hydrophobic side groups starts at smaller values of the FH parameter in binary mixtures with low volume fractions of cosolvent molecules compared with their aggregation in mixtures with low volume fractions of water molecules . In this case, to guarantee that hydrophilicities of chains and concentrations of hydrophobic aggregates coincide at the volume phase transition point , Equation (26) for the function is modified, as follows:
Equation (31) together with Equations (22), (25) and (28) guarantees that the functions and do not suffer jumps when changes in the entire interval from 0 to 1.
Equilibrium swelling of a TR gel in binary mixtures at temperatures T close to the critical temperature is described by Equation (18) together with Equations (22), (23), (27) and (31) for the FH parameter and Equations (25) and (28) for the dimensionless shear modulus . The governing equations involve eleven material constants: , , , , , , , , , and .
4. Results and Discussion
To examine the effects of temperature T and volume fraction of cosolvent in binary mixtures on the equilibrium degree of the swelling Q of TR gels, experimental swelling diagrams are fitted by means of the model described in Section 3.
4.1. Swelling of PNIPAAm Gels in Water at Various Temperatures
The effect of temperature T on the equilibrium degree of the swelling of PNIPAAm gel in water is described by Equations (13), (14), (16) and (18). These relations involve seven adjustable parameters: (i) the dimensionless shear modulus of the sub-network with covalent bonds , (ii) the degree of swelling in the reference state , (iii) the coefficients , characterizing the growth of hydrophobicity of the network with temperature T, (iv) the ultimate value of the FH parameter , (v) and the coefficient , describing the kinetics of aggregation of hydrophobic side groups at . The volume phase transition temperature is determined from Equation (15).
To demonstrate the ability of the model to describe equilibrium swelling diagrams on PNIPAAm gels in water, we analyze three sets of experimental data reported in Figure 3.
Swelling diagrams on PNIPAAm macroscopic gel (Figure 3A) and microgels (Figure 3B,C) are fitted by using a two-step algorithm. At the first step, observations below (where ) are matched. The experimental dependence is determined from Equation (18). Given “universal” values of and (these parameters were found in [74,75] for several TR gels), the coefficients and are calculated from the best-fit condition by matching the dependence with the help of Equations (13) and (14). At the other step, experimental data above are fitted by the means of two parameters, and . These quantities are found by the nonlinear regression method to minimize the expression
where summation is performed over all temperatures T under consideration, stands for the degree of swelling measured in a test, and is determined from Equation (18). This equation is solved numerically by the Newton–Raphson algorithm. Given , the parameter is calculated from Equation (15).
Figure 3 demonstrates good agreement between the experimental swelling curves and results of numerical analysis with the material parameters collected in Table S3. Figure S3 confirms that Equation (14) correctly describes the effect of temperature on the FH parameter below . The following conclusions are drawn:
- (I)
- The critical temperatures of PNIPAAm gels and microgels coincide practically ( C). According to Equation (15), this is caused by the fact that the parameter of these gels adopts similar values (in the range between 0.4 and 0.55 depending on the preparation conditions).
- (II)
- The coefficients and (that describe the kinetics of aggregation of hydrophobic segments above ) accept similar values for macroscopic gels and microgels.
- (III)
- The degrees of swelling in the reference state for microgels are substantially lower than that for the macroscopic gel.
4.2. Swelling of PNIPAAm Gels in Binary Mixtures Far below
Equilibrium swelling of TR gels in mixtures of water with good cosolvents is described by Equation (18) (with ), Equations (19) and (20). The volume phase transition point is determined by Equation (21). These equations involve six adjustable parameters: (i) the dimensionless elastic modulus , (ii) the degree of swelling in the reference state , and (iii) four coefficients , and , characterizing the effect of cosolvent on hydrophobicity of the network.
To demonstrate that the model adequately describes the equilibrium swelling diagrams on PNIPAAm gels in mixtures of water with methanol, ethanol, DMF, and dioxane, we approximate the experimental data in Figure 1, Figure 2, Figure 4, Figure 5, Figure 6 and Figure 7.
We begin with matching observations on PNIPAAm microgel in water/methanol and water/ethanol mixtures at temperature C (Figure 4). Given parameters and (their values are found by fitting the data in Figure 3B and are listed in Table S3), we determine from Equation (18). The coefficients , () are calculated by the least-squares algorithm when each branch of the function (below and above ) is approximated by Equations (19) and (20) separately. Figure S4 shows that these equations correctly describe the effect of volume fraction of cosolvent on the FH parameter . Figure 4 demonstrates reasonable agreement between the experimental swelling diagrams and the results of numerical analysis with the material parameters collected in Table S4.
We proceed with fitting experimental data on PNIPAAm microgel in water/DMF mixture at temperatures and 20 C (Figure 5A,B). These figures demonstrate good agreement between the data and results of numerical analysis with the material parameters reported in Table S5. Figure S5A,B show that changes in the FH parameter with volume fraction of DMF are adequately described by Equations (19) and (20).
In approximation of observations reported in Figure 4 and Figure 5, the coefficients and are calculated by fitting the function (Figure S3), and the parameters and are determined by matching the functions below and above the volume phase transition point .
When the equilibrium swelling diagram in water is not provided, the quantities and can be found from the best-fit condition by matching the curve below . This method is used to fit the equilibrium swelling diagrams on PNIPAAm gels in water/methanol mixture at temperature C (Figure 1), water/methanol mixture at temperature C (Figure 2A), water/methanol mixture at temperatures and 25 C (Figure 6A,B), and water/dioxane mixture at temperature C (Figure 7A). These figures reveal good agreement between the experimental data and results of numerical analysis with the material parameters collected in Tables S1, S2, and S4–S7, respectively. Figures S1, S2A, S6A,B, S7A and S8A confirm that the functions are correctly approximated by Equations (19) and (20).
4.3. Swelling of PNIPAAm Gels in Binary Mixtures Far above VPTT
Equilibrium swelling of PNIPAAm gels in mixtures of water with good solvents at temperatures are described by Equations (18), (22), (23) and (25). These relations involve seven material parameters: (i) the dimensionless elastic modulus of the sub-network with covalent cross-links , (ii) the degree of swelling in the reference state , (iii) the coefficients and characterizing an increase in the hydrophobicity of the network with volume fraction of water, (v) the ultimate value of the FH parameter , and (vi) the coefficients and describing the kinetics of the formation of hydrophobic clusters.
Three parameters, , , and , are independent of the concentration of cosolvent. Their values are found by fitting equilibrium swelling diagrams on PNIPAAm gels in pure water (Figure 3). The remaining four coefficients are determined by matching observations on the gels in mixtures of water with cosolvents. The quantities and are calculated by approximation of the function in the interval , where volume fractions of water molecules is low. The parameter is determined by Equation (24). The coefficient is found by matching experimental data in the interval , where volume fractions of water are relatively high.
To verify the ability of the model to describe equilibrium swelling diagrams on PNIPAAm macroscopic gels and microgels, we approximate observations presented in Figure 2C (PNIPAAm gel in water/methanol mixture at temperature C), Figure 5C (PNIPAAm microgel in water/DMF mixture at temperature C), Figure 6C (PNIPAAm gel in water/methanol mixture at temperature C), and Figure 7B (PNIPAAm gel in water/dioxane mixture at temperature C).
These figures demonstrate good agreement between the data and results of numerical analysis with the material constants listed in Tables S2 and S5–S7. Figures S2B, S5C, S6C and S7B confirm that Equations (22) and (23) adequately describe changes in the hydrophobicity of the network with the volume fraction of cosolvent. Tables S2 and S6 show that the coefficients and accept similar values for two PNIPAAm gels in water/methanol mixtures at temperatures slightly exceeding .
A characteristic feature of the volume phase transition in PNIPAAm gels immersed in mixtures of solvents at temperatures is that the critical value of the FH parameter at which aggregation of hydrophobic side groups starts in binary mixtures exceeds the critical value at which the aggregation process starts in pure water. According to Table S3, ranges from 0.39 and 0.53, whereas the values belong to the interval from 0.59 (Table S6) to 0.78 (Table S7).
4.4. Swelling of PNIPAAm Gels in Binary Mixtures in the Vicinity of
Equilibrium swelling of a TR gel in mixtures of water with good solvents at temperatures T close to the critical temperature is described by Equations (18), (22), (23), (25), (27), (28) and (31). The governing equations involve eleven material parameters: (i) the mechanical response of sub-networks with covalent and physical bonds is characterized by the coefficients , , and , (ii) changes in hydrophobicity of the network when cage-like structures around hydrophobic side groups are formed by water molecules and cosolvent molecules, respectively, are determined by the coefficients , , and , , (iii) the critical values of the FH parameter at which aggregation of hydrophobic side groups starts when hydration shells are mainly formed by water and cosolvent read and , (iv) the rates of formation of hydrophobic aggregates that serve as extra physical bonds between chains in the collapsed state of a gel are given by , .
Each equilibrium swelling diagram under isothermal conditions is split into parts by the phase transition points , , and . These parameters are determined by Equations (29) and (30). In the intervals and , a TR gel is in the swollen state, and its hydrophobic side groups are surrounded by cages formed by water and cosolvent molecules, respectively. In the interval , the gel is in the collapsed state. At the point , water molecules (as the main component of hydration shells) are replaced with cosolvent molecules.
To examine the ability of the model to describe equilibrium swelling diagrams on PNIPAAm gels in mixtures of solvents at temperatures T close to , we study three sets of observations.
We begin with matching experimental data on PNIPAAm gel in the water/methanol mixture at temperature C depicted in Figure 2B. Given and (these quantities are found by fitting the data in Figure 2A), we calculate , and , by approximation of the function at small () and large () volume fractions of methanol with the help of Equations (31) and (22), respectively. The accuracy of this approximation is illustrated in Figure S2B. The ultimate FH parameters and are determined from Equation (29). Given (this parameter is determined by fitting observations in Figure 2C), we calculate the coefficients and from the best-fit condition by matching each branch of the experimental swelling curve separately in the interval (). The critical point is found from Equation (30). Figure 2B demonstrates reasonable agreement between the experimental data and results of numerical analysis with the material constants collected in Table S2. This table shows that (i) is higher than (this conclusion serves as a reason for modification (31)), and (ii) exceeds strongly (by an order of magnitude) . The latter means that the rate of aggregation of hydrophobic segments in water is higher than that in methanol.
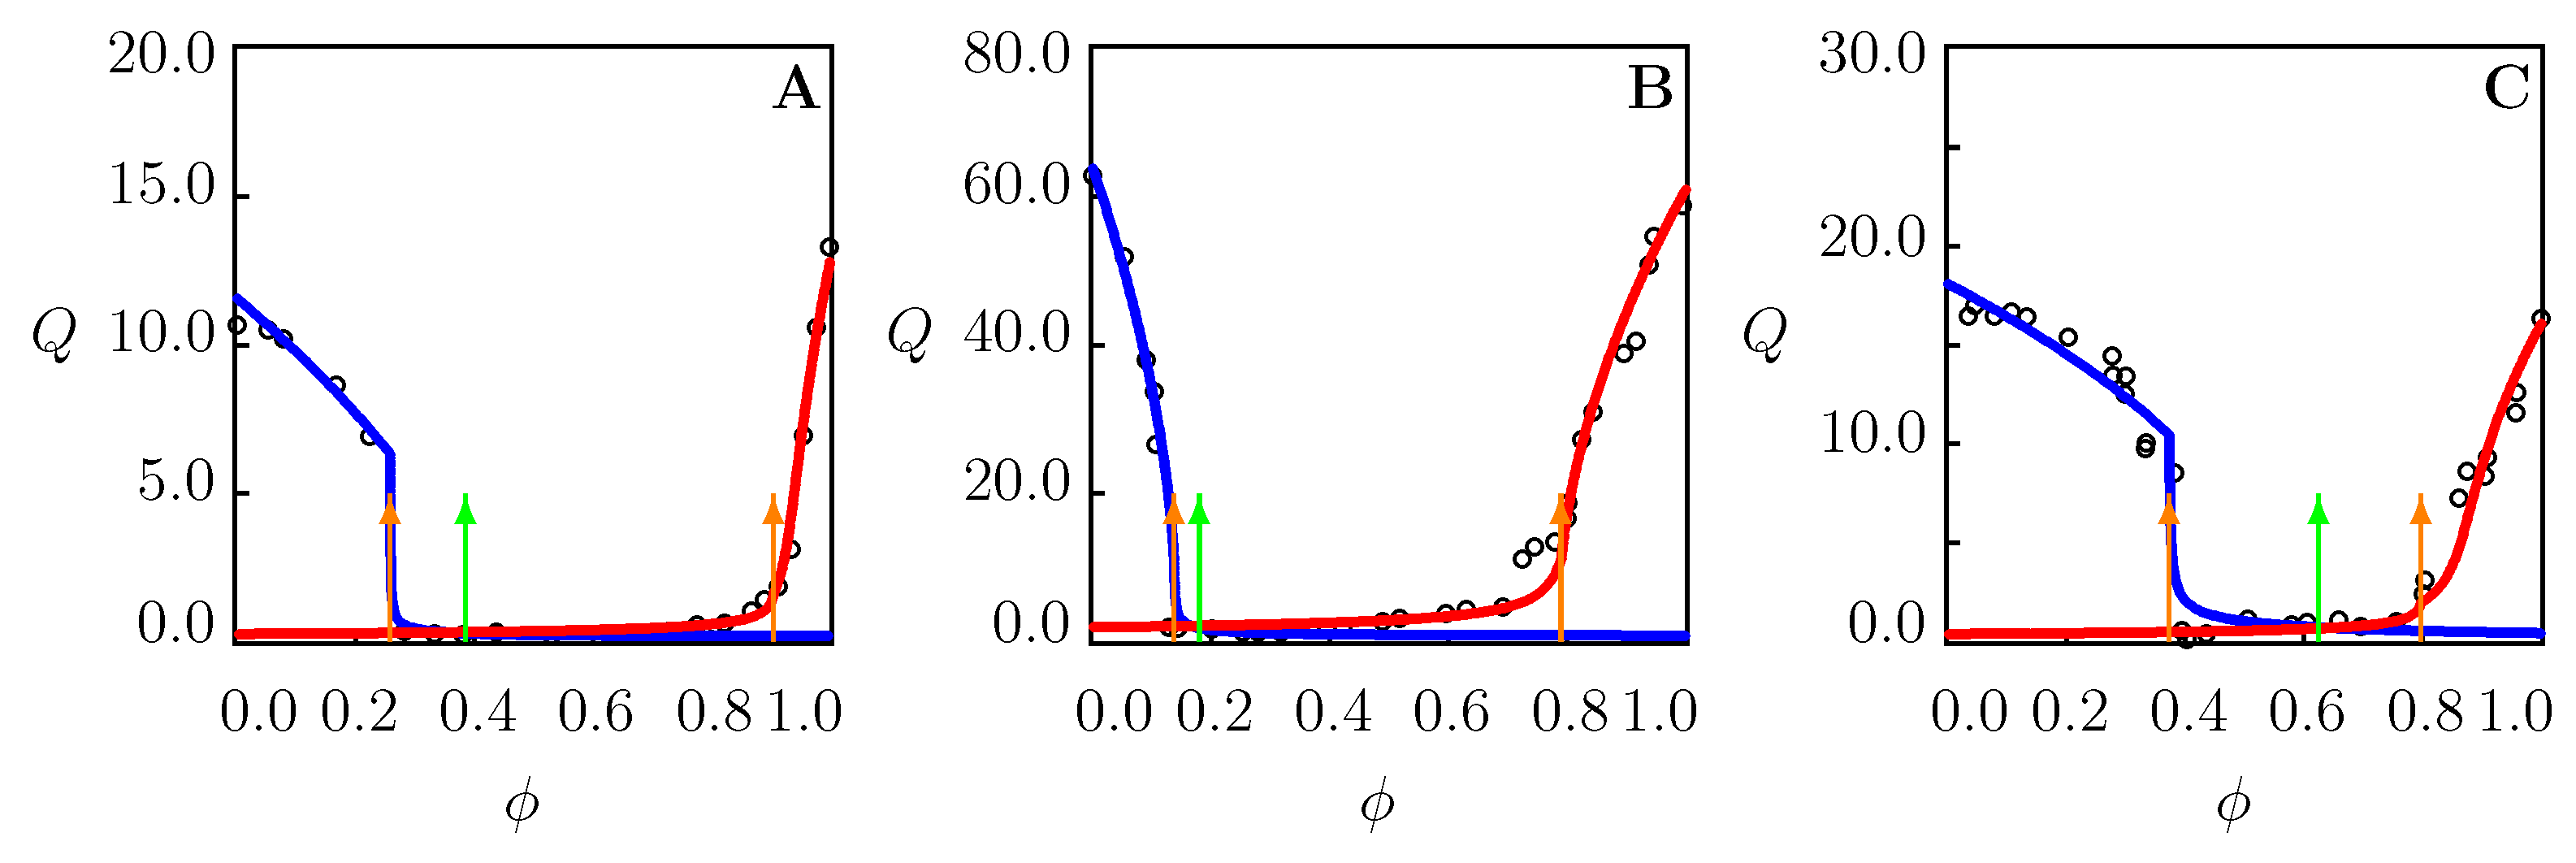
We proceed with fitting experimental data on the PNIPAAm gel in water/dioxane mixture at temperature C (Figure 8A). As the composition and preparation conditions for this gel [41] differ from those for the PNIPAAm gel [37] whose equilibrium swelling diagrams are reported in Figure 7, the coefficients and are found from the best-fit condition of matching the experimental function by Equations (22) and (23) at high . The parameters , and , are determined by approximation of this function at small () and large () volume fractions of dioxane with the help of Equations (31) and (22), respectively. The accuracy of this approximation is illustrated in Figure S8A. The ultimate FH parameters and are determined from Equation (29). The coefficients and are calculated by approximation of the left branch of swelling curve at , while the coefficient is found by fitting its right branch at . The phase transition point is found from Equation (30).
4.5. Discussion
A model is developed for the equilibrium swelling of LCST-type TR gels in binary mixtures at temperatures T below and above the critical temperature . At , the effective FH parameter is connected with volume fraction of cosolvent in a mixture by Equations (19) and (20). These linear relations becomes strongly nonlinear when the molar fraction of cosolvent is employed instead of its volume fraction . Equations (19) and (20) and their extensions (22), (23), (27) and (31) are used for two reasons: (i) to reduce the number of adjustable parameters and to make the model tractable, and (ii) to avoid introduction of sophisticated balance equations for water and cosolvent molecules in the mixtures outside a gel, inside the gel, and in the cage-like structures surrounding hydrophobic side groups.
This simplification implies that re-entrant swelling diagrams on PNIPAAm gels at temperatures (Figure 1, Figure 2A, Figure 4, Figure 5A,B, Figure 6A,B and Figure 7A) are described by means of six material parameters only. Two of them ( and ) are found by matching the equilibrium swelling curve in water. The remaining coefficients are calculated by fitting the decreasing (, ) and increasing (, ) branches on the diagram separately.
Observations on PNIPAAm gels in water (Figure 3) and in mixtures of solvents at temperatures (Figure 2C, Figure 5C, Figure 6C and Figure 7C) are described by the model with seven material coefficients. Four of them (, , , ) determine the response of a gel in the swollen state, one () characterizes the volume phase transition point, and the remaining two quantities ( and ) describe the kinetics of the aggregation of hydrophobic side groups in the collapsed state.
The most sophisticated case of solvent uptake by TR gels (when temperatures T is close to ) requires eleven material parameters to describe experimental swelling diagrams with three volume phase transition points. Figure 2B and Figure 8 show good agreement between experimental data and results of numerical analysis (to the best of our knowledge, no attempts have previously been undertaken to describe these diagrams).
The model is applied to the analysis of equilibrium swelling curves on PNIPAAm macroscopic gels and microgels in mixtures of water with methanol, ethanol, dimethylformamide, dimethyl sulfoxide, dioxane, and aqueous solutions of poly(ethylene glycol) at temperatures ranging from to 40 C (below and above the critical temperature C).
The number of phase transition points in the entire interval (where volume fraction of cosolvent varies) depends strongly on temperature. Three types of phase transitions are distinguished:
- Induced by aggregation of hydrophobic side groups and formation of hydrophobic clusters serving as physical cross-links between chains;
- Driven by replacement of water with cosolvent molecules in cage-like structures surrounding hydrophobic side chains;
- Caused by replacement of water (as the main element of hydration shells) with cosolvent molecules.
The following four cases are identified:
- One volume phase transition point for temperature-induced transformations of PNIPAAm gels in water (Figure 3). An increase in temperature weakens hydration shells supporting cage-like structures and destabilize the cages around hydrophobic side groups. The latter induces breakage of cages, release of hydrophobic groups, and their aggregation into clusters from which solvent molecules are expelled.
- One volume phase transition point for PNIPAAm gels in binary mixtures at temperatures T far below the critical temperature in water (Figure 1, Figure 2A, Figure 4A,B, Figure 5A,B, Figure 6A,B and Figure 7A). Structural transformation in TR gels demonstrating the re-entrance phenomenon is driven by replacement of water with cosolvent molecules in cage-like structures surrounding hydrophobic side groups (the phase transition point coincides with the point of minimum on swelling diagrams with decreasing and increasing branches).
- Three volume phase transition points for PNIPAAm gels in binary mixtures at temperatures T close to the critical temperature in water (Figure 2B and Figure 8A–C). Two phase transition points on a swelling diagram, and , correspond to aggregation of hydrophobic segments in TR gels whose cage-like structures are formed by water () and cosolvent () molecules. The third transition point reflects replacement of water molecules (as the main element of hydration shells) with cosolvent molecules in the collapsed gel.
- One volume phase transition point for PNIPAAm gels in binary mixtures at temperatures T exceeding the critical temperature in water (Figure 2C, Figure 5C, Figure 6C and Figure 7B). The structural transformation is driven by breakage of cage-like structures formed by cosolvent molecules and the aggregation of released hydrophobic side groups.
5. Conclusions
A simple model is developed for the equilibrium swelling of LCST-type TR gels immersed in binary mixtures at temperatures T below and above their volume phase transition temperatures in water. Unlike the conventional models (based on the introduction of several FH parameters), we use the only coefficient , which depends linearly on temperature T and volume fraction of cosolvent in the mixture . The following advantages of this approach are to be mentioned: (i) the number of material parameters is reduced substantially, (ii) an increase in the elastic modulus of a gel in the collapsed state (driven by aggregation of hydrophobic segments into clusters from which solvent molecules are expelled) is taken into account, and (iii) the volume phase transition points are explicitly determined.
The model is applied to analyze equilibrium swelling of PNIPAAm macroscopic gels and microgels in mixtures of water with methanol, ethanol, dimethylformamide, dimethyl sulfoxide, dioxane, and aqueous solutions of poly(ethylene glycol) in the interval of temperatures between to 40 C. Good agreement is demonstrated between the experimental data and results of numerical analysis. Classification of the volume phase transition points on equilibrium swelling diagrams is provided.
Supplementary Materials
The following supporting information can be downloaded at: https://www.mdpi.com/article/10.3390/chemistry4030049/s1, Compositions and preparation conditions for PNIPAAm gels, tables with material constants, figures illustrating evolution of the FH parameter with temperature and volume fraction of cosolvents (PDF).
Author Contributions
A.D.D. conceptualization, methodology, software, formal analysis, writing-original draft, writing-review and editing; J.d.C.C.: conceptualization, methodology, funding acquisition, writing-review and editing. All authors have read and agreed to the published version of the manuscript.
Funding
This research was funded by Innovationsfonden (Innovation Fund Denmark), project 9091-00010B.
Institutional Review Board Statement
Not applicable.
Informed Consent Statement
Not applicable.
Data Availability Statement
All data generated or analyzed during this study are included in this article and its Supporting Information File.
Conflicts of Interest
The authors declare no conflict of interest.
References
- Peppas, N.A.; Hilt, J.Z.; Khademhosseini, A.; Langer, R. Hydrogels in biology and medicine: From molecular principles to bionanotechnology. Adv. Mater. 2006, 18, 1345–1360. [Google Scholar] [CrossRef]
- Yuk, H.; Lu, B.; Zhao, X. Hydrogel bioelectronics. Chem. Soc. Rev. 2019, 48, 1642–1667. [Google Scholar] [CrossRef] [PubMed] [Green Version]
- Qin, Z.; Dong, D.; Yao, M.; Yu, Q.; Sun, X.; Guo, Q.; Zhang, H.; Yao, F.; Li, J. Freezing-tolerant supramolecular organohydrogel with high toughness, thermoplasticity, and healable and adhesive properties. ACS Appl. Mater. Interfaces 2019, 11, 21184–21193. [Google Scholar] [CrossRef]
- Liu, B.; Li, F.; Niu, P.; Li, H. Tough adhesion of freezing- and drying-tolerant transparent nanocomposite organohydrogels. ACS Appl. Mater. Interfaces 2021, 13, 21822–21830. [Google Scholar] [CrossRef] [PubMed]
- Morelle, X.P.; Illeperuma, W.R.; Tian, K.; Bai, R.; Suo, Z.; Vlassak, J.J. Highly stretchable and tough hydrogels below water freezing temperature. Adv. Mater. 2018, 30, 1801541. [Google Scholar] [CrossRef]
- Chen, F.; Zhou, D.; Wang, J.; Li, T.; Zhou, X.; Gan, T.; Handschuh-Wang, S.; Zhou, X. Rational fabrication of anti-freezing, non-drying tough organohydrogels by one-pot solvent displacement. Angew. Chem. Int. Ed. 2018, 57, 6568–6571. [Google Scholar] [CrossRef]
- Sun, H.; Zhao, Y.; Jiao, S.; Wang, C.; Jia, Y.; Dai, K.; Zheng, G.; Liu, C.; Wan, P.; Shen, C. Environment tolerant conductive nanocomposite organohydrogels as flexible strain sensors and power sources for sustainable electronics. Adv. Funct. Mater. 2021, 31, 2101696. [Google Scholar] [CrossRef]
- Shang, H.; Le, X.; Si, M.; Wu, S.; Peng, Y.; Shan, F.; Wu, S.; Chen, T. Biomimetic organohydrogel actuator with high response speed and synergistic fluorescent variation. Chem. Eng. J. 2022, 429, 132290. [Google Scholar] [CrossRef]
- Xu, Y.; Rong, Q.; Zhao, T.; Liu, M. Anti-freezing multiphase gel materials: Bioinspired design strategies and applications. Giant 2020, 2, 100014. [Google Scholar] [CrossRef]
- Zhuo, Y.; Chen, J.; Xiao, S.; Li, T.; Wang, F.; He, J.; Zhang, Z. Gels as emerging anti-icing materials: A mini review. Mater. Horiz. 2021, 8, 3266–3280. [Google Scholar] [CrossRef]
- Zhang, Z.; Hao, J. Bioinspired organohydrogels with heterostructures: Fabrications, performances, and applications. Adv. Colloid Interface Sci. 2021, 292, 102408. [Google Scholar] [CrossRef] [PubMed]
- Zeng, L.; Lin, X.; Li, P.; Liu, F.-Q.; Guo, H.; Li, W.-H. Recent advances of organogels: From fabrications and functions to applications. Prog. Org. Coat. 2021, 159, 106417. [Google Scholar] [CrossRef]
- Castro, G.R.; Knubovets, T. Homogeneous biocatalysis in organic solvents and water-organic mixtures. Crit. Rev. Biotechnol. 2003, 23, 195–231. [Google Scholar] [CrossRef] [PubMed]
- Zhang, Q.; Hoogenboom, R. Polymers with upper critical solution temperature behavior in alcohol/water solvent mixtures. Prog. Polym. Sci. 2015, 48, 122–142. [Google Scholar] [CrossRef]
- Kazachenko, A.S.; Akman, F.; Sagaama, A.; Issaoui, N.; Malyar, Y.N.; Vasilieva, N.Y.; Borovkova, V.S. Theoretical and experimental study of guar gum sulfation. J. Mol. Model. 2021, 27, 5. [Google Scholar] [CrossRef]
- Tanaka, T. Collapse of gels and the critical endpoint. Phys. Rev. Lett. 1978, 40, 820–823. [Google Scholar] [CrossRef]
- Dusek, K.; Duskova-Smrckova, M. Volume phase transition in gels: Its discovery and development. Gels 2020, 6, 22. [Google Scholar] [CrossRef]
- Okay, O. Re-entrant conformation transition in hydrogels. Gels 2021, 7, 98. [Google Scholar] [CrossRef]
- Haq, M.A.; Su, Y.; Wang, D. Mechanical properties of PNIPAM based hydrogels: A review. Mater. Sci. Eng. C 2017, 70, 842–855. [Google Scholar] [CrossRef]
- Asano, M.; Winnik, F.M.; Yamashita, T.; Horie, K. Fluorescence studies of dansyl-labeled poly(N-isopropylacrylamide) gels and polymers in mixed water/methanol solutions. Macromolecules 1995, 28, 5861–5866. [Google Scholar] [CrossRef]
- Katayama, S.; Hirokawa, Y.; Tanaka, T. Reentrant phase transition in acrylamide-derivative copolymer gels. Macromolecules 1984, 17, 2641–2643. [Google Scholar] [CrossRef]
- Amiya, T.; Hirokawa, Y.; Hirose, Y.; Li, Y.; Tanaka, T. Reentrant phase transition of N-isopropylacrylamide gels in mixed solvents. J. Chem. Phys. 1987, 86, 2375–2379. [Google Scholar] [CrossRef]
- Winnik, F.M.; Ringsdorf, H.; Venzmer, J. Methanol-water as a co-nonsolvent system for poly(N-isopropylacrylamide). Macromolecules 1990, 23, 2415–2416. [Google Scholar] [CrossRef]
- Schild, H.G.; Muthukumar, M.; Tirrell, D.A. Cononsolvency in mixed aqueous solutions of poly(N-isopropylacrylamide). Macromolecules 1991, 24, 948–952. [Google Scholar] [CrossRef]
- Hirotsu, S. Critical points of the volume phase transition in N-isopropylacrylamide gels. J. Chem. Phys. 1988, 88, 427–431. [Google Scholar] [CrossRef]
- Mukae, K.; Sakurai, M.; Sawamura, S.; Makino, K.; Kim, S.W.; Shirahama, K. Swelling of poly (N-isopropylacrylamide) gels in water-alcohol (C1–C4) mixed solvents. J. Phys. Chem. 1993, 97, 737–741. [Google Scholar] [CrossRef]
- Miki, H.; Suzuki, A.; Yagihara, S.; Tokita, M. Reentrant swelling behavior of poly(N-isopropylacrylamide) gel. Trans. Mater. Res. Soc. Jpn. 2007, 32, 839–842. [Google Scholar] [CrossRef]
- Walter, J.; Sehrt, J.; Vrabec, J.; Hasse, H. Molecular dynamics and experimental study of conformation change of poly(N-isopropylacrylamide) hydrogels in mixtures of water and methanol. J. Phys. Chem. B 2012, 116, 5251–5259. [Google Scholar] [CrossRef]
- Kojima, H.; Tanaka, F.; Scherzinger, C.; Richtering, W. Temperature dependent phase behavior of PNIPAM microgels in mixed water/methanol solvents. J. Polym. Sci. Part B Polym. Phys. 2013, 51, 1100–1111. [Google Scholar] [CrossRef]
- Bischofberger, I.; Calzolari, D.C.E.; Trappe, V. Co-nonsolvency of PNiPAM at the transition between solvation mechanisms. Soft Matter 2014, 10, 8288–8295. [Google Scholar] [CrossRef] [Green Version]
- Nothdurft, K.; Muller, D.H.; Brands, T.; Bardow, A.; Richtering, W. Enrichment of methanol inside pNIPAM gels in the cononsolvency-induced collapse. Phys. Chem. Chem. Phys. 2019, 21, 22811–22818. [Google Scholar] [CrossRef] [PubMed]
- Martinez, M.V.; Molina, M.; Barbero, C.A. Poly(N-isopropylacrylamide) cross-linked gels as intrinsic amphiphilic materials: Swelling properties used to build novel interphases. J. Phys. Chem. B 2018, 122, 9038–9048. [Google Scholar] [CrossRef] [PubMed]
- Zhu, P.W.; Napper, D.H. Coil-to-globule type transitions and swelling of poly(N-isopropylacrylamide) and poly(acrylamide) at latex interfaces in alcohol-water mixtures. J. Colloid Interface Sci. 1996, 177, 343–352. [Google Scholar] [CrossRef]
- Lopez-Leon, T.; Bastos-Gonzalez, D.; Ortega-Vinuesa, J.L.; Elaissari, A. Salt effects in the cononsolvency of poly(N-isopropylacrylamide) microgels. ChemPhysChem 2010, 11, 188–194. [Google Scholar] [CrossRef] [PubMed]
- Backes, S.; Krause, P.; Tabaka, W.; Witt, M.U.; Mukherji, D.; Kremer, K.; von Klitzing, R. Poly(N-isopropylacrylamide) microgels under alcoholic intoxication: When a LCST polymer shows swelling with increasing temperature. ACS Macro Lett. 2017, 6, 1042–1046. [Google Scholar] [CrossRef] [PubMed]
- Mukae, K.; Sakurai, M.; Sawamura, S.; Makino, K.; Kim, S.W.; Ueda, I.; Shirahama, K. Swelling of poly(N-isopropylacrylamide) gels in water-aprotic solvent mixtures. Colloid Polym. Sci. 1994, 272, 655–663. [Google Scholar] [CrossRef]
- Pagonis, K.; Bokias, G. Temperature- and solvent-sensitive hydrogels based on N-isopropylacrylamide and N,N-dimethylacrylamide. Polym. Bull. 2007, 58, 289–294. [Google Scholar] [CrossRef]
- Zhu, P.W.; Napper, D.H. Volume phase transitions of poly(N-isopropylacrylamide) latex particles in mixed water-N,N-dimethylformamide solutions. Chem. Phys. Lett. 1996, 256, 51–56. [Google Scholar] [CrossRef]
- Tokuyama, H.; Ishihara, N.; Sakohara, S. Porous poly(N-isopropylacrylamide) gels polymerized in mixed solvents of water and N,N-dimethylformamide. Polym. Bull. 2008, 61, 399–405. [Google Scholar] [CrossRef]
- Zhu, P.-W.; Chen, L. Effects of cosolvent partitioning on conformational transitions and chain flexibility of thermoresponsive microgels. Phys. Rev. E 2019, 99, 022501. [Google Scholar] [CrossRef]
- Ishidao, T.; Hashimoto, Y.; Iwai, Y.; Arai, Y. Solvent concentrations of dimethylsulfoxide–water and 1-propanol–water solutions inside and outside poly(N-isopropylacrylamide) gel. Colloid Polym. Sci. 1994, 272, 1313–1316. [Google Scholar] [CrossRef]
- Ishidao, T.; Akagi, M.; Sugimoto, H.; Iwai, Y.; Arai, Y. Swelling behaviors of poly(N-isopropylacrylamide) gel in polyethylene glycol–water mixtures. Macromolecules 1993, 26, 7361–7362. [Google Scholar] [CrossRef]
- Scherzinger, C.; Schwarz, A.; Bardow, A.; Leonhard, K.; Richtering, W. Cononsolvency of poly-N-isopropyl acrylamide (PNIPAM): Microgels versus linear chains and macrogels. Curr. Opin. Colloid Interface Sci. 2014, 19, 84–94. [Google Scholar] [CrossRef]
- Kojima, H. Studies on the phase transition of hydrogels and aqueous solutions of thermosensitive polymers. Polym. J. 2018, 50, 411–418. [Google Scholar] [CrossRef]
- Mukherji, D.; Marques, C.M.; Kremer, K. Collapse in two good solvents, swelling in two poor solvents: Defying the laws of polymer solubility? J. Phys. Condens. Matter 2018, 30, 024002. [Google Scholar] [CrossRef] [PubMed] [Green Version]
- Mukherji, D.; Marques, C.M.; Kremer, K. Smart responsive polymers: Fundamentals and design principles. Annu. Rev. Condens. Matter Phys. 2020, 11, 271–299. [Google Scholar] [CrossRef] [Green Version]
- Rodriguez-Ropero, F.; Hajari, T.; Van Der Vegt, N.F.A. Mechanism of polymer collapse in miscible good solvents. J. Phys. Chem. B 2015, 119, 15780–15788. [Google Scholar] [CrossRef]
- Brochard, F.; De Gennes, P.G. Collapse of one polymer coil in a mixture of solvents. Ferroelectrics 1980, 30, 33–47. [Google Scholar] [CrossRef]
- Tanaka, F.; Koga, T.; Winnik, F.M. Temperature-responsive polymers in mixed solvents: Competitive hydrogen bonds cause cononsolvency. Phys. Rev. Lett. 2008, 101, 028302. [Google Scholar] [CrossRef] [Green Version]
- Tanaka, F.; Koga, T.; Kojima, H.; Xue, N.; Winnik, F.M. Preferential adsorption and co-nonsolvency of thermoresponsive polymers in mixed solvents of water/methanol. Macromolecules 2011, 44, 2978–2989. [Google Scholar] [CrossRef]
- Mukherji, D.; Marques, C.M.; Kremer, K. Polymer collapse in miscible good solvents is a generic phenomenon driven by preferential adsorption. Nat. Commun. 2014, 5, 4882. [Google Scholar] [CrossRef] [Green Version]
- Wang, J.; Wang, N.; Liu, B.; Bai, J.; Gong, P.; Ru, G.; Feng, J. Preferential adsorption of the additive is not a prerequisite for cononsolvency in water-rich mixtures. Phys. Chem. Chem. Phys. 2017, 19, 30097–30106. [Google Scholar] [CrossRef]
- Bharadwaj, S.; Van Der Vegt, N.F.A. Does preferential adsorption drive cononsolvency? Macromolecules 2019, 52, 4131–4138. [Google Scholar] [CrossRef]
- Zuo, T.; Ma, C.; Jiao, G.; Han, Z.; Xiao, S.; Liang, H.; Hong, L.; Bowron, D.; Soper, A.; Han, C.C.; et al. Water/cosolvent attraction induced phase separation: A molecular picture of cononsolvency. Macromolecules 2019, 52, 457–464. [Google Scholar] [CrossRef]
- Bharadwaj, S.; Nayar, D.; Dalgicdir, C.; Van Der Vegt, N.F.A. An interplay of excluded-volume and polymer-(co)solvent attractive interactions regulates polymer collapse in mixed solvents. J. Chem. Phys. 2021, 154, 134903. [Google Scholar] [CrossRef] [PubMed]
- Dudowicz, J.; Freed, K.F.; Douglas, J.F. Communication: Cosolvency and cononsolvency explained in terms of a Flory-Huggins type theory. J. Chem. Phys. 2015, 143, 131101. [Google Scholar] [CrossRef] [PubMed] [Green Version]
- Bruce, E.E.; Van Der Vegt, N.F.A. Molecular scale solvation in complex solutions. J. Am. Chem. Soc. 2019, 141, 12948–12956. [Google Scholar] [CrossRef]
- Van Der Vegt, N.F.A. Length-scale effects in hydrophobic polymer collapse transitions. J. Phys. Chem. B 2021, 125, 5191–5199. [Google Scholar] [CrossRef]
- Budkov, Y.A.; Kiselev, M.G. Flory-type theories of polymer chains under different external stimuli. J. Phys. Condens. Matter 2018, 30, 043001. [Google Scholar] [CrossRef]
- Kojima, H.; Tanaka, F. Reentrant volume phase transition of crosslinked poly(N-isopropylacrylamide) gels in mixed solvents of water/methanol. Soft Matter 2012, 8, 3010–3020. [Google Scholar] [CrossRef]
- Grinberg, V.Y.; Burova, T.V.; Grinberg, N.V.; Moskalets, A.P.; Dubovik, A.S.; Plashchina, I.G.; Khokhlov, A.R. Energetics and mechanisms of poly(N-isopropylacrylamide) phase transitions in water-methanol solutions. Macromolecules 2020, 53, 10765–10772. [Google Scholar] [CrossRef]
- Zhang, X.; Zong, J.; Meng, D. A unified understanding of the cononsolvency of polymers in binary solvent mixtures. Soft Matter 2020, 16, 7789–7796. [Google Scholar] [CrossRef] [PubMed]
- Kawasaki, H.; Nakamura, T.; Miyamoto, K.; Tokita, M.; Komai, T. Multiple volume phase transition of nonionic thermosensitive gel. J. Chem. Phys. 1995, 103, 6241–6247. [Google Scholar] [CrossRef]
- Gao, H.; Zhao, Z.; Cai, Y.; Zhou, J.; Hua, W.; Chen, L.; Wang, L.; Zhang, J.; Han, D.; Liu, M.; et al. Adaptive and freeze-tolerant heteronetwork organohydrogels with enhanced mechanical stability over a wide temperature range. Nat. Commun. 2017, 8, 15911. [Google Scholar] [CrossRef] [PubMed]
- Quesada-Perez, M.; Maroto-Centeno, J.A.; Forcada, J.; Hidalgo-Alvarez, R. Gel swelling theories: The classical formalism and recent approaches. Soft Matter 2011, 7, 10536–10547. [Google Scholar] [CrossRef]
- Aseyev, V.; Tenhu, H.; Winnik, F.M. Non-ionic thermoresponsive polymers in water. Adv. Polym. Sci. 2011, 242, 29–89. [Google Scholar]
- Halperin, A.; Kroger, M.; Winnik, F.M. Poly(N-isopropylacrylamide) phase diagrams: Fifty years of research. Angew. Chem. Int. Ed. 2015, 54, 15342–15367. [Google Scholar] [CrossRef]
- Tavagnacco, L.; Zaccarelli, E.; Chiessi, E. On the Molecular Origin of the Cooperative Coil-to-globule Transition of Poly(N-isopropylacrylamide) in Water. Phys. Chem. Chem. Phys. 2018, 20, 9997–10010. [Google Scholar] [CrossRef] [Green Version]
- Kurzbach, D.; Junk, M.J.N.; Hinderberger, D. Nanoscale inhomogeneities in thermoresponsive polymers. Macromol. Rapid Commun. 2013, 34, 119–134. [Google Scholar] [CrossRef]
- Flory, P.J.; Rehner, J. Statistical mechanics of cross-linked polymer networks II. Swelling. J. Chem. Phys. 1943, 11, 521–526. [Google Scholar] [CrossRef]
- Drozdov, A.D. Self-oscillations of hydrogels driven by chemical reactions. Int. J. Appl. Mech. 2014, 6, 1450023. [Google Scholar] [CrossRef]
- Drozdov, A.D. Mechanical behavior of temperature-sensitive gels under equilibrium and transient swelling. Int. J. Eng. Sci. 2018, 128, 79–100. [Google Scholar] [CrossRef]
- Mochizuki, K.; Ben-Amotz, D. Hydration-shell transformation of thermosensitive aqueous polymers. J. Phys. Chem. Lett. 2017, 8, 1360–1364. [Google Scholar] [CrossRef]
- Drozdov, A.D.; deClaville Christiansen, J. Equilibrium swelling of thermo-responsive copolymer microgels. RSC Adv. 2020, 10, 42718–42732. [Google Scholar] [CrossRef] [PubMed]
- Drozdov, A.D. Equilibrium swelling of biocompatible thermo-responsive copolymer gels. Gels 2021, 7, 40. [Google Scholar] [CrossRef]
Figure 1.
Equilibrium degree of swelling Q versus volume fraction of cosolvent. Circles: experimental data PNIPAAm gel in water/methanol mixture at temperature C [20]. Solid lines: results of numerical analysis. Arrow indicates the volume phase transition points.
Figure 1.
Equilibrium degree of swelling Q versus volume fraction of cosolvent. Circles: experimental data PNIPAAm gel in water/methanol mixture at temperature C [20]. Solid lines: results of numerical analysis. Arrow indicates the volume phase transition points.

Figure 2.
Equilibrium degree of swelling Q versus volume fraction of methanol in water/methanol mixture. Circles: experimental data [25] on PNIPAAm gel at temperatures (A), (B) and C (C). Solid lines: results of numerical analysis. Arrows indicate the phase transition points.
Figure 2.
Equilibrium degree of swelling Q versus volume fraction of methanol in water/methanol mixture. Circles: experimental data [25] on PNIPAAm gel at temperatures (A), (B) and C (C). Solid lines: results of numerical analysis. Arrows indicate the phase transition points.

Figure 3.
Equilibrium degree of swelling Q versus temperature T. Circles: experimental data on PNIPAAm gel ((A)—[63]) and microgels ((B)—[30], (C)—[40]) in water. Solid lines: results of numerical analysis. Arrows indicate the volume phase transition points.
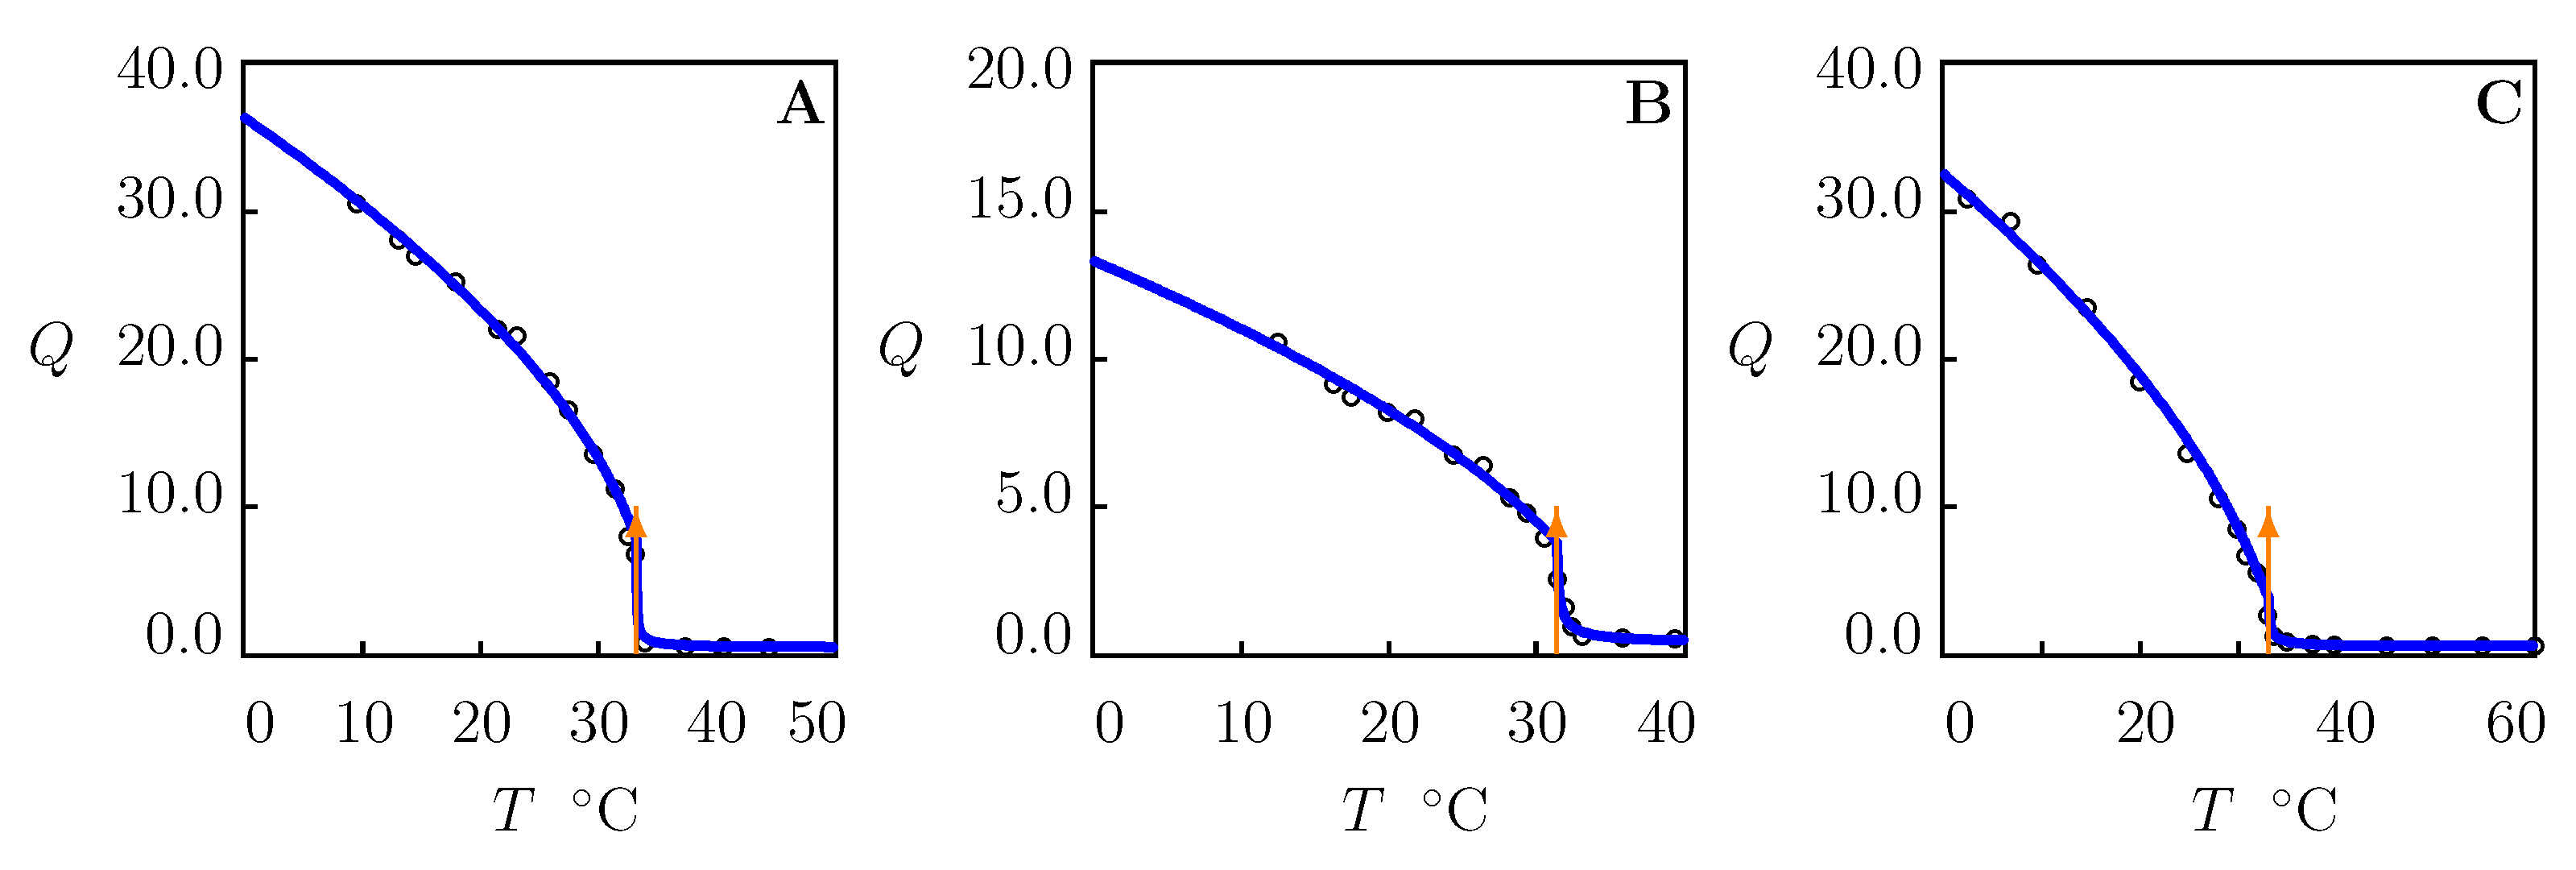
Figure 4.
Equilibrium degree of swelling Q versus volume fraction of methanol (A) and ethanol (B). Circles: experimental data [30] on PNIPAAm microgel in water/alcohol mixtures at temperature C. Solid lines: results of numerical analysis. Arrows indicate the volume phase transition points.
Figure 4.
Equilibrium degree of swelling Q versus volume fraction of methanol (A) and ethanol (B). Circles: experimental data [30] on PNIPAAm microgel in water/alcohol mixtures at temperature C. Solid lines: results of numerical analysis. Arrows indicate the volume phase transition points.
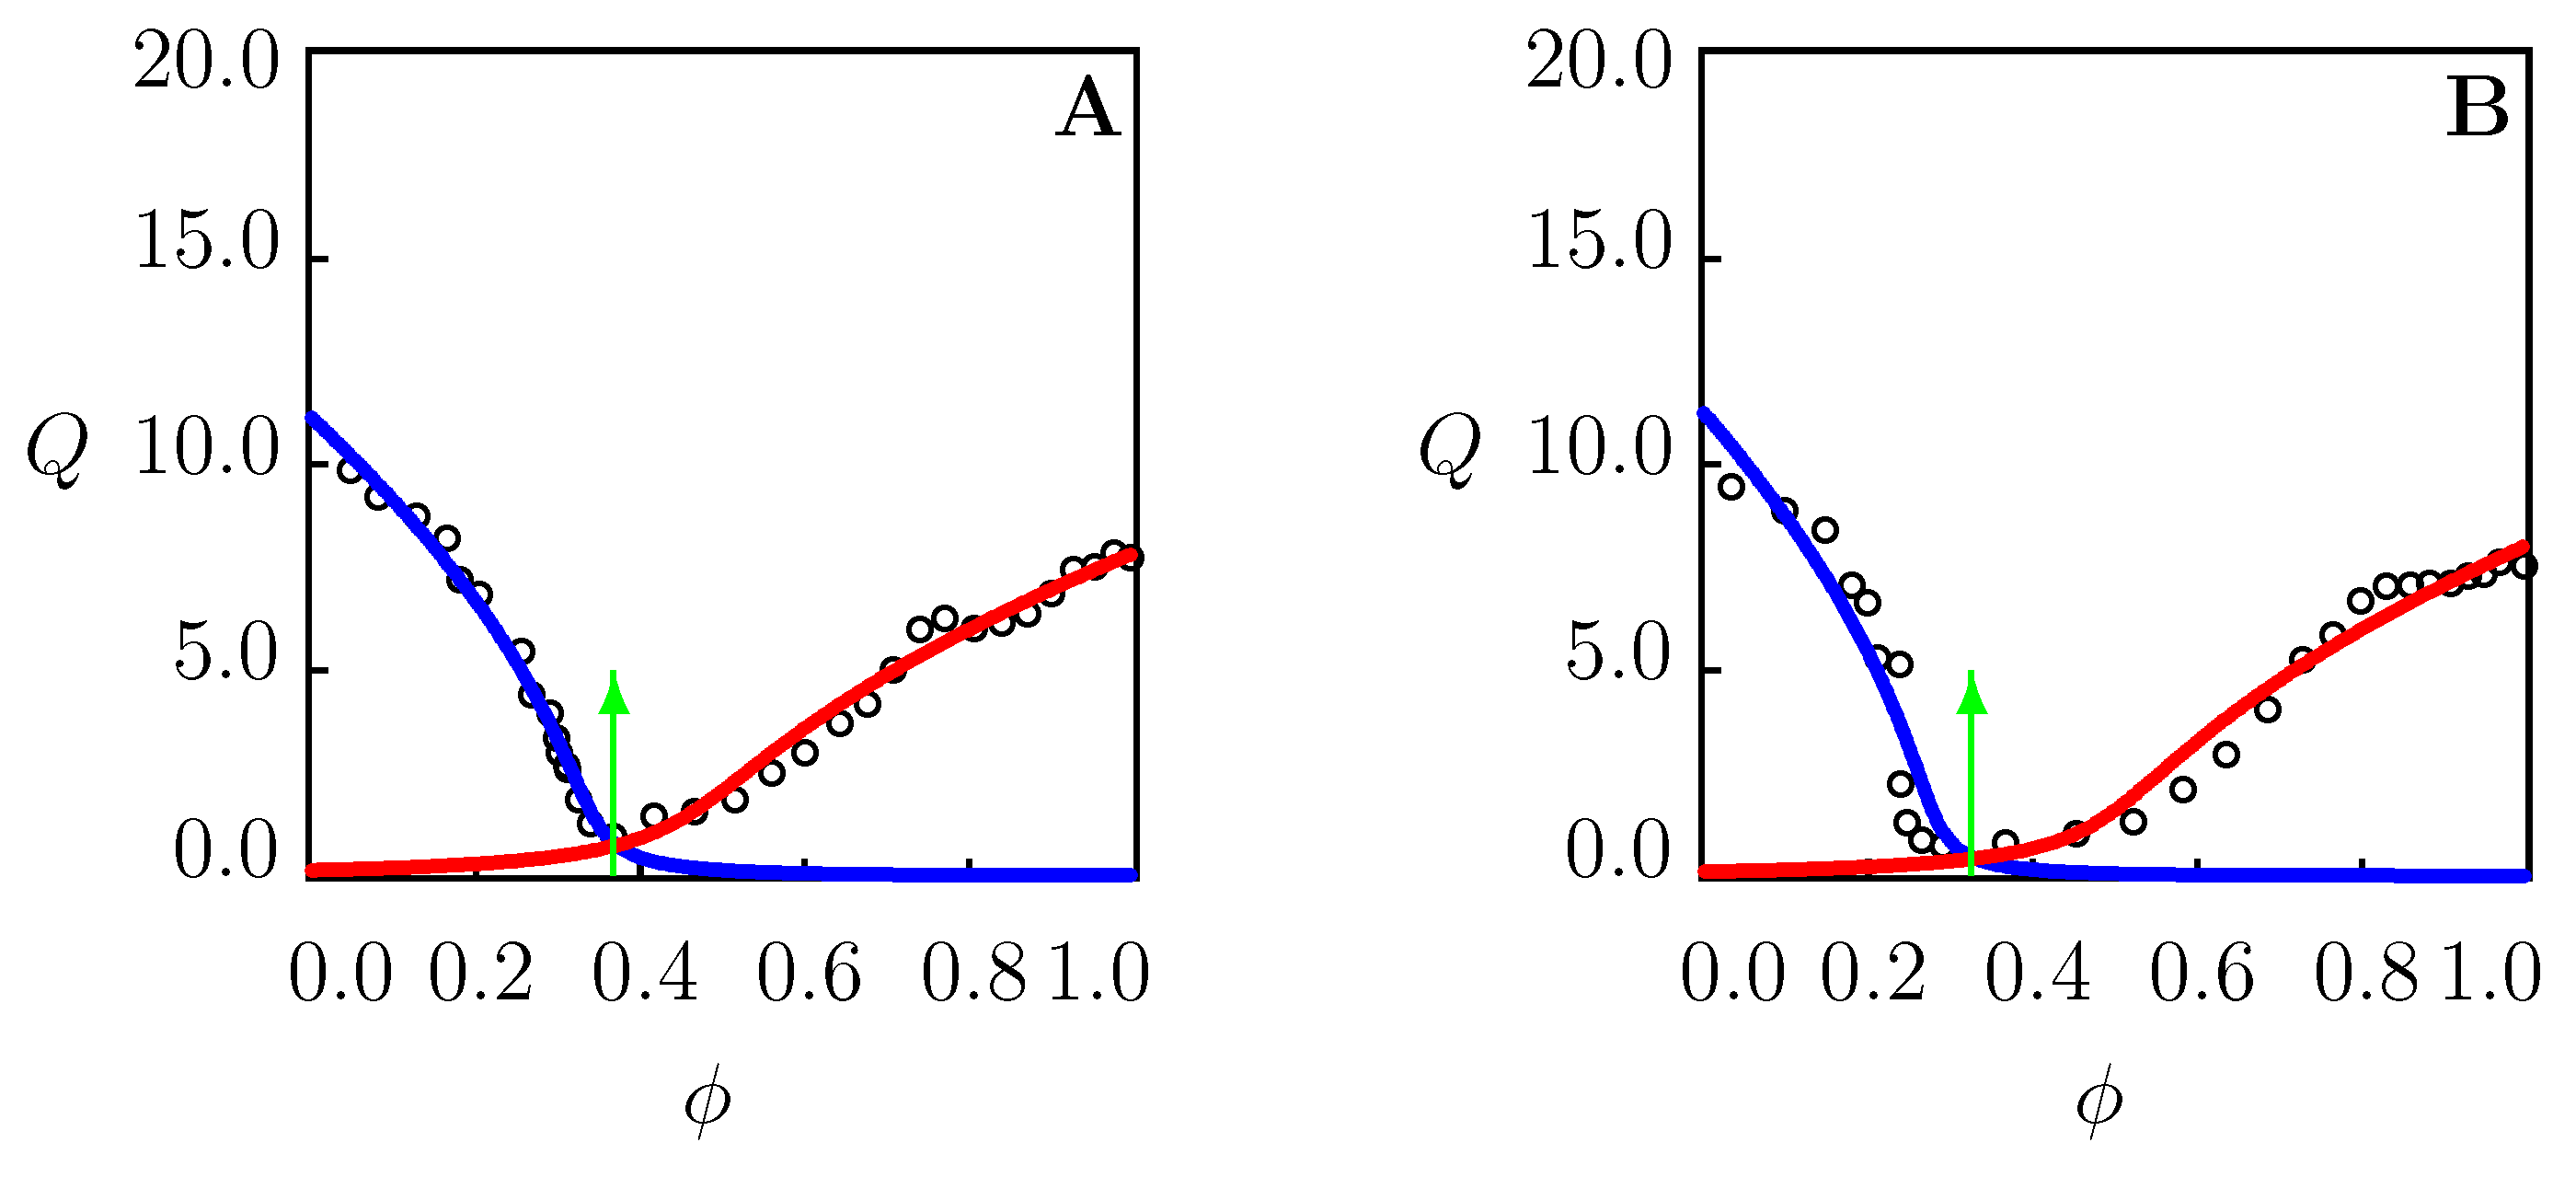
Figure 5.
Equilibrium degree of swelling Q versus volume fraction of DMF in water/DMF mixture. Circles: experimental data [40] on PNIPAAm microgel at temperatures (A), (B), and C (C). Solid lines: results of numerical analysis. Arrows indicate the volume phase transition points.
Figure 5.
Equilibrium degree of swelling Q versus volume fraction of DMF in water/DMF mixture. Circles: experimental data [40] on PNIPAAm microgel at temperatures (A), (B), and C (C). Solid lines: results of numerical analysis. Arrows indicate the volume phase transition points.

Figure 6.
Equilibrium degree of swelling Q versus volume fraction of methanol in water/methanol mixture. Circles: experimental data [28] on PNIPAAm gel at temperatures (A), (B), and C (C). Solid lines: results of numerical analysis. Arrows indicate the volume phase transition points.
Figure 6.
Equilibrium degree of swelling Q versus volume fraction of methanol in water/methanol mixture. Circles: experimental data [28] on PNIPAAm gel at temperatures (A), (B), and C (C). Solid lines: results of numerical analysis. Arrows indicate the volume phase transition points.

Figure 7.
Equilibrium degree of swelling Q versus volume fraction of dioxane in water/dioxane mixture. Circles: experimental data [37] on PNIPAAm gels at temperatures (A) and C (B). Solid lines: results of numerical analysis. Arrows indicate the volume phase transition points.
Figure 7.
Equilibrium degree of swelling Q versus volume fraction of dioxane in water/dioxane mixture. Circles: experimental data [37] on PNIPAAm gels at temperatures (A) and C (B). Solid lines: results of numerical analysis. Arrows indicate the volume phase transition points.

Figure 8.
Equilibrium degree of swelling Q versus volume fraction of cosolvent. Circles: experimental data in swelling tests at temperature C. Solid lines: results of numerical analysis. Arrows indicate the volume phase transition points. (A)—PNIPAAm gel in water/dioxane mixture [36]. (B)—PNIPAAm gel in water/DMSO mixture [42]. (C)—PNIPAAm gel in aqueous solution of PEG-200 [41].
Publisher’s Note: MDPI stays neutral with regard to jurisdictional claims in published maps and institutional affiliations. |
© 2022 by the authors. Licensee MDPI, Basel, Switzerland. This article is an open access article distributed under the terms and conditions of the Creative Commons Attribution (CC BY) license (https://creativecommons.org/licenses/by/4.0/).
Share and Cite
MDPI and ACS Style
Drozdov, A.D.; de Claville Christiansen, J. Equilibrium Swelling of Thermo-Responsive Gels in Mixtures of Solvents. Chemistry 2022, 4, 681-700. https://doi.org/10.3390/chemistry4030049
AMA Style
Drozdov AD, de Claville Christiansen J. Equilibrium Swelling of Thermo-Responsive Gels in Mixtures of Solvents. Chemistry. 2022; 4(3):681-700. https://doi.org/10.3390/chemistry4030049
Chicago/Turabian StyleDrozdov, Aleksey D., and Jesper de Claville Christiansen. 2022. "Equilibrium Swelling of Thermo-Responsive Gels in Mixtures of Solvents" Chemistry 4, no. 3: 681-700. https://doi.org/10.3390/chemistry4030049