Traditional Nomadism Offers Adaptive Capacity to Northern Mongolian Geohazards


Department of Geography, George Washington University, Washington, DC 20052, USA
*
Author to whom correspondence should be addressed.
GeoHazards 2023, 4(3), 328-349; https://doi.org/10.3390/geohazards4030019
Submission received: 13 May 2023
/
Revised: 24 July 2023
/
Accepted: 2 August 2023
/
Published: 11 August 2023
Abstract
:Mongolia’s northernmost province, Khövsgöl Aimag, famous for its massive Lake Khövsgöl set among the mountainous steppe, taiga, and tundra forests, increasingly attracts both domestic and international tourists. Before the COVID-19 pandemic, Mongolia received over 500,000 tourists annually. The aimag is also home to Indigenous, nomadic Dukha reindeer herders and semi-nomadic Darkhad cattle herders. Using a multidisciplinary approach, this study uses an analytical hierarchy process to map areas in Khövsgöl Aimag, where the infrastructure, including buildings, dwellings, formal and informal roads, and pastureland, is subject to geohazards. The hazards of interest to this mapping analysis include mass wasting, flooding, and permafrost thawing, which threaten roads, pastures, houses, and other community infrastructure in Khövsgöl Aimag. Based on the integrated infrastructure risk map, an estimated 23% of the aimag is at high to very high risk for localized geohazards. After a discussion of the results informed by the interviews, mobile ethnographies, and local and national land use policies, we postulate that communities exercising more traditional nomadic lifestyles with higher mobility are more resilient to these primarily localized geohazards.
1. Introduction and Study Area
Khövsgöl Aimag is Mongolia’s northernmost province bordering the Russian Tuva and Buryatia Republics (Figure 1). This province is characterized by a Monsoon-influenced subarctic (Dwc Köppen–Geiger Climate Classification) to polar tundra climates (ET). The climate of the Eastern Sayan and Horidol Saridag Mountains, and particularly Lake Khövsgöl, Mongolia’s largest freshwater lake, attracts domestic and international tourists seeking steppe, boreal forests, taiga, and alpine tundra [1]. In 2019, prior to the COVID-19 pandemic, Mongolia received over 500,000 tourists annually [2] and experienced its most profitable year to date as tourism accounted for 7.2% of its GDP [3]. The boreal forests that comprise the taiga landscape are home to diverse mammals, birds, and fishes, including endangered and endemic species such as the Hovsgol grayling fish [1,4]. Several Indigenous nomadic and nonmigratory groups reside in the aimag, including the Dukha and Darkhad peoples, who depend on the region’s biodiversity for subsistence- and herding-based livelihoods. The Dukha, or Tsaatan in Mongolian, is a minority Tuvan-speaking group of about 200 semi-nomadic reindeer herders from the northwestern mountains in Khövsgöl Aimag [1,5,6]. Reindeer provide dairy products, meat, hides, and transportation to Dukha [6], as well as cultural and spiritual underpinnings of their culture [7]. Dukha communities move their camps two or more times a year to accommodate their reindeer herds’ forage needs, which mainly center on the availability and quality, particularly of moss and lichen varieties [6,8,9]. Ortzen ger, often shortened to ortz, have structures similar to traditional North American tipis (Figure 2a), constructed from slim trees to create a conical structure usually covered in hide, bark, or commercial canvas provided by the regional government or purchased in villages [6]. Ortz poles and other heavy objects are often left at campsites when Dukha communities move to reuse and return to their herds the following year [6].
Dukha herders are largely divided into two groups based on territory: one in the Baruun (western) Taiga and the other group in the Zuun (eastern) Taiga [9]. During the summer months, Dukha encampments are usually larger and denser as they move their herds to higher, cooler elevations. In the fall and winter, encampment groups are much smaller and tend to be more mobile as families move to lower elevations near Tsagaannuur [6,9].
Another Indigenous group to Khövsgöl Aimag is the Mongolian-speaking Darkhad. The Darkhad neighbors and the Dukha communities form the majority of the population in the mountain steppe valleys west of Lake Khövsgöl, namely the Darkhad Depression [1,10]. The Darkhad are largely shamanistic pastoralists, who herd cattle, sheep, yak, horses, and/or camels in or near Darkhad Valley villages of Bayanzürkh, Ulaan-Uul, Renchinlkhümbe, and parts of Tsagaannuur. Darkhad families typically reside in gers (also called yurts outside of Mongolia), which can be assembled and disassembled to seasonally migrate with herds (Figure 2b).
Non-Indigenous Mongolians in Khövsgöl generally reside in the two largest towns in the aimag, Mörön and Khatgal. These towns have more fixed infrastructure, such as single- to two-story wood or brick buildings and paved roads (Figure 2c). There is increased vehicle traffic and active development in Mörön and Khatgal, primarily fueled by a growing tourism sector. Fixed infrastructure is also increasingly common in smaller communities throughout the Darkhad Valley, and in winter, Dukha communities are encouraged to move into settlements through national and regional financing programs [11,12].
In an effort to preserve Mongolian environments, a series of laws establishing and enforcing special protected areas were enacted (Figure 1). Combined, these areas cover about 36% (36,226 km2) of Khövsgöl Aimag, where 77% (27,871 km2) are nationally protected areas and the remaining 23% (8355 km2) are locally protected. Mongolia has a long history of environmental protection, likely predating the hunting preserves established by Genghis Khan in the 12th century [13]. However, the Mongolian communist government significantly contributed to environmental degradation from 1921 to 1990 [14]. Mongolia’s democratic transition in 1992 and the adoption of the new constitution provided legal frameworks for environmental protection in the country. Arguably, the most notable Mongolian environmental protection law was the 1994 Law on Special Protected Areas, which defined and regulated zones to protect and preserve local biodiversity and culture and provide greater opportunities to study these ecosystems [15]. This law designated national conservation parks, strictly protected areas, natural reserves, and national monument areas funded by local government budgets, private donations, tourism revenue, and liability fees. Each protected designation involves specific limits regarding access and usage [15]. In addition to nationally protected areas, governors at the aimag and sum administrative levels also have the authority to implement policies and request additional protected areas for typically five-year cycles. Locally protected area borders are known for shifting often.
Shortly after the Law on Special Protected Areas was created, the 1997 Mongolian Law on Buffer Zones was enacted, establishing environmental protection standards surrounding any protected areas. Buffer zones are introduced at the local and regional levels and then formally approved by the State Administrative Central Organization. Buffer zone borders can also shift as new local protected areas are re-drawn and established [16].
Khövsgöl Aimag contains three National Parks, two Strictly Protected Areas, and one Nature Monument created and regulated by this law. Today, two-thirds of the land used by the nomadic communities is now designated as the Tengis Shishged National Park. Not only are these communities limited in where they can live and migrate as a result of the Law on Special Protected Areas, but numerous ordinances further inhibit their daily lives. Hunting, trapping, or disturbing animals in these protected zones is prohibited, as well as establishing a seasonal nomadic encampment or grazing livestock without an appropriate permit [15]. Traditional reindeer herding and pasturelands and subsistence activities, including hunting, are becoming increasingly restricted for Indigenous peoples despite the use of these lands and practices for millennia [10]. For instance, the Dukha are related to Siberian Tuvan reindeer herders, but when the Russian-Mongolian border closed in 1944 their interactions and migrations across the border ceased [1,6]. Additionally, hunting, among other traditional land uses, is prohibited within the Tengis-Shishged National Park that encompasses the East and West Taiga areas where they migrate herds annually [6].
Land use, particularly development across the aimag, is complicated by climate change. By 2050, Khövsgöl’s temperatures are expected to rise by 2.4–2.9 °C, and weather events will be more unpredictable as seasonal precipitation and evaporation increase, causing the region to become warmer and drier [17]. Warming temperatures are expected to be the most extreme west of Khövsgöl Lake [17]. Geohazards pose threats to all these communities, but climate-induced hazards, such as those associated with thawing permafrost, are expected to increase in frequency and severity [17]. There is limited existing research on the natural hazards or disasters of Khövsgöl Aimag. Research on the greater region has focused on neighboring regions in Russia’s South Siberia, including Lake Baikal [18,19,20,21]. Prior research from proximal areas, however, does not consider variable impacts on the diverse communities present. This paper presents a geohazard risk map for Khövsgöl Aimag, identifying areas where infrastructure, including buildings, dwellings, formal and informal roads, and pastureland are most at risk of geohazards like mass wasting, flooding, and permafrost thawing.
2. Materials and Methods
This research takes a holistic, multidisciplinary approach to assessing regional geohazard risk using both qualitative and quantitative methods. Mobile ethnographies and semi-structured interviews were conducted in June–July 2022 in Mörön, Bayanzürkh, Ulaan-Uul, Tsagaannuur, a Dukha reindeer herding summer camp, and Khatgal to understand and document recent geohazards, general distribution, prevalence, and community impacts. The knowledge gained from site visits informed a series of hazard risk maps generated to identify geohazard “hotspots” in the aimag. Geohazard risk assessment maps for three infrastructure hazards, namely (1) mass wasting, (2) flooding, and (3) permafrost thawing, were created and then integrated into a final hazard risk assessment map. Finally, a textual analysis of Mongolian legal frameworks was completed to further frame the findings of this study and its implications for local and Indigenous communities.
2.1. Semi-Structured Interviews and Mobile Ethnographies
Mobile ethnographies were performed in the field to understand at a deeper level how one’s reality makes sense to them and has meaning in their living settings. Ethnographic observations were conducted using various forms of transportation, including privately hired vans, ferries, horseback, and walking, to observe and discuss daily activities in context. This ethnographic approach builds rapport and helps researchers understand the relationships between individuals and their physical and social environments through experiential learning [22,23]. Topics like hazards and strict land protections were explored during the fieldwork observations and informed subsequent interviews.
Interviews are a common data collection method [24], with semi-structured interviews being one of the most frequently used techniques in qualitative research [25,26,27]. Importantly, the semi-structured interview method is successful in promoting reciprocity between the interviewer and the interviewee [27,28] as the interviewer can ask follow-up questions based on freely expressed responses [29].
Interview questions were organized into a flexible guide or a general list of questions and topics in order of introduction in an interview, based on prior knowledge of the research area and objective. The main goal of using the semi-structured interview method was to collect information, while also providing the interviewee with guidance on what to discuss [27,30]. In particular, the guide included questions about subsistence activities, infrastructure, hazards experienced, and any existing policies and regulations regarding land management.
For this research, 15 semi-structured interviews with Drakhad and Dukha cattle and reindeer herders, teachers, and public officials were conducted in the study area using paper-based note-taking techniques and audio recordings with permission to ensure open-ended questions, and discussions were thoroughly documented for later transcription and translation. Interviews were largely conducted in Mongolian with the assistance of a Mongolian-Russian translator. Interviews were transcribed in Russian and translated into English with assistance from native speakers, Google Translate, and the neural machine translation service, DeepL Translator. Translated interview transcripts were then thematically coded by the following topics: (1) geohazards, (2) Indigenous people’s governance, (3) infrastructure, (4) subsistence, (5) environmental problems, (6) climate change, (7) cattle herding, (8) landscape, and (9) federal and local protected areas.
2.2. Indigenous Knowledge-Informed Geohazard Mapping
Informed by examples described in interview testimony, and documented during mobile ethnographies, three generalized geohazard maps were produced, namely (1) mass wasting, (2) flooding, and (3) permafrost thawing, using Thomas Saaty’s [31] Analytical Hierarchy Process (AHP) between Microsoft Excel [32] and Geographic Information System (GIS) environments [33]. The AHP is a quantitative multi-criteria decision-making method that incorporates variable importance in spatial analyses through ranking and weights. The slope, flooding, and permafrost hazard maps were integrated to produce a generalized geohazard map highlighting hazard-prone areas, or “hotspots”, across the aimag (100,628.8 km2) using a geospatial overlay as outlined in Figure 3.
2.2.1. Data Acquisition and Preprocessing
Land Cover and Land Use (LCLU) are major factors influencing susceptibility to geohazard development. This study utilized the 30 m resolution classification of Mongolia published by Wang et al. in 2022 [34]. This product classifies Mongolia’s terrain into forest, meadow steppe, real steppe, desert steppe, barren land, sand, desert, ice, water, cropland, and built areas. The raster dataset was clipped to Khövsgöl Aimag, which included the forest, steppe (meadow, real, and desert varieties), barren land, water cropland, and built area categories. The eight categories were reclassified by rank as part of the AHP method. Water was given a low ranking because hydrology was incorporated into alternative spatial data sources (see subsequent descriptions). The real and meadow steppe classes were grouped and classified separately as they are generally more vegetated than desert steppe. Desert steppe was given a higher risk ranking than the other steppe classes because the lack of vegetation stabilizing unconsolidated materials and promoting precipitation infiltration increases the likelihood of mass wasting. This land cover and land use criteria were used in all three risk assessments.
A Digital Elevation Model (DEM) was obtained from DIVA-GIS (a free spatial data repository) that provided coverage for the entire aimag at 30 m resolution [35]. Continuous elevations, slope, and drainage density variables were calculated in ArcGIS Pro [33] using this input. Elevation controls the flow and pooling of water [36,37]. DEM elevations were reclassified into five categories from low (<1600 m.a.s.l.) to high (>2200 m.a.s.l.). Drainage density was calculated by applying the “fill”, “flow accumulation”, and “stream order” tools to the DEM within the ArcPro Spatial Analyst module. The outputs of these geoprocessing tools were reclassified into drainage densities, where high-density areas were assigned greater weights for the AHP as they were more prone to flooding. The ArcGIS Spatial Analyst “slope” tool yielded gradients from 0 to 24.7° across Khövsgöl. The slope is a causal factor in mass wasting [38,39,40], flooding [36,41], and permafrost thawing [42]. The slope was reclassified into five classes using Jenks natural breaks to minimize variance within and maximize the variance between clustered data for all three risk assessments.
Proximity to faults is an important factor to account for considering earthquakes that trigger mass movements and Khövsgöl Aimag’s seismic activity. Since 2000, the region has experienced over 100 earthquakes of primarily 3–4 Richter values [43]. In 2021, there was a 6.7 magnitude earthquake with an epicenter on Lake Khövsgöl’s western shore [44]. The vector-format fault lines were downloaded from the USGS Geodynamics Map of Northeast Asia. Faults within the aimag were extracted from the vector-format Geodynamics Map of Northeast Asia, available for download via the US Geological Survey [45], and the ArcGIS Pro “Euclidean distance” tool was used to create 20 km buffers for each line.
Proximity to roads, many of which are informal or used and maintained by locals without government-sponsored maintenance, is a well-documented anthropogenic factor contributing to mass wasting [38,39,46]. A vector file containing known roads in the region was obtained from OpenStreetMap (OSM). The roads within the Khövsgöl Aimag were extracted and five buffers of 0.5, 1, 2.5, and 10 km were applied using the Euclidean distance tool.
Proximity to waterbodies is an important factor for potential mass wasting and flooding events [38,47]. Stream course vector data were downloaded from DIVA-GIS and sourced from the Digital Chart of the World [48]. Five buffers in 5000 m increments were created using the Euclidean distance tool. Closer proximity to streams is more likely to experience mass wasting due to hydraulic action undercutting stream banks [49] and gully erosion [49,50]. Flood hazards incorporated both proximity to streams and proximity to standing waterbodies using the same buffering methodology applied to vector-based lakes downloaded from DIVA-GIS and sourced from the Digital Chart of the World [48]. Areas nearer to waterbodies were weighted for higher flood risks [36].
Permafrost zonation and mean annual ground temperature, as modeled by Obu et al. [51] at 1 km resolution, were downloaded from the Pangea digital data library. These datasets were clipped to the aimag boundary. These raster-based datasets were reclassified, where decreased permafrost continuity and warmer mean annual ground temperatures represented areas at increased risk of thawing. Continuous, discontinuous, sporadic, and isolated permafrost classifications were all present within the aimag, and these four classes were maintained but given ordinal rankings. The mean annual ground temperatures were classified into 10 clusters using Jenks natural breaks to show natural breaks in the temperature data.
2.2.2. Analytical Hierarchy Process (AHP), Map Integration, and Validation
The first step in the AHP method is to break down a spatial problem into a definable hierarchy, identifying appropriate (sub)criteria for the pairwise comparison matrices. The matrix components are ranked on a nine-point importance scale. For example, two criteria ranked with a value of one indicate equal influence on geohazard development, a value of nine represents strong importance over one variable, and less important variables are valued using the inverse [31]. Pairwise comparison tables were generated for mass wasting, flooding, and permafrost thawing (Table 1, Table 2 and Table 3, respectively).
The resulting matrices were normalized by summing the values in each column of the pairwise matrix using Equation (1):
Next, each matrix element was divided by its respective column total to create a normalized pairwise matrix (see Equation (2)). Mass wasting and flood pairwise comparisons used 5 × 5 matrices, whereas permafrost thaw used a 4 × 4 matrix.:
For a weighted matrix, the sum of each column in the normalized matrix was divided by the number of criteria:
Consistency ratios (Cr) were then calculated for each hazard map using the consistency index (CI) to ensure that initial preference weightings in the pairwise matrix were consistent and balanced. CIs were first generated by multiplying each column of the pairwise comparison matrix by its assigned weight:
Then, the sums of pairwise rows were divided by weights using:
and λ was calculated by averaging the value of the consistency measure using Equation (6):
The consistency index (CI) was determined by subtracting the average from the number of criteria (n) and dividing it by the number of criteria (n) − 1.
The final consistency ratios (Cr) were calculated using Equation (8) by dividing the consistency index (CI) by the appropriate random inconsistency indices (RI) depending on the sample size (i.e., the number of input criteria) (Table 4).
Once criterion weights were determined for the input criteria within each hazard risk assessment, the input criteria were reclassified from very low to extremely high risk according to class boundaries in Table 5, Table 6 and Table 7 for mass wasting, flooding, and permafrost thawing risk, respectively.
This study used the Mavic Pro 2 drone unmanned aerial vehicle (UAV), produced by DJI, to capture high-resolution images at different scales of the study area for GIS analysis validation and to contextualize landscape descriptions from interviews. The UAV has a rotary wing and a 1-inch CMOS sensor, FOV 77°, a focal length of 35 mm (equivalent to 28 mm), an aperture of F/2.8–F/11, and a shutter speed of 8 s−1/8000 s making it appropriate for documenting localized phenomena while also conducting mobile ethnographies. Additionally, the rotary-wing UAV design was advantageous given its vertical take-off and hover capabilities [52]. This design also makes it compact and easy to stow. The UAV uses both GPS and GLONASS Global Navigation Satellite Systems (GNSS) and is accurate within ±1.5 m.
3. Results
The ethnographies and semi-structured interviews conducted in this study highlighted residents’ concerns about localized geohazards. For instance, a municipal representative in Tsagaannuur said on 15 June 2022, “The mountains up here were green 20–30 years ago, now the vegetation is lower.” The same participant also remarked on observing expanding arid regions and reduced alpine taiga and lichens due to weathering, slope movement, and erosion processes.
Vegetation cover in this region has consistently decreased nomadic herders, in addition to having fewer grazing locations for their reindeer, as explained by one Dukha woman, “…There is very little reindeer moss there, and the pastures are of poor quality. That’s why the Tsaatans moved here” (Dukha camp, 17 June 2022). Some communities have had to relocate to areas that may not have traditionally been part of their migration paths.
A second emergent theme is the growing number of road networks and their impact on the landscape. The same municipal representative in Tsagaannuur points out, “A lot of roads are popping up in our area because of tourists and it is a big problem for the landscape.” (15 June 2022). While animals, like horses and reindeer, still play an important role in local transportation, the increase in domestic and foreign tourism contributes to increasing vehicle traffic from tour services. Pre-existing animal trails are also used for motor vehicles; in addition, drivers are forging their own paths, resulting in several parallel vehicle tracks that disrupt the surrounding steppe landscapes. Few roads are paved outside of larger population centers, and some Soviet gravel roads remain intact, but roads are largely informal and usually worn into the Earth [10].
A teacher in Bayanzürkh stated, “We do not distinguish [between] official and unofficial roads. The road is where it is convenient to go.” (13 June 2022). Although Khövsgöl still has little fixed transportation infrastructure, both formal and informal road networks are equally susceptible to geohazards that affect soil integrity like erosion, karst, and thermokarst. The same teacher explains, “We need a dirt road. Soil degradation in recent years is increasing a lot…Different soil problems appear…permafrost thaws quickly. It freezes then in autumn and there are a lot of cracks because of this. After that there is little vegetation cover.” (Bayanzürkh, 13 June 2022). However, the utilization of informal roads provides more flexibility in adapting to local conditions and geohazards because these roads are created as needed.
A third emerging theme is related to protected lands. Local and National laws protect certain lands within the aimag, which inhibit activities like hunting and fishing by simply not allowing such activities to occur, or by complicating the process to secure permits. One Dukha woman explains, “Hunting is forbidden. When we were children, their parents hunted sable and other furbearers [and] roe deer…Now wild animals are few and live far away in the taiga. Because of the noise, wild animals live far away. Bears were seen far away, deer, [and] sable. If they are hunted, no one buys [it] because it is forbidden.” (Woman, 70, Dukha camp, 17 June 2022). A Dukha man elaborates on the restrictions in protected areas, “You can’t [fish]. [streams and rivers] are monitored by border guards, nature reserve workers, Sum department. They monitor them very strictly. So, we can’t do anything here.” (Male, 50, Dukha camp, 14 June 2022). This restriction on the use of subsistence resources increases dependence on outside markets and makes communities vulnerable to hazards affecting transportation for delivery of goods and general accessibility.
Hazard mapping, inspired by the results gathered from mobile ethnographies and interview testimony, informed the production of the three risk maps. Figure 4 shows the component mass-wasting risk map, where areas indicated as very high risk are those with little to no vegetation on steep slopes close to fault lines, rivers, and roads.
A total of 45,392 km2 (45% of the aimag) was identified as having a high to very high risk of mass-wasting processes in Khövsgöl Aimag. The areas most at risk for mass wasting events, including karst development, are largely in the Sayan Mountains in the Tengis-Shishged National Park and Ulaan Taiga Strictly Protected Area.
Figure 5 shows the component flood risk map, where areas with sparse vegetation, minimal slope, and high drainage density, in relatively low-elevation positions close to existing waterbodies, were classified as having a very high risk of flooding. The flood risk map highlights 28,861 km2 (28% of the aimag) as high to very high-risk areas, the majority of which are in Dakhard Valley, one of the flattest and lowest areas in the aimag bounded by the Altai-Sayan Mountains, and a series of lake chains fed by the Shishged River. Communities around Lake Khövsgöl are also at a high risk of flooding, particularly Khatgal, the aimag’s second largest town. The main road from Khatgal south to the aimag’s largest town, Mörön, crosses a large drainage basin and is classified as having high flood risk.
Figure 6 shows the component permafrost thawing risk map, where relatively warm, sporadic, or isolated permafrost with little or no vegetation cover on steep slopes was classified as having the highest risk for geohazards related to permafrost thaw. A total of 30,139 km2 (30% of the aimag) was classified as having high to very high permafrost thawing risk, the majority of which is to the southeast, including the largest community in the aimag, Mörön.
Figure 7 shows the on-the-ground photos and drone imagery collected. The images were georeferenced to locations on the final hazard risk map. The following six examples of localized geohazards were all located in areas estimated by the AHP spatial analysis as high to very high risk. The final geohazard risk map (Figure 8) integrates all three component maps: mass wasting, flooding, and permafrost thawing risk. A total of 23% of the aimag (21,627 km2) can be considered to have a generally high or very high risk of developing localized geohazards. The final map was validated with reference to observations made during mobile ethnographies conducted in June 2022.
4. Discussion
While there are already existing estimates of the effects of permafrost degradation on Arctic communities [53,54,55], our study demonstrates that the problem stretches well beyond the Arctic boundaries. According to the United Nations Framework Convention on Climate Change [56], warming air temperatures, shorter, more mild winters, thawing permafrost, and changing weather patterns are all observed in Mongolia [17,56], and Khövsgöl Aimag is no exception. Research in the Arctic shows that climate change-induced flooding and permafrost degradation can damage water and transportation infrastructure [57,58,59,60]. In addition, pasturelands throughout the aimag are not only strained by climate change, but also by larger cattle herds, increased vehicle traffic as a result of a growing tourism sector, environmental restrictions, and a nationally promoted development of fixed housing. Climate change and infrastructure development are degrading pasturelands, reducing forage for grazing animals, and increasing hazard risks.
Not all phenomena we have referred to as “geohazards” entail wholly negative repercussions for these remote, primarily subsistence communities. Each community is presented with unique circumstances and either adapts or migrates. For example, while permafrost thawing caused by repeated vehicle traffic eventually contributes to ground subsidence like thermokarst, these processes can also be useful. Cattle herders in villages like Bayanzürkh benefit from the lakes created by thermokarst, which provide drinking water for their herds.
While the Mongolian government has made significant efforts to protect land amidst a rapidly changing climate, the impact of land protection laws on Indigenous Dukha and Darkhad communities in Khövsgöl is equally significant. The combination of climate change, increasing hazard frequencies, and increasing government regulations complicates the process for Indigenous communities to secure hunting permits, ultimately limiting migration routes, travel distances, and traditional livelihoods.
New policies and legislation will affect communities across the whole country. Since 2015, a tripartite law including the Urban Development Law, the Housing Law of Mongolia, and the Land Law of Mongolia was enacted by the Parliament to improve the country’s urban planning. In particular, this legal framework consists of three schemes as follows: (1) the reconstruction of old apartments, (2) the reshaping of ger areas, and (3) land pooling in ger areas to incentivize individuals to move from a general plot of land to more fixed infrastructure like apartments [12]. As a result, communities that typically have a mixture of fixed and more traditional mobile dwellings and unpaved roads are incentivized to build more permanent structures and roadways. Their ability to adapt to such localized hazards is dependent on their infrastructure, as shown in Figure 9. Communities with larger, more fixed infrastructure are less resilient to localized geohazards compared to communities with temporary structures that can be easily moved. For example, if a road remains unpaved and a sinkhole or thermokarst develops, the path can be easily adjusted or diverted when thermokarst or other obstructions are encountered. Damages to paved roads, however, present significant costs and logistical challenges in remote regions.
Nomadic groups like the Dukha can adjust their location and dwellings with relative ease. Nomadic encampments regularly encounter flash flooding or stream diversion, often overnight, which can cut through their camps and separate some ortz from the rest of the group. When this occurs, the ortz can easily be dismantled and re-assembled to rejoin the group encampment. There are also little to no road networks affected by localized geohazards. Therefore, the adaptive capacity of nomadic dwellings can serve as an example of possible strategies to cope with these challenges [60,61]. However, while nomadic Indigenous groups are able to relocate more easily than communities with more fixed infrastructure, their livelihoods are still significantly impacted by climate change when their reindeer are unable to find appropriate grazing grounds. General vegetation loss also affects the entire aimag and its diverse communities because it contributes to all three of the geohazards explored in this study.
Conversely, villages with a mixed infrastructure consisting of established buildings and gers like Bayanzürkh are less adaptable to localized geohazards because they are areas like Bayanzürkh that are predominantly targeted by the recent tripartite law. Bayanzürkh is also situated on the edge of a high-risk hazard zone, which could pose future problems as the village expands to accommodate the growing infrastructure and tourism. As more permanent, fixed forms of infrastructure are established, the village will be less adaptable and responsive to hazards. As infrastructure develops and fewer mobile structures are constructed, these communities will have a lower adaptive capacity to localized climate-induced hazards because they will be slower to adapt.
Larger towns, like Khatgal, a resort town that caters to regional tourism, or Mörön, the aimag’s administrative center, both have a high risk of experiencing localized geohazards. However, they are also less adaptable to geohazards because most of the infrastructure in the area consists of large, heavy, fixed buildings that require more resources to repair or change should a geohazard occur. The occurrence of floods is on the rise; in 2020, Khövsgöl Aimag experienced heavy rain and severe flooding [62] that flooded the streets of Khatgal, lakeshore buildings, and also gers. Additionally, in 2021, there was a 6.7 magnitude earthquake off the coast of Lake Khövsgöl [44]. It was the largest earthquake since the 7.0 magnitude earthquake in 1967. The aimag is a seismically active region, and Khatgal is situated at the base of an active faultline. Although damage from the 2020 floods was mitigated and damage from the 2021 earthquake was light, built-up areas like Khatgal require more time, money, and materials from Mörön or Mongolia’s capital, Ulaanbaatar, to mitigate hazard damage. Already, Khövsgöl’s local road and transportation infrastructure is not equipped to haul large amounts of resources between towns, and additional construction of paved roads can contribute to further landscape degradation and thermokarst, potentially affecting transportation and mobility between the largest population centers in the region. Additionally, the most established road, i.e., the Mörön-Khagal highway, which connects the two largest towns in the aimag, is nearly all in a high-risk zone, making transportation more difficult.
5. Conclusions
This study sought to identify where localized geohazards would most likely occur and which communities would likely be most affected in Mongolia’s Khövsgöl Aimag. Using a combination of quantitative and qualitative methods, including mobile ethnographies, semi-structured interviews, GIS hazard map assessment using AHP analysis, and UAV survey validation, “at-risk” areas for hazards like mass wasting, flooding, and permafrost thawing were identified.
We suggest larger, more established towns will experience the highest risk levels for geohazards and will be less resilient compared to nomadic groups like the Dukha and Darkhad communities. Although locations in the aimag where nomadic and semi-nomadic communities traditionally reside are at equally high risk for climate-induced geohazards, their ability to relocate more easily than communities in larger towns makes the hotspots identified in this study less concerning. As such, future policies should not overlook these communities, but more attention regarding sustainable development and improved hazard mitigation techniques can be focused on growing towns and villages. Examining other extreme environs, such as the Arctic, can offer insights into feasible options for remote sustainable development [63,64,65,66,67].
The initial findings and hazard maps produced by this study will be shared with locals in Khövsgöl in digital and printed forms, in the hopes that these products will allow them to better prepare and mitigate the effects of such hazards. For instance, large, printed maps will be shared with parks and other conservation authorities. Album-style books that include photographs from the UAV survey validation will be shared with the local schools and communities. Finally, GIS packages will be compiled and shared with collaborating universities in Ulaanbaatar, national parks, and strictly protected area administrators.
Further research is needed to fully understand and monitor the effects of climate-induced geohazards in the aimag, which can be informative and more focused based on this initial investigation. As Mongolia’s tourism sector begins to recover from the COVID-19 pandemic and the national government continues to incentivize locals to build more fixed infrastructure, it is crucial to monitor localized geohazards and their effects on local transportation routes. For instance, in situ environmental monitoring, including meteorological, permafrost, and hydrological monitoring stations, would provide more detailed quantitative measurements. Future spatial explorations of risk using the AHP spatial analysis method should also explore the incorporation of more detailed geological/geomorphological spatial datasets, climate reanalyses, and projection products. Additionally, this method could be improved with fewer subjective thresholds for parameters, including distances to infrastructure based on in situ observations within Khövsgöl. During semi-structured interviews, many interviewees often commented on the increase in rain events in the aimag, which contributed to mass wasting events, flooding, and infrastructure problems like bridge collapses. Including this criterion in the hazard mapping assessment may identify new “at-risk” areas.
The continuation of research like the present study on Khövsgöl Aimag can help communities adapt better to localized geohazards with improved understandings of where they will most likely occur due to documentation that can be shared with local and national planners. There are numerous opportunities for the implementation and effective use of new technologies in addition to increased economic investment that can provide better support to the Indigenous communities of Khövsgöl Aimag and inform national-level development policy. This work can also be applied to other parts of the world with similar traditions of reindeer herding, such as various Arctic regions or other Mongolian provinces. Mongolia is a large country with unique ecosystems that are vulnerable to climate change and the resulting natural hazards. Different Indigenous and minority communities within the country and beyond may be similarly affected, and the GIS framework presented here may provide supportive products that can assist in finding culturally appropriate and technologically sound solutions.
Author Contributions
Conceptualization, K.E.N., V.V.K. and G.L.M.; methodology, G.L.M.; software, G.L.M.; validation, G.L.M. and K.E.N.; formal analysis, G.L.M.; writing—original draft preparation, G.L.M.; writing—review and editing, G.L.M., K.E.N. and V.V.K.; visualization, G.L.M.; supervision, K.E.N. and V.V.K.; project administration, K.E.N. and V.V.K.; funding acquisition, K.E.N. and V.V.K. All authors have read and agreed to the published version of the manuscript.
Funding
This research was supported by US National Science Foundation Grants 1748092 (Informal Roads: The Impact of Unofficial Transportation Routes on Remote Arctic Communities) and 2127343 (Frozen Commons: Change, Resilience, and Sustainably in the Arctic). Opinions, findings, conclusions, and recommendations expressed in this paper by the authors do not necessarily reflect the views of the US National Science Foundation.
Data Availability Statement
The data presented in this study are available upon request from the corresponding authors.
Acknowledgments
We would like to thank all the interview participants for their insights and our colleagues who participated in the fieldwork conducted in June–July 2022. Khadbaatar Sandag of the Department of Geography at the Mongolian National University of Education organized logistics, recruited interviewees, and acted as an interpreter. Mariia Kuklina of the Irkutsk State Technical University, Russia, and a postdoctoral Scholar at the University of Northern Iowa assisted in conducting interviews and transcription. Dmitrii Kobylkin, senior research associate at the V.B. Sochava Geographical Institute of the Siberian Branch of the Russian Academy of Sciences and head of their Geomorphology Laboratory, performed all drone surveys and initial image processing. This work was funded by the US National Science Foundation. Any opinions, findings, conclusions, or recommendations expressed in this work are those of the authors and do not necessarily reflect the views of the NSF. The mention of specific product names does not constitute an endorsement by the NSF.
Conflicts of Interest
The authors declare no conflict of interest. The funders had no role in the design of the study; in the collection, analyses, or interpretation of data; in the writing of the manuscript; or in the decision to publish the results.
References
- Wheeler, W.A. Lords of the Mongolia Taiga: An Ethnohistory of the Dukha Reindeer Herders. Master’s Thesis, Indiana University, Bloomington, IN, USA, 2000. Available online: https://scholarworks.iu.edu/dspace/bitstream/handle/2022/18631/Wheeler%202000-Lords%20of%20the%20Mongolian%20Taiga-Dukha%20Ethnohistory.pdf?sequence=1&isAllowed=y (accessed on 19 October 2022).
- Ulaanbaatar Tourism Department. Statistics on Tourism Performance. Available online: https://tourism.ub.gov.mn/?p=8801 (accessed on 27 April 2023).
- World Bank Group. World Bank: Air Transport and Sector Coordination Issues Among the Top Obstacles for Mongolia’s Tourism Sector. World Bank. 23 March 2022. Available online: https://www.worldbank.org/en/news/press-release/2022/03/17/world-bank-air-transport-and-sector-coordination-issues-among-the-top-obstacles-for-mongolia-s-tourism-sector#:~:text=Tourism%20is%20an%20important%20contributor,2020%20due%20to%20COVID%2D19 (accessed on 19 October 2022).
- Tsogtsaikhan, P.; Mendsaikhan, B.; Jargalmaa, G.; Ganzorig, B.; Weidel, B.C.; Filosa, C.; Free, C.M.; Young, T.; Jensen, O.P. Age and growth comparisons of Hovsgol grayling (Thymallus nigrescens Dorogostaisky, 1923), Baikal grayling (T. baicalensis Dybowski, 1874), and lenok (Brachymystax lenok Pallas, 1773) in lentic and lotic habitats of Northern Mongolia. J. Appl. Ichthyol. 2017, 33, 108–115. [Google Scholar] [CrossRef]
- Haas, R.; Surovell, T.A.; O’Brien, M. Dukha Mobility in a Constructed Environment: Past Camp Use Predicts Future Use in the Mongolian Taiga. Am. Antiq. 2018, 84, 215–233. [Google Scholar] [CrossRef] [Green Version]
- O’Brien, M.; Surovell, T.A. Spatial Expression of Kinship among the Dukha Reindeer Herders of Northern Mongolia. Arct. Anthropol. 2017, 54, 110–119. [Google Scholar] [CrossRef]
- Hatcherson, J. Tourism, Representation and Compensation among the Dukha Reindeer Herders of Mongolia. Open Agric. 2019, 4, 608–615. [Google Scholar] [CrossRef]
- Haas, R.; Surovell, T.A.; O’Brien, M.J. Occupancy and the Use of Household Space Among the Dukha. Ethnoarchaeology 2018, 10, 1–15. [Google Scholar] [CrossRef]
- Küçüküstel, S. Embracing Landscape: Living with Reindeer and Hunting among Spirits in South Siberia; Berghahn Books: New York, NY, USA, 2021; Available online: https://www.berghahnbooks.com/title/KucukustelEmbracing#toc (accessed on 19 October 2022).
- Kuklina, V.; Sandag, K.; Nyland, K.; Kobylkin, D.; Kuklina, M. MӨP: Following Nomadic Tracks and Trails in Northern Mongolia; Admont Press: Ulaanbaatar, Mongolia, 2023. [Google Scholar]
- Government of Mongolia. Vision-2050 Long-Term Development Policy of Mongolia. Vision 2050. 2021. Available online: https://vision2050.gov.mn/eng/v2050.html (accessed on 28 April 2023).
- MAD Investment Solutions LLC. Urban Redevelopment Law 2015: Legal Analysis and Case Study. 2015. Available online: http://www.madurb.com/wp-content/uploads/2015/11/Urban-Redevelopment-Law-Legal-Analysis-Case-Study-Final.pdf (accessed on 7 March 2023).
- Valdez, R.; Frisina, M.R.; Buyandelger, U. Wildlife Conservation and Management in Mongolia. Wildl. Soc. Bull. 1973–2006 1995, 23, 640–645. Available online: http://www.jstor.org/stable/3782994 (accessed on 19 October 2022).
- Rossabi, M. Mongolia’s Environmental Crises: An Introduction. Educ. About Asia 2021, 26, 41–48. Available online: https://www.asianstudies.org/wp-content/uploads/RossabiSpring2021EAA.pdf (accessed on 19 October 2022).
- Law on Special Protected Areas. November 1994. Available online: https://faolex.fao.org/docs/pdf/mon77268E.pdf (accessed on 2 March 2023).
- Mongolian Law on Buffer Zones. 23 October 1997. Available online: https://events.development.asia/system/files/materials/1997/10/199710-mon-mongolian-law-buffer-zones.pdf (accessed on 2 March 2023).
- Bezuijen, M.R.; Russell, M.; Zomer, R.J.; Enkhtaivan, D. Building the Climate Change Resilience of Mongolia’s Blue Pearl; Asian Development Bank: Manila, Philippines, 2021; ISBN 978-92-9262-609-9. [Google Scholar] [CrossRef]
- Korytny, L.M.; Kichigina, N.V. Geographical analysis of river floods and their causes in southern East Siberia. Hydrol. Sci. J. 2006, 51, 450–464. [Google Scholar] [CrossRef]
- Tyszkowski, S.; Kaczmarek, H.; Słowiński, M.; Kozyreva, E.; Brykała, D.; Rybchenko, A.; Babicheva, V.A. Geology, permafrost, and lake level changes as factors initiating landslides on Olkhon Island (Lake Baikal, Siberia). Landslides 2014, 12, 573–583. [Google Scholar] [CrossRef]
- Kichigina, N.V. Flood Hazard on the Rivers of the Baikal Region. Geogr. Nat. Resour. 2018, 39, 120–129. [Google Scholar] [CrossRef]
- Kichigina, N.V. Geographical analysis of river flood hazard in Siberia. Int. J. River Basin Manag. 2020, 18, 255–264. [Google Scholar] [CrossRef]
- Harwati, L.N. Ethnographic and Case Study Approaches: Philosophical and Methodological Analysis. Int. J. Educ. Lit. Stud. 2019, 7, 150. [Google Scholar] [CrossRef] [Green Version]
- Hallett, R.E.; Barber, K. Ethnographic Research in a Cyber Era. J. Contemp. Ethnogr. 2014, 43, 306–330. [Google Scholar] [CrossRef] [Green Version]
- Taylor, M.C. Interviewing. In Qualitative Research in Health Care; Holloway, I., Ed.; McGraw-Hill Education: Maidenhead, UK, 2005; pp. 39–55. [Google Scholar]
- Bernard, H.R. Interviewing: Unstructured and Semistructured. In Research Methods in Anthropology, 4th ed.; AltaMira Press: Lanham, MD, USA, 2006; Available online: https://indiachinainstitute.org/wp-content/uploads/2017/05/9Ain-Russell-Bernard-2002.pdf (accessed on 19 October 2022).
- DiCicco-Bloom, B.; Crabtree, B.F. The qualitative research interview. Med. Educ. 2006, 40, 314–321. [Google Scholar] [CrossRef] [PubMed]
- Kallio, H.; Pietilä, A.; Johnson, M.; Kangasniemi, M. Systematic methodological review: Developing a framework for a qualitative semi-structured interview guide. J. Adv. Nurs. 2016, 72, 2954–2965. [Google Scholar] [CrossRef] [PubMed]
- Galletta, A. Mastering the Semi-Structured Interview and Beyond: From Research Design to Analysis and Publication; New York University Press: New York, NY, USA, 2013. [Google Scholar] [CrossRef]
- Hardon, A.; Hodgkin, C.; Fresle, D. How to Investigate the Use of Medicines by Consumers; World Health Organization and University of Amsterdam: Geneva, Switzerland, 2004; Available online: http://apps.who.int/medicinedocs/en/d/Js6169e/ (accessed on 26 January 2023).
- Gill, P.; Stewart, K.; Treasure, E.; Chadwick, B.L. Methods of data collection in qualitative research: Interviews and focus groups. Br. Dent. J. 2008, 204, 291–295. [Google Scholar] [CrossRef] [PubMed]
- Saaty, T.L. The Analytic Hierarchy Process: Planning, Priority Setting, Resource Allocation; McGraw: New York, NY, USA, 1980. [Google Scholar]
- Microsoft Office Professionals Plus. Microsoft Excel. 2019. Available online: https://office.microsoft.com/excel (accessed on 19 October 2022).
- ArcGIS Pro, version 3.0.3; Esri Inc.: Redlands, CA, USA, 2022.
- Wang, J.; Wei, H.; Cheng, K.; Ochir, A.; Shao, Y.; Yao, J.; Wu, Y.; Han, X.; Davaasuren, D.; Chonokhuu, S.; et al. Updatable dataset revealing decade changes in land cover types in Mongolia. Geosci. Data J. 2022, 9, 341–354. [Google Scholar] [CrossRef]
- Jarvis, A.; HIReuter ANelson, E. Guevara, 2008, Hole-Filled Seamless SRTM Data V4, International Centre for Tropical Agriculture (CIAT). Available online: https://srtm.csi.cgiar.org (accessed on 19 October 2022).
- Gigović, L.; Pamučar, D.; Bajić, Z.; Drobnjak, S. Application of GIS-Interval Rough AHP Methodology for Flood Hazard Mapping in Urban Areas. Water 2017, 9, 360. [Google Scholar] [CrossRef] [Green Version]
- Stieglitz, M.; Rind, D.; Famiglietti, J.S.; Rosenzweig, C. An Efficient Approach to Modeling the Topographic Control of Surface Hydrology for Regional and Global Climate Modeling. J. Clim. 1997, 10, 118–137. [Google Scholar] [CrossRef]
- El Jazouli, A.; Barakat, A.; Khellouk, R. GIS-multicriteria evaluation using AHP for landslide susceptibility mapping in Oum Er Rbia high basin (Morocco). Geoenviron. Disasters 2019, 6, 3. [Google Scholar] [CrossRef]
- Chen, W.; Panahi, M.; Pourghasemi, H.R. Performance evaluation of GIS-based new ensemble data mining techniques of adaptive neuro-fuzzy inference system (ANFIS) with genetic algorithm (GA), differential evolution (DE), and particle swarm optimization (PSO) for landslide spatial modelling. CATENA 2017, 157, 310–324. [Google Scholar] [CrossRef]
- Nourani, V.; Hosseini Baghanam, A.; Adamowski, J.; Kisi, O. Applications of hybrid wavelet–Artificial Intelligence models in hydrology: A review. J. Hydrol. 2014, 514, 358–377. [Google Scholar] [CrossRef]
- Glenn, E.P.; Morino, K.; Nagler, P.L.; Murray, R.S.; Pearlstein, S.; Hultine, K.R. Roles of saltcedar (Tamarix spp.) and capillary rise in salinizing a non-flooding terrace on a flow-regulated desert river. J. Arid Environ. 2012, 79, 56–65. [Google Scholar] [CrossRef]
- Swanson, D.A. Permafrost thaw—Related slope failures in Alaska’s Arctic National Parks, c. 1980–2019. Permafr. Periglac. Process. 2021, 32, 392–406. [Google Scholar] [CrossRef]
- USGS Earthquake Catalog. 11 January 2021. Available online: https://earthquake.usgs.gov/earthquakes/search/ (accessed on 25 February 2023).
- He, Y.; Wang, T.; Zhao, L. The 2021 Mw6.7 Lake Hovsgol (Mongolia) Earthquake: Irregular Normal Faulting with Slip Partitioning Controlled by an Adjacent Strike-Slip Fault. Remote Sens. 2022, 14, 4553. [Google Scholar] [CrossRef]
- Parfenov, L.M.; Khanchuk, A.I.; Badarch, G.; Miller, R.J.; Naumova, V.V.; Nokleberg, W.J.; Ogasawara, M.; Prokopiev, A.V.; Yan, H. Geodynamics map of Northeast Asia: U.S. Geological Survey Scientific Investigations Map 3024, 2 Sheets, Sheet 1 Scale 1:5,000,000. 2013. Available online: https://pubs.usgs.gov/sim/3024/ (accessed on 7 March 2023).
- Yilmaz, I. Comparison of landslide susceptibility mapping methodologies for Koyulhisar, Turkey: Conditional probability, logistic regression, artificial neural networks, and support vector machine. Environ. Earth Sci. 2009, 61, 821–836. [Google Scholar] [CrossRef]
- Park, S.; Choi, C.; Kim, B.; Kim, J. Landslide susceptibility mapping using frequency ratio, analytic hierarchy process, logistic regression, and artificial neural network methods at the Inje area, Korea. Environ. Earth Sci. 2012, 68, 1443–1464. [Google Scholar] [CrossRef]
- Defense Mapping Agency (DMA). Digital Chart of the World; Four CD-ROMs; Defense Mapping Agency: Fairfax, VA, USA, 1992. [Google Scholar]
- Bui, D.T.; Lofman, O.; Revhaug, I.; Dick, O. Landslide susceptibility analysis in the Hoa Binh province of Vietnam using statistical index and logistic regression. Nat. Hazards 2011, 59, 1413–1444. [Google Scholar] [CrossRef]
- Lee, C.F.; Li, J.; Xu, Z.W.; Dai, F.C. Assessment of landslide susceptibility on the natural terrain of Lantau Island, Hong Kong. Environ. Geol. 2001, 40, 381–391. [Google Scholar] [CrossRef]
- Obu, J.; Westermann, S.; Kääb, A.; Bartsch, A. Ground Temperature Map, 2000–2016, Northern Hemisphere Permafrost; Alfred Wegener Institute, Helmholtz Centre for Polar and Marine Research: Bremerhaven, Germany, 2019. [Google Scholar] [CrossRef]
- Suh, J.; Choi, Y. Mapping hazardous mining-induced sinkhole subsidence using unmanned aerial vehicle (drone) photogrammetry. Environ. Earth Sci. 2017, 76, 1–15. [Google Scholar] [CrossRef]
- Ramage, J.; Jungsberg, L.; Wang, S.; Westermann, S.; Lantuit, H.; Heleniak, T. Population Living on Permafrost in the Arctic. Popul. Environ. 2021, 43, 22–38. [Google Scholar] [CrossRef]
- Landers, K.; Streletskiy, D. (Un)Frozen Foundations: A Study of Permafrost Construction Practices in Russia, Alaska, and Canada. Ambio 2023, 52, 1170–1183. [Google Scholar] [CrossRef]
- Hjort, J.; Streletskiy, D.; Doré, G.; Wu, Q.; Bjella, K.; Luoto, M. Impacts of Permafrost Degradation on Infrastructure. Nat. Rev. Earth Environ. 2022, 3, 24–38. [Google Scholar] [CrossRef]
- Third National Communication of Mongolia to the UNFCCC. In United Nations Framework Convention on Climate Change; Ministry of Environment and Tourism: New York, NY, USA, 2018; Available online: https://unfccc.int/sites/default/files/resource/06593841_Mongolia-NC3-2-Mongolia%20TNC%202018%20pr.pdf (accessed on 28 April 2023).
- Instanes, A.; Kokorev, V.; Janowicz, R.; Bruland, O.; Sand, K.; Prowse, T. Changes to Freshwater Systems Affecting Arctic Infrastructure and Natural Resources. J. Geophys. Res. Biogeosci. 2016, 121, 567–585. [Google Scholar] [CrossRef] [Green Version]
- Povoroznyuk, O.; Vincent, W.F.; Schweitzer, P.; Laptander, R.; Bennett, M.; Calmels, F.; Sergeev, D.; Arp, C.; Forbes, B.C.; Roy-Léveillée, P.; et al. Arctic Roads and Railways: Social and Environmental Consequences of Transport Infrastructure in the Circumpolar North. Arct. Sci. 2022, 9, 297–330. [Google Scholar] [CrossRef]
- Prowse, T.D.; Furgal, C.; Chouinard, R.; Melling, H.; Milburn, D.; Smith, S.L. Implications of Climate Change for Economic Development in Northern Canada: Energy, Resource, and Transportation Sectors. Ambio 2009, 38, 272–281. [Google Scholar] [CrossRef] [PubMed]
- Hovelsrud, G.K.; Poppel, B.; van Oort, B.; Reist, J.D. Arctic Societies, Cultures, and Peoples in a Changing Cryosphere. Ambio 2011, 40, 100–110. [Google Scholar] [CrossRef] [Green Version]
- Kettle, N.P.; Dow, K.; Tuler, S.; Webler, T.; Whitehead, J.; Miller, K.M. Integrating Scientific and Local Knowledge to Inform Risk-Based Management Approaches for Climate Adaptation. Clim. Risk Manag. 2014, 4–5, 17–31. [Google Scholar] [CrossRef] [Green Version]
- International Federation of Red Cross and Red Crescent Societies. Mongolia: Flash Floods. 2020. Available online: https://www.ifrc.org/docs/Appeals/20/IBMMff170720.pdf (accessed on 19 October 2022).
- Usenyuk, S.; Hyysalo, S.; Whalen, J. Proximal Design: Users as Designers of Mobility in the Russian North. Technol. Cult. 2016, 57, 866–908. [Google Scholar] [CrossRef]
- Cho, L.; Jull, M. Mediating Environments—ARCTIC DESIGN GROUP; Applied Research and Design: Novato, CA, USA; San Francisco, CA, USA, 2019. [Google Scholar]
- Nicewonger, T.; Fritz, S.; Mcnair, L. Complexities in Alaskan Housing: Critical reflections on social forces shaping cold climate building projects. In Proceedings of the American Society of Engineering Education 2022 Annual Conference & Exposition, Minneapolis, MN, USA, 26–29 June 2022. [Google Scholar]
- Kontar, Y.Y.; Koнтapь, E.E. Comparative Analysis of Spring Flood Risk Reduction Measures in Alaska, United States and the Sakha Republic, Russia. Ph.D. Thesis, University of Alaska Fairbanks, Fairbanks, AK, USA, 2017. [Google Scholar]
- Wang, X.; Liu, S.-W.; Zhang, J.-L. A New Look at Roles of the Cryosphere in Sustainable Development. Adv. Clim. Chang. Res. 2019, 10, 124–131. [Google Scholar] [CrossRef]
Figure 1.
Study area map of Khövsgöl Aimag (province) with nationally (strictly protected areas, national parks, and nature monuments) and locally protected areas.
Figure 1.
Study area map of Khövsgöl Aimag (province) with nationally (strictly protected areas, national parks, and nature monuments) and locally protected areas.
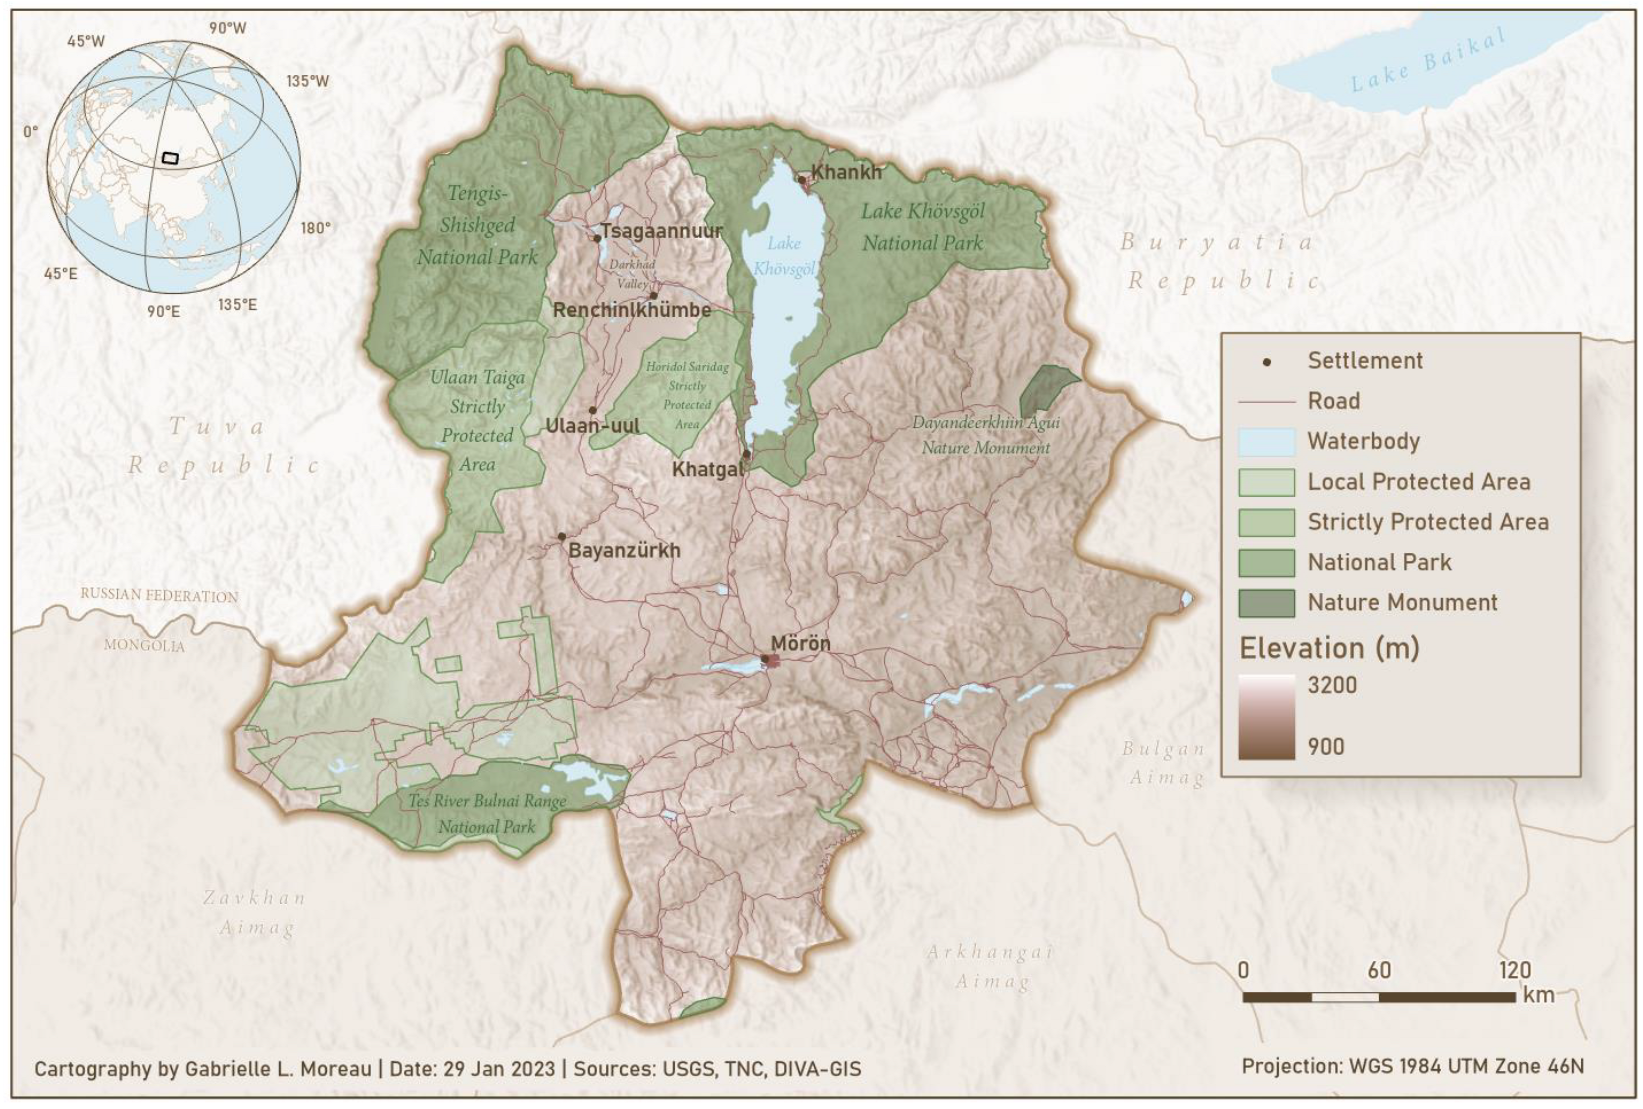
Figure 2.
Infrastructure variety in Khövsgöl Aimag. (a) Dukha ortz; (b) Darkhaad ger; (c) fixed road and single-story to multi-story buildings in Khatgal. Photos by K.E. Nyland and D.V. Kbylkin, June 2022.
Figure 2.
Infrastructure variety in Khövsgöl Aimag. (a) Dukha ortz; (b) Darkhaad ger; (c) fixed road and single-story to multi-story buildings in Khatgal. Photos by K.E. Nyland and D.V. Kbylkin, June 2022.
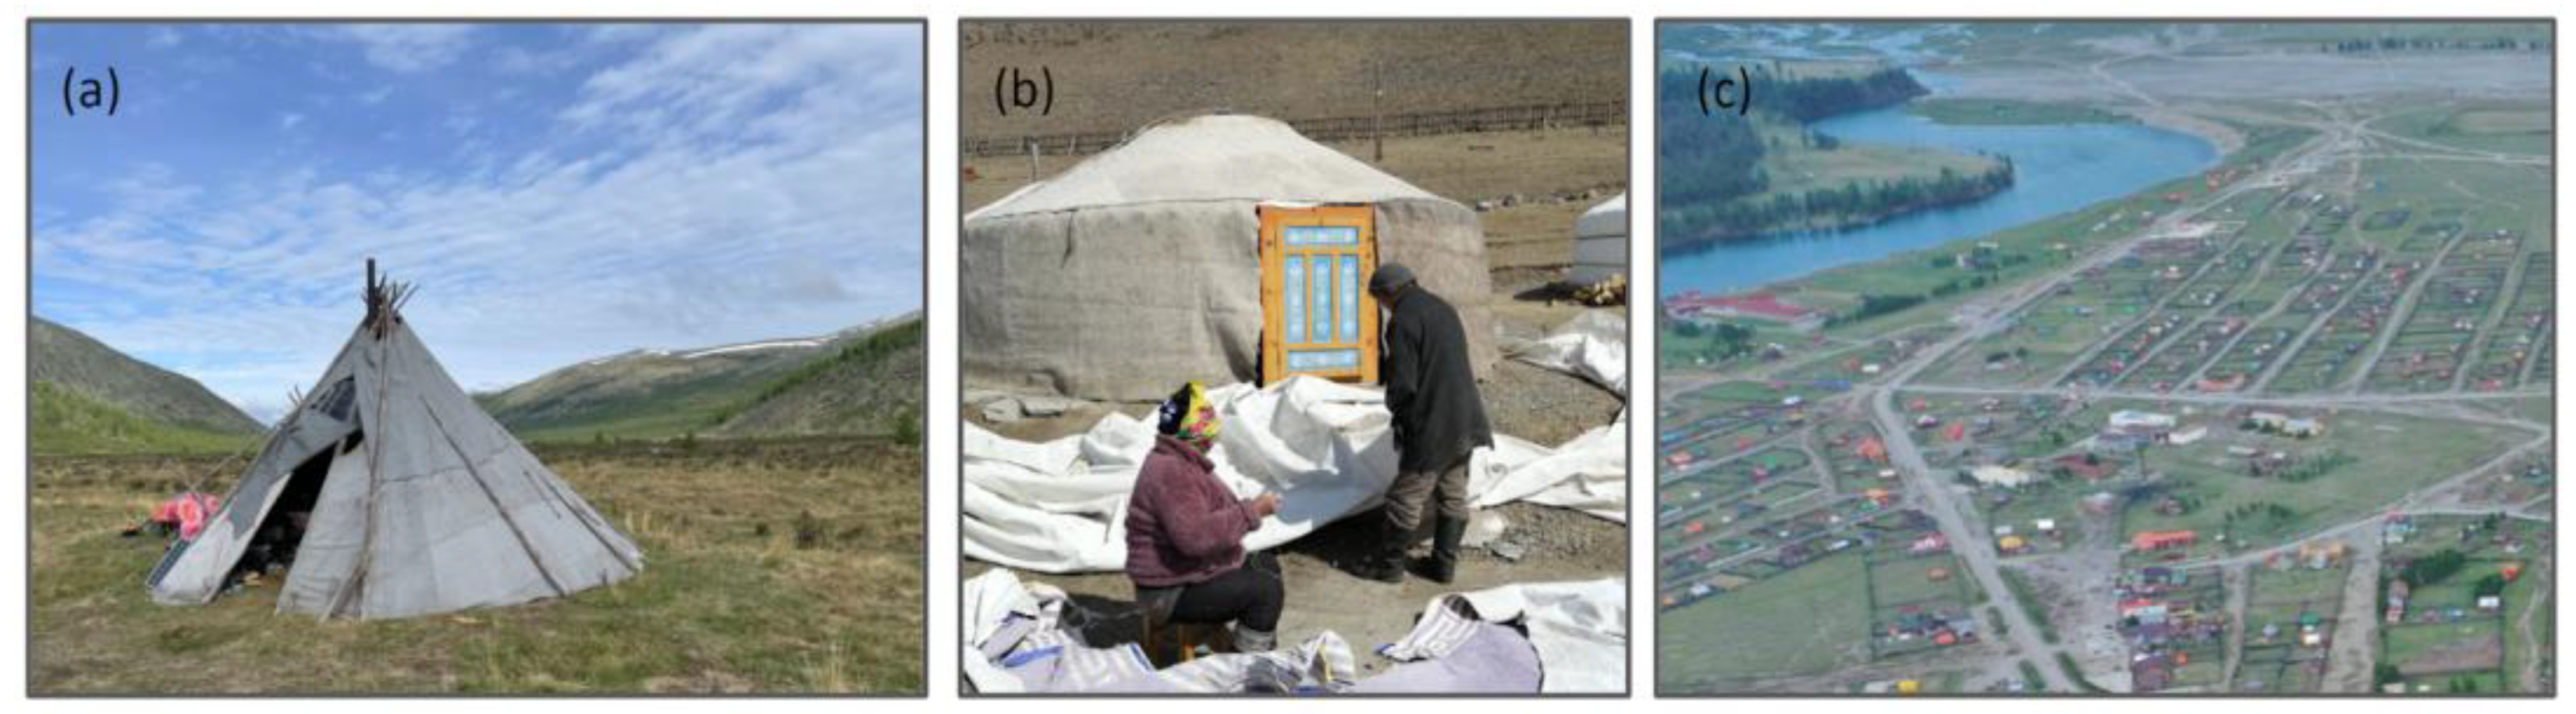
Figure 3.
Workflow diagram for the application of the analytical hierarchy process to a variety of societal and environmental input datasets, and applied geoprocessing tools to generate the final map of integrated mass wasting, flood, and permafrost geohazard potential. All geoprocessing was conducted using the ArcGIS Pro 3.0.3 software.
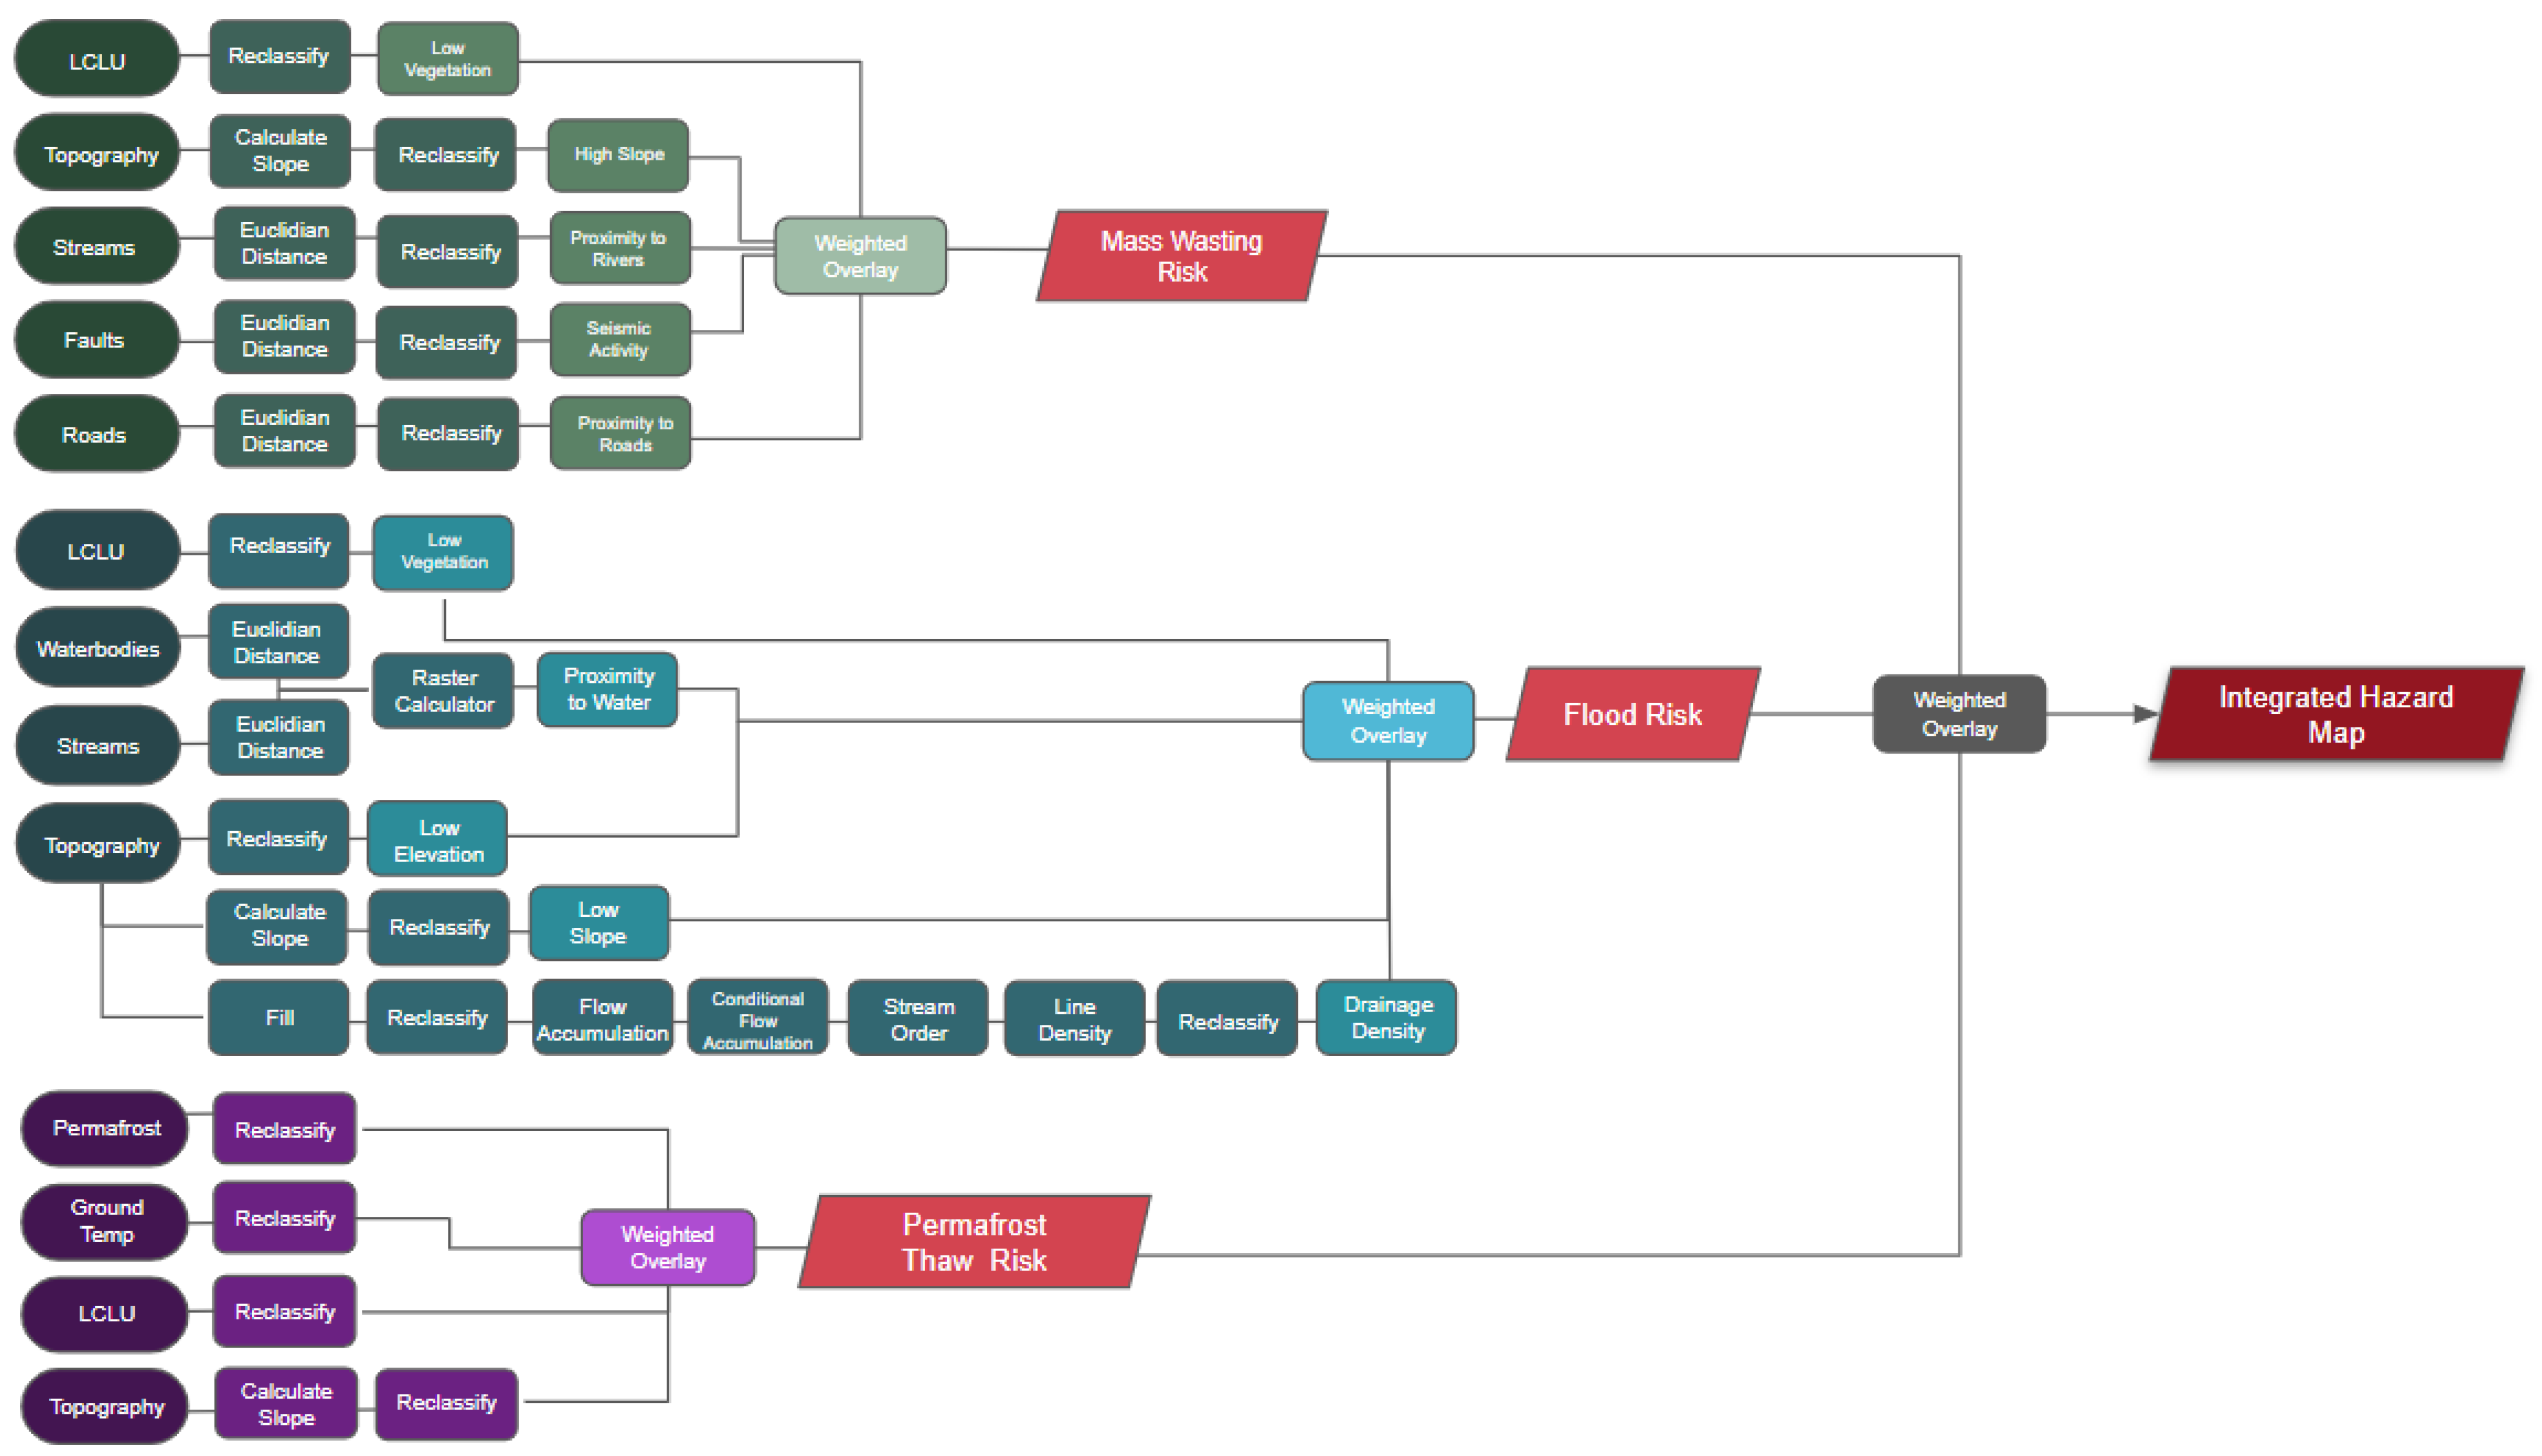
Figure 4.
Mass wasting risk map for Khövsgöl Aimag generated based on an analytical hierarchy process informed by interviews and mobile ethnographies with Dukha, and Darkhad Indigenous groups, and other Mongolian locals. See Methods Section 2.2.1 for spatial data sources.
Figure 4.
Mass wasting risk map for Khövsgöl Aimag generated based on an analytical hierarchy process informed by interviews and mobile ethnographies with Dukha, and Darkhad Indigenous groups, and other Mongolian locals. See Methods Section 2.2.1 for spatial data sources.
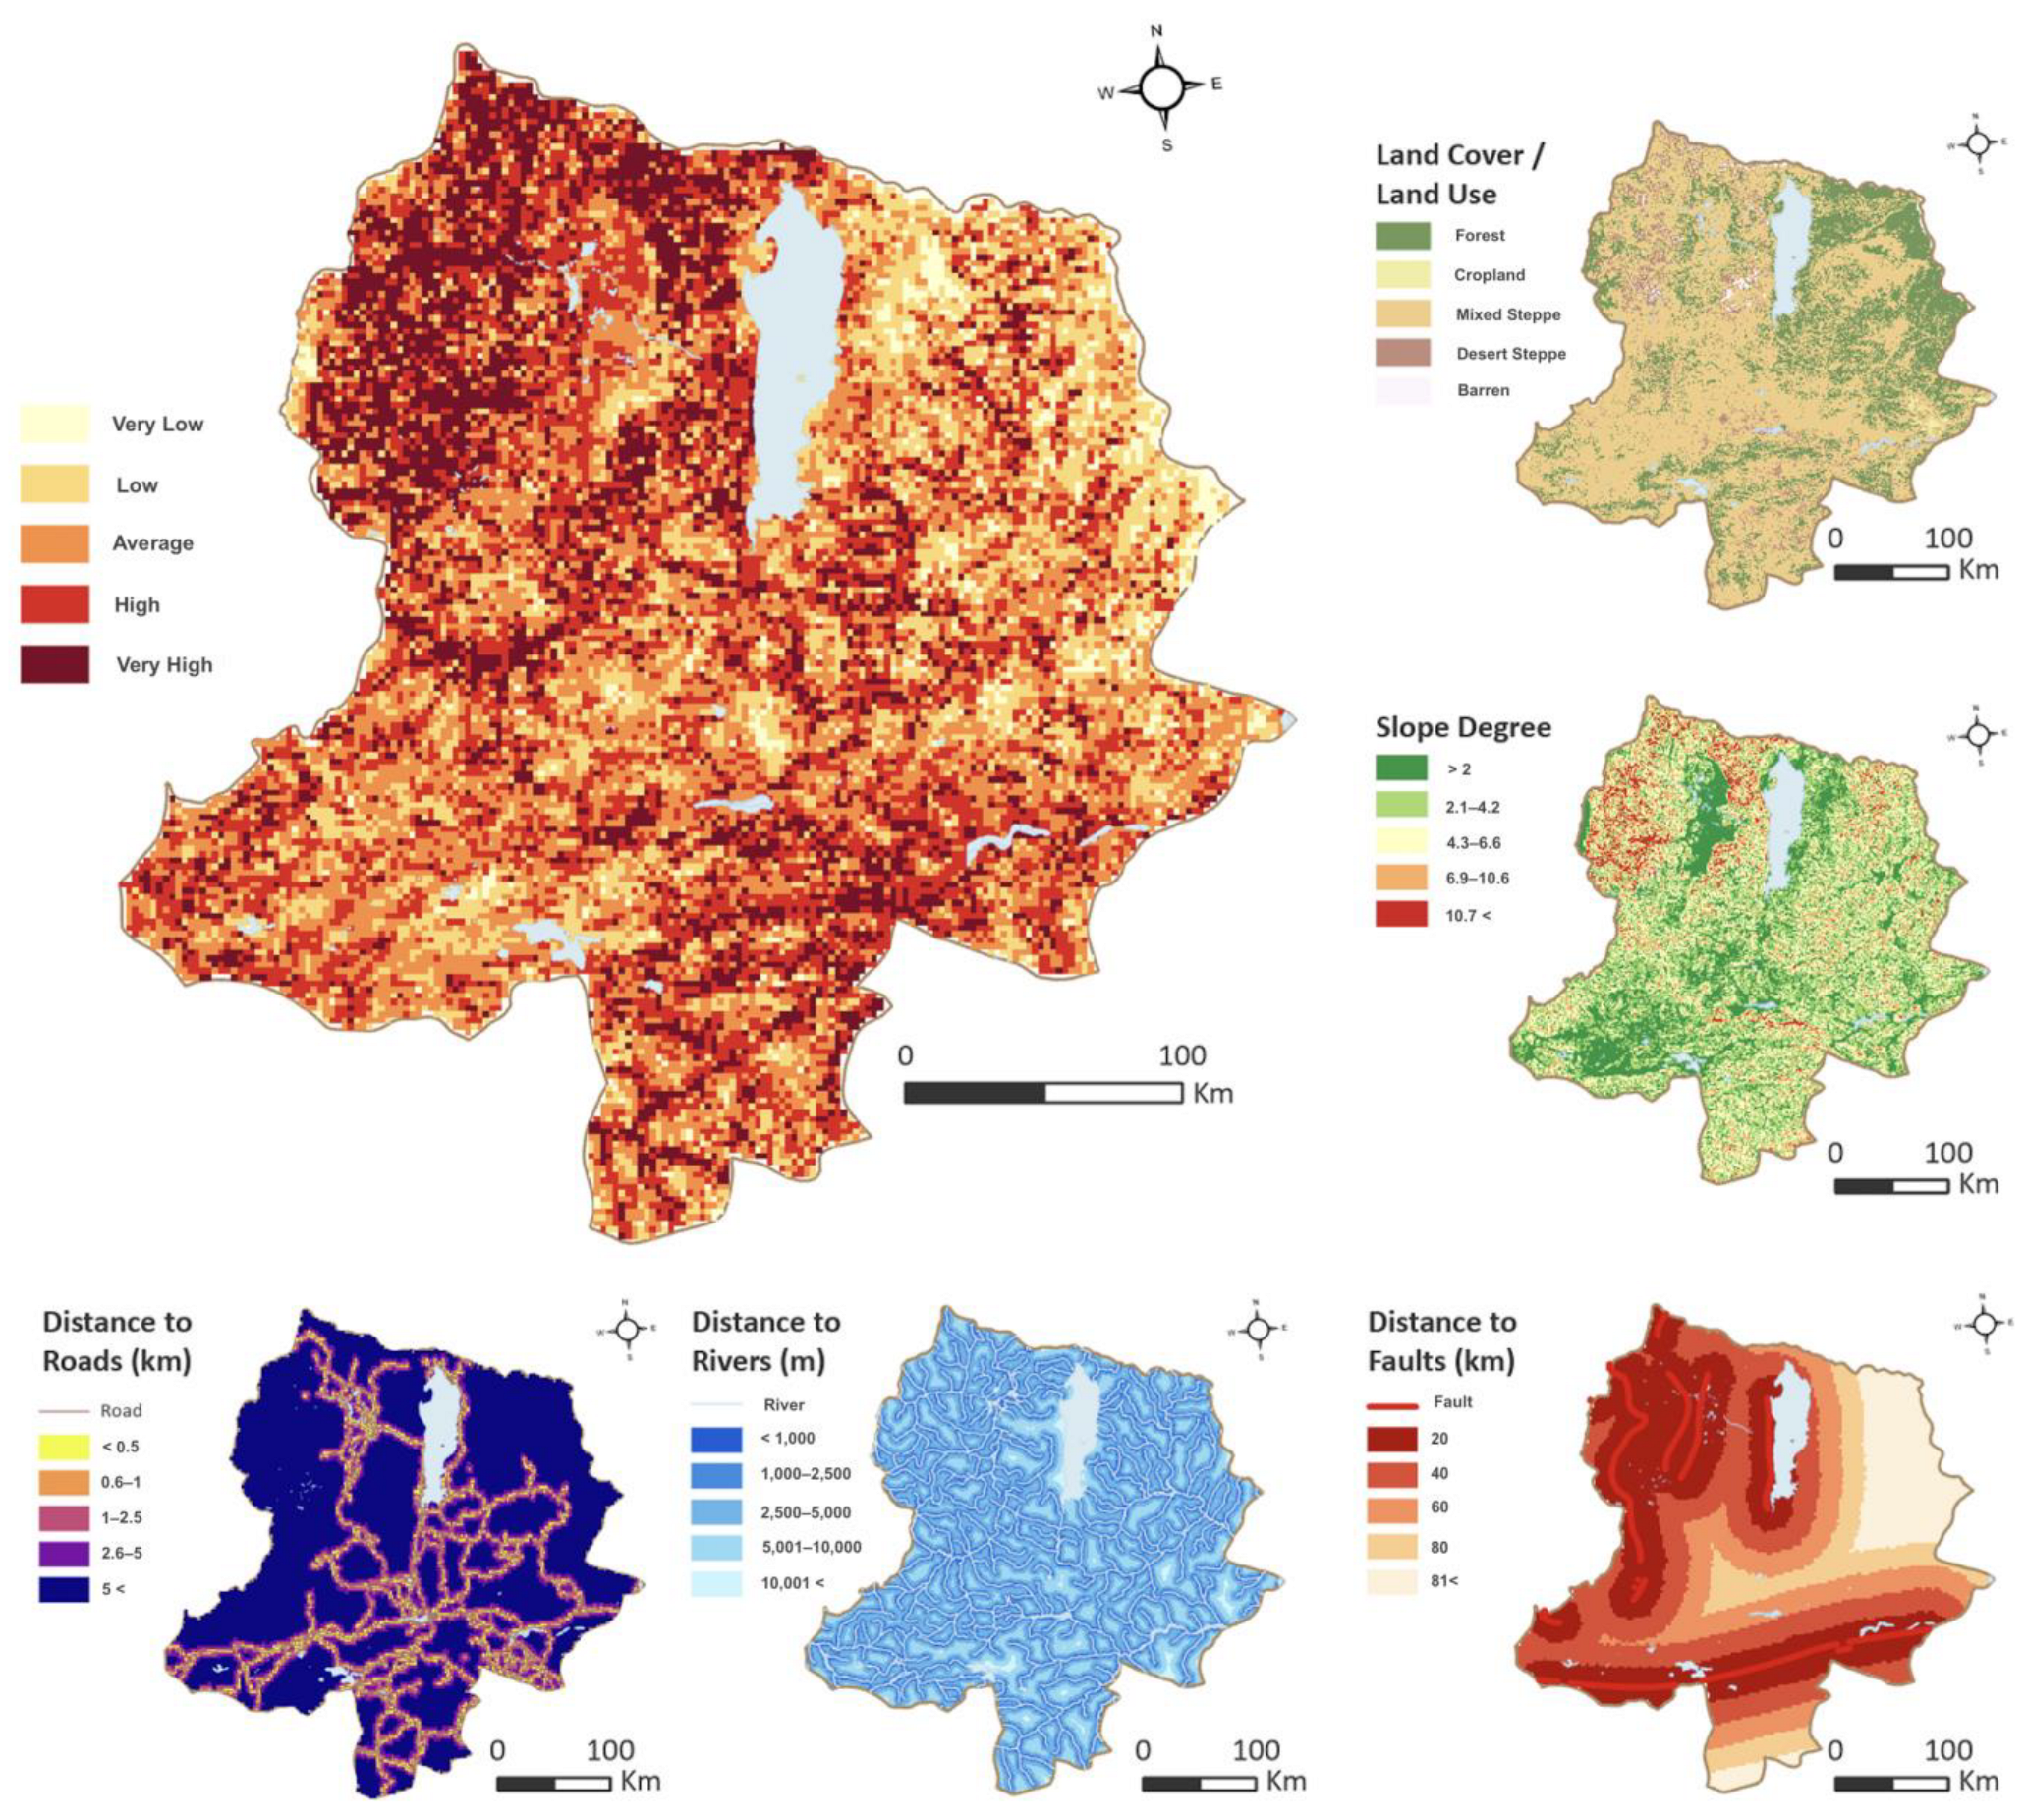
Figure 5.
Flood risk assessment map for Khövsgöl Aimag generated based on an analytical hierarchy process informed by interviews and mobile ethnographies with Dukha and Darkhad Indigenous groups, and other local Mongolians. See Methods Section 2.2.1 for spatial data sources.
Figure 5.
Flood risk assessment map for Khövsgöl Aimag generated based on an analytical hierarchy process informed by interviews and mobile ethnographies with Dukha and Darkhad Indigenous groups, and other local Mongolians. See Methods Section 2.2.1 for spatial data sources.
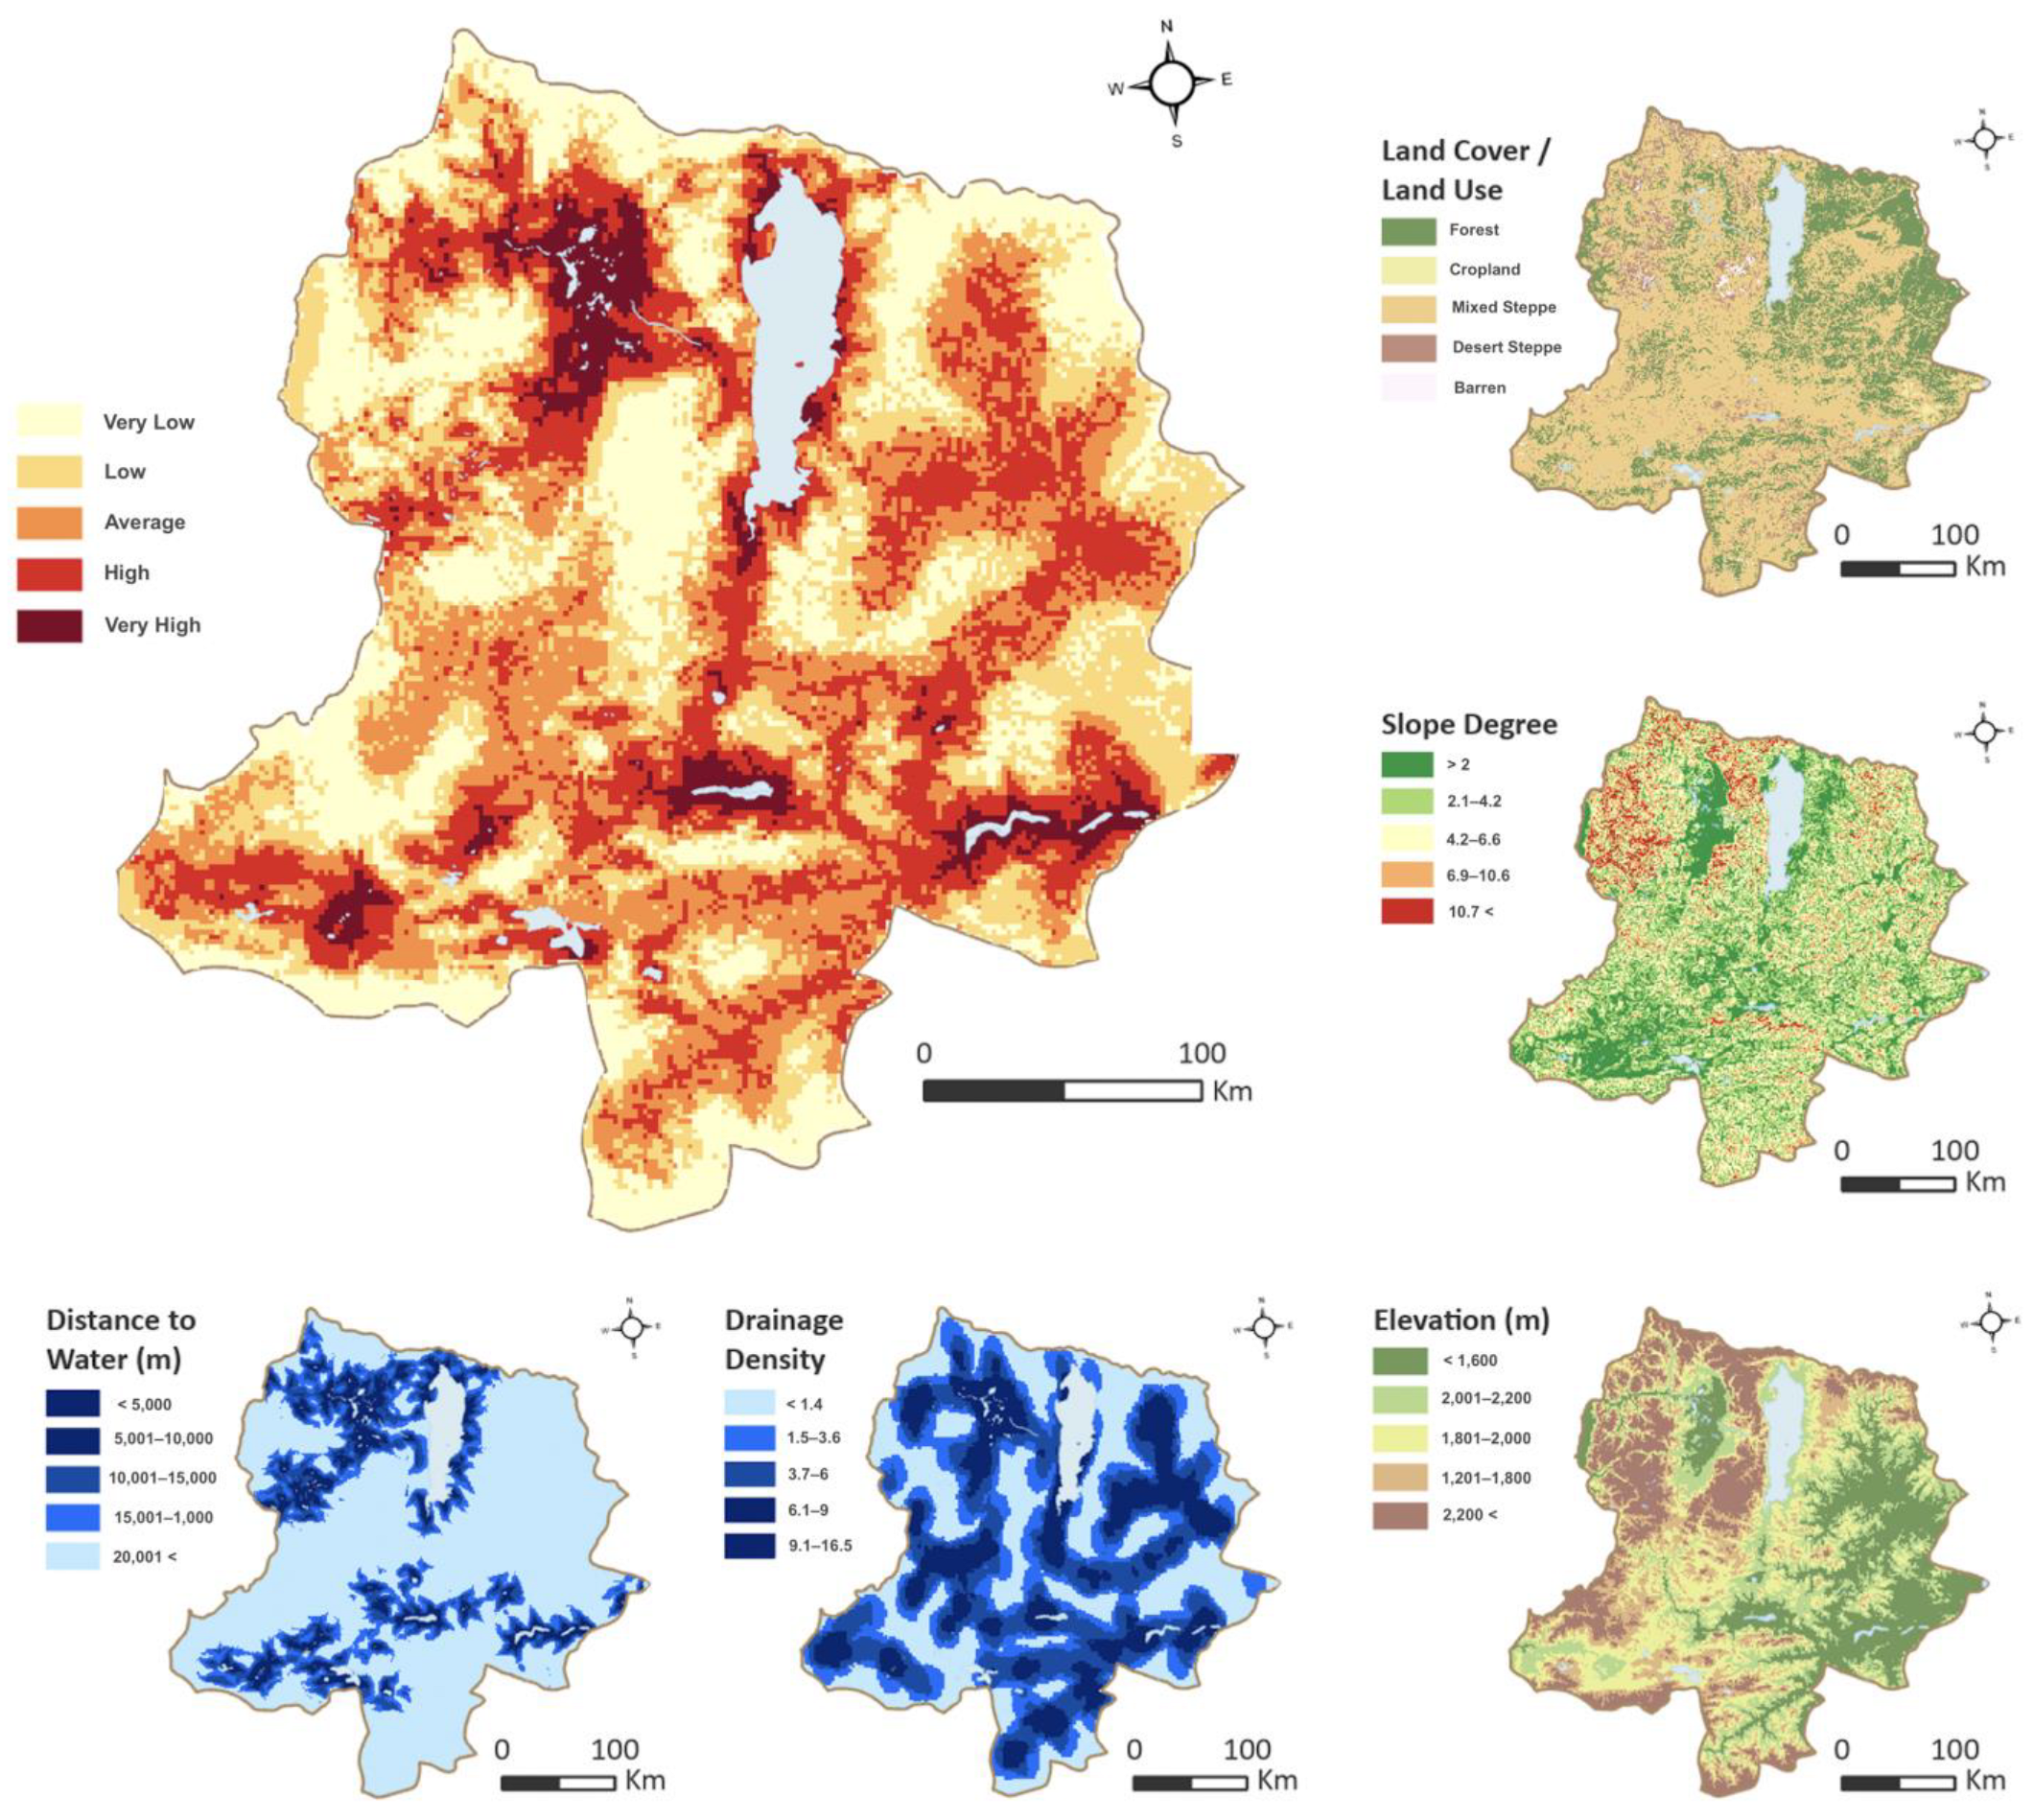
Figure 6.
Permafrost thawing risk map for Khövsgöl Aimag generated based on an analytical hierarchy process informed by interviews and mobile ethnographies with Dukha and Darkhad Indigenous groups, and other local Mongolians. See Methods Section 2.2.1 for spatial data sources.
Figure 6.
Permafrost thawing risk map for Khövsgöl Aimag generated based on an analytical hierarchy process informed by interviews and mobile ethnographies with Dukha and Darkhad Indigenous groups, and other local Mongolians. See Methods Section 2.2.1 for spatial data sources.
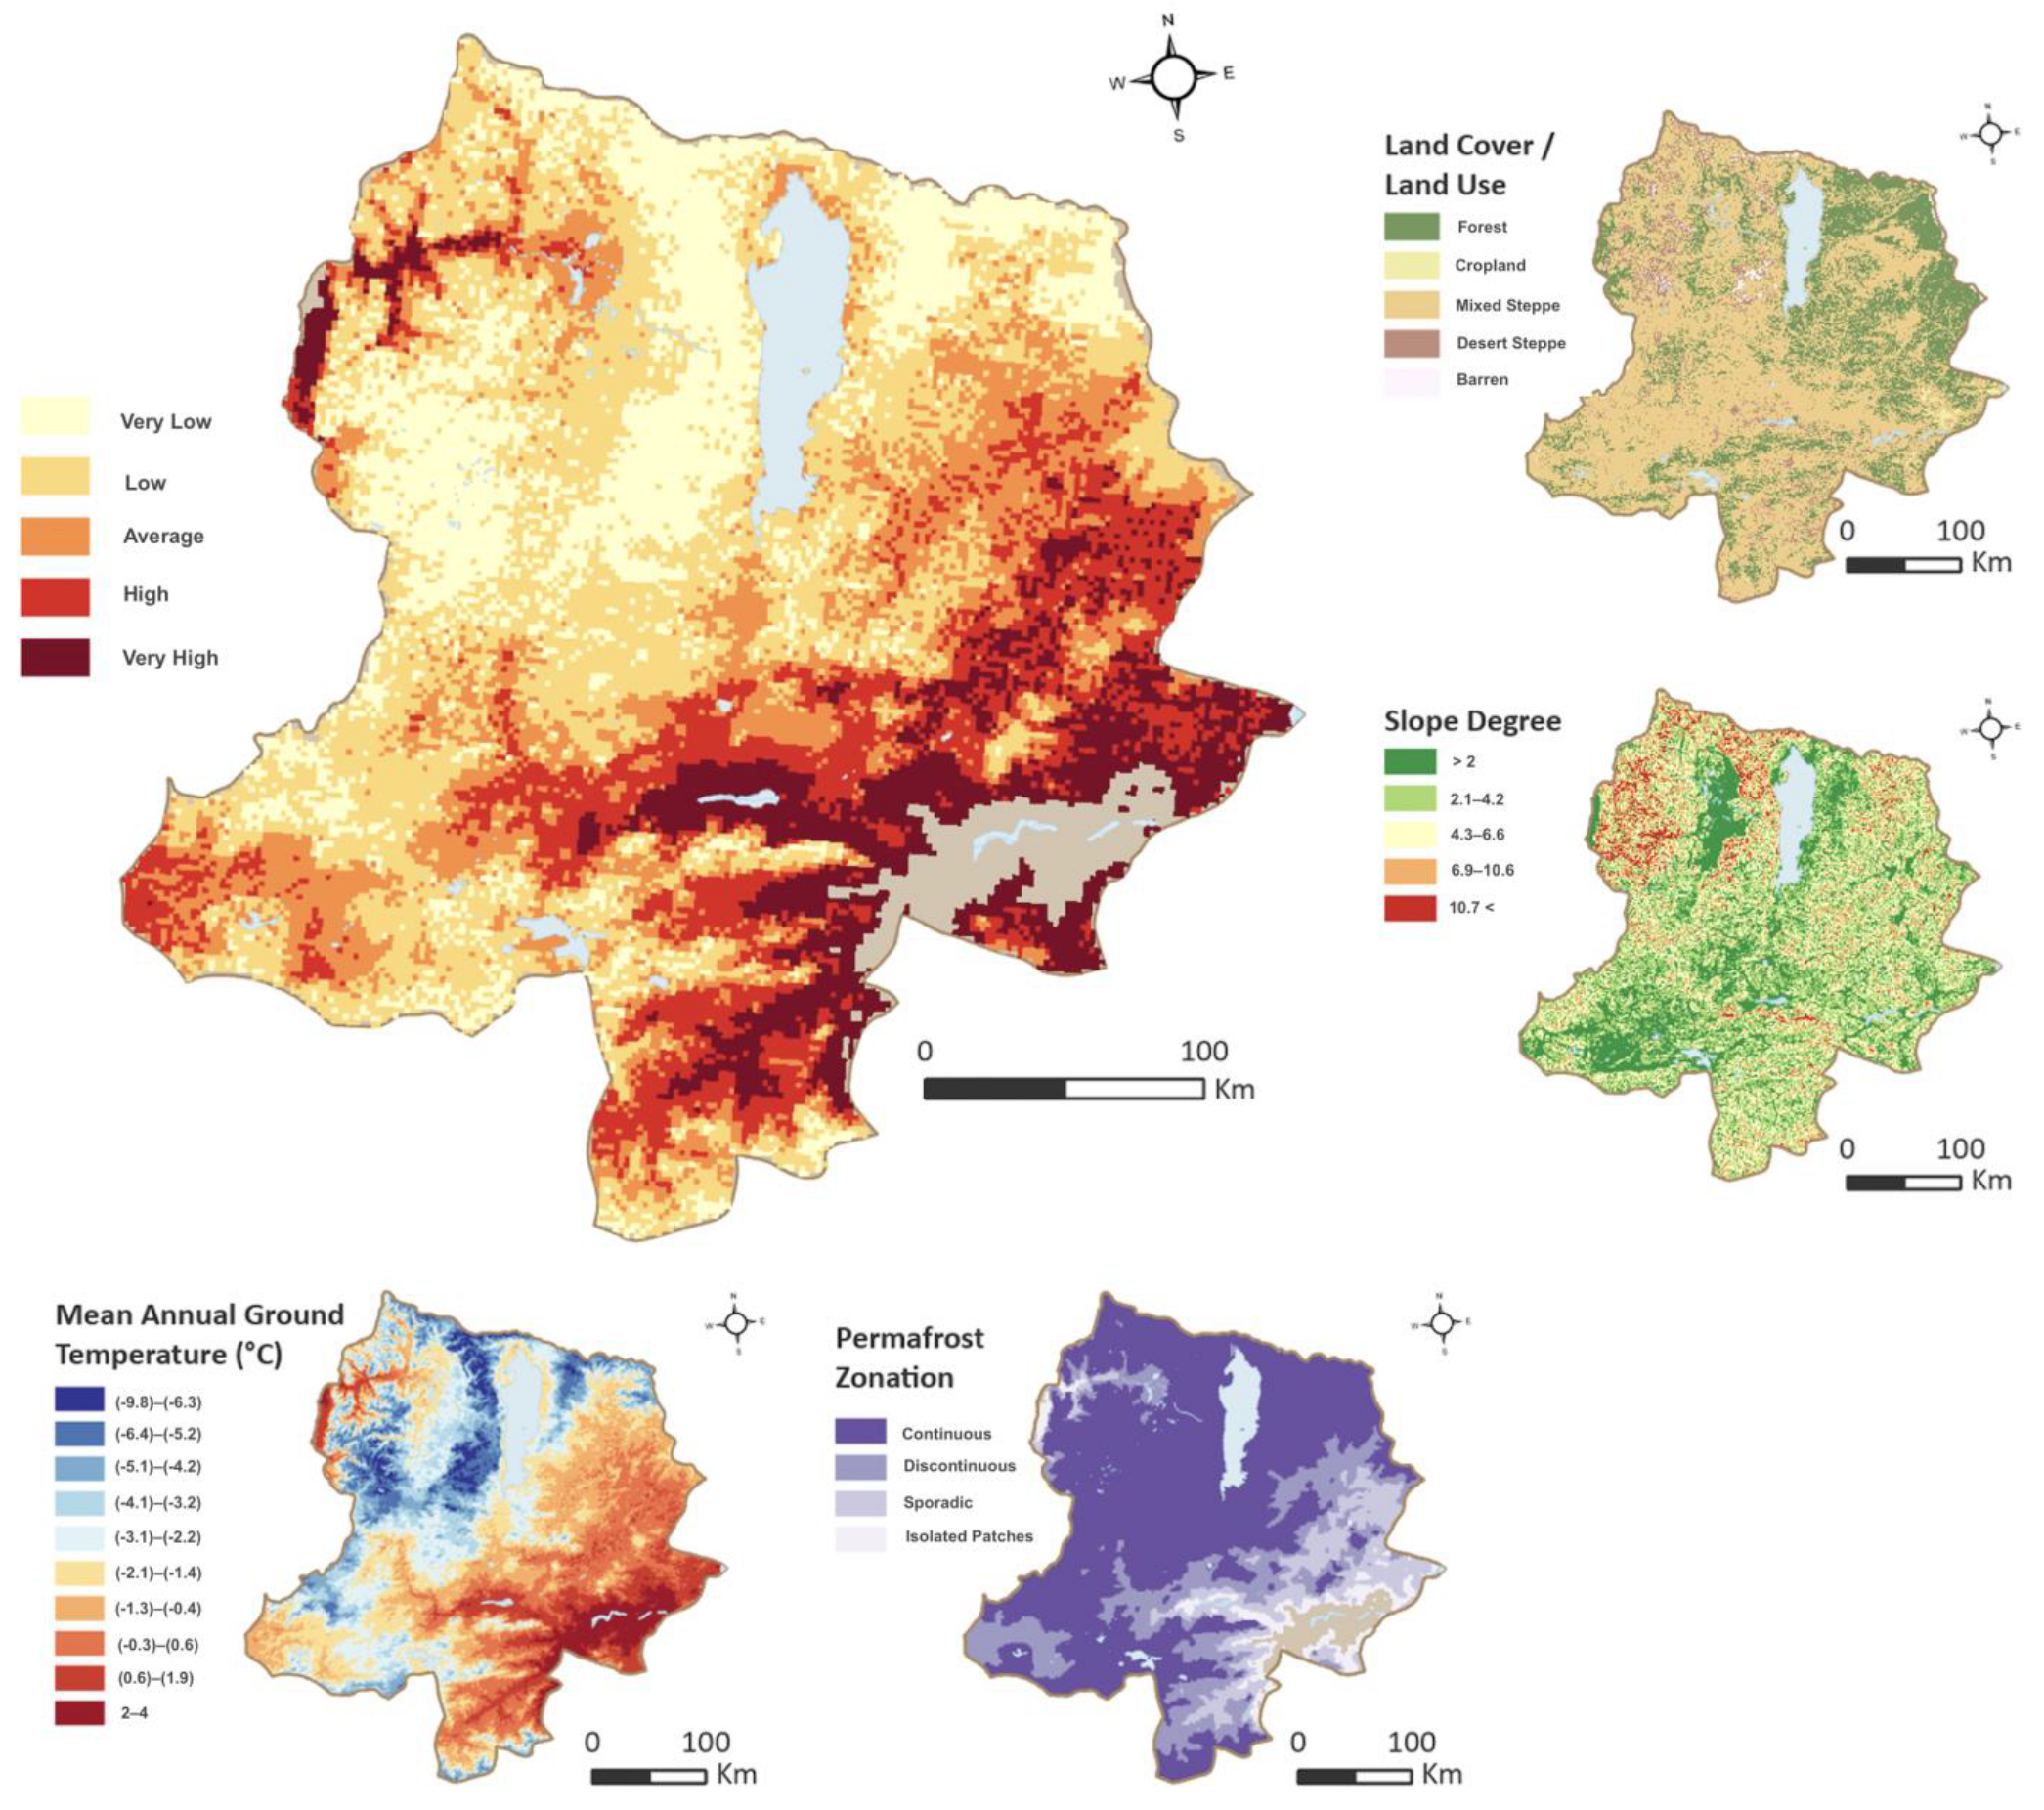
Figure 7.
Photo panel showing examples of natural hazards observed threatening infrastructure and pastoral activities in June 2022, including (a) lakeshore flooding in Khatgal; (b) lakeshore erosion in Tsagaannuur; (c) vehicle-induced thermokarst and pasture degradation, Darhad Valley; (d) thermokarst subsidence, Darkhad Valley (e) road erosion by fluvial action, Ulaan-Uul; (f) mass wasting (landslides and slumps) and stream flooding, Dukha summer encampment. Photos (a–c) by K.E. Nyland and drone images (d–f) by D.V. Kobylkin, June 2022.
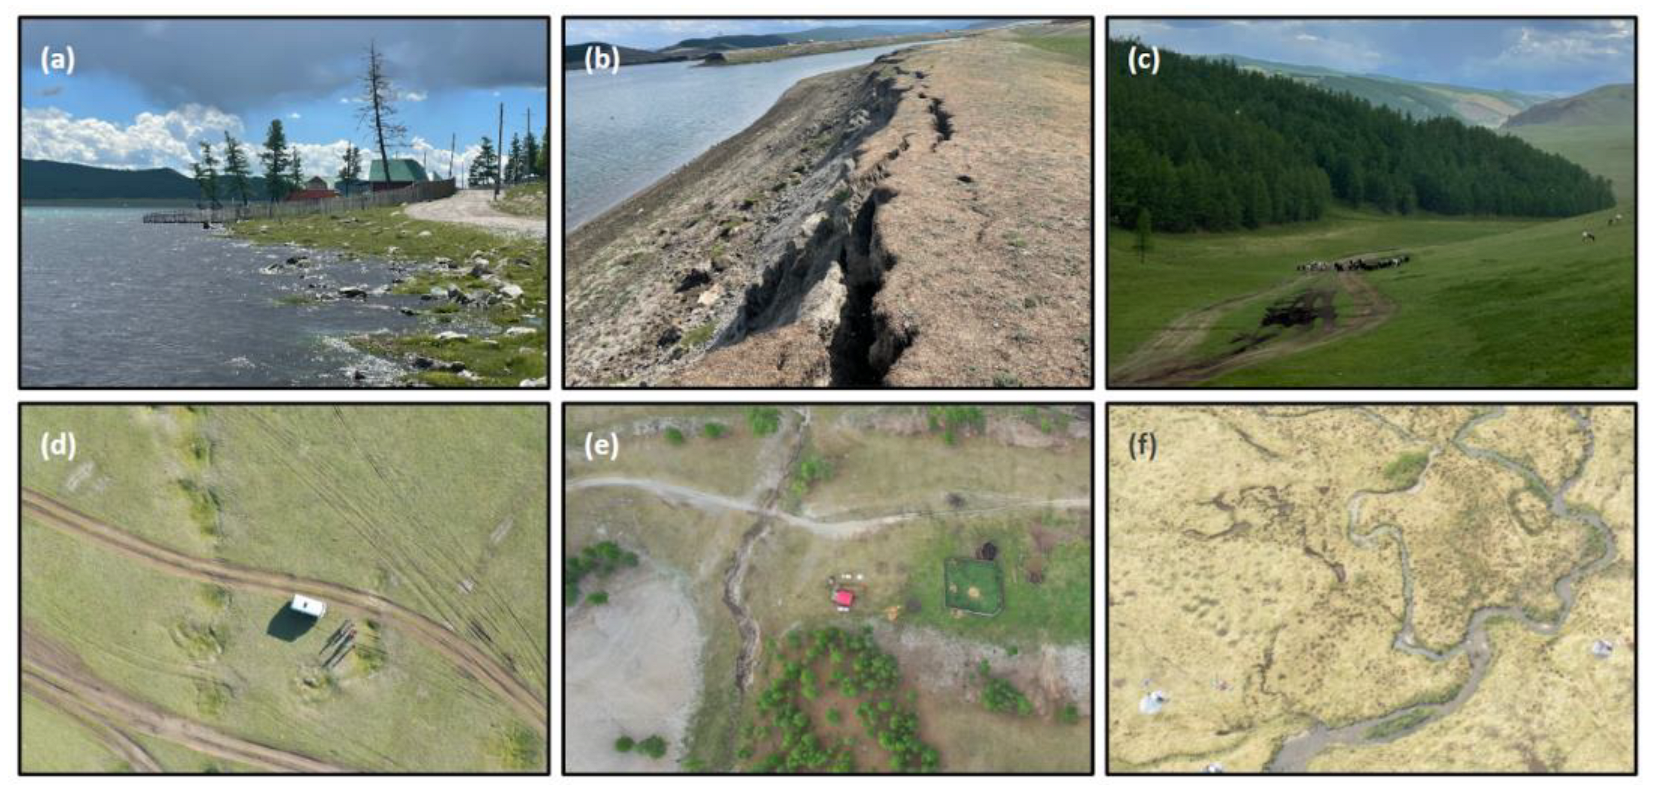
Figure 8.
Integrated risk map.
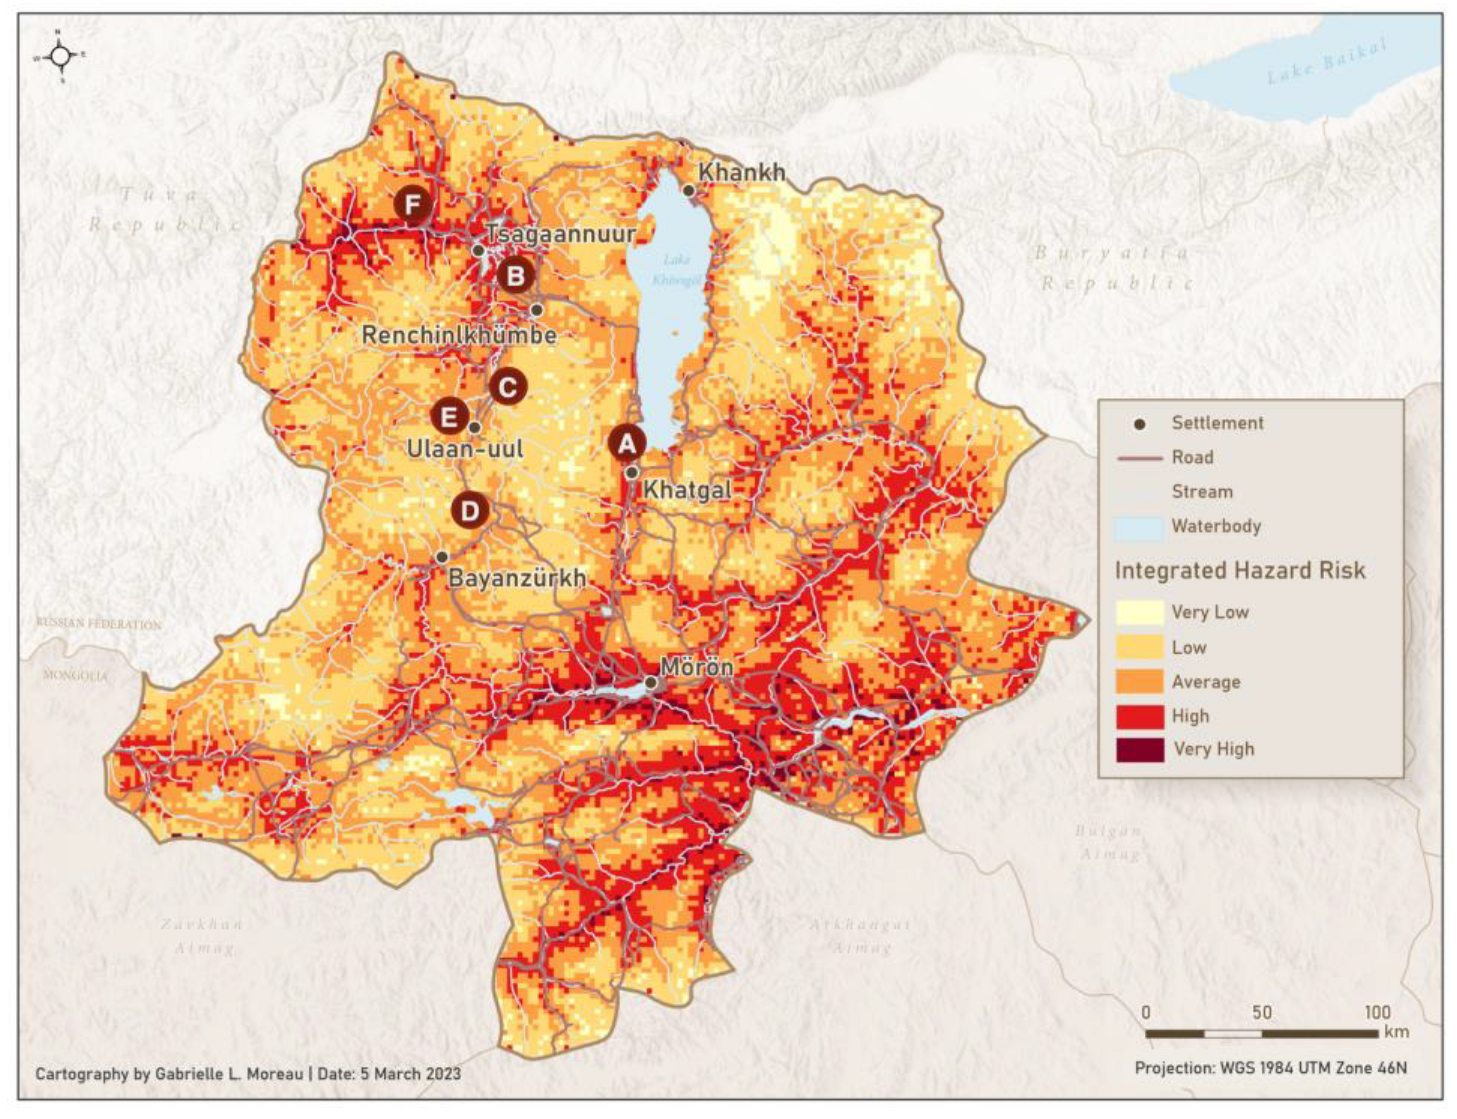
Figure 9.
Relative degree of mobility and resource availability for hazard mitigation and adaptation of Khövsgöl communities. Photos by K.E. Nyland and D.V. Kobylkin, June 2022. Icons by G.L. Moreau, January 2023.
Figure 9.
Relative degree of mobility and resource availability for hazard mitigation and adaptation of Khövsgöl communities. Photos by K.E. Nyland and D.V. Kobylkin, June 2022. Icons by G.L. Moreau, January 2023.


Table 1.
Pairwise comparison matrix and normalized principal eigenvector for mass wasting risk.
| Pairwise Comparison Matrix | Weight | |||||
|---|---|---|---|---|---|---|
| Criteria | LCLU | Slope | Dist. to Fault | Dist. to Stream | Dist. to Road | |
| LCLU | 1 | 1/4 | 1/2 | 1/3 | 3 | 0.13 |
| Slope | 4 | 1 | 3 | 3 | 3 | 0.42 |
| Dist. to Fault | 2 | 1/3 | 1 | 1/2 | 1 | 0.13 |
| Dist. to Stream | 3 | 1/3 | 2 | 1 | 2 | 0.22 |
| Dist. to roads | 1/3 | 1/3 | 1 | 1/2 | 1 | 0.1 |
| CR = 0.09 | ||||||
Table 2.
Pairwise comparison matrix and normalized principal eigenvector for flooding risk.
| Pairwise Comparison Matrix | Weight | |||||
|---|---|---|---|---|---|---|
| Criteria | LCLU | Slope | Elevation | Dist. to Water | Drainage Density | |
| LCLU | 1 | 1 | 1/4 | 1/4 | 1/4 | 0.07 |
| Slope | 1 | 1 | 1/3 | 1/3 | 1/4 | 0.08 |
| Elevation | 4 | 3 | 1 | 1/3 | 1/3 | 0.17 |
| Dist. to Water | 5 | 3 | 3 | 1 | 3 | 0.41 |
| Drainage Density | 4 | 4 | 3 | 1/3 | 1 | 0.27 |
| CR = 0.07 | ||||||
Table 3.
Pairwise comparison matrix and normalized principal eigenvector for permafrost thawing risk.
Table 3.
Pairwise comparison matrix and normalized principal eigenvector for permafrost thawing risk.
| Pairwise Comparison Matrix | Weight | ||||
|---|---|---|---|---|---|
| Criteria | Permafrost Zonation | Ground Temp. | Slope | LCLU | |
| Permafrost Zonation | 1 | 1 | 4 | 4 | 0.40 |
| Ground Temp. | 1 | 1 | 4 | 3 | 0.37 |
| Slope | 1/4 | 1/4 | 1 | 1/3 | 0.08 |
| LCLU | 1/4 | 1/3 | 3 | 1 | 0.15 |
| CR = 0.05 | |||||
Table 4.
Random Index (RI).
| N | 1 | 2 | 3 | 4 | 5 | 6 | 7 | 8 | 9 | 10 |
|---|---|---|---|---|---|---|---|---|---|---|
| RI | 0.00 | 0.00 | 0.58 | 0.9 | 1.12 | 1.24 | 1.32 | 1.41 | 1.46 | 1.49 |
Table 5.
The classes of mass wasting hazard criteria according to weights.
| Criteria | Class | Index | Ranks of Hazard Levels | Weight (%) |
|---|---|---|---|---|
| LCLU Types | Forest | 2 | Low | 13% |
| Meadow Steppe | 6 | High | ||
| Real Steppe | 6 | High | ||
| Desert Steppe | 8 | Very High | ||
| Cropland | 2 | Low | ||
| Water | 1 | Very Low | ||
| Built Area | 1 | Very Low | ||
| Barren | 10 | Extremely High | ||
| Slope (°) | 0–2 | 2 | Low | 43% |
| 2.1–4.2 | 4 | Moderate | ||
| 4.3–6.6 | 6 | High | ||
| 6.9–10.6 | 8 | Very High | ||
| 10.7–24.7 | 10 | Extremely High | ||
| Distance from Fault Lines (km) | <20 | 10 | Extremely High | 13% |
| 40 | 8 | Very High | ||
| 60 | 6 | High | ||
| 80 | 4 | Moderate | ||
| 81< | 2 | Low | ||
| Distance from Streams (m) | <1000 | 10 | Extremely High | 21% |
| 1001–2500 | 8 | Very High | ||
| 2501–5000 | 6 | High | ||
| 5001–10,000 | 4 | Moderate | ||
| 10,001< | 2 | Low | ||
| Distance from Roads (km) | <0.5 | 10 | Extremely High | 10% |
| 1 | 8 | Very High | ||
| 2.5 | 6 | High | ||
| 5 | 4 | Moderate | ||
| 10 | 2 | Low |
Table 6.
The classes of flooding hazard criteria according to weights.
| Criteria | Class | Index | Ranks of Hazard Levels | Weight (%) |
|---|---|---|---|---|
| LCLU Types | Forest | 2 | Low | 7% |
| Meadow Steppe | 6 | High | ||
| Real Steppe | 6 | High | ||
| Desert Steppe | 8 | Very High | ||
| Cropland | 2 | Low | ||
| Water | 1 | Very Low | ||
| Built Area | 1 | Very Low | ||
| Barren | 10 | Extremely High | ||
| Slope (°) | 0–2 | 10 | Extremely High | 8% |
| 2.1–4.2 | 8 | High | ||
| 4.3–6.6 | 6 | High | ||
| 6.9–10.6 | 4 | Moderate | ||
| 10.7–24.7 | 2 | Low | ||
| Elevation (m) | <1600 | 10 | Extremely High | 17% |
| 1601–1800 | 8 | Very High | ||
| 1800–2000 | 6 | High | ||
| 2001–2200 | 4 | Moderate | ||
| 2201< | 2 | Low | ||
| Dist. from Water (m) | <5000 | 10 | Extremely High | 41% |
| 5001–10,000 | 8 | Very High | ||
| 10,001–15,000 | 6 | High | ||
| 15,001–20,000 | 4 | Moderate | ||
| 20,001< | 2 | Low | ||
| Drainage Density | 0.001–1.4 | 2 | Low | 27% |
| 1.5–3.6 | 4 | Moderate | ||
| 3.7–6 | 6 | High | ||
| 6.1–9 | 8 | Very High | ||
| 9.1–16.5 | 10 | Extremely High |
Table 7.
The classes of permafrost thawing hazard criteria according to weights.
| Criteria | Class | Index | Ranks of Hazard Levels | Weight (%) |
|---|---|---|---|---|
| LCLU Types | Forest | 2 | Low | 15% |
| Meadow Steppe | 6 | High | ||
| Real Steppe | 6 | High | ||
| Desert Steppe | 8 | Very High | ||
| Cropland | 2 | Low | ||
| Water | 1 | Very Low | ||
| Built Area | 1 | Very Low | ||
| Barren | 10 | Extremely High | ||
| Slope (°) | 0–2 | 10 | Extremely High | 8% |
| 2.1–4.4 | 8 | Very High | ||
| 4.5–7 | 6 | High | ||
| 7.1–10.8 | 4 | Moderate | ||
| 10.9–24.72 | 2 | Low | ||
| Permafrost Zonation | Continuous | 2 | Low | 40% |
| Discontinuous | 4 | Moderate | ||
| Sporadic | 7 | High | ||
| Isolated Patches | 10 | Extremely High | ||
| Ground Temperature (°C) | (−9.8)–(−6.3) | 1 | Very Low | 37% |
| (−6.4)–(−5.2) | 2 | Low | ||
| (−5.1)–(−4.2) | 3 | Moderately Low | ||
| (−4.1)–(−3.2) | 4 | Moderate | ||
| (−3.1)–(−2.2) | 5 | Moderately High | ||
| (−2.1)–(−1.4) | 6 | High | ||
| (−1.3)–(−0.4) | 7 | High to Very High | ||
| (−0.3)–0.6 | 8 | Very High | ||
| 0.6–1.9 | 9 | Very to Extremely High | ||
| 2–4 | 10 | Extremely High |
Disclaimer/Publisher’s Note: The statements, opinions and data contained in all publications are solely those of the individual author(s) and contributor(s) and not of MDPI and/or the editor(s). MDPI and/or the editor(s) disclaim responsibility for any injury to people or property resulting from any ideas, methods, instructions or products referred to in the content. |
© 2023 by the authors. Licensee MDPI, Basel, Switzerland. This article is an open access article distributed under the terms and conditions of the Creative Commons Attribution (CC BY) license (https://creativecommons.org/licenses/by/4.0/).
Share and Cite
MDPI and ACS Style
Moreau, G.L.; Nyland, K.E.; Kuklina, V.V. Traditional Nomadism Offers Adaptive Capacity to Northern Mongolian Geohazards. GeoHazards 2023, 4, 328-349. https://doi.org/10.3390/geohazards4030019
AMA Style
Moreau GL, Nyland KE, Kuklina VV. Traditional Nomadism Offers Adaptive Capacity to Northern Mongolian Geohazards. GeoHazards. 2023; 4(3):328-349. https://doi.org/10.3390/geohazards4030019
Chicago/Turabian StyleMoreau, Gabrielle L., Kelsey E. Nyland, and Vera V. Kuklina. 2023. "Traditional Nomadism Offers Adaptive Capacity to Northern Mongolian Geohazards" GeoHazards 4, no. 3: 328-349. https://doi.org/10.3390/geohazards4030019