
Transient Behavior of CO and CO2 Hydrogenation on Fe@SiO2 Core–Shell Model Catalysts—A Stoichiometric Analysis of Experimental Data


Institute of Chemical Engineering, Ulm University, 89081 Ulm, Germany
*
Author to whom correspondence should be addressed.
Reactions 2022, 3(3), 374-391; https://doi.org/10.3390/reactions3030027
Submission received: 8 June 2022
/
Revised: 14 July 2022
/
Accepted: 15 July 2022
/
Published: 18 July 2022
Abstract
:The hydrogenation of CO and CO2 from industrial exhaust gases into CH4 represents a promising method for sustainable chemical energy storage. While iron-based catalysts are in principle suitable for that purpose, the active metal Fe undergoes a complex transformation during the chemical reaction process. However, only little is known about the change in catalytically active species under reaction conditions, primarily caused by structural changes in the catalyst material, so far. By using core–shell model materials, factors that alter the catalyst structure can be excluded, making it possible to observe the direct influence of the reactants on the activity in the present work. Furthermore, stoichiometric analysis was used as a key tool for the evaluation of individual key reactions in the complex reaction network purely from experimental data, thus making it possible to draw conclusions about the catalyst state. In the case of CO hydrogenation, the presumed Boudouard reaction and the associated carburization of the catalyst can be quantified and the main reaction (CO methanation) can be determined. The results of the CO2 hydrogenation showed that the reverse water–gas shift reaction mainly took place, but under an ongoing change in the catalytic active iron phase. Due to the systematic exchange between CO and CO2 in the reactant gas stream, a mutual influence could also be observed. The results from the stoichiometric analysis provide the basis for the development of kinetic models for the key reactions in future work.
1. Introduction
The worldwide growth of industrialization and its impact on global climate, e.g., the effect of rising emissions, leads more and more to the necessity of the suitable, economical and sustainable utilization of greenhouse gases [1,2]. During the last decades, different options for reasonable carbon capture, storage and utilization concepts have been widely discussed, with the chemical conversion of CO2 towards chemicals and fuels being among the most relevant [3,4,5,6]. As a consequence, the production of methane as synthetic natural gas (SNG) from sustainable resources via the so-called Power-to-Gas (PtG) process gains increasing importance, as methane can easily be distributed and utilized in the existing natural gas grid infrastructure [7,8,9]. The methanation reaction set the basis for similar reactions based on COx hydrogenation, which involves the formation of higher hydrocarbons [10,11,12,13] or alcohols [13,14,15]. In the overarching concept, the hydrogenation of CO2 or CO towards methane is performed utilizing H2 produced with the electrolysis of water. In a broader perspective, the PtG process can be extended to the production of various hydrocarbons relevant for use in the energy sector or in the chemical value chain via the more general Power-to-X approach [16]. Already in 1902 Sabatier et al. discovered that methane is formed on Ni-based catalysts according to the stoichiometric Equations (1) and (2) [17].
Despite the fact that several metals, such as Ru, Rh, Co and Fe, are active for methanation, Ni is mainly investigated in research and is applied in industrial production due to the high activity and selectivity towards CH4 [18,19,20]. Besides these advantages, Ni catalysts suffer from high human and environmental toxicity [21,22,23,24]. Therefore, iron-based catalysts attract attention as a suitable alternative for COx hydrogenation reactions, because iron is abundant, cost efficient and less harmful to the environment with only little cutbacks in activity and selectivity in methanation [25,26,27,28]. Besides these benefits for Fe-based catalysts, additional water–gas shift (WGS, (3)) activity has to be considered as a competing reaction in CO2 hydrogenation [29], while solid carbon formation via the Boudouard reaction (4) and the formation of ethylene (5) as major by-product plays a potential role for CO hydrogenation under low temperature and pressure conditions [30].
The importance of these reactions in specific reaction scenarios, however, not only depends on the gas composition but also on the present Fe modification in the catalyst. Iron oxides, for example, are the main active components for high-temperature water–gas shift reactions [31,32]. On the contrary, metallic and carbidic Fe species are the preferred active phases for the synthesis of methane and higher hydrocarbons (Fischer–Tropsch Synthesis) [33,34]. Furthermore, different carbonaceous species adsorbed on the catalyst surface show specific activity in COx hydrogenation [35,36,37].
Importantly, the dynamic change in the catalytic properties due to the transformation of the Fe species under reaction conditions also has to be considered. Iron-based catalysts are known to undergo complex phase transformations during syngas reactions, which can change the catalytic properties significantly [25,37]. Especially during COx hydrogenation, the carburization and oxidation of the Fe-based catalyst plays an important role regarding catalytic activity [29,38,39,40] and hence influences the preferred reaction pathway [9,35,41,42]. For instance, under Fischer–Tropsch conditions, it is known that the transformation of iron-carbide-based catalysts into iron oxides can occur dynamically via oxidation within the first few hours, induced by the water formed during the reaction [43]. As a consequence, this directly affects the WGS activity and thus the product distribution [44,45,46,47]. Additionally, the transformation of iron-oxide-based catalysts into a mainly carbidic state is assumed to progress within the first few hours under CO2 hydrogenation conditions [33]. Subsequently, an increasing amount of iron carbide species strongly affects the selectivity towards CH4 [25]. In conclusion, limited activity in the hydrocarbon synthesis and complex phase transformations of the Fe material under reaction conditions, e.g., by the formation of different carbonaceous species, is still a challenge and matter of ongoing research [48,49].
To overcome these limitations and to expedite further investigations of structure–activity relations, nanostructured core–shell catalysts with their unique and tunable properties are applied in catalysis research [30,50,51]. Changes in the size and shape of the active core nanoparticles caused during conversion can be studied, for example, ex situ by transmission electron microscopy (TEM) [48] or in situ via environmental TEM [52] or a vibrating-sample magnetometer [43], as the core–shell arrangement is well defined and stable during the reaction [53]. Studies on Fe-based core–shell catalysts already cover a broad variety of important catalytic processes, e.g., ammonia decomposition [53], esterification [54], alcohol oxidation [13,55], olefin hydrogenation [13,56] and Fischer–Tropsch synthesis [57]. Recently, the structure–activity relation of bulk Fe catalysts compared to core–shell structures during CO2 hydrogenation was investigated by Kirchner et al. [49]. These applications demonstrate that core–shell materials meet the requirements for usage as model materials in catalysis research through their tunable properties.
In the present contribution, we use the well-defined model material properties of Fe-based core–shell catalysts with a particular focus on the transient behavior during CO/CO2 hydrogenation due to carburization and oxidation under reaction conditions. Therefore, the catalyst was tested under an alternating CO and CO2 hydrogenation atmosphere at different temperatures after a defined activation procedure, respectively. Our intention was to simulate the fluctuating composition of the synthesis gas mixtures as it would occur under real conditions and to provide insights applicable to technical application cases. In particular, between each CO and CO2 hydrogenation step, the catalyst was conditioned by the hydrogenation of a CO/CO2 mixture in order to maintain a defined and reproducible initial state of the catalytic active species. For the evaluation of the reaction products during long-term experiments, on-line gas chromatography was used. Stoichiometric analysis of the measured transient product composition was applied to estimate the extent of each individual key reaction. Through this method, it was possible to empirically elucidate the influence of the reaction conditions on the carburization and oxidation of the catalyst material and the resulting reaction extent. Consequently, the aim of the present study is to provide the experimental data basis and the methodology to derive the kinetics for the involved stoichiometric reactions and the deactivation behavior of Fe-based catalysts during CO and CO2 hydrogenation.
2. Materials and Methods
2.1. Catalyst Preparation and Characterization
The catalyst precursor material, FexOy@SiO2 core–shell nanoparticles, was synthesized using a modified microemulsion method, as previously described in detail [30]. First, the oil phase of the microemulsion was prepared by mixing 100 mL of cyclohexane (VWR Chemicals, Darmstadt, Germany, AnalaR NORMAPUR®) with Brij 58 (0.25 M; Sigma Aldrich/Merck, Darmstadt, Germany) at 50 °C. Subsequently, 5 mL of an aqueous FeCl3 solution (5 mM; Acros Organics, Geel, Belgium, p.a.) was added to the mixture under continuous stirring. Afterwards, the FexOy nanoparticles were obtained by the addition of 3.185 mL of hydrazine-hydrate solution (35 wt.% aqueous solution, Sigma Aldrich/Merck) to the emulsion. The encapsulation of the as-prepared FexOy nanoparticles was achieved by the further addition of 21.4 mL of TEOS (Merck, p.a.) and 3 mL of NH3 solution (5 M; Carl Roth, Karlsruhe, Germany, 30 wt.%, ROTIPURAN®) into the colloidal solution under continuous stirring and slight reflux conditions. After 2 h, the synthesized core–shell particles were washed three times and dried over night at 80 °C. The final reddish-brown Fe2O3@SiO2 core–shell nanoparticles were obtained after calcination at 420 °C for 6 h.
Because the catalyst undergoes complex phase transitions during the activation and reaction steps, the catalyst used for the characterization and catalytic experiments will be, hereafter, named Fe@SiO2 for simplification reasons. However, the Fe species might be metallic, oxidic or carbidic or even a mixture thereof in each specific treatment step.
Bright field TEM experiments were performed at the Central Institute for Electron Microscopy, Ulm University, using a Zeiss TEM 109 equipped with a CCD (charge-coupled device) camera. For sample preparation, a droplet of an ethanol (VWR, 96 % Ph. Eur.) solution containing the sample powder (ca. 0.5 mg/mL) was deposited on a carbonized Cu grid, followed by the evaporation of ethanol. For each material, the size distribution of the FexOy core and SiO2 shell was derived from the counting of at least 300 particles. Powder X-Ray diffraction (PXRD) was performed at the Institute of Inorganic Chemistry II, Ulm University, using a PANalytical X’Pert Pro-MPD with Cu-Kα radiation (45 kV, 40 mA). The diffractograms were recorded in 2θ mode from 5 to 80° 2θ with a step width of 0.033° 2θ and a time of 10 s per step.
Temperature programmed reduction (TPR) and N2-physisorption experiments of the as-prepared catalysts were performed with a Micromeritics 3Flex device. For the N2-physisorption experiments, adsorption isotherms including the micropore regime and desorption isotherms were recorded. Micropore analysis was performed using the inbuilt Horvath–Kawazoe method. The pretreatment for N2-physisorption was performed using the Micromeritics SmartVacPrep device for degassing the samples at 1 mbar and 240 °C for 2 h. Before the TPR measurements, the samples were pretreated by drying under an Ar stream from room temperature to 200 °C at a heating rate of 5 K/min and a holding time of 2 h. During the TPR measurements, the temperature was increased from 50 to 900 °C at a constant heating rate of 5 K/min under a continuous flow of 10 vol.% H2/Ar at 40 mLSTP/min. The H2 consumption was measured with a thermal conductivity detector (TCD).
2.2. Catalytic Experiments
The catalytic experiments were performed in a tubular stainless-steel reactor (0.25-inch outer diameter, 0.9 mm wall thickness) under controlled temperature conditions. The reactor temperature was monitored on the outside wall of the reactor and inside the catalyst bed by K-type thermocouples, respectively. The reactor was operated by a continuous supply of gases from the top by means of mass flow controllers (EL-FLOW Select, Bronkhorst), where H2 (5.0 purity, MTI, Richmond, CA, USA), CO/Ar (90 vol% CO 3.8 purity in Ar 5.0 purity, Air Liquide) and CO2 (4.8 purity, MTI) were supplied without further purification. For each experiment, about 200 mg of the granulated and sieved Fe2O3@SiO2 catalyst precursor (size fraction 125–200 µm) were used. A two-step activation procedure was established before the catalytic experiments were performed: In step one, the initial reduction of the Fe2O3 precursor material to metallic Fe was performed under the constant flow of pure H2 at 180 mLSTP/min and a 400 °C catalyst bed temperature for 12 h. In the second step, the catalyst was conditioned via CO hydrogenation (molar ratio H2:CO = 4.5; p = 1 bar; = 100 mLSTP/min) at 350 °C catalyst bed temperature for 13 h to obtain a defined and reproducible catalyst state at the beginning of each experiment.
For the subsequent catalytic experiments, the catalyst was examined under alternating CO and CO2 hydrogenation conditions at three different temperatures (350, 370 and 390 °C), respectively, as schematically shown in Figure 1. Here, the CO/CO2 ratio was sequentially changed from 1/0 → 1/1 → 0/1 → 1/1 → 1/0. This complex experimental procedure is designated as a measurement campaign, while single experiments are defined by changes in the operating conditions. The specific procedure in each campaign was chosen in order to simulate the fluctuating operating conditions relevant for industrial applications. In conclusion, there were 3 campaigns in total, executed at 350, 370 and 390 °C, respectively. The CO2 hydrogenation steps will be hereafter named ‘CO2 treatment’ for simplification reasons. Each COx hydrogenation step was performed with a molar ratio of H2:COx = 4.5, p = 1 bar and a total gas flow of = 100 mLSTP/min for 12 h. between each CO and CO2 hydrogenation step, the catalyst was conditioned by the hydrogenation of a CO/CO2 mixture (H2:COx = 4.5, CO/CO2 = 1, p = 1 bar and total gas flow of = 100 mLSTP/min for 12 h) at current temperatures. This intermediate conditioning approach provides a defined and reproducible catalyst state regarding the carburization degree prior to each experiment [25].
Since the maximum conversion observed is limited to 1.05% (for CO2 hydrogenation at 390 °C), gradients in the catalyst bed are negligible. Hence, a differential reaction system and the absence of volume contraction associated with the reaction extent can be assumed (). Accordingly, the inlet () and outlet () molar flow rates of each component can be calculated from the respective molar fractions and assuming the ideal gas law according to Equation (6).
While the calculation of the inlet molar fraction is trivial based on the mass flow controller set points, the outlet molar fraction is determined from gas analysis executed via an on-line gas chromatograph (Thermo Fischer), equipped with a sample loop (20 µL), a flame ionization detector (FID) for hydrocarbons (CH4 and C2+) and a TCD for CO and CO2. The universal gas constant as well as the standard temperature and pressure are also used.
2.3. Evaluation of Rates of the Stoichiometric Reactions
In order to evaluate the contribution of carbon formation from the observed formation rates, the following model was applied, which is based on two main assumptions. Firstly, we assumed intrinsic conditions during the experiments and, therefore, ruled out any contribution of transport limitations (e.g., internal and external heat and mass transfer). Secondly, the packed bed was assumed to exhibit no gradients. Hence, a homogeneous, isothermal model for a well-mixed continuous stirred tank reactor (CSTR) is appropriate to describe the reactor mathematically. Furthermore, the characteristic time for the deactivation processes was assumed to be large compared to the mean residence time, which provides steady-state balances being sufficient. The corresponding mass balance for each component is given in Equation (7), with the inlet and outlet molar flow rates ( and ), the stoichiometric coefficient and the extent of reaction . Note that describes the rate of the stoichiometric reaction , while the formation rate of compound is represented by either side of Equation (7). Equation (8) represents Equation (7) in matrix notation with the matrix of stoichiometric coefficients , the vectors of the conversion (resp. formation rate) and the extent of reaction .
Based on the stoichiometric reactions (1)–(5), the matrix of the stoichiometric coefficients (Equation (9)) can be derived, which allows us to identify the key reactions and components [58]. We identified CO and CO2 hydrogenation towards CH4 (Equations (1) and (2)), the Boudouard reaction (Equation (4)) and the formation of ethylene (Equation (5)) as the key reactions. Correspondingly, the gaseous carbon species CO, CO2, CH4 and C2H4 were identified as the key components.
The conversion of the non-key components can be calculated from the measured conversion of the key components according to Equation (10), where is the sub-matrix of the non-key components H2, H2O and C, and is the inverse sub-matrix of the key components CO, CO2, CH4 and C2H4.
with
Since carbon is formed as solid deposition on the iron surface, it is assumed to not leave the reactor with the continuous gas stream. Hence, the accumulation of carbon in the reactor takes place. Equation (11) links the accumulation with time to the formation rate of carbon determined from the material balance expressed by Equation (7). The combination of Equations (10) and (11) leads to Equation (12), which allows us to derive the formation rate of carbon from the measured conversion of carbon from the measured conversion of the carbon containing gaseous key components CO, CO2, CH4 and C2H4. Equation (12) can further be simplified to Equations (13) and (14) for the hydrogenation of either CO or CO2 since for CO2 and for CO hydrogenation. It has to be mentioned that, when analyzing the key components only, we inherently assumed a closed carbon mass balance. Due to the severe challenges in analyzing the non-key components H2, H2O and solid carbon with sufficient accuracy, the degrees of freedom are lacking for verifying the balance.
The reaction extent vector represents the rate of the stoichiometric key reactions and is derived from the measured conversion using the approach from Equation (8), which leads to Equation (15). In component notation, Equations (16) to (19) are derived for the rates of the respective key reactions, where and represent CO and CO2 hydrogenation (Equations (1) and (2)), respectively, while accounts for the Boudouard reaction (Equation (4)) and for the ethylene formation reaction (Equation (5)). Note that the right sides of Equations (12) and (18) are identical, so the change in carbon formation can directly be derived from the evaluation of the Boudouard reaction rate. Since the formation rate of ethylene is significantly higher (factor 10 or higher) compared to that of other C3+ hydrocarbons, all C2+ species are lumped and considered as ethylene C2H4.
The apparent activation energies for the stoichiometric key reactions are estimated from the calculated reaction extents obtained at different reaction temperatures.
The selectivity of a reaction product with respect to reactant was calculated by Equation (20), while the conversion of component is determined via Equation (21).
Note that, depending on the experimental conditions, certain reactants are not fed to the reactor. Hence, Equation (21) is not applicable to those components in these specific cases.
3. Results and Discussion
3.1. Catalyst Characterization
Figure 2A shows representative TEM micrographs of spherical silica-encapsulated Fe2O3 nanoparticles with an average core size of and a Fe mass fraction of ca. 13 wt.% directly after synthesis. This resulted in an estimated metal surface area of the iron core in a reduced state of assuming spherical particles and a Fe density of . From the synthesis route, an average thickness of the SiO2 shell of was obtained with an average pore size of (calculated via the HK method) and a corresponding BET surface area of (see Supplementary Materials, Figure S1). PXRD analysis of the as-prepared catalyst samples after calcination revealed the core mainly to consist of γ-Fe2O3 as the main iron oxide species with a crystallite size of about 4.6 nm, estimated via the Scherrer equation using the hkl = (311) reflex (see Supplementary Materials, Figure S2). Additional information and details from the catalyst characterization can be found in our previous work [30,59].
Additionally, the TPR experiments revealed the profile for the reduction of Fe2O3 to Fe0 with H2 (see Supplementary Materials, Figure S3). Most important to mention is the shift in the initialization of the reduction process towards lower temperatures (~300 °C) for the core–shell material compared to bulk iron oxide reported in the literature (~400 °C), which is suggested to be caused by a confinement effect. In particular, the shell is assumed to change the local gas composition at the core as it, inter alia, hinders water diffusion and thus leads to the accumulation of significant amounts of water formed during the reduction in close proximity to the core. The respective effect of the water presence during the reduction of iron oxides on the TPR profile was previously reported by Zielinski et al. [60]. More details regarding the individual reduction steps were discussed previously [30].
In comparison to the as-made materials, the spent catalyst sample taken from the reactor after conducting the experiments (Figure 2B) exhibited brighter regions in the proximity of the Fe core in the center of the core–shell structures. This observation indicates a shrinkage of the Fe cores due to the reduction of the iron oxide precursor to metallic Fe during the initial H2 activation, which is associated with a change in density (7.87 g/cm3 for bulk α-Fe vs. 4.86 g/cm3 for bulk γ-Fe2O3) [61]. Furthermore, it is assumed that Fe3C formation by carburization during COx hydrogenation does not necessarily lead to a substantial increase in the core size, due to comparable density (7.69 g/cm3 for bulk Fe3C). Importantly, the observed core size shrinkage indicates permeability of the SiO2 shell by the reaction gas mixture and hence proves the accessibility of the catalytically active Fe core. Furthermore, it becomes evident that the core–shell structure stayed intact without any visible thermal sintering or coke formation during the 24 h time-on-stream (TOS) of the catalytic experiments.
3.2. Hydrogenation of CO
Figure 3 shows the formation rates for the main products CH4 (Figure 3A) and CO2 (Figure 3B) during CO hydrogenation with the Fe@SiO2 catalyst material during 12 h TOS at reaction temperatures of 350, 370 and 390 °C, respectively. The filled symbols represent the catalytic results before, while the empty symbols represent those after CO2 treatment. The missing data after 8 h at 390 °C were due to the malfunctioning of the analysis instruments. For the sake of completeness, the formation rates of the higher hydrocarbons, summarized as C2+, are shown in SI (see Supplementary Materials, Figure S4A), but will not be discussed in detail in the current contribution. The time-resolved course of the CH4 formation rate (see Figure 3A) exhibited a small but monotone increase during TOS before and after CO2 treatment. Furthermore, an increase in the CH4 formation rate was observed for the raising temperature from 350 to 390 °C, which corresponds to an apparent activation energy of 39 kJ/mol before and 46 kJ/mol after CO2 treatment (both calculated from values at ca. 8 h TOS during the respective experiment), respectively. The corresponding Arrhenius plots are shown in SI (see Supplementary Materials, Figure S5). These values are in good agreement with the literature [62] and hence underline the absence of significant mass transport limitations. Additionally, a decrease in catalytic activity can be observed, comparing CH4 formation rates before (filled symbols) and after (empty symbols) CO2 treatment at the same temperature. In contrast, the CO2 formation rate (Figure 3B) decreased slightly during the initial CO hydrogenation phase, while a pronounced decrease was observed after treating the catalyst materials under a CO2-rich atmosphere. Furthermore, the CO2 formation rates after treatment in the CO2-rich atmosphere significantly exceeded those obtained for the experiments before the treatment, while the asymptotic values appeared to be rather similar. In addition, the CO2 formation rates were rather unaffected by the temperature, contradicting expectations from Arrhenius law.
From the experimental results, two different types of deactivation behavior could be observed for CO2 formation. During the initial CO hydrogenation step, the temporal evolution of the CO2 formation was almost linear, which indicates a zero-order deactivation process. Since we assumed the Boudouard reaction was the main source for the high CO2 formation rate detected, the decrease in the reaction rate with TOS can thus be explained by the stoichiometric formation of solid carbon species together with CO2 according to Equation (4). Note that other sources for CO2 formation, besides the Boudouard reaction, are highly unlikely, since CO was the only oxygen source introduced into the reactor and the CO conversion was very low (<1.05 %). In contrast, the CO2 formation during CO hydrogenation after CO2 treatment exhibited a pronounced non-linear deactivation behavior and significantly higher rates compared to the respective experiment prior to the CO2-rich treatment. The higher CO2 formation rates could be explained either by the enhanced Boudouard reaction, the additional water–gas shift reaction or CO oxidation. The enhanced Boudouard reaction is highly unlikely, since it causes more solid carbon to be deposited, which eventually leads to the decreasing of the activity below the values in the initial experiment. It was observed, however, that the CO2 formation rates exhibited similar asymptotic values during CO hydrogenation irrespective of being pretreated in a CO2-rich atmosphere or not. The water–gas shift reaction can also be excluded, since the low CO conversion led to negligible water partial pressures, which hence lacked as stoichiometric reactant. In conclusion, we assume that CO oxidation, by the reduction of a partially oxidized Fe catalyst, was responsible for the high CO2 formation rates during CO hydrogenation after treatment in CO2-rich environments. Hence, iron oxide species are likely to form during CO2 treatments.
Oxidic iron species are known to be a less active catalyst for CO hydrogenation compared to iron carbides [29], which is in good agreement with our recent findings, primarily discussed in Figure 3. The initial excess of surface oxides inhibits CO hydrogenation and thus suppresses the formation of methane and higher hydrocarbons, as known from investigations on Fischer–Tropsch synthesis [63]. With the increasing degree of the reduction of initially oxidic iron species during CO hydrogenation, the activity for hydrocarbon formation consequently increased with TOS. In addition, more active carbidic iron species may have been formed as discussed above. Accordingly, in Figure 3 it becomes visible that the methane formation rate was smaller for the experiments after treatment in the CO2-rich atmosphere but rose with time irrespective of CO2 pretreatment. The amount of oxygen deposited in the oxidized iron species was estimated by the evaluation of the excess CO2 formation and assuming CO oxidation as the respective source. Therefore, the difference in the CO2 formation rate between the CO hydrogenation phases prior to and after the CO2 treatment step was determined and integrated for 12 h TOS. The obtained values amounted to about 0.20, 0.13 and 0.18 mmol at 350, 370 and 390 °C with respect to the estimated maximum oxygen storage capacity of the fully oxidized iron catalyst (Fe2O3 contains 0.67 mmol atomic oxygen), respectively.
Applying stoichiometric analysis to the data shown above allows for the evaluation of the extent of the Boudouard reaction and CO hydrogenation, respectively. First, the extent of the Boudouard reaction derived by Equation (18) is shown in Figure 4 as a function of TOS during CO hydrogenation for 12 h TOS at reaction temperatures of 350, 370 and 390 °C, respectively. The filled symbols represent the results before, while the empty symbols represent those after CO2 treatment. The extent of the reaction before CO2 treatment (see Figure 4A) appeared constant for all temperatures, while it exhibited a small but monotone decrease after CO2 treatment (see Figure 4B). In comparison to Figure 3, the carbon formation rate via the Boudouard reaction appeared in the same order as for CH4, which rendered it significant in the investigated stage of CO hydrogenation. The results for CO2 formation obtained after CO2 treatment, however, were not directly correlated to the Boudouard reaction, since CO oxidation by the oxidic Fe species might have superimposed the measured CO2 amount originating from carbon formation. However, Xu et al. [64] reported that oxidic iron phases are more active for the Boudouard reaction. Hence, the Fe catalyst after CO2 treatment was most probably converted from oxidic to more carbidic species during 12 h of CO hydrogenation, which resulted in the observed decrease in the Boudouard activity and thus CO2 formation. It has to be mentioned that, due to the small overall conversion, the scattering of the data points is quite pronounced. Hence, the negligible impact of temperature is not discussed. By the integration of the extent of the Boudouard reaction over 12 h TOS, the amount of formed carbon was determined to be 3.9, 3.7 and 2.8 µmol before and 13, 5.6 and 4.1 µmol after CO2 treatment at 350, 370 and 390 °C, respectively. Note that the derived amounts were only based on the evaluation of the stoichiometric key reactions. Hence, the contribution of additional reactions, such as CO oxidation with oxidic Fe species, were not considered in the analysis. Therefore, the reported values refer to the virtual amount of carbon deposited. In addition, it was assumed that the formed carbon species were most probably not integrated into the carbidic catalyst phase, since only amorphous surface carbon species are assumed to be active for further hydrogenation [35].
Furthermore, after the evaluation of the experimental data according to Equation (16), the extent of CO hydrogenation was obtained. Hence, Figure 5 shows the extent of CO hydrogenation during 12 h TOS for the reaction temperatures of 350, 370 and 390 °C, respectively. The filled symbols represent the catalytic results before, while the empty symbols represent those after the CO2 treatment. The time-resolved course before CO2 treatment (see Figure 5A) exhibited a slow but monotone increase in reaction extent at 350 °C and a rather constant profile at 370 and 390 °C. Furthermore, a slight temperature dependence was observed for both before (Figure 5A) and after (Figure 5B) CO2 treatment. Therefore, we estimated apparent activation energies of 59 ± 19 kJ/mol before and 68 ± 24 kJ/mol after CO2 treatment, calculated from the values at ca. 8 h TOS, respectively. The calculated values are in good agreement with the literature [65], though the high values for the standard deviation resulted from the scattering of the data. The corresponding Arrhenius plots are shown in SI (see Supplementary Materials, Figure S5C).
A comparison of the results of Figure 3 and Figure 5 allows us to relate the CO conversion with the CH4 formation before and after CO2 treatment. Note that the correlation between the extent of reaction and the change in the molar flow rates of the components is described in Equation (16). Comparing Figure 3 and Figure 5A (before CO2 treatment), a direct correlation between the reaction extent of CO methanation and CH4 formation can be observed during TOS, while the extent of the Boudouard reaction was small and constant, as displayed in Figure 4A. This leads to the assumption that CO methanation was the dominant mechanism under the given reaction conditions and that a constant deposition of the solid carbon species occurred. The amount of solid carbon formed can be estimated via Equation (11) and obviously increased with time, which resulted in an increasing Fe carbide fraction in the catalyst material. As discussed before, these Fe carbide species are more active towards hydrocarbon formation, leading to a raise in the CH4 formation rate [34]. Comparing Figure 3 and Figure 5B (after CO2 treatment) shows, in contrast, that an inverse correlation between and existed after approx. 2 h, while another CO conversion mechanism dominated in the first two hours. Furthermore, the formation rate of CO2 during the first two hours was significantly higher after CO2 treatment and approached the values before CO2 treatment asymptotically (Figure 3B). In addition, exceeded the stoichiometric values expected from during CO hydrogenation after CO2 treatment (Figure 4B), while it agreed well before that treatment. Hence, the catalyst history prior to the CO methanation conditions affected the reactions responsible for CO conversion. In summary, this discussion supports the previous conclusion on the reduction of oxidic Fe species.
From the experimental data, the extent of CO2 conversion during CO hydrogenation was calculated with Equation (17), both before and after CO2 treatment (see Supplementary Materials, Figure S6). No significant CO2 conversion was observed during 12 h time-on-stream (TOS) neither before (Figure S6A) nor after (Figure S6B) CO2 treatment, while an impact of the temperature appeared absent as well. Therefore, the scattering data was averaged, and the resulting extent of the reaction is summarized in Table S1 (see Supplementary Materials). Negative values indicate CO2 formation via the CH4 steam reforming (reverse CO2 hydrogenation, Equation (1)). Since this reaction was rather unlikely due to the very low amounts of CH4 and H2O in the system, the obtained values rather indicate the error margins of the stoichiometric analysis.
3.3. Hydrogenation of CO2
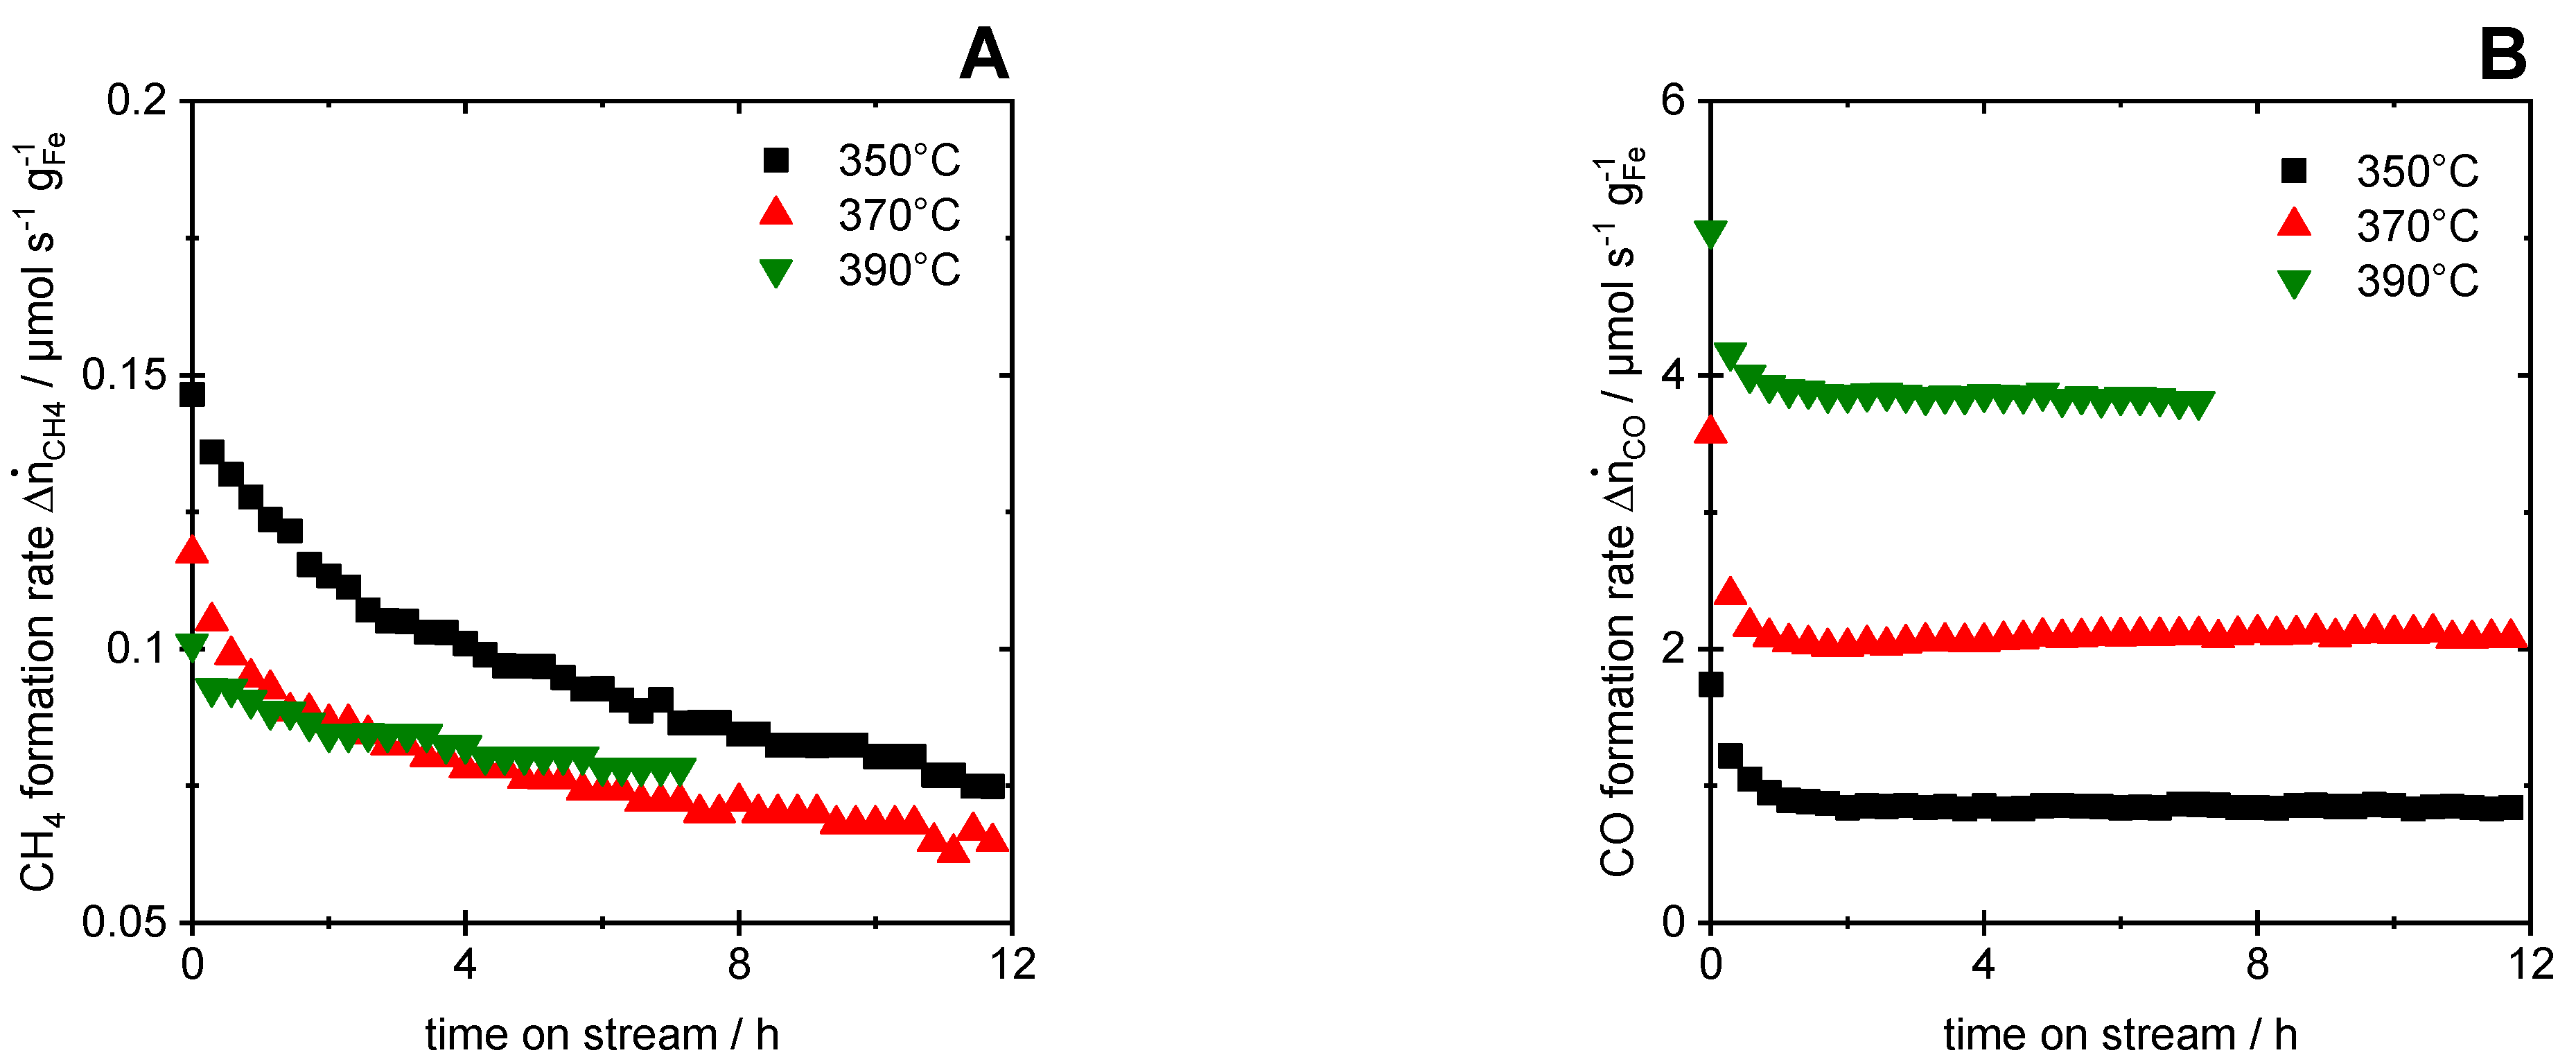
Figure 6 shows the formation rates for CH4 (Figure 6A) and CO (Figure 6B) during CO2 hydrogenation with the Fe@SiO2 catalyst material over 12 h TOS for reaction temperatures of 350, 370 and 390 °C, respectively. The missing data after 8 h for CO2 hydrogenation at 390 °C were due to the malfunctioning of the analysis instruments. Further by-products (e.g., ethylene and higher C3+ compounds) were confirmed to be negligible [30]. The CH4 formation rate (Figure 6A) exhibited a slow but steady decrease over 12 h TOS without reaching a stable value, while the formation rate of CO was initially high and declined rapidly, reaching a stable value after ca. 2 h TOS. The high values for the CO formation rate in the stable operation regime were assumed to originate mainly from the reverse water–gas shift reaction (RWGS, Equation (3)), while CO2 reduction by the oxidation of metallic Fe or Fe carbides might have also played a role. The constant rates, however, rendered reaction pathways leading to significant catalyst deactivation rather unlikely.
The impact of temperature on the CH4 formation rate was negligible (Figure 6A), contradicting the expectations from the Arrhenius equation. In contrast, the CO formation rate exhibited a distinct temperature dependency and thus allowed us to estimate an apparent activation energy of 128 kJ/mol by the evaluation of the quasi-steady state formation rates at ca. 8 h TOS (see Supplementary Materials for the corresponding Arrhenius plot, Figure S5B). Note that this value lumps all CO-forming reactions, such as the RWGS (60–144 kJ/mol [45,66]), the reverse Boudouard reaction (ca. 120 kJ/mol [67]) and CO2 reduction by the oxidation of Fe (ca. 112 kJ/mol [68]) or Fe carbides. Hence, the results allow for no conclusions on the reaction pathways.
CH4 and CO formation are competing reactions during CO2 hydrogenation on iron-based catalysts [69]. Especially at low temperatures and pressures, the RWGS is strongly preferred if surface oxides are present [45,46,47,48]. In the present case, iron oxides were possibly formed during the preceding hydrogenation of CO/CO2 mixtures and during the CO2 hydrogenation itself [43,70], which hence led to a high selectivity towards CO of more than 97 %. Carbon deposition and thus iron carbide formation during CO2 hydrogenation plays a minor role for Fe@SiO2 catalysts, as reported previously [48]. One may also speculate that a confinement effect of the core–shell arrangement was responsible for the high CO and low CH4 selectivity, which has been reported for syngas reactions in confined spaces in the literature [71,72]. We assume that the iron oxide species were formed by the transformation of carbidic or metallic iron species in H2O-rich atmospheres within the confined core–shell structure during the hydrogenation of CO2-rich syngas. This transformation was recently discussed by Claeys et al. [43] for high temperature Fischer–Tropsch synthesis at an elevated pressure, but it can be adapted to the present reaction conditions as well. For the core–shell catalysts in particular, we assume that the microporous SiO2 shell restricted diffusion to a certain extent. Hence, the partial pressure of the product H2O inside of the porous shell and thus in proximity of the Fe core was elevated, which facilitated the formation of oxidic Fe species and thereby the RWGS. At the same time, the high H2O fraction shifted the chemical equilibrium of CO2 hydrogenation towards the reactants and, hence, less CH4 was formed. Consequently, the major share of CO formation resulted from the RWGS as the most reasonable reaction under the given experimental conditions according to the literature [44,45,69,73].
Further evaluations of the extent of the reverse Boudouard reaction and CO2 hydrogenation were made and are shown in the SI (see Supplementary Materials, Figure S7), which exhibited a distinct temperature dependence as expected from Arrhenius law. The interpretation and discussion of these results are very limited due to the fact that both reactions were superimposed by the RWGS reaction. Due to the stoichiometric analysis, we are able to distinguish between the four linear independent key reactions (Equations (1), (2), (4) and (5)) associated with the key components CO, CO2, CH4 and C2H4, while the RWGS (3) represents a linear combination of CO and CO2 hydrogenation. Hence, the identification of the stoichiometric reaction governing the CO formation requires the analysis of the non-key components (either H2, H2O or C) in addition in order to determine the extent of the non-key reactions as well. However, the corresponding apparent activation energy for the reverse Boudouard reaction of approx. 132 kJ/mol was estimated, which is in good agreement with the literature (ca. 120 kJ/mol [67]). In addition, the apparent activation energy for CO2 hydrogenation amounted to approx. 123 kJ/mol, which also agrees with the literature considering that the value results from the lumping of the RWGS (60–144 kJ/mol [45,66]), the reverse Boudouard reaction (ca. 120 kJ/mol [67]) and CO2 reduction by Fe oxidation (ca. 112 kJ/mol [68]).
Furthermore, the extent of CO conversion during CO2 hydrogenation was evaluated via Equation (16) (see Figure S8 in Supplementary Materials). The results show a temperature dependency of CO conversion but reveal consistently negative values. This indicates that the reverse CO hydrogenation (steam reforming of CH4) took place, which is unlikely under the reaction conditions. In contrast, the RWGS is likely to be responsible for that observation, since it causes the formation of CO. It has to be mentioned again that the RWGS reaction is a linear combination of CO and CO2 methanation and hence a distinction based on stoichiometric analysis is not possible.
4. Conclusions
In the present contribution, Fe-based core–shell materials were used as a model catalyst for investigating CO and CO2 hydrogenation. Dynamic hydrogenation experiments were conducted by the periodic switching of the CO/CO2 ratio in the reaction gas mixture. Three different CO/CO2 ratios were studied, from pure CO via equimolar CO/CO2 ratios to pure CO2 and vice versa in order to investigate the transient product formation induced by the carburization and oxidation of the catalyst material. Therefore, the experimental results were evaluated by stoichiometric analysis in order to investigate the course of the individual key reactions with TOS and thus to obtain conclusions about the catalyst state. These results were based on experimental data of the outlet gas composition measured via on-line gas chromatography. The results from stoichiometric analysis based on material balances are valid but superimposed by parallel reactions due to the complex reaction network using iron-based catalysts. The following conclusions can be drawn:
- The evaluation method via stoichiometric analysis was successfully applied to the experimental data. The method allows the contributions of the individual key reactions to be determined and individually evaluated, especially for CO hydrogenation. By comparing the extent of the key reactions with the formation rates of the carbonaceous products CO, CO2 and CH4, it was thus possible to draw conclusions about the state of the catalytically active phase from the analysis of the gaseous effluent. This procedure forms a good basis for further kinetic investigations.
- The results for CO hydrogenation showed a slowly and monotonically increasing formation rate for the products CH4 and C2+ with TOS, while the extent of the Boudouard reaction remained rather constant for all temperatures. The resulting increasing carburization of the catalyst favored the observed increase in the CH4 and C2+ formation rate. The comparison between the CH4 and CO2 formation rates and the associated extents of reaction revealed that CO methanation was the dominant reaction.
- CO hydrogenation after CO2 treatment showed a significant change in product distribution, with lower CH4 as well as higher C2+ and CO2 formation rates over the entire 12 h period. Furthermore, the CO2 treatment led to the formation of Fe oxide species, which affected the product spectrum in the first two hours until the catalyst reached the state before CO2 treatment. Hence, intermittent CO2 treatment affected the active phase of the catalyst significantly.
- During CO2 hydrogenation, only the formation of CH4 and CO was detected. CO was the dominant product over the entire 12 h measurement period, presumably formed via the RWGS under the given conditions. The decreasing course of the CH4 formation rate with TOS indicated a continuous change in the catalytically active iron phase, even though the interpretation of this trend is limited due to the small values.
In this work, Fe-based core–shell model catalysts were employed for fundamental studies on CO/CO2 methanation, due to the unique structural properties preventing sintering as a deactivation mechanism. The experimental results were evaluated using stoichiometric analysis of the key components, which provides the basis to develop kinetic models for the key reactions in future work. However, a rather complex transient transformation of the active Fe phase was observed, which depends on the reaction conditions and gas composition. In order to elucidate the formed Fe species and the interplay with the reaction network, complementary ex situ and in situ techniques are required for supporting the discussed hypotheses of a change in the catalyst state for future work. In particular, thermogravimetric analysis combined with mass spectrometry (TGA-MS) allows to analyze the carbon content in the catalysts [74]. Additionally, vibrating sample magnetometer (VSM) analysis [43] and X-ray absorption near-edge structure (XANES) spectroscopy, recently used for studying the influence of the oxidic support for CO2 hydrogenation on iron-based catalysts [75], can help to determine the degree of oxidation and carburization of the active iron phase. Hence, the evaluation method based on the stoichiometric analysis as well as ex situ and in situ techniques provide a powerful combination in order to quantify the degree of carburization under technically relevant reaction conditions.
Supplementary Materials
The following supporting information can be downloaded at: https://www.mdpi.com/article/10.3390/reactions3030027/s1, Figure S1: Results of N2 physisorption experiments; Figure S2: PXRD pattern of as-made Fe@SiO2 core–shell catalyst; Figure S3: TPR pattern of as-made Fe@SiO2 core–shell particles; Figure S4: Results of evaluation of higher hydrocarbon (C2+) byproducts during CO hydrogenation; Figure S5: Arrhenius plots and apparent activation energies; Figure S6: Extent of reaction of CO2 conversion during CO hydrogenation; Figure S7: Extent of reaction of the Boudouard reaction and CO2 hydrogenation; Figure S8: Extent of reaction of CO conversion during CO2 hydrogenation; Supporting Information II—value tables.xlsx.
Author Contributions
C.Z.: conceptualization, data curation, methodology, formal analysis, writing—original draft, visualization; R.G.: supervision, conceptualization, writing—review and editing. All authors have read and agreed to the published version of the manuscript.
Funding
This research received no external funding.
Conflicts of Interest
The authors declare no conflict of interest.
References
- Köne, A.Ç.; Büke, T. Forecasting of CO2 emissions from fuel combustion using trend analysis. Renew. Sustain. Energy Rev. 2010, 14, 2906–2915. [Google Scholar] [CrossRef]
- bp Statistical Review of World Energy 2021, 70th ed.; BP p.l.c.: London, UK, 2021.
- Song, C. Global challenges and strategies for control, conversion and utilization of CO2 for sustainable development involving energy, catalysis, adsorption and chemical processing. Catal. Today 2006, 115, 2–32. [Google Scholar] [CrossRef]
- Li, L.; Zhao, N.; Wei, W.; Sun, Y. A review of research progress on CO2 capture, storage, and utilization in Chinese Academy of Sciences. Fuel 2013, 108, 112–130. [Google Scholar] [CrossRef]
- Nam, S.-S.; Kim, H.; Kishan, G.; Choi, M.-J.; Lee, K.-W. Catalytic conversion of carbon dioxide into hydrocarbons over iron supported on alkali ion-exchanged Y-zeolite catalysts. Appl. Catal. A Gen. 1999, 179, 155–163. [Google Scholar] [CrossRef]
- Kuei, C.-K.; Lee, M.-D. Hydrogenation of carbon dioxide by hybrid catalysts, direct synthesis of aromatics from carbon dioxide and hydrogen. Can. J. Chem. Eng. 1991, 69, 347–354. [Google Scholar] [CrossRef]
- Kopyscinski, J.; Schildhauer, T.J.; Biollaz, S.M.A. Production of synthetic natural gas (SNG) from coal and dry biomass—A technology review from 1950 to 2009. Fuel 2010, 89, 1763–1783. [Google Scholar] [CrossRef]
- Gahleitner, G. Hydrogen from renewable electricity: An international review of power-to-gas pilot plants for stationary applications. Int. J. Hydrogen Energy 2013, 38, 2039–2061. [Google Scholar] [CrossRef]
- Rönsch, S.; Schneider, J.; Matthischke, S.; Schlüter, M.; Götz, M.; Lefebvre, J.; Prabhakaran, P.; Bajohr, S. Review on methanation—From fundamentals to current projects. Fuel 2016, 166, 276–296. [Google Scholar] [CrossRef]
- Riedel, T.; Claeys, M.; Schulz, H.; Schaub, G.; Nam, S.-S.; Jun, K.-W.; Choi, M.-J.; Kishan, G.; Lee, K.-W. Comparative study of Fischer–Tropsch synthesis with H2/CO and H2/CO2 syngas using Fe- and Co-based catalysts. Appl. Catal. A Gen. 1999, 186, 201–213. [Google Scholar] [CrossRef]
- Geng, S.; Jiang, F.; Xu, Y.; Liu, X. Iron-Based Fischer-Tropsch Synthesis for the Efficient Conversion of Carbon Dioxide into Isoparaffins. ChemCatChem 2016, 8, 1303–1307. [Google Scholar] [CrossRef]
- Albrecht, M.; Rodemerck, U.; Schneider, M.; Bröring, M.; Baabe, D.; Kondratenko, E.V. Unexpectedly efficient CO2 hydrogenation to higher hydrocarbons over non-doped Fe2O3. Appl. Catal. B Environ. 2017, 204, 119–126. [Google Scholar] [CrossRef]
- Gawande, M.B.; Goswami, A.; Asefa, T.; Guo, H.; Biradar, A.V.; Peng, D.-L.; Zboril, R.; Varma, R.S. Core-shell nanoparticles: Synthesis and applications in catalysis and electrocatalysis. Chem. Soc. Rev. 2015, 44, 7540–7590. [Google Scholar] [CrossRef] [PubMed]
- Kiss, A.A.; Pragt, J.J.; Vos, H.J.; Bargeman, G.; de Groot, M.T. Novel efficient process for methanol synthesis by CO2 hydrogenation. Chem. Eng. J. 2016, 284, 260–269. [Google Scholar] [CrossRef] [Green Version]
- Bukhtiyarova, M.; Lunkenbein, T.; Kähler, K.; Schlögl, R. Methanol Synthesis from Industrial CO2 Sources: A Contribution to Chemical Energy Conversion. Catal. Lett. 2017, 147, 416–427. [Google Scholar] [CrossRef] [Green Version]
- Sterner, M.; Specht, M. Power-to-Gas and Power-to-X—The History and Results of Developing a New Storage Concept. Energies 2021, 14, 6594. [Google Scholar] [CrossRef]
- Sabatier, P.; Senderens, J.B. Direct hydrogenation of oxides of carbon in presence of various finely divided metals. C. R. Acad. Sci. 1902, 134, 689–691. [Google Scholar]
- Wang, W.; Gong, J. Methanation of carbon dioxide: An overview. Front. Chem. Sci. Eng. 2011, 5, 2–10. [Google Scholar] [CrossRef]
- Alig, L.; Fritz, M.; Schneider, S. First-Row Transition Metal (De)Hydrogenation Catalysis Based on Functional Pincer Ligands. Chem. Rev. 2019, 119, 2681–2751. [Google Scholar] [CrossRef]
- Bonzel, H.P.; Krebs, H.J. Surface science approach to heterogeneous catalysis: CO hydrogenation on transition metals. Surf. Sci. 1982, 117, 639–658. [Google Scholar] [CrossRef]
- Oza, R.; Shah, N.; Patel, S. Recovery of nickel from spent catalysts using ultrasonication-assisted leaching. J. Chem. Technol. Biotechnol. 2011, 86, 1276–1281. [Google Scholar] [CrossRef]
- Vuyyuru, K.R.; Pant, K.K.; Krishnan, V.V.; Nigam, K.D.P. Recovery of Nickel from Spent Industrial Catalysts Using Chelating Agents. Ind. Eng. Chem. Res. 2010, 49, 2014–2024. [Google Scholar] [CrossRef]
- Barrientos, J.; González, N.; Lualdi, M.; Boutonnet, M.; Järås, S. The effect of catalyst pellet size on nickel carbonyl-induced particle sintering under low temperature CO methanation. Appl. Catal. A Gen. 2016, 514, 91–102. [Google Scholar] [CrossRef]
- Nguyen, T.T.M.; Wissing, L.; Skjøth-Rasmussen, M.S. High temperature methanation: Catalyst considerations. Catal. Today 2013, 215, 233–238. [Google Scholar] [CrossRef]
- Kirchner, J.; Baysal, Z.; Kureti, S. Activity and Structural Changes of Fe-based Catalysts during CO2 Hydrogenation towards CH4—A Mini Review. ChemCatChem 2020, 12, 981–988. [Google Scholar] [CrossRef] [Green Version]
- Xu, P.; Zeng, G.M.; Huang, D.L.; Feng, C.L.; Hu, S.; Zhao, M.H.; Lai, C.; Wei, Z.; Huang, C.; Xie, G.X.; et al. Use of iron oxide nanomaterials in wastewater treatment: A review. Sci. Total Environ. 2012, 424, 1–10. [Google Scholar] [CrossRef] [PubMed]
- Xiao, Y.; Du, J. Superparamagnetic nanoparticles for biomedical applications. J. Mater. Chem. B 2020, 8, 354–367. [Google Scholar] [CrossRef]
- Du, H.; Deng, F.; Kommalapati, R.R.; Amarasekara, A.S. Iron based catalysts in biomass processing. Renew. Sustain. Energy Rev. 2020, 134, 110292. [Google Scholar] [CrossRef]
- Lee, M.-D.; Lee, J.-F.; Chang, C.-S. Catalytic behavior and phase composition change of iron catalyst in hydrogenation of carbon dioxide. Catal. Rev. 1990, 23, 130–136. [Google Scholar] [CrossRef] [Green Version]
- Zambrzycki, C.; Shao, R.; Misra, A.; Streb, C.; Herr, U.; Güttel, R. Iron Based Core-Shell Structures as Versatile Materials: Magnetic Support and Solid Catalyst. Catalysts 2021, 11, 72. [Google Scholar] [CrossRef]
- Byron Smith, R.J.; Loganathan, M.; Shantha, M.S. A Review of the Water Gas Shift Reaction Kinetics. Int. J. Chem. React. Eng. 2010, 8. [Google Scholar] [CrossRef]
- Newsome, D.S. The Water-Gas Shift Reaction. Catal. Rev. 1980, 21, 275–318. [Google Scholar] [CrossRef]
- Kirchner, J.; Anolleck, J.K.; Lösch, H.; Kureti, S. Methanation of CO2 on iron based catalysts. Appl. Catal. B Environ. 2018, 223, 47–59. [Google Scholar] [CrossRef]
- Visconti, C.G.; Martinelli, M.; Falbo, L.; Fratalocchi, L.; Lietti, L. CO2 hydrogenation to hydrocarbons over Co and Fe-based Fischer-Tropsch catalysts. Catal. Today 2016, 277, 161–170. [Google Scholar] [CrossRef]
- Bartholomew, C.H. Mechanisms of catalyst deactivation. Appl. Catal. A Gen. 2001, 212, 17–60. [Google Scholar] [CrossRef]
- Zhu, J.; Wang, P.; Zhang, X.; Zhang, G.; Li, R.; Li, W.; Senftle, T.; Liu, W.; Wang, J.; Wang, Y.; et al. Dynamic structural evolution of iron catalysts involving competitive oxidation and carburization during CO2 hydrogenation. Sci. Adv. 2022, 8, 1–12. [Google Scholar] [CrossRef] [PubMed]
- Zuo, B.; Li, W.; Wu, X.; Wang, S.; Deng, Q.; Huang, M. Recent Advances in the Synthesis, Surface Modifications and Applications of Core-Shell Magnetic Mesoporous Silica Nanospheres. Chem. Asian J. 2020, 15, 1248–1265. [Google Scholar] [CrossRef] [PubMed]
- de Smit, E.; Weckhuysen, B.M. The renaissance of iron-based Fischer-Tropsch synthesis: On the multifaceted catalyst deactivation behaviour. Chem. Soc. Rev. 2008, 37, 2758–2781. [Google Scholar] [CrossRef]
- Pérez-Alonso, F.J.; Herranz, T.; Rojas, S.; Ojeda, M.; López Granados, M.; Terreros, P.; Fierro, J.L.G.; Gracia, M.; Gancedo, J.R. Evolution of the bulk structure and surface species on Fe–Ce catalysts during the Fischer–Tropsch synthesis. Green Chem. 2007, 9, 663–670. [Google Scholar] [CrossRef]
- Herranz, T.; Rojas, S.; Pérez-Alonso, F.J.; Ojeda, M.; Terreros, P.; Fierro, J.L.G. Genesis of iron carbides and their role in the synthesis of hydrocarbons from synthesis gas. J. Catal. 2006, 243, 199–211. [Google Scholar] [CrossRef]
- Schulz, H.; vein Steen, E.; Claeys, M. Selectivity and mechanism of Fischer-Tropsch synthesis with iron and cobalt catalysts. In Natural Gas Conversion II—Proceedings of the Third Natural Gas Conversion Symposium; Elsevier: Amsterdam, Netherlands, 1994; pp. 455–460. ISBN 9780444895356. [Google Scholar]
- Su, X.; Xu, J.; Liang, B.; Duan, H.; Hou, B.; Huang, Y. Catalytic carbon dioxide hydrogenation to methane: A review of recent studies. J. Energy Chem. 2016, 25, 553–565. [Google Scholar] [CrossRef]
- Claeys, M.; van Steen, E.; Botha, T.; Crous, R.; Ferreira, A.; Harilal, A.; Moodley, D.J.; Moodley, P.; Du Plessis, E.; Visagie, J.L. Oxidation of Hägg Carbide during High-Temperature Fischer–Tropsch Synthesis: Size-Dependent Thermodynamics and In Situ Observations. ACS Catal. 2021, 11, 13866–13879. [Google Scholar] [CrossRef]
- Zhu, M.; Wachs, I.E. Iron-Based Catalysts for the High-Temperature Water–Gas Shift (HT-WGS) Reaction: A Review. ACS Catal. 2016, 6, 722–732. [Google Scholar] [CrossRef]
- Owen, R.E.; Mattia, D.; Plucinski, P.; Jones, M.D. Kinetics of CO2 Hydrogenation to Hydrocarbons over Iron-Silica Catalysts. Chemphyschem 2017, 18, 3211–3218. [Google Scholar] [CrossRef] [PubMed] [Green Version]
- Loiland, J.A.; Wulfers, M.J.; Marinkovic, N.S.; Lobo, R.F. Fe/γ-Al2O3 and Fe–K/γ-Al2O3 as reverse water-gas shift catalysts. Catal. Sci. Technol. 2016, 6, 5267–5279. [Google Scholar] [CrossRef] [Green Version]
- Riedel, T.; Schulz, H.; Schaub, G.; Jun, K.-W.; Hwang, J.-S.; Lee, K.-W. Fischer–Tropsch on iron with H2/CO and H2/CO2 as synthesis gases: The episodes of formation of the Fischer–Tropsch regime and construction of the catalyst. Top. Catal. 2003, 26, 41–54. [Google Scholar] [CrossRef]
- Kirchner, J.; Zambrzycki, C.; Baysal, Z.; Güttel, R.; Kureti, S. Fe based core–shell model catalysts for the reaction of CO2 with H2. Reac. Kinet. Mech. Cat. 2020, 131, 119–128. [Google Scholar] [CrossRef]
- Kirchner, J.; Zambrzycki, C.; Kureti, S.; Güttel, R. CO2 Methanation on Fe Catalysts Using Different Structural Concepts. Chem. Ing. Tech. 2020, 92, 603–607. [Google Scholar] [CrossRef] [Green Version]
- Ghosh Chaudhuri, R.; Paria, S. Core/shell nanoparticles: Classes, properties, synthesis mechanisms, characterization, and applications. Chem. Rev. 2012, 112, 2373–2433. [Google Scholar] [CrossRef]
- Zeng, B.; Hou, B.; Jia, L.; Wang, J.; Chen, C.; Sun, Y.; Li, D. Studies of Cobalt Particle Size Effects on Fischer-Tropsch Synthesis over Core-Shell-Structured Catalysts. ChemCatChem 2013, 5, 3794–3801. [Google Scholar] [CrossRef]
- Straß-Eifert, A.; Sheppard, T.L.; Damsgaard, C.D.; Grunwaldt, J.-D.; Güttel, R. Stability of Cobalt Particles IN and Outside HZSM-5 under CO Hydrogenation Conditions Studied by ex situ and in situ Electron Microscopy. ChemCatChem 2021, 13, 718–729. [Google Scholar] [CrossRef]
- Feyen, M.; Weidenthaler, C.; Güttel, R.; Schlichte, K.; Holle, U.; Lu, A.-H.; Schüth, F. High-temperature stable, iron-based core-shell catalysts for ammonia decomposition. Chemistry 2011, 17, 598–605. [Google Scholar] [CrossRef] [PubMed]
- Tai, Z.; Isaacs, M.A.; Durndell, L.J.; Parlett, C.M.A.; Lee, A.F.; Wilson, K. Magnetically-separable Fe3O4@SiO2@SO4-ZrO2 core-shell nanoparticle catalysts for propanoic acid esterification. Mol. Catal. 2018, 449, 137–141. [Google Scholar] [CrossRef]
- Yao, L.H.; Li, Y.X.; Zhao, J.; Ji, W.J.; Au, C.T. Core–shell structured nanoparticles (M@SiO2, Al2O3, MgO. M=Fe, Co, Ni, Ru) and their application in COx-free H2 production via NH3 decomposition. Catal. Today 2010, 158, 401–408. [Google Scholar] [CrossRef]
- Hudson, R.; Rivière, A.; Cirtiu, C.M.; Luska, K.L.; Moores, A. Iron-iron oxide core-shell nanoparticles are active and magnetically recyclable olefin and alkyne hydrogenation catalysts in protic and aqueous media. ChemComm 2012, 48, 3360–3362. [Google Scholar] [CrossRef] [Green Version]
- Ni, Z.; Qin, H.; Kang, S.; Bai, J.; Wang, Z.; Li, Y.; Zheng, Z.; Li, X. Effect of graphitic carbon modification on the catalytic performance of Fe@SiO2-GC catalysts for forming lower olefins via Fischer-Tropsch synthesis. J. Colloid Interface Sci. 2018, 516, 16–22. [Google Scholar] [CrossRef]
- Aris, R. Elementary Chemical Reactor Analysis; Butterworths: Boston, MA, USA, 1989; ISBN 0-409-90221-7. [Google Scholar]
- Shao, R.; Zambrzycki, C.; Guttel, R.; Herr, U. Model-Independent Size Distribution Determination of Superparamagnetic Nanoparticles. IEEE Trans. Magn. 2022, 58, 1–5. [Google Scholar] [CrossRef]
- Zieliński, J.; Zglinicka, I.; Znak, L.; Kaszkur, Z. Reduction of Fe2O3 with hydrogen. Appl. Catal. A Gen. 2010, 381, 191–196. [Google Scholar] [CrossRef]
- Cornell, R.M.; Schwertmann, U. The Iron Oxides: Structure, Properties, Reactions, Occurrences, and Uses, 2nd ed.; Completely rev. and Extended ed.; Wiley-VCH: Weinheim, Germany, 2003; ISBN 3527302743. [Google Scholar]
- Eliason, S.A.; Bartholomew, C.H. Reaction and deactivation kinetics for Fischer–Tropsch synthesis on unpromoted and potassium-promoted iron catalysts. Appl. Catal. A Gen. 1999, 186, 229–243. [Google Scholar] [CrossRef]
- Anderson, J.R. Catalysis: Science and Technology; Springer: Berlin/Heidelberg, Germany, 1982; ISBN 9783642932236. [Google Scholar]
- Xu, M.-W.P.; Brown, J.J. Mechanism of Iron Catalysis of Carbon Monoxide Decomposition in Refractories. J. Am. Ceram. Soc. 1989, 72, 110–115. [Google Scholar] [CrossRef]
- Mirzaei, A.A.; Kiai, R.M.; Atashi, H.; Arsalanfar, M.; Shahriari, S. Kinetic study of CO hydrogenation over co-precipitated iron–nickel catalyst. J. Ind. Eng. Chem. 2012, 18, 1242–1251. [Google Scholar] [CrossRef]
- Spencer, M.S. On the activation energies of the forward and reverse water-gas shift reaction. Catal. Lett. 1995, 32, 9–13. [Google Scholar] [CrossRef]
- Figueiredo, J.L.; Rivera-Utrilla, J.; Ferro-Garcia, M.A. Gasification of active carbons of different texture impregnated with nickel, cobalt and iron. Carbon 1987, 25, 703–708. [Google Scholar] [CrossRef]
- Wenzel, M.; Aditya Dharanipragada, N.V.R.; Galvita, V.V.; Poelman, H.; Marin, G.B.; Rihko-Struckmann, L.; Sundmacher, K. CO production from CO2 via reverse water–gas shift reaction performed in a chemical looping mode: Kinetics on modified iron oxide. J. CO2 Util. 2017, 17, 60–68. [Google Scholar] [CrossRef] [Green Version]
- Landau, M.V.; Meiri, N.; Utsis, N.; Vidruk Nehemya, R.; Herskowitz, M. Conversion of CO2, CO, and H2 in CO2 Hydrogenation to Fungible Liquid Fuels on Fe-Based Catalysts. Ind. Eng. Chem. Res. 2017, 56, 13334–13355. [Google Scholar] [CrossRef]
- Zhang, Y.; Cao, C.; Zhang, C.; Zhang, Z.; Liu, X.; Yang, Z.; Zhu, M.; Meng, B.; Xu, J.; Han, Y.-F. The study of structure-performance relationship of iron catalyst during a full life cycle for CO2 hydrogenation. J. Catal. 2019, 378, 51–62. [Google Scholar] [CrossRef]
- Ilsemann, J.; Straß-Eifert, A.; Friedland, J.; Kiewidt, L.; Thöming, J.; Bäumer, M.; Güttel, R. Cobalt@Silica Core-Shell Catalysts for Hydrogenation of CO/CO2 Mixtures to Methane. ChemCatChem 2019, 11, 4884–4893. [Google Scholar] [CrossRef] [Green Version]
- Zhao, Z. Catalytic Conversion of Carbon Oxides in Confined Spaces: Status and Prospects. ChemCatChem 2020, 12, 3960–3981. [Google Scholar] [CrossRef]
- Sengupta, S.; Jha, A.; Shende, P.; Maskara, R.; Das, A.K. Catalytic performance of Co and Ni doped Fe-based catalysts for the hydrogenation of CO2 to CO via reverse water-gas shift reaction. J. Environ. Chem. Eng. 2019, 7, 102911. [Google Scholar] [CrossRef]
- Gnanamani, M.K.; Jacobs, G.; Hamdeh, H.H.; Shafer, W.D.; Liu, F.; Hopps, S.D.; Thomas, G.A.; Davis, B.H. Hydrogenation of Carbon Dioxide over Co–Fe Bimetallic Catalysts. ACS Catal. 2016, 6, 913–927. [Google Scholar] [CrossRef]
- Lopez Luna, M.; Timoshenko, J.; Kordus, D.; Rettenmaier, C.; Chee, S.W.; Hoffman, A.S.; Bare, S.R.; Shaikhutdinov, S.; Roldan Cuenya, B. Role of the Oxide Support on the Structural and Chemical Evolution of Fe Catalysts during the Hydrogenation of CO2. ACS Catal. 2021, 11, 6175–6185. [Google Scholar] [CrossRef]
Figure 1.
Schematic overview of the experimental campaign after catalyst activation, executed at 350, 370 and 390 °C, respectively.
Figure 1.
Schematic overview of the experimental campaign after catalyst activation, executed at 350, 370 and 390 °C, respectively.
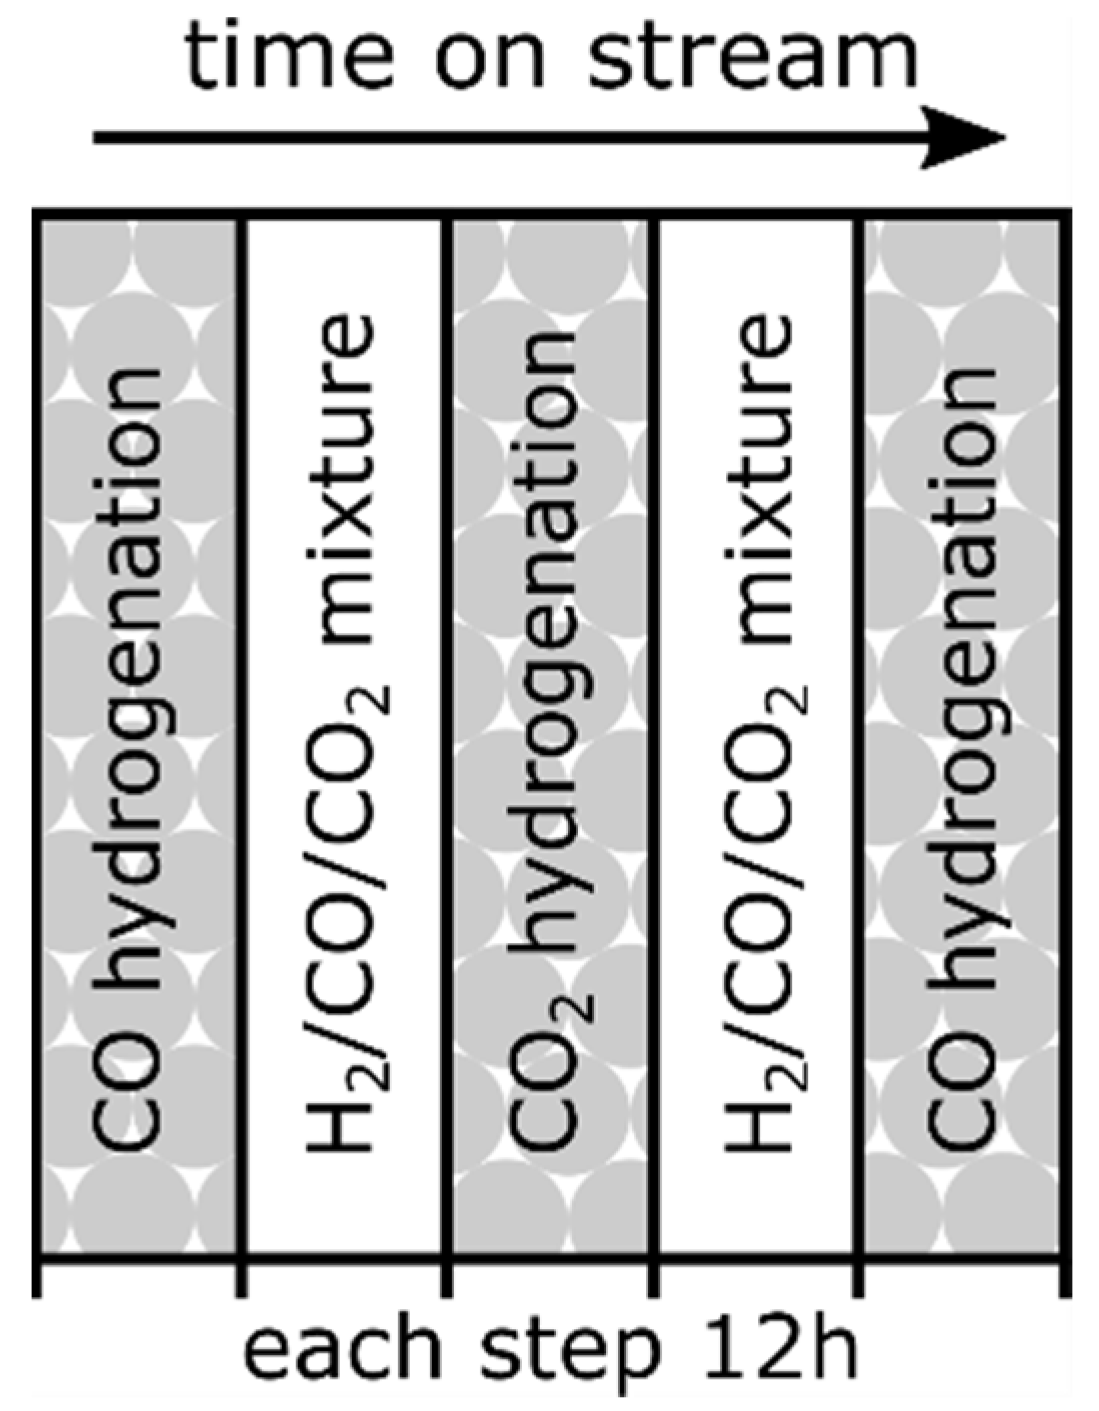
Figure 2.
TEM micrographs of (A) as-made and (B) spent Fe@SiO2 core–shell catalyst materials; experimental details for specimen B: prereduction under 100 % H2 at 400 °C for 12 h, subsequent CO hydrogenation with H2:CO = 4.5 and p = 1 bar for 12 h at 350 and 390 °C.
Figure 2.
TEM micrographs of (A) as-made and (B) spent Fe@SiO2 core–shell catalyst materials; experimental details for specimen B: prereduction under 100 % H2 at 400 °C for 12 h, subsequent CO hydrogenation with H2:CO = 4.5 and p = 1 bar for 12 h at 350 and 390 °C.

Figure 3.
Formation rates as function of time-on-stream for CH4 (A) and CO2 (B) during CO hydrogenation at 350, 370 and 390 °C with Fe@SiO2 catalyst before (filled symbols) and after (empty symbols) CO2 treatment; conditions: 200 mg of catalyst, H2/CO = 4.5, 1 bar, total volumetric flow rate 100 mlSTP/min.

Figure 4.
Extent of Boudouard reaction as function of time-on-stream at 350, 370 and 390 °C during CO hydrogenation before ((A), filled symbols) and after ((B), empty symbols) CO2 treatment.
Figure 4.
Extent of Boudouard reaction as function of time-on-stream at 350, 370 and 390 °C during CO hydrogenation before ((A), filled symbols) and after ((B), empty symbols) CO2 treatment.
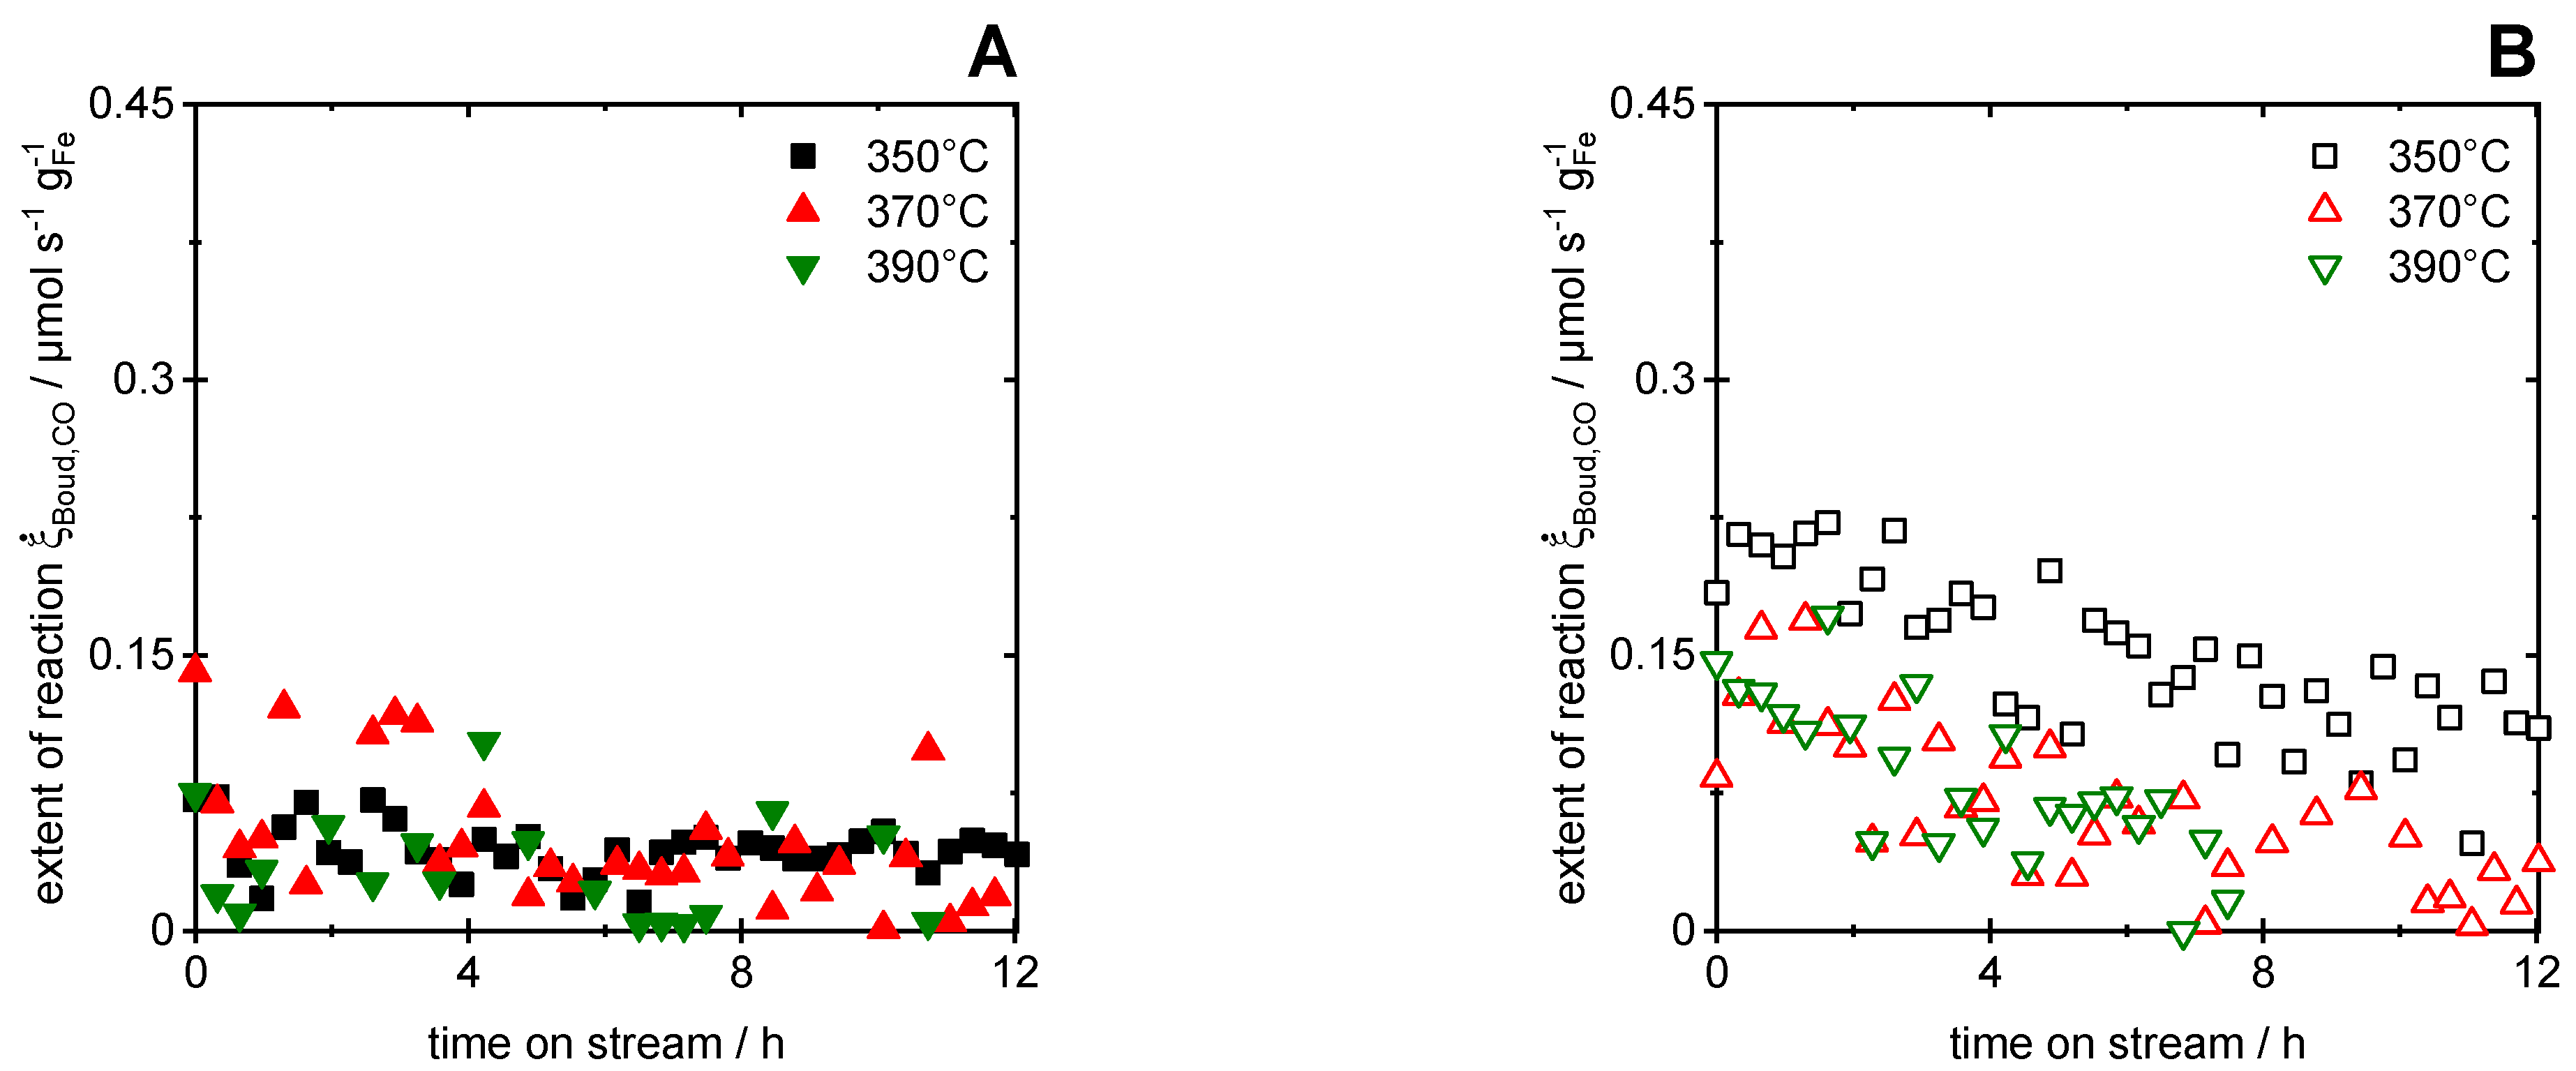
Figure 5.
Extent of CO hydrogenation reaction as function of time-on-stream at 350, 370 and 390 °C before ((A), filled symbols) and after ((B), empty symbols) CO2 treatment, respectively.
Figure 5.
Extent of CO hydrogenation reaction as function of time-on-stream at 350, 370 and 390 °C before ((A), filled symbols) and after ((B), empty symbols) CO2 treatment, respectively.
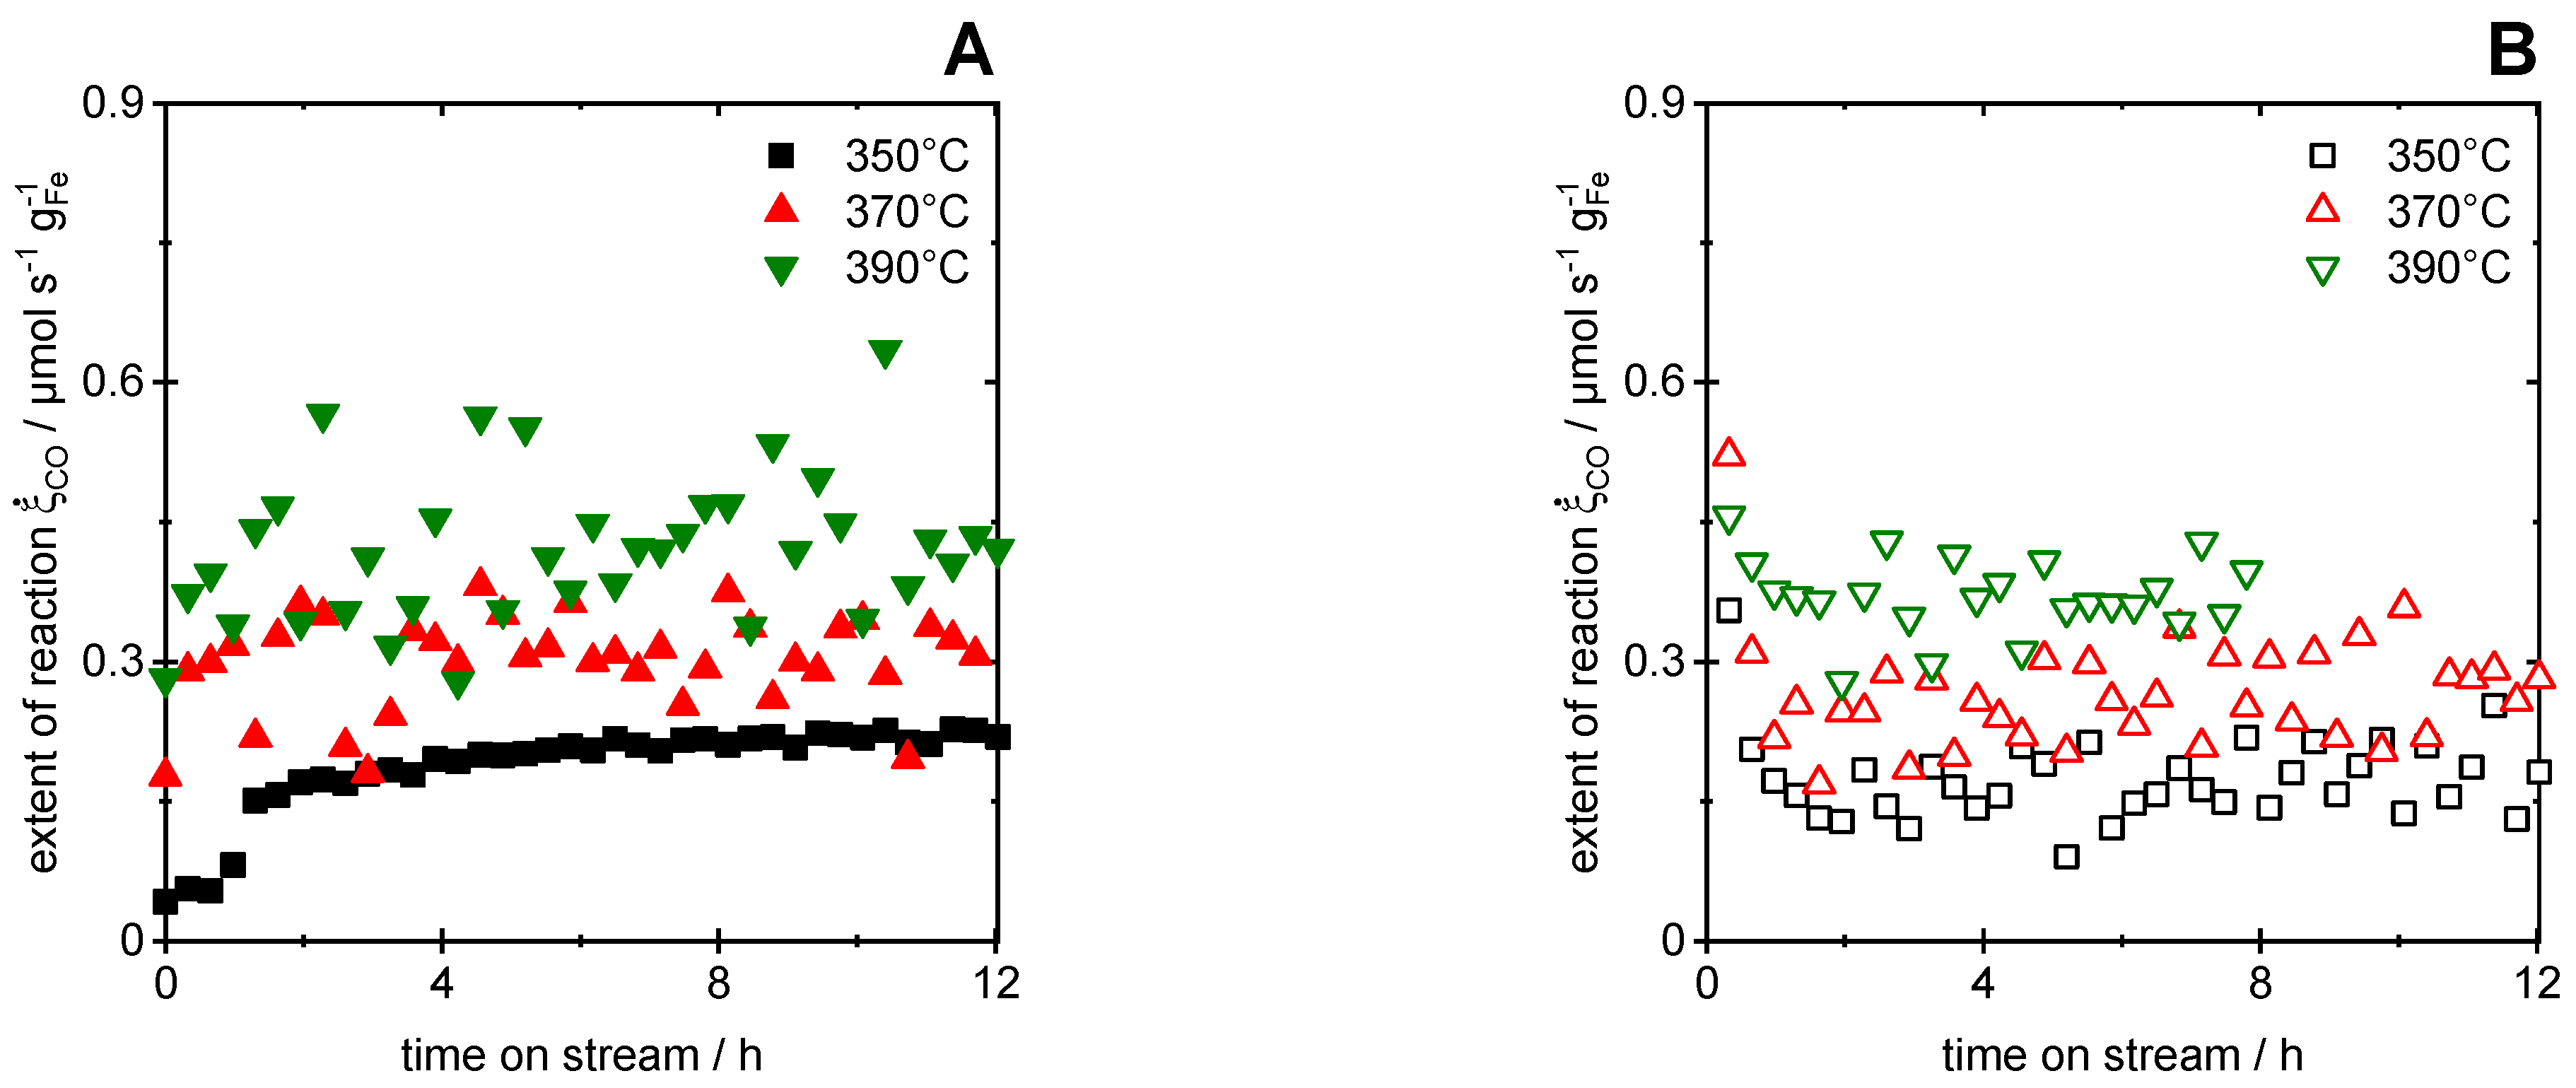
Figure 6.
Formation rates as function of time-on-stream for CH4 (A) and CO (B) during CO2 hydrogenation at 350, 370 and 390 °C with Fe@SiO2 catalyst; conditions: H2/CO = 4.5, 200 mg of catalyst, 1 bar, total volumetric flow rate 100 mlSTP/min.
Figure 6.
Formation rates as function of time-on-stream for CH4 (A) and CO (B) during CO2 hydrogenation at 350, 370 and 390 °C with Fe@SiO2 catalyst; conditions: H2/CO = 4.5, 200 mg of catalyst, 1 bar, total volumetric flow rate 100 mlSTP/min.
Publisher’s Note: MDPI stays neutral with regard to jurisdictional claims in published maps and institutional affiliations. |
© 2022 by the authors. Licensee MDPI, Basel, Switzerland. This article is an open access article distributed under the terms and conditions of the Creative Commons Attribution (CC BY) license (https://creativecommons.org/licenses/by/4.0/).
Share and Cite
MDPI and ACS Style
Zambrzycki, C.; Güttel, R. Transient Behavior of CO and CO2 Hydrogenation on Fe@SiO2 Core–Shell Model Catalysts—A Stoichiometric Analysis of Experimental Data. Reactions 2022, 3, 374-391. https://doi.org/10.3390/reactions3030027
AMA Style
Zambrzycki C, Güttel R. Transient Behavior of CO and CO2 Hydrogenation on Fe@SiO2 Core–Shell Model Catalysts—A Stoichiometric Analysis of Experimental Data. Reactions. 2022; 3(3):374-391. https://doi.org/10.3390/reactions3030027
Chicago/Turabian StyleZambrzycki, Christian, and Robert Güttel. 2022. "Transient Behavior of CO and CO2 Hydrogenation on Fe@SiO2 Core–Shell Model Catalysts—A Stoichiometric Analysis of Experimental Data" Reactions 3, no. 3: 374-391. https://doi.org/10.3390/reactions3030027