1. Introduction
Sugarcane (
Saccharum spp.), originally from southwest Asia, is one of the main crops for the production of biofuel, mainly due to its high biomass yield and bioenergy generation potential, contributing to the sustainability of the conversion of sugar to ethanol and to the preservation of the environment [
1,
2]. Brazil is the world’s largest sugarcane grower, presenting favorable edaphoclimatic conditions and large areas available for growing this type of crop [
3,
4,
5].
In Brazil, the area planted with sugarcane is approximately 9.9 million hectares. In the year 2022, the harvest was 724 million tons with an average productivity of 72.3 Mg·ha
−1 [
6]. The amount of ethanol that can be produced from this crop is 36.2 billion liters, an increase of 11% over the 2020/2021 crop, which reached 32.7 billion liters [
7]. Sugarcane is most frequently grown in tropical and subtropical areas where water availability may not be optimal throughout the plants’ lifecycle but is adequate. Due to increased worldwide energy demand, however, sugarcane farming has been spreading to areas where drought is frequent [
8].
Sugarcane is especially sensitive to water deficit during its initial vegetative development [
9]. The maintenance of adequate soil moisture in the root zone during the entire growth period is essential to obtain high yields since vegetative growth is directly proportional to the water lost by evapotranspiration [
10]. The water requirement for sugarcane is 1500 to 2500 mm per cultivation cycle, and irrigation must be managed according to the phenological phase of the crop to achieve optimal conversion of the transpired water into useful aerial biomass [
11]. When water availability is limited, the potential transpiration rate becomes higher than the water absorption capacity and plants will suffer stress from the water deficit, which can reduce the crop yield.
Knowledge of how particular crops respond to drought stress is one of the prerequisites for choosing the best variety and best management practices to maximize the use of this scarce natural resource [
12]. New sugarcane cultivars are developed annually, tested, and brought to market, with adaptations to diverse edaphoclimatic conditions, to increase yield and lower production costs [
13].
Several studies have proposed indicators to assess the adequacy of water availability in the production of agricultural crops, as well as to evaluate the performance of agricultural irrigation systems [
14]. A term that has been commonly used as an indicator is crop water productivity (WP
c), which is defined as the ratio of biomass production (kg) to the amount of water used by the crop (mm or m
3), including rainfall and irrigation water, or the total evapotranspiration during the cultivation period [
15].
Strategic water management in the root zone throughout the sugarcane cycle is of fundamental importance, and WP
c measurements can be used to adjust the irrigation to increase stalk production, yield of biomass and sugar, and, subsequently, bioethanol production [
16]. Thus, WP
c is a good indicator for determining the ratio of biomass yield to the amount of water used, suggesting values that maximize the efficiency of water usage [
17]. The use of irrigation in the tropics and dry subtropics for increasing WP
c in the cultivation of sugarcane on soils with 80% water availability varies between 5 and 8 kg·m
−3 for culms biomass and between 0.6 and 1.0 kg·m
−3 for sucrose biomass [
18,
19]. There are ways to increase the WP
c through appropriate irrigation management.
Inman-Bamber et al. [
20] found that sugarcane responded well to irrigation, with WP
c values reaching as high as 27.5 kg of dry matter for each m
3 of water applied. With the increase in the volume of water applied via irrigation, around 9% of the total received by the plants, the crop showed a significant increase in canopy growth, resulting in a considerable increase in biomass of around 31%, with 41% productivity of stalks. This result could be attributed to the increased biomass partition to the stalks provided by irrigation [
17]. However, for sugarcane, the magnitude of variations in WP
c also depends on the variety, type (plant cane or ratoon cane), environmental conditions and management practices adopted [
21]. Kingston [
22], in a review on the subject, found that WP
c varied from 8.37 to 20.94 kg·m
−3, while Robertson et al. [
23] reported a variation from 5.3 to 15.4 kg·m
−3 (fresh stalks).
Steduto et al. [
24] argued that there was a limit to the amount of biomass that could be produced per unit of water consumed by the crop and showed that WP
c was approximately constant after normalization of the evaporative demand and the concentration of carbon dioxide in the atmosphere. The authors highlighted the need to normalize WP
c according to climatic conditions because of the wide variation in the evaporative demand of the atmosphere. It is essential to be able to extrapolate the concentration of CO
2 in the atmosphere, as well as the WP
c values between climatic zones.
A study that defines the most efficient protocol for managing irrigation depths throughout the growing cycle and in the maturation process at the end of the lifecycle for each variety of sugarcane can maximize the yield indices of first-generation bioethanol per ton of fresh stalks, bioethanol productivity per unit area, WPc for bioethanol, sugar and biomass, in addition to the total energy captured by the canopy of the sugarcane in the form of dry biomass. The results obtained will serve as a reference for sugarcane genetic improvement programs so that producers can choose varieties better adapted to a particular combination of irrigated and rainfed conditions, with the goal of creating a sustainable harvest and minimizing water usage in the production of renewable bioenergy based on sugarcane.
Thus, the objective of this research was to evaluate the effect of four irrigation depths and four water deficit intensities on the maturation phase for eight sugarcane varieties under drip irrigation, analyzing the responses related to WPc for bioethanol, sugar and biomass.
2. Materials and Methods
2.1. Description of the Area and Experimental Design
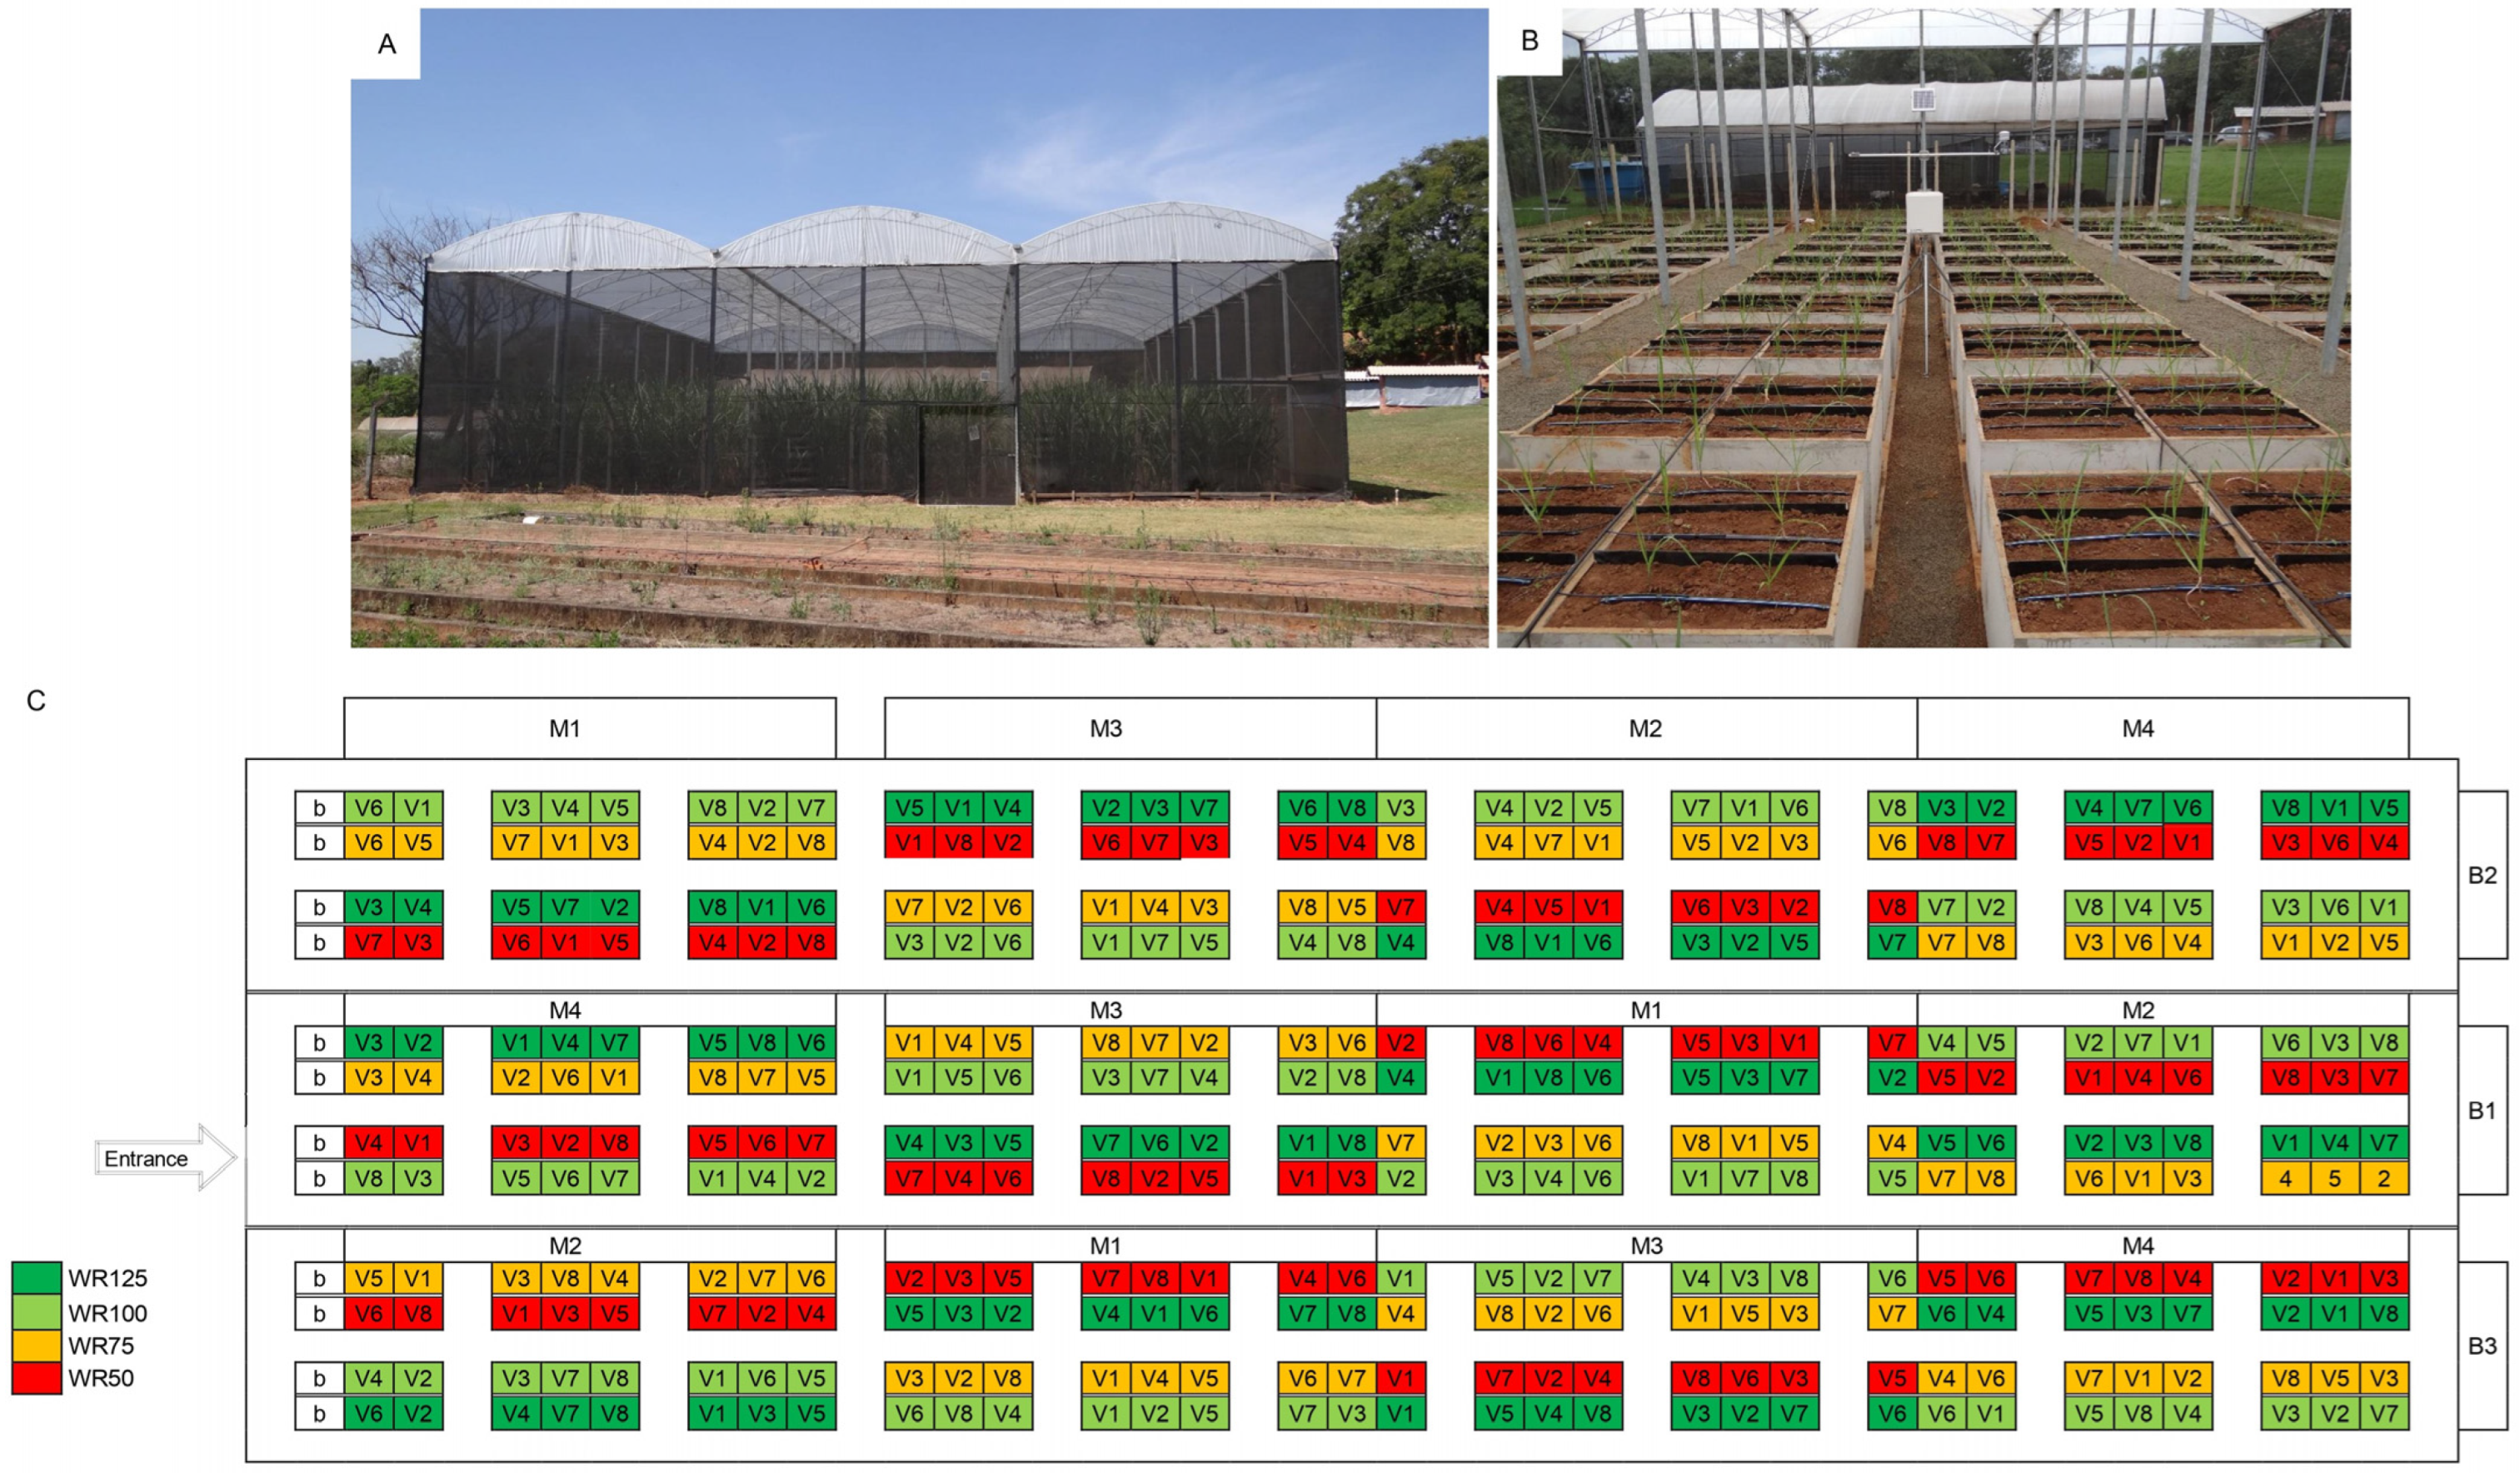
These experiments were conducted in the experimental area of the Biosystem Engineering Department at the University of São Paulo (ESALQ/USP) in Piracicaba-SP. The geographic coordinates are 22°43′30” south latitude and 47°38′00′ west longitude with an altitude of 546 m. The experiment was implemented in a three-span rain-out shelter, with a total area of 400 m2 and an internal height of 5.2 m, starting in February 2013 and harvested in February 2014. The rain-out shelter was covered with transparent plastic, and the sides were closed with a black screen (50% open). To manage the irrigation and fertigation systems, a 110 m2 area in the rain-out shelter was allocated for the controllers, hydraulic valves, pumps, and data loggers.
The plots were positioned in three randomized blocks, one in each of the rain-out shelter’s three spans. The treatments were distributed in a factorial scheme (4 × 8 × 4) with sub-subdivided plots (split-split plots), totaling 128 treatments and 384 experimental plots (
Figure 1). The experimental parcels had two clumps of plants in each 0.33 m
3 pot (1.04 × 0.41 × 0.76 m, width, length, depth). The bottom 0.1 m of each pot was filled with gravel, followed by 0.06 m for the superior border, and lastly filled to 0.6 m with yellow-red latosol of a sandy-loam texture. The treatments tested were as follows: (a) four irrigation levels during the crop season with soil moisture monitoring of all varieties in reference parcel, WR100, (b) eight commercial varieties of sugarcane, and (c) four water deficits of increasing intensity in the final phase of the crop season, to induce intense and uniform sugarcane maturation.
2.2. Treatments and Analyses
The commercial varieties of sugarcane used in the experiment were selected in discussion with the technical and administrative managers of the partner company in the project in order to cover the main varieties of scientific and commercial interest available at the time. Seven varieties were selected from the Brazilian sugarcane breeding programs, CTC, RIDESA and IAC, and one variety came from South Africa as an international reference for studies on water efficiency in sugarcane production. The varieties were as follows: CTC15, CTC 17, RB867515, RB92579, RB931011, RB966928, IAC SP 5000 and NCo 376 (South African).
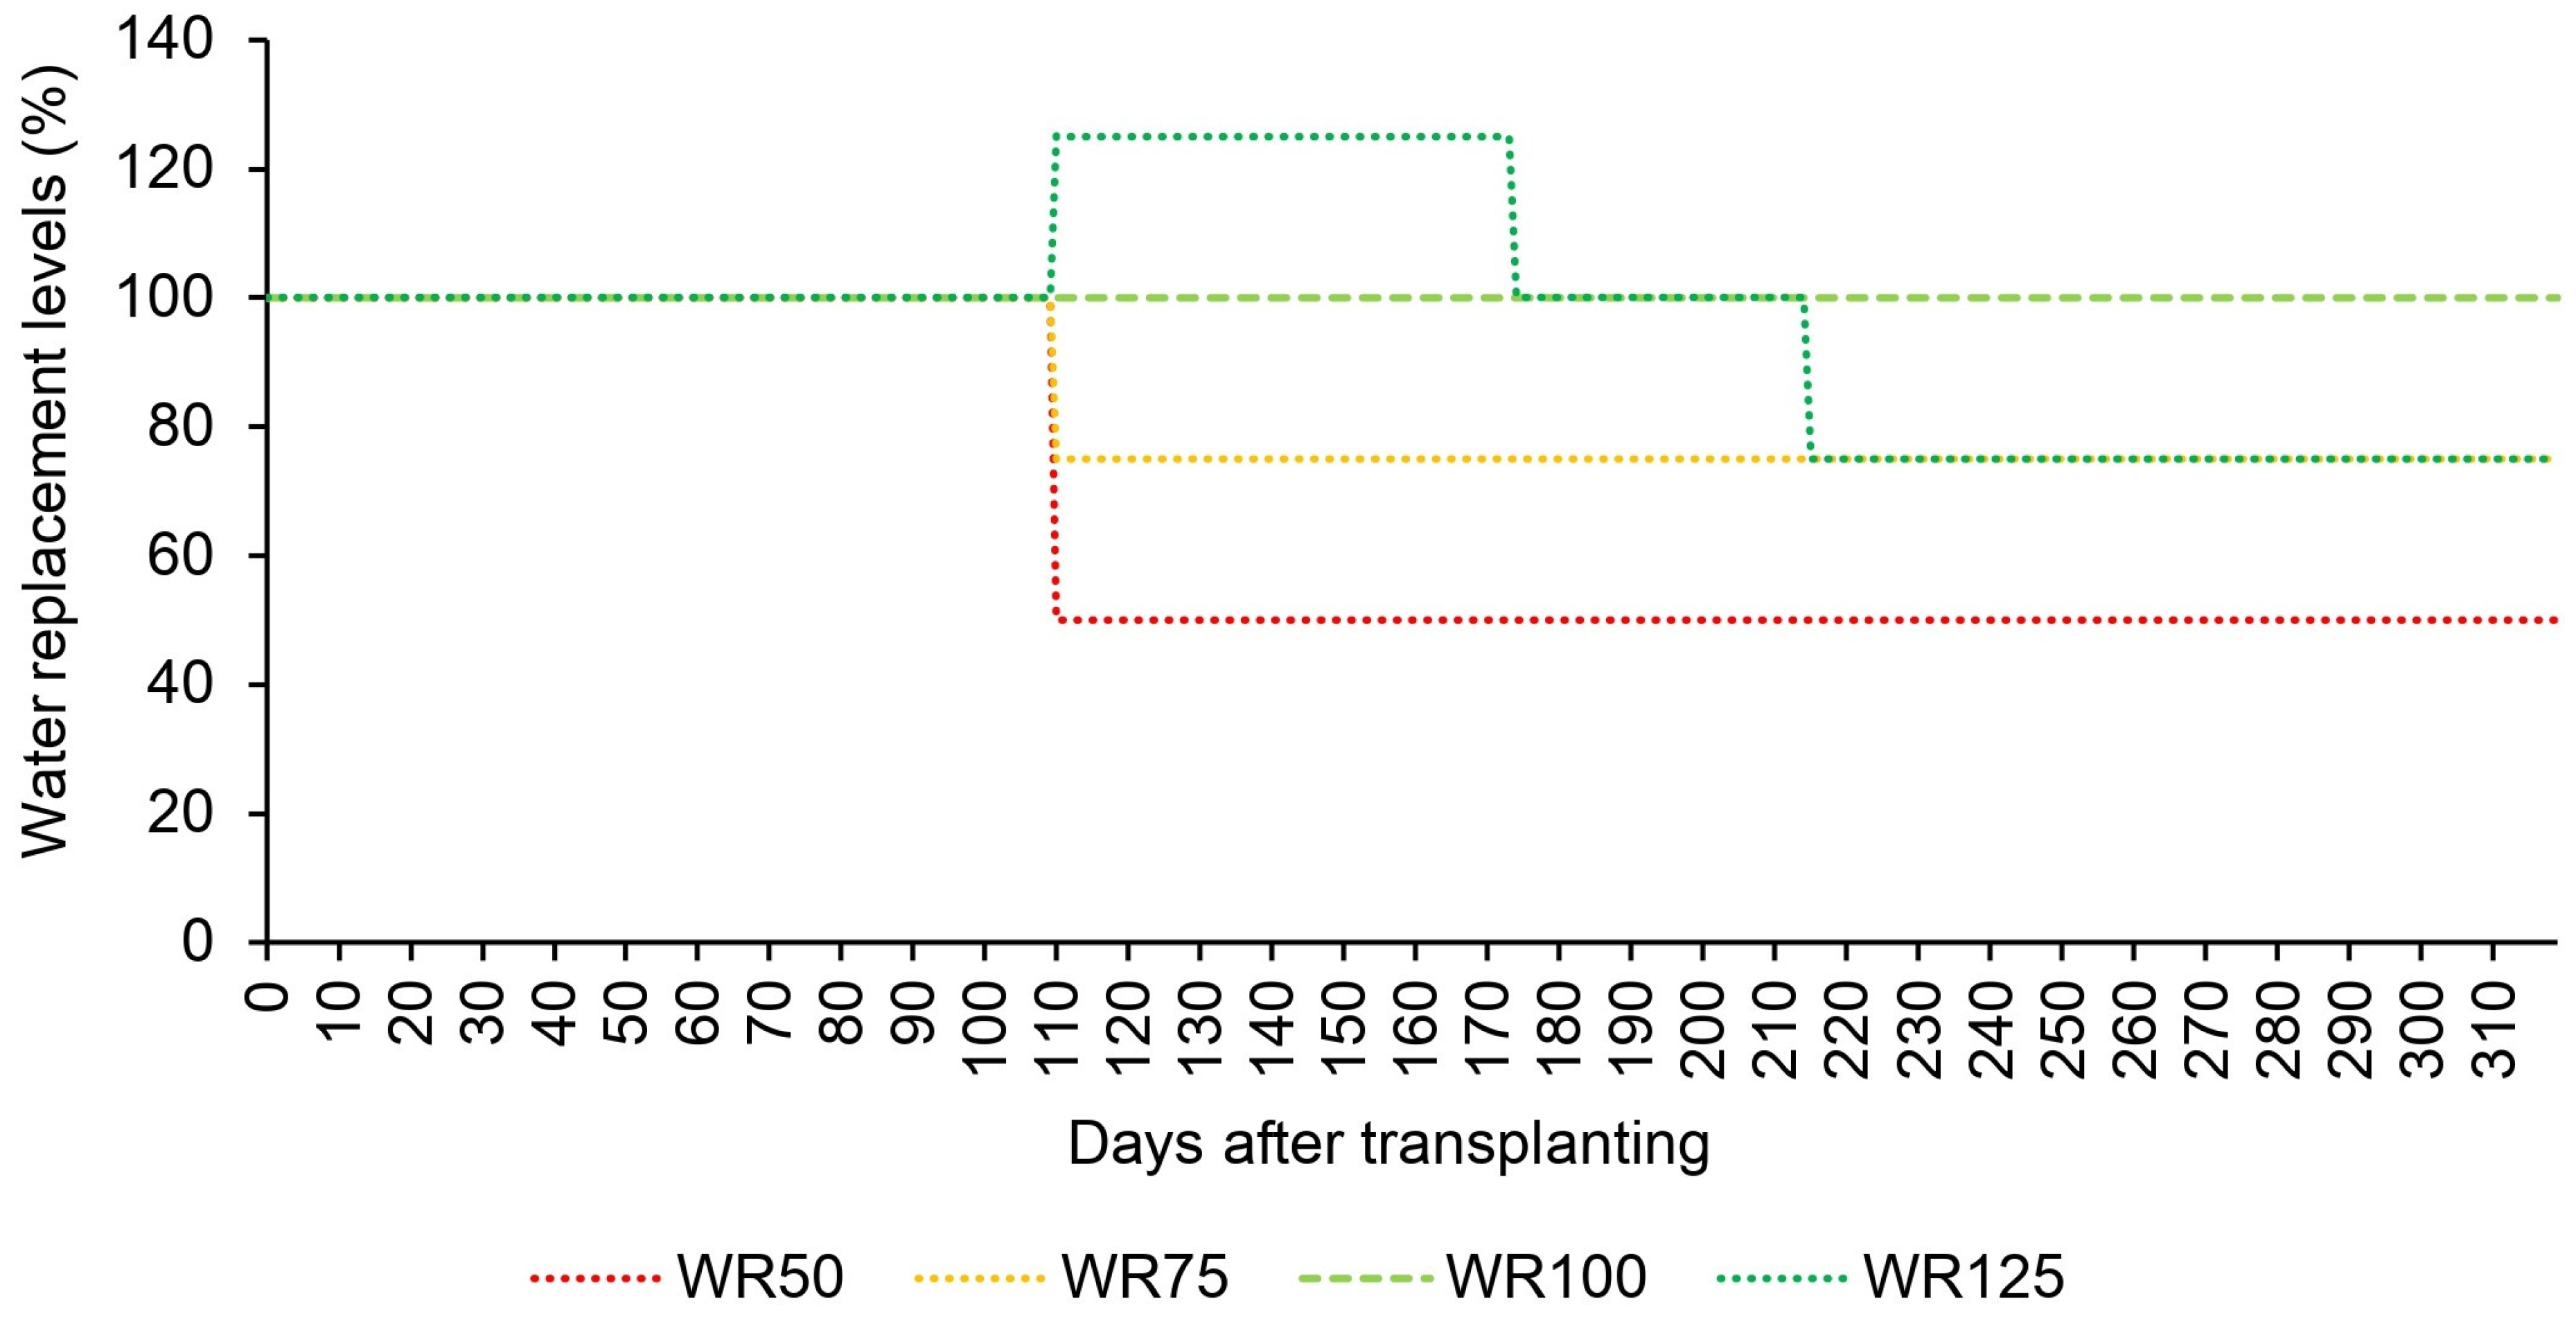
WR100 represents the treatment in which soil moisture was maintained close to field capacity throughout the entire experiment, corresponding to 100% replacement of crop evapotranspiration (ET
c). WR50 represents the treatment that was applied at 50% of that required for the reference treatment, WR100, during the stalk growth phase. The WR75 treatment corresponded to the application of 75% of the WR100 during the stalk growth phase. For the WR125 treatment, 100% of the water demand was replaced during the initial development phase, about 110 days after transplanting (DAT). 125, 100 and 75% of the water demand in the reference treatment (WR100) were applied during the stalk growth phase, corresponding to periods of 64, 41 and 104 days, respectively, for each fraction indicated above. This was a replacement volume similar to the WR75 treatment at the end of the cycle but with a different distribution over time (
Figure 2).
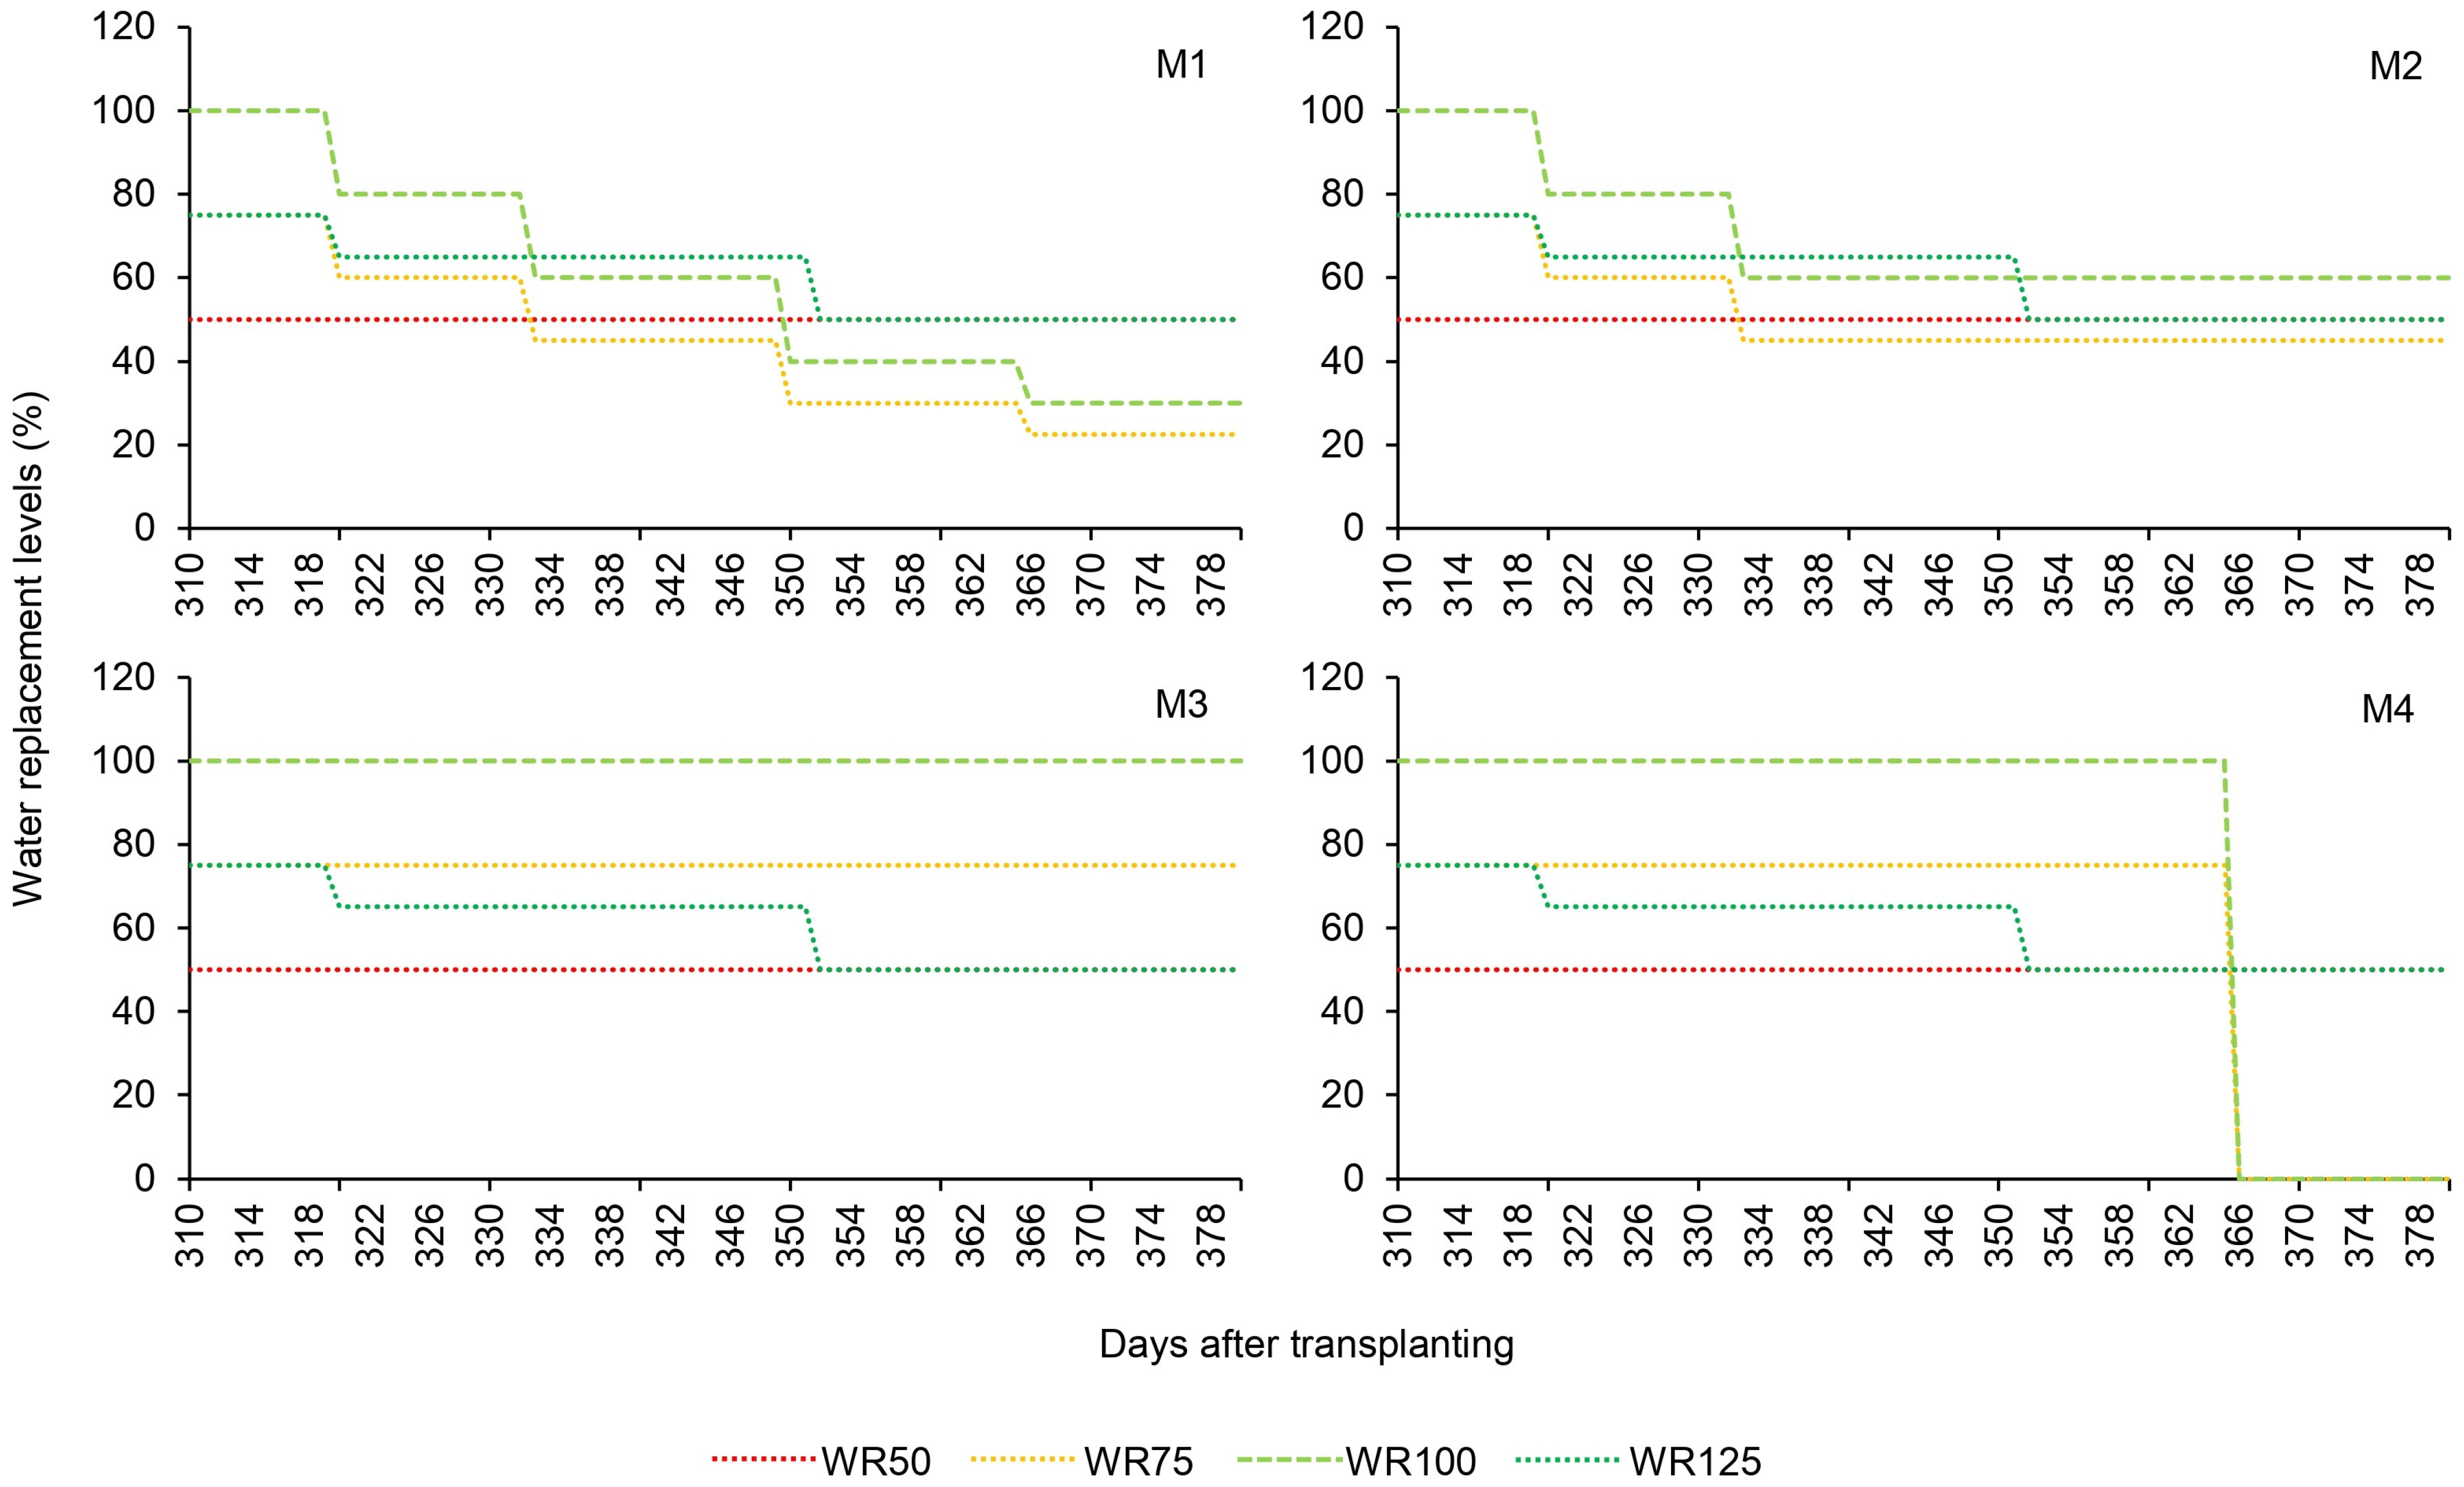
The intensities of water deficit in the final phase of the sugarcane maturation cycle (maturation) were as follows: (1) long-term moderate water deficit (M1), with a slight decrease in the reference water replacement gradually during the last 60 days before harvest; (2) intensive water deficit of long duration (M2), with a severe decrease in the water replacement in the last 60 days before harvest; (3) reference level without water deficit, full irrigation (M3); and (4) M4 maturation stress treatment (total drying out) by suspending irrigation completely 15 days before harvesting so that the available water in the root zone was completely depleted by harvest time. The 15-day period was determined according to the soil-water holding capacity, total available water (TAW) and the evapotranspiration rate during this final stage to fully deplete the soil-water by harvest time. For the WR50 and WR125 treatments, there was no imposition of the maturation treatments because a greater reduction in the fraction of water applied for these treatments could cause the loss or death of some plants, preventing the continuation of the experiment into the second season (
Figure 3).
2.3. Planting and Crop Management
The pre-sprouted seedling (PSS) method for planting was recommended by the Instituto Agronômico de Campinas (IAC). The gem-coming stems were planted initially in plastic trays of 32 cells, and the transplanting of the pre-grooved seedlings in the experimental plots was done when the seedlings had an average height between 0.3 and 0.4 m and an average of three to five expanded leaves.
Seedlings were transplanted in the plots with three replicates of each of the eight varieties managed in the WR100M3 treatment serving as a reference for management of the other replacement levels. Tensiometers were installed immediately after transplanting. A battery with three tensiometers was installed in the center of each of the monitored plots at depths of 0.1, 0.3 and 0.5 m, sampling the soil layers at 0–0.2 m, 0.2–0.4 m and 0.4–0.6 m, respectively, with readings at two-day intervals at the beginning of the cycle and daily after tillering of the plants.
A drip irrigation system was adopted with five emitters spaced at 0.20 m intervals with a flow rate of 1.6 L·h
−1, totaling 1 m of dripper pipe with a total flow rate of 8 L·h
−1 per plot. The reference irrigation slide WR100M3 was quantified via matrix potential and retention curves for each of the studied varieties to define the irrigation time for each variety. For the other treatments, the fraction of the irrigation time that should be applied according to the phase of the experiment was calculated for each of the individual varieties. The harvest occurred between 381 DAT and 392 DAT. For technical analyses, we used the methods recommended by Consecana [
25].
To calculate the crop water productivity for sugar (SWP
c), it was necessary to calculate the total amount of sugar produced in each plot (Equation (1)) and to estimate the total volume of water applied to each plot. Since there was no other source of water for the plants than that supplied by the irrigation system, we simply added up all the irrigations performed throughout the experiment. With these data, the SWP
c was calculated by Equation (2).
in which AT
part is the total sugar produced in the plot in kg, FSB is the fresh stalk biomass in kg, ATR is the total recoverable sugar in kg·Mg
−1, SWP
c is the crop water productivity for sugar in kg·m
−3; and VT
irrigation is the total volume of water applied in the plot, in m
3.
The total dry biomass of the aerial parts of the plants was obtained by adding the dry matter of all the parts sampled during the harvest and the dry leaf blades of the sugarcane collected throughout the experiment. Equation (3) was used to calculate the biomass water productivity (BWP
c).
in which BWP
c is the crop water productivity for biomass in kg·m
−3, BIOM is the dry biomass from the aerial parts of the plants in kg, and VT
irrigation is the total volume of water applied to the plot in m
3.
To determine crop water productivity for first-generation bioethanol (E
1GWP
c), anhydrous alcohol was adopted as a conversion product, which was estimated from total recoverable sugar. Each kg of ATR produces 0.5665 L of anhydrous ethanol. Thus, a similar calculation procedure was adopted to that employed for the determination of the SWP
c, adding only the factor 0.5665, necessary to convert ATR into anhydrous ethanol, as presented in Equations (4) and (5).
in which YE
1G is the first-generation bioethanol yield in L·Mg
−1 harvested culms; ATR is the total recoverable sugar in kg·Mg
−1; 0.5665 is the constant for converting kg of ATR into L of anhydrous ethanol; E
1GWP
c is crop water productivity for first-generation bioethanol in m
3 of ethanol; AT
part is the total sugar produced in the plot in kg; and VT
irrigation is the total volume of water applied to the plot in m
3.
The measurement and calculation of the energy in the aerial parts of the sugarcane plants were carried out according to the recommendations of Coelho et al. [
18].
2.4. Data Analyses
The normality of the experimental data was tested using the Shapiro–Wilk test and homoscedasticity was assessed by the Levene test. Correlations were tested with Pearson’s correlation coefficients. The means were compared using the Scott–Knott test at a 5% significance level. The analyses were performed using the ExpDes.pt and ggplot2 packages from the R software, v.3.3.4.
3. Results and Discussion
3.1. First-Generation Bioethanol Productivity
On average, bioethanol productivity was 9.74 m
3·ha
−1. We identified significant interactions between water replacement and maturation (
Figure 4), as well as between variety and water replacement (
Figure 5). As the productivity of bioethanol depends on the combination of the quality of the juice and the productivity of stalks, we observed that the greatest contribution came from the stalk yield. Thus, we found that the greater the volume of water available and consumed by the crop, the greater the productivity of bioethanol. In this study, we found that the WR50M2 treatment achieved an ethanol yield of 6.82 m
3·ha
−1, while the WR100M3 treatment produced 13.27 m
3·ha
−1. In da Silva et al. [
26], the analysis of drought-tolerant sugarcane genotypes through physiological components also showed a direct relationship between water replacement levels and the gross sugar yield, corroborating the results found in this research.
The results showed that only WR100 produced significant differences between maturities, responding better in the combination of WR100 with M3, while the other water replacement strategies (WR50, WR75 and WR125) showed the same results regardless of the maturation management applied. To attain higher productivity of first-generation bioethanol with sustainable use of water resources, it is recommended to maintain the total availability of water (WR100) until the harvest date (M3). In the other treatments, the reduction in water availability at the end of the cycle did not significantly influence bioethanol productivity.
Regardless of the kind of maturation treatment adopted, WR100 showed better results, followed by WR125 and WR75, which could not be differentiated with regard to M2 and M3. The lower values were always obtained by WR50, regardless of the maturation process, confirming that a water limitation of 50% of the reference was too drastic and should not be adopted. When the productivity of different sugarcane genotypes was evaluated under water restriction in three production environments in Queensland, Australia, for three years by Natarajan et al. [
15], it was observed that the reduction in yield with total irrigation was significant in all environments, while the reduction in productivity after 50% water restriction was not always significant. It should be noted that a greater supply of water in a short period during the growth phase of the stalks did not necessarily produce a gain in bioethanol productivity if there was a reduction in this water supply at the end of the cycle, as occurred for WR125, and compared with WR75 where there was no variation in water availability throughout the growing season.
In nature, the water availability can vary throughout the year and may be scarce in some periods; thus, the comparison between WR125 and WR75 indicates that management with greater water availability at the beginning of the growth of the culms with restriction at the end of cultivation (WR125) provides the same bioethanol productivity as when availability is restricted, but constant (WR75). This result suggests that different options for the management of water resources can still reach the same energy production at harvest.
The comparison of the varieties for each water replacement method highlights the varieties that are most responsive to irrigation and those most sensitive to water deficits. The RB92579 variety, with a history of good response to irrigation, also reached the highest value of bioethanol production when managed under deficit irrigation. The CTC15 and CTC17 varieties also achieved better yields than other varieties, regardless of the water replacement regimen. Despite its better bioethanol yield (
Table 1), the RB966928 variety was sensitive to deficit irrigation, and with WR100, it did not differ significantly from the CTC15, CTC17 or RB92579 varieties, having a yield of 13.1 m
3·ha
−1 that was reduced to 54.1% of this value (7.09 m
3·ha
−1) under the WR50 treatment. The variety with the lowest production of bioethanol, NCo376, showed a yield of 7.76 m
3·ha
−1 for WR100 and 5.05 m
3·ha
−1 for WR50, being the least sensitive to replacement in water reduction. The productivity of bioethanol for WR50 was 65.1% of that found in WR100, which was mainly a reflection of the low stalk productivity regardless of the water replacement level.
3.2. First-Generation Bioethanol Yield
The average bioethanol yield was estimated at 59.3 L·Mg
−1, with a significant difference between the varieties studied (
Table 1). The RB966928 variety achieved the highest yield, with an average of 68.7 L·Mg
−1, more than 20 L above NCo376, and the variety with the lowest average yield of 48.2 L·Mg
−1. The CTC15 and IAC5000 varieties, even though they were from different breeding programs, did not differ significantly and had values lower than RB966928, with yields of 61.5 and 62.4 L·Mg
−1, respectively. Next in the order of average yield were the varieties CTC17 and RB 867515, with 60.4 and 59.6 L·Mg
−1, respectively. In addition to NCo376, the varieties RB92579 and RB931011 also had yields below the general average with values of 56.7 and 57.0 L·Mg
−1, respectively.
The RB92579 and RB931011 varieties belong to the same breeding program (RIDESA) in which RB966928 was developed; however, the latter had a better yield because of its precocious characteristics, which provided a better performance within the study period. Information like this is fundamental for the sustainable growth of the sugarcane industry, as the general expectations are for continuous growth in energy-related products. For the industry to make long-term investments and attain the maximum technological potential, a more comprehensive knowledge of the sector is necessary, including not only economic but also social and environmental objectives [
27].
The water replacement treatments and water deficit intensities in the final stage of the maturation cycle (maturation) at the applied levels did not result in statistically significant differences in the first-generation bioethanol yield parameter.
3.3. Crop Water Productivity for First-Generation Bioethanol
The sugarcane genotypes showed a considerable variation in WP
c values for first-generation bioethanol, in which the averages were on the order of 0.8 L of bioethanol per m
3 of water consumed by the plants. It is noteworthy that for this variable, no significant difference was found for the different levels of water replacement as well as for the maturation processes (
p > 0.05). In analyzing the results of each genotype, a significant difference was noted, resulting in five levels of WP1GB, the best response being achieved by the RB966928 variety, with WP1GB reaching 0.97 L·m
−3. The NCo376 variety had the lowest value at approximately 0.70 L·m
−3 of WP1GB, equivalent to a 27.8% reduction in WP
c compared to the RB966928 variety. In addition to being the most efficient variety in E
1GWP
c, RB966928 also showed good bioethanol productivity (
Table 1).
In the 2017/18 season, RB966928 was the most planted variety in Brazil, representing 17% of the total cultivated area in the state of São Paulo. Today, this value is even more impressive, reaching 20% and revealing itself to be one of the main varieties in the country. The impact of WP
c can be substantial if the amount of water applied significantly improves production compared to the amount of water used by the crop [
28]. Researchers in several regions of China conducted a meta-analysis of 49 experiments on irrigated wheat and cotton under furrow and micro-irrigation systems, determining the optimal level of water use to reach the maximum WP
c. If the objective in these studies is to maximize WP
c instead of yield, the use of water for wheat cultivation can be reduced by 30% with a drop in grain yield of only 15% [
29].
The varietal component in the present study represented significant gains in WP
c with a gradient of 0.27 L·m
−3. Variations between genotypes for WP
c have been found in several species of cultivated plants, including peanuts [
30], sorghum [
31], soybean [
32], cotton and wheat [
33].
For the CTC15, RB92579 and IAC5000 varieties, the values of E1GWPc were 0.83, 0.84 and 0.79 L·m−3, respectively, and did not differ significantly, even though the conversion rate of applied water to bioethanol was similar between these breeding programs, demonstrating that the various breeding programs can choose indicators to improve this parameter regardless of the material being developed. We have the CTC17 and RB867515 varieties with intermediate values of E1GWPc of 0.80 and 0.81 L·m−3, respectively, which are numerically close to the previous varieties, showing little gain in conversion efficiency of bioethanol. Of the national varieties, the lowest E1GWPc value was found for the RB931011 variety, with a value of 0.75 L of bioethanol at the end of the experiment for each m3 of water applied.
It is important to understand that the WP
c is a complex characteristic, which depends on physiological responses such as the ratio between mesophilic conductance and stomatal conductance as key factors [
34]. A better understanding of this parameter for bioenergy production provides a valuable tool for varietal selection to improve sustainability in the production of sugarcane in Brazil [
18].
3.4. Crop Water Productivity for Sugar
The average value of SWP
c was 1.43 kg·m
−3, and there was a statistical difference between the varieties (
Table 1). The RB966928 variety had the highest SWP
c at 1.71 kg·m
−3, and CTC15, CTC17, RB867515, RB92579 and IAC5000 did not differ significantly from each other, being in the second group, with SWP
c of 1.46, 1.41, 1.44, 1.47 and 1.39 kg·m
−3, respectively. RB931011 had a SWP
c of 1.33 kg·m
−3; the least efficient was NCo376 with a SWP
c of 1.24 kg·m
−3.
Analyzing the bioethanol productivity data presented in the previous section from an inverse point of view, starting from the WR50 water replacement, the most sensitive variety, RB966928, showed the greatest gain in bioethanol productivity when irrigated at WR100. This demonstrates its greater efficiency in producing biomass for ethanol when the level of water replacement was increased because it was the most responsive to the increase in water availability. By analyzing the responsiveness of the different varieties, the results coincided with SWPc: the least sensitive varieties, CTC15 and NCo376, were the least responsive and consequently had the lowest SWPc.
In the case of a water deficit with drip irrigation (high frequency), the plants receive water constantly but at a reduced volume. They adapt to avoid severe water stress by maintaining a constant water-to-sugar (SWP
c) conversion rate, regardless of water replacement treatment. These conclusions are supported by studies with average SWP
c between the varieties of 2.74 kg·m
−3 for 100% replacement and 2.86 kg·m
−3 for 70% water replacement for the same soil and regional conditions. In another report, values of 2.10 and 2.13 kg·m
−3 for 100% and 70% of water replacement were seen, respectively. The SWP
c values found in this work are also consistent with the SWP
c found by Carr and Knox [
35].
In research conducted in a rain-out shelter with 24 varieties of sugarcane, Maschio [
36] presented SWP
c values varying between 1.95 and 3.84 kg·m
−3 and BWP
c varying between 6.98 and 11.94 kg·m
−3. The author stated that, on average, the BWP
c for the treatment with an irrigation depth of 70% of the demand was higher than in the condition of treatment with 100% of the irrigation depth. Continuing the experiment, Leal et al. [
37] found SWP
c values ranging from 0.99 to 3.52 kg·m
−3 and BWP
c ranging from 5.4 to 8.29 kg·m
−3. Meanwhile, Farias-Ramírez et al. [
38] determined the effects of different applications of Si and N on WP
c in terms of sugar, biomass and energy (ENWP
c) for sugarcane and found mean values of 2.2 kg·m
−3, 8.5 kg·m
−3 and 191.4 MJ·m
−3, for SWPc, BWPc and ENWPc, respectively.
3.5. Crop Water Productivity for Biomass
The average value of dry biomass from the aerial parts was 5.29 kg·m
−3, and there was no statistical difference between varieties (
Table 1). The CTC15, CTC17, RB867515, RB92579, RB966928 and IAC5000 varieties did not differ significantly with BAP values equal to 5.41, 5.26, 5.27, 5.42, 5.37 and 5.36 kg·m
−3, respectively, and RB931011 (5.17 kg·m
−3) and NCo376 (5.03 kg·m
−3) also did not differ. These last two did not fit in the previous group, probably because RB931011 is a late variety and still developing, and NCo376 is an old variety that was developed in a program in South Africa and did not match the performance of the other varieties. The relationship between the volume of water applied and the productivity of biomass is reflected in the amount of dry biomass from the aerial parts relative to the volume of water consumed by the plant to achieve this production. The higher the dry biomass from the aerial parts, the more efficient the crop will be in the use of water. Similar results were found by Santos et al. [
19].
It was observed that breeding programs failed to alter the photosynthetic efficiency of sugarcane because the biomass, which represents the accumulated output of photosynthesis during the development of the plants, exhibited a rate of accumulation relative to the volume of water consumed that was similar for all varieties. The differences came about primarily from the partitioning of photo-assimilates that each variety made to increase its yield of bioethanol, sugar or biomass. There may also have been small differences in phenology (maturation time) with the improvement of the varieties.
3.6. Energy in Aerial Parts Relative to Soil Water Availability
The average irrigation depth in the experiments was 667.84 mm (±155.59 mm), resulting in accumulated energy in the total average aerial parts of 1007.62 GJ·ha
−1 (±265.66 GJ·ha
−1). The energy in the aerial parts partitioned as sugar had a direct positive correlation with the soil water availability for all varieties. The variety RB931011 had the highest potential for converting unit energy into the aerial parts (1.58 GJ·ha
−1·mm
−1), while NCo376 had the lowest potential unit energy conversion to sugar (1.32 GJ·ha
−1·mm
−1), which represents a reduction of 16.5% between the two varieties (
Figure 6).
With respect to the energy content of the sugar fractions (
Figure 7), RB966928 had the highest potential unit energy (0.51 GJ·ha
−1·mm
−1), while NCo376 showed the lowest potential unit energy (0.3 GJ·ha
−1·mm
−1), a reduction of 42%. The potential energy for any variety of sugarcane depends directly on the water available in the soil during the plant’s growth cycle. Thus, the linear behavior for energy production of the aerial parts and the sugar content of the studied varieties was valid for the domain covered by the irrigation management used.
The coefficient of determination, R2, indicated that the energy in the aerial parts and the sugar fractions for varieties RB931011 and RB966928 could be accurately explained by the availability of water in the soil, indicating that these varieties can be used in the energy modeling of sugarcane in place of NCo376, the current standard variety for modeling a sugarcane crop.
In general, the greater the availability of water in the soil, the greater the energy accumulation in the canes per unit area. From the point of view of sustainability, however, this finding is undesirable since water, the main input in agricultural production, is a finite resource and for a crop to be used for sustainable energy generation, its productivity per unit of transpired water must be high. However, the differences in WP
c values are insignificant due to both water replacement and water deficit intensities in the final stage of the growing cycle, and therefore, it is of prime importance to evaluate productivity per unit of transpired water for each variety by measuring sugar content and biomass as shown in
Table 1.
For sugarcane to be industrially usable, the energy supplied by each of its fractions should be determined in relation to the amount of water provided during the growing season. The high sustainability potential of this crop is also highlighted by the possibility of using most of its fractions, as in the case of bagasse-based ethanol (second-generation), which has excellent prospects for worldwide use [
27], especially in countries like China. Because it does not entail high transportation costs like other lignocellulosic resources, the vast quantities of bagasse already available make it an excellent choice for the generation of ethanol for use as fuel [
39,
40,
41].
The results support the hypothesis that the energy potential of sugarcane is positively correlated with the availability of water in the soil; however, this energetic potential depends not only on irrigation management but also on biomass composition. The main components of biomass include cellulose, hemicellulose, lignin, lipids, proteins, simple sugars, starches, water, hydrocarbons, and ash. The relative concentration of these components varies depending on the species of the plant, the parts used and the growth status. The lignin content has a positive influence on the energy potential of biomass [
42], while the ash content has a negative effect. Despite the obvious effects of biomass composition on energy yield, the role of irrigation on lignin and ash content in energy crops has not been widely studied.


 ,
, 


