


High-Throughput Phenotyping: Application in Maize Breeding
 ,
,
Abstract
:1. Introduction
2. Materials and Methods
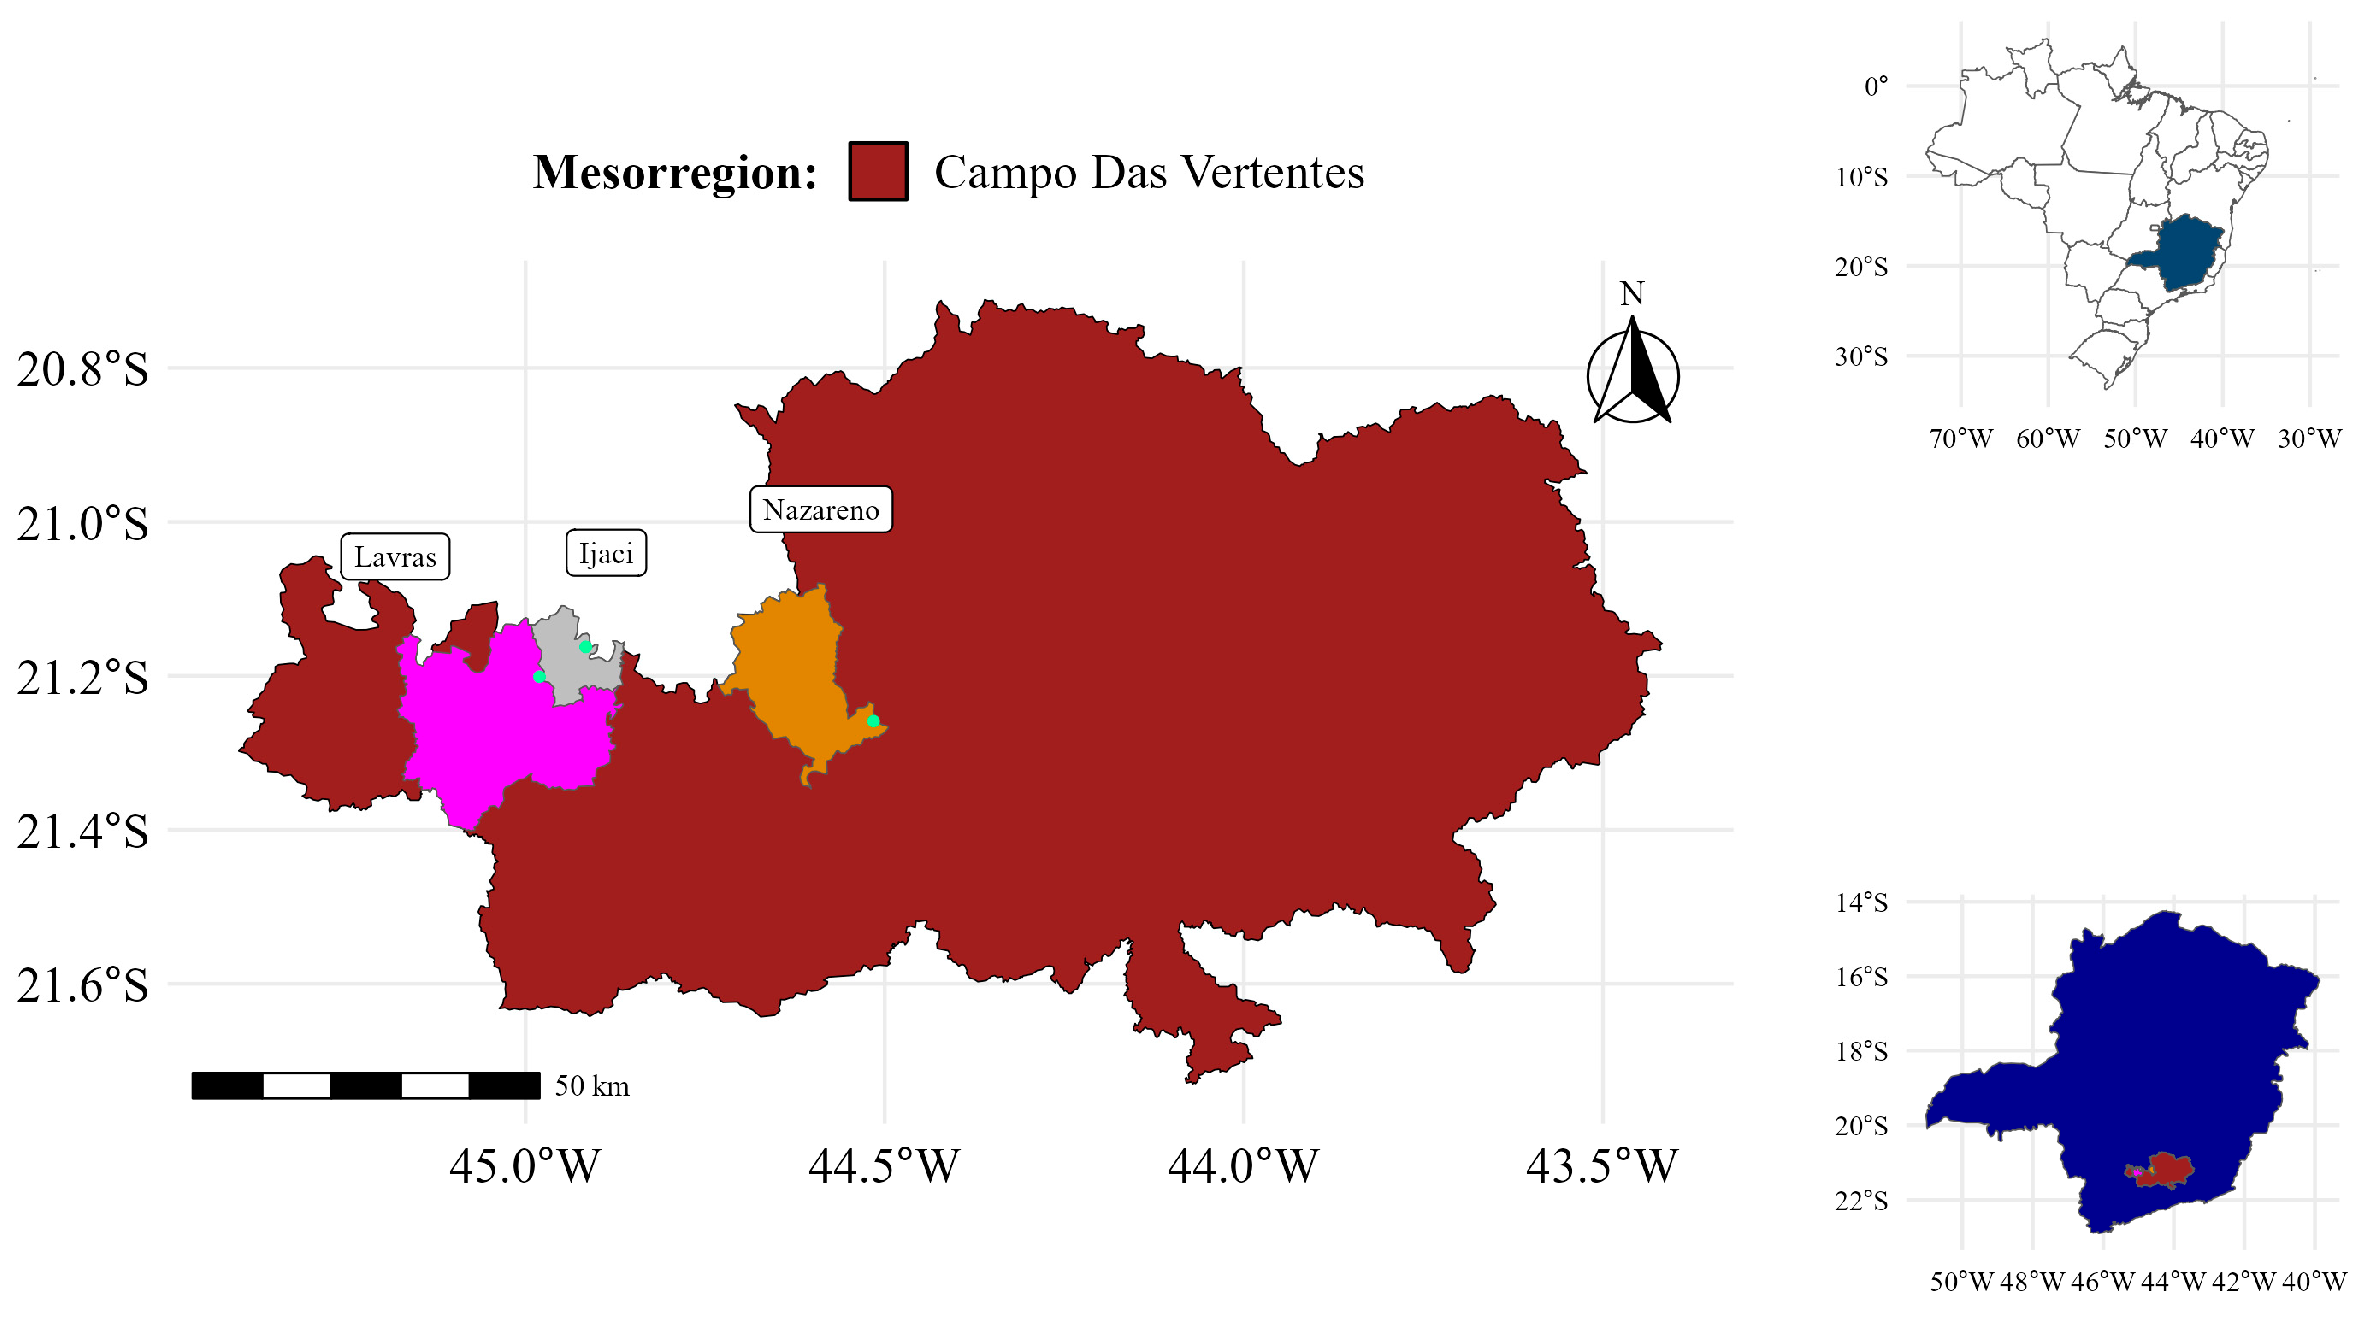
2.1. Study Area
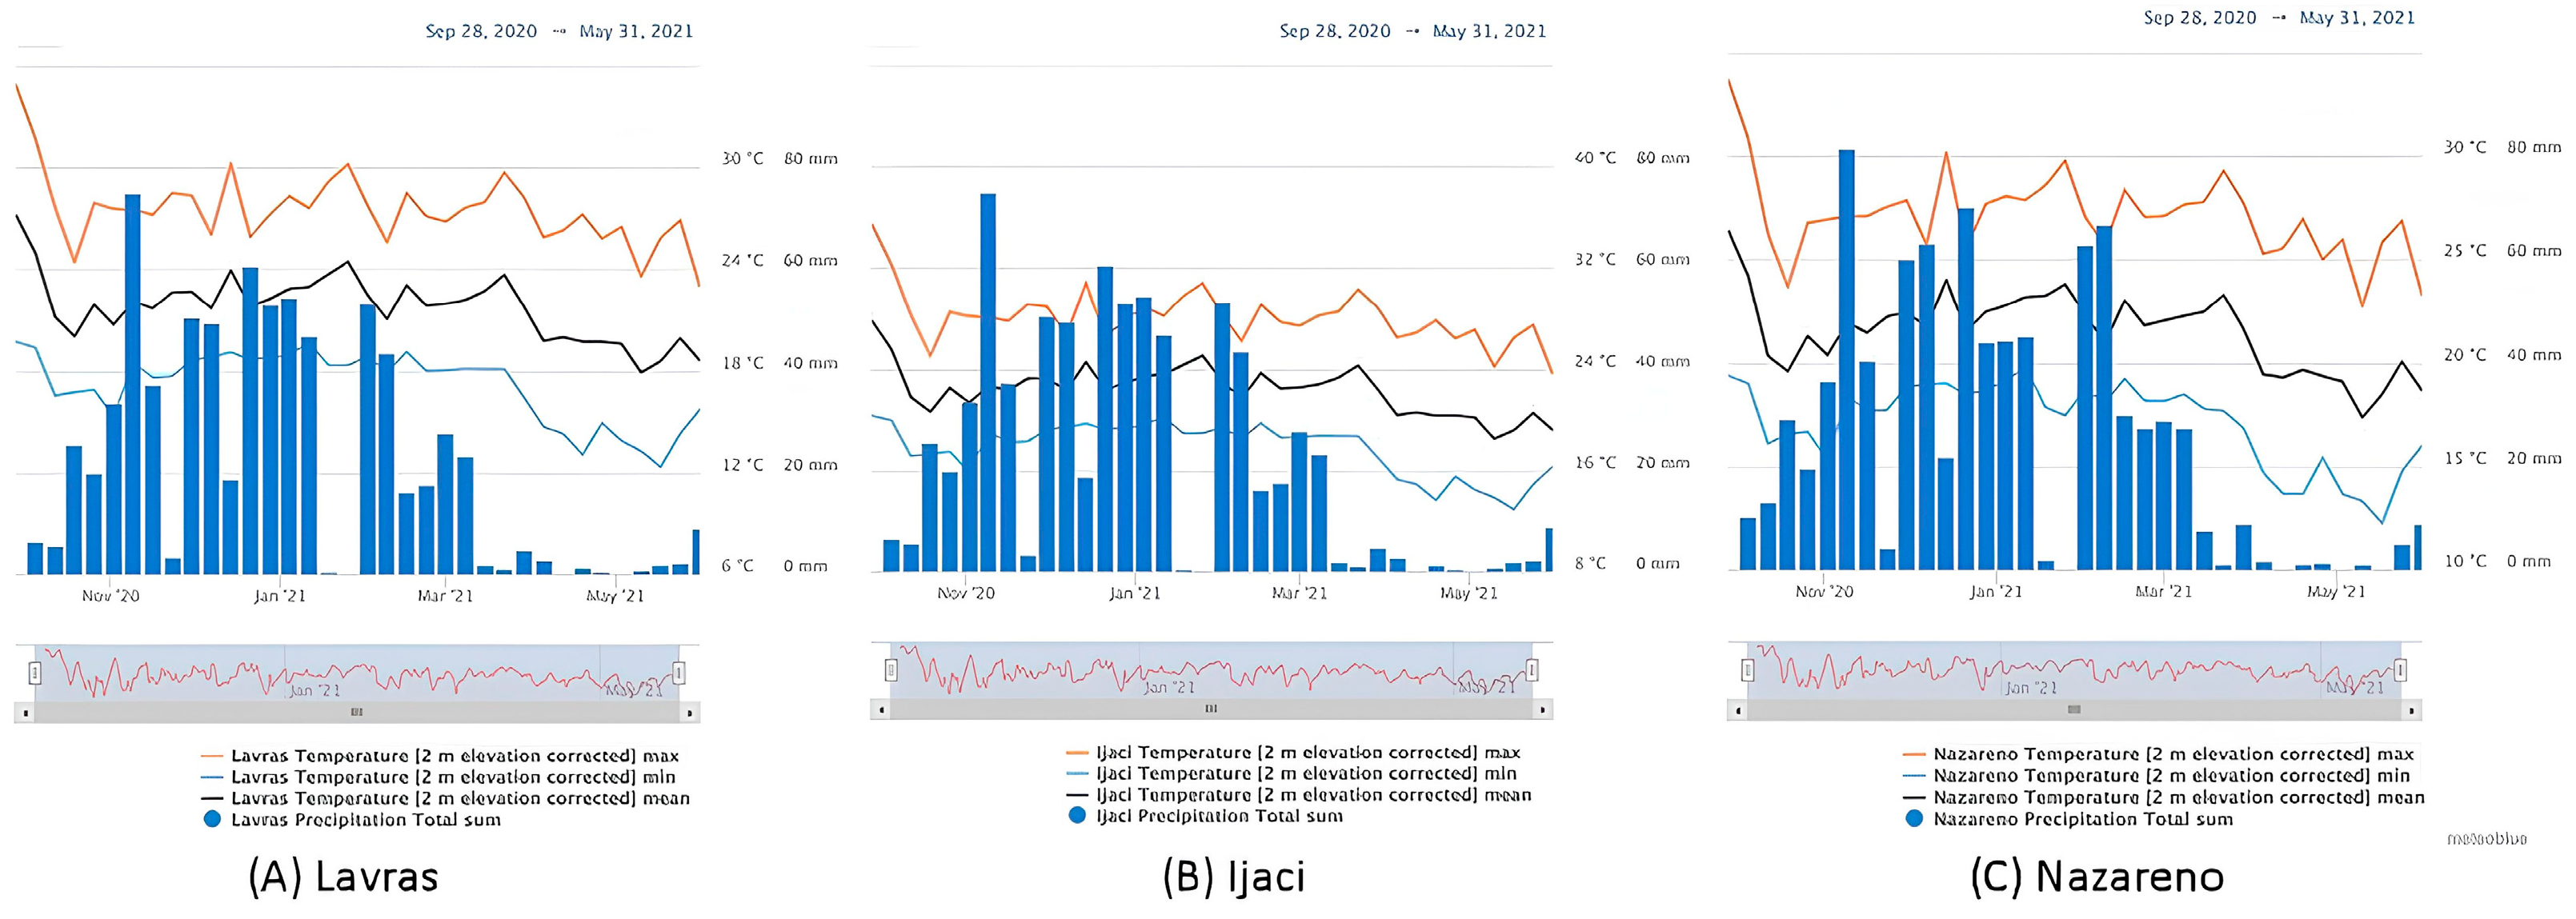
2.2. Environmental Conditions
2.3. Experimental Management
2.4. Experimental Scheme
2.5. Data Acquisition in the Field
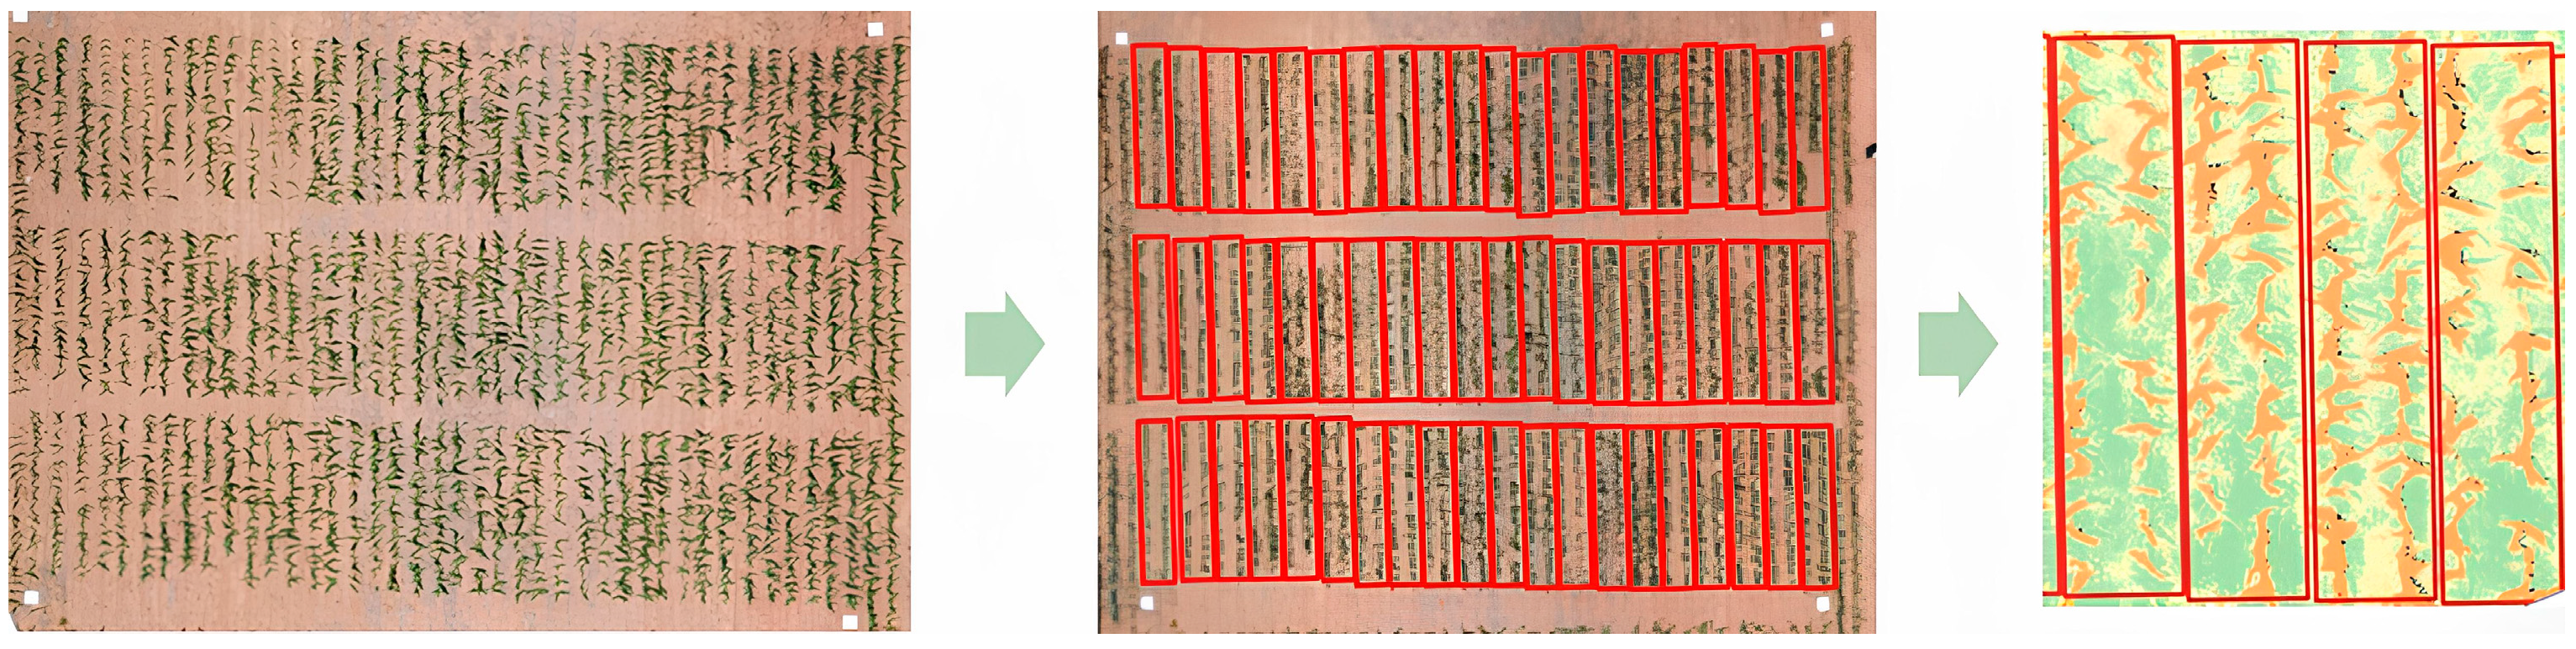
2.6. Image Acquisition and Processing

| Index | Equations | References | |
|---|---|---|---|
| NGRDI | (G − R)/(G + R) | (1) | [37] |
| VARI | (G − R)/(G + R − B) | (2) | [38] |
| GLI | (2 ∗ G − R − B)/(2 ∗ G + R + B) | (3) | [39] |
| ExG COLOR INDEX | 2 ∗ g − r − b | (4) | [40] |
2.7. Pre-Processing of Data and Statistical Analysis
- yij: observed value for the plot that received hybrid i in block j.
- µ: constant associated with every observation.
- hi: effect of hybrid i.
- bj: effect of block j.
- eij: error associated with hybrid i in block j.
- yijk: observed value for the plot that received hybrid i in block j at location l.
- µ: constant associated with every observation.
- hi: effect of hybrid i.
- bj: effect of block j in location k.
- lk: effect of location k.
- h ∗ lik: effect of hybrid-by-location interaction.
- eijk: error associated with hybrid i in block j at location k.
- residual variation.
- hybrid means.
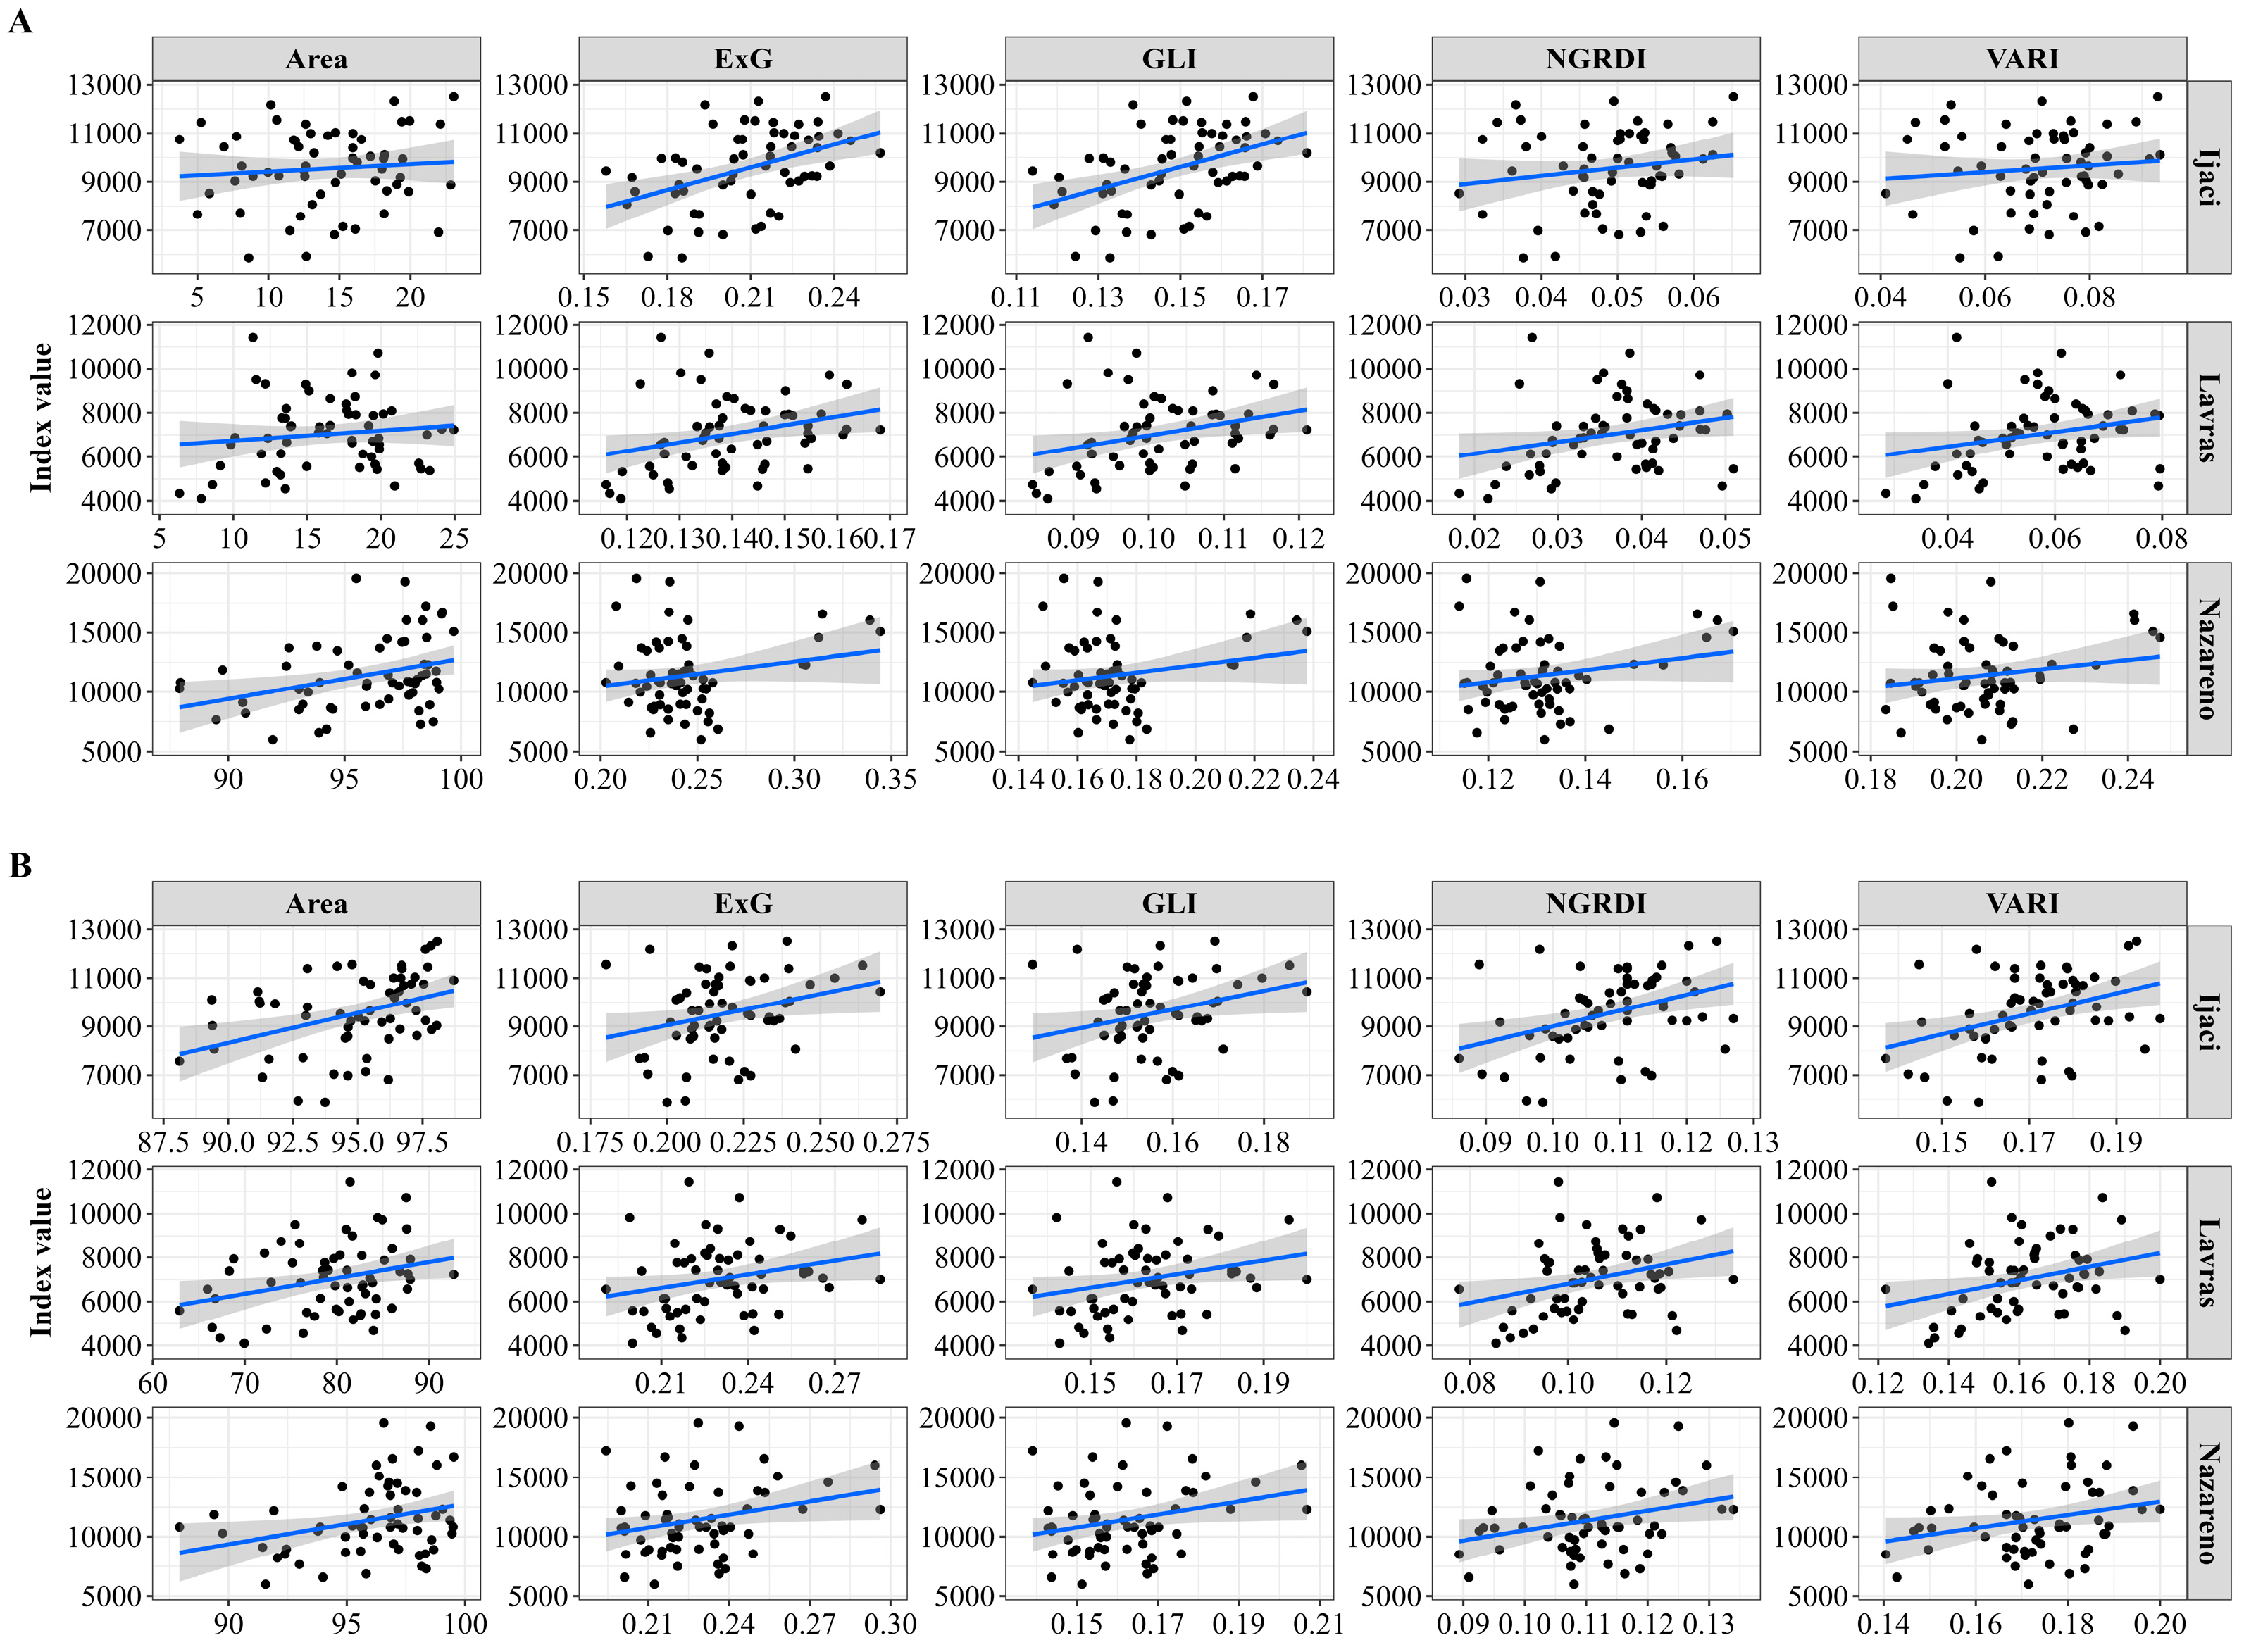
3. Results and Discussion
4. Conclusions
Author Contributions
Funding
Data Availability Statement
Acknowledgments
Conflicts of Interest
References
- Dos Santos, C.V.; de Moraes, F.A.; Torres, L.G.; da Silva, R.A.; da Silva, K.J.; Moreira, S.G.; de Menezes, C.B.; Borém, A. Fenotipagem de raízes de milho visando tolerância à seca: Uma revisão. Res. Soc. Dev. 2021, 10, e24119817265. [Google Scholar] [CrossRef]
- Moreira, F.F.; Oliveira, H.R.; Volenec, J.J.; Rainey, K.M.; Brito, L.F. Integrating high-throughput phenotyping and statistical genomic methods to genetically improve longitudinal traits in crops. Front. Plant Sci. 2020, 11, 681. [Google Scholar] [CrossRef] [PubMed]
- Su, Y.; Wu, F.; Ao, Z.; Jin, S.; Qin, F.; Liu, B.; Pang, S.; Liu, L.; Guo, Q. Evaluating Maize Phenotype Dynamics under Drought Stress Using Terrestrial Lidar. Plant Methods 2019, 15, 11. [Google Scholar] [CrossRef] [PubMed]
- Li, Y.; Wen, W.; Guo, X.; Yu, Z.; Gu, S.; Yan, H.; Zhao, C. High-Throughput Phenotyping Analysis of Maize at the Seedling Stage Using End-to-End Segmentation Network. PLoS ONE 2021, 16, e0241528. [Google Scholar] [CrossRef] [PubMed]
- Bazakos, C.; Hanemian, M.; Trontin, C.; Jiménez-Gómez, J.M.; Loudet, O. New Strategies and Tools in Quantitative Genetics: How to Go from the Phenotype to the Genotype. Annu. Rev. Plant Biol. 2017, 68, 435–455. [Google Scholar] [CrossRef] [PubMed]
- Song, P.; Wang, J.; Guo, X.; Yang, W.; Zhao, C. High-Throughput Phenotyping: Breaking through the Bottleneck in Future Crop Breeding. Crop J. 2021, 9, 633–645. [Google Scholar] [CrossRef]
- Zhou, X.; Zheng, H.B.; Xu, X.Q.; He, J.Y.; Ge, X.K.; Yao, X.; Cheng, T.; Zhu, Y.; Cao, W.X.; Tian, Y.C. Predicting Grain Yield in Rice Using Multi-Temporal Vegetation Indices from UAV-Based Multispectral and Digital Imagery. ISPRS J. Photogramm. Remote Sens. 2017, 130, 246–255. [Google Scholar] [CrossRef]
- Di Gennaro, S.F.; Rizza, F.; Badeck, F.W.; Berton, A.; Delbono, S.; Gioli, B.; Toscano, P.; Zaldei, A.; Matese, A. UAV-Based High-Throughput Phenotyping to Discriminate Barley Vigour with Visible and near-Infrared Vegetation Indices. Int. J. Remote Sens. 2018, 39, 5330–5344. [Google Scholar] [CrossRef]
- Tewes, A.; Schellberg, J. Towards Remote Estimation of Radiation Use Efficiency in Maize Using UAV-Based Low-Cost Camera Imagery. Agronomy 2018, 8, 16. [Google Scholar] [CrossRef]
- Li, B.; Xu, X.; Han, J.; Zhang, L.; Bian, C.; Jin, L.; Liu, J. The Estimation of Crop Emergence in Potatoes by UAV RGB Imagery. Plant Methods 2019, 15, 15. [Google Scholar] [CrossRef]
- Lu, N.; Zhou, J.; Han, Z.; Li, D.; Cao, Q.; Yao, X.; Tian, Y.; Zhu, Y.; Cao, W.; Cheng, T. Improved Estimation of Aboveground Biomass in Wheat from RGB Imagery and Point Cloud Data Acquired with a Low-Cost Unmanned Aerial Vehicle System. Plant Methods 2019, 15, 17. [Google Scholar] [CrossRef] [PubMed]
- Maimaitijiang, M.; Sagan, V.; Sidike, P.; Hartling, S.; Esposito, F.; Fritschi, F.B. Soybean Yield Prediction from UAV Using Multimodal Data Fusion and Deep Learning. Remote Sens. Environ. 2020, 237, 111599. [Google Scholar] [CrossRef]
- Jannoura, R.; Brinkmann, K.; Uteau, D.; Bruns, C.; Joergensen, R.G. Monitoring of Crop Biomass Using True Colour Aerial Photographs Taken from a Remote Controlled Hexacopter. Biosyst. Eng. 2015, 129, 341–351. [Google Scholar] [CrossRef]
- García-Martínez, H.; Flores-Magdaleno, H.; Ascencio-Hernández, R.; Khalil-Gardezi, A.; Tijerina-Chávez, L.; Mancilla-Villa, O.R.; Vázquez-Peña, M.A. Corn Grain Yield Estimation from Vegetation Indices, Canopy Cover, Plant Density, and a Neural Network Using Multispectral and RGB Images Acquired with Unmanned Aerial Vehicles. Agriculture 2020, 10, 277. [Google Scholar] [CrossRef]
- Araus, J.L.; Kefauver, S.C.; Zaman-Allah, M.; Olsen, M.S.; Cairns, J.E. Translating High-Throughput Phenotyping into Genetic Gain. Trends Plant Sci. 2018, 23, 451–466. [Google Scholar] [CrossRef]
- Yang, W.; Zhang, X.; Duan, L. High-Throughput Phenotyping (HTP) and Genetic Analysis Technologies Reveal the Genetic Architecture of Grain Crops. In High-Throughput Crop Phenotyping; Springer: Berlin/Heidelberg, Germany, 2021; pp. 101–127. [Google Scholar] [CrossRef]
- Duddu, H.S.N.; Johnson, E.N.; Willenborg, C.J.; Shirtliffe, S.J. High-Throughput UAV Image-Based Method Is More Precise than Manual Rating of Herbicide Tolerance. Plant Phenom. 2019, 2019, 6036453. [Google Scholar] [CrossRef]
- Liang, X.; Wang, K.; Huang, C.; Zhang, X.; Yan, J.; Yang, W. A High-Throughput Maize Kernel Traits Scorer Based on Line-Scan Imaging. Measurement 2016, 90, 453–460. [Google Scholar] [CrossRef]
- Miller, N.D.; Haase, N.J.; Lee, J.; Kaeppler, S.M.; de Leon, N.; Spalding, E.P. A Robust, High-throughput Method for Computing Maize Ear, Cob, and Kernel Attributes Automatically from Images. Plant J. 2017, 89, 169–178. [Google Scholar] [CrossRef]
- Makanza, R.; Zaman-Allah, M.; Cairns, J.E.; Eyre, J.; Burgueño, J.; Pacheco, Á.; Diepenbrock, C.; Magorokosho, C.; Tarekegne, A.; Olsen, M.; et al. High-Throughput Method for Ear Phenotyping and Kernel Weight Estimation in Maize Using Ear Digital Imaging. Plant Methods 2018, 14, 49. [Google Scholar] [CrossRef]
- Chipindu, L.; Mupangwa, W.; Mtsilizah, J.; Nyagumbo, I.; Zaman-Allah, M. Maize Kernel Abortion Recognition and Classification Using Binary Classification Machine Learning Algorithms and Deep Convolutional Neural Networks. AI 2020, 1, 361–375. [Google Scholar] [CrossRef]
- Matias, F.I.; Caraza-Harter, M.V.; Endelman, J.B. FIELDimageR: An R Package to Analyze Orthomosaic Images from Agricultural Field Trials. Plant Phenome J. 2020, 3, e20005. [Google Scholar] [CrossRef]
- Wu, D.; Cai, Z.; Han, J.; Qin, H. Automatic Kernel Counting on Maize Ear Using RGB Images. Plant Methods 2020, 16, 79. [Google Scholar] [CrossRef]
- Kienbaum, L.; Correa Abondano, M.; Blas, R.; Schmid, K. DeepCob: Precise and High-Throughput Analysis of Maize Cob Geometry Using Deep Learning with an Application in Genebank Phenomics. Plant Methods 2021, 17, 91. [Google Scholar] [CrossRef] [PubMed]
- Warman, C.; Sullivan, C.M.; Preece, J.; Buchanan, M.E.; Vejlupkova, Z.; Jaiswal, P.; Fowler, J.E. A Cost-effective Maize Ear Phenotyping Platform Enables Rapid Categorization and Quantification of Kernels. Plant J. 2021, 106, 566–579. [Google Scholar] [CrossRef] [PubMed]
- Darrah, L.L.; McMullen, M.D.; Zuber, M.S. Breeding, genetics and seed corn production. In Em Corn; Elsevier: Amsterdam, The Netherlands, 2019; pp. 19–41. ISBN 9780128119716. [Google Scholar]
- Rebetzke, G.J.; Jimenez-Berni, J.; Fischer, R.A.; Deery, D.M.; Smith, D.J. Review: High-Throughput Phenotyping to Enhance the Use of Crop Genetic Resources. Plant Sci. 2019, 282, 40–48. [Google Scholar] [CrossRef] [PubMed]
- Zhang, X.; Liu, J.; Song, H. Corn Ear Test Using SIFT-Based Panoramic Photography and Machine Vision Technology. Artif. Intell. Agric. 2020, 4, 162–171. [Google Scholar] [CrossRef]
- Dados Históricos Simulados de Clima e Tempo Para Lavras. Available online: https://www.meteoblue.com/pt/tempo/historyclimate/climatemodelled/lavras_brasil_3458696 (accessed on 29 January 2024).
- Salomão, P.E.A.; Kriebel, W.; dos Santos, A.A.; Martins, A.C.E. A importância do sistema de plantio direto na palha para reestruturação do solo e restauração da matéria orgânica. Res. Soc. Dev. 2020, 9, e154911870. [Google Scholar] [CrossRef]
- Lorenzi, J.O.; Monteiro, P.A.; Miranda Filho, H.S.; Raij, B. Recomendações de Adubação e Calagem para o Estado de São Paulo; IAC: Campinas, Brazil, 1997; Volume 100, pp. 221–229. [Google Scholar]
- Resende, E.L.; Pinho, R.G.V.; Silva, E.V.V.; Massitela, J.J.; de Souza, V.F.; Souza, J.L.D. Mean components for choosing maize populations to extract inbred lines. Ciênc. Agrotecnologia 2020, 44, e017820. [Google Scholar] [CrossRef]
- Available online: https://www.python.org/success-stories/category/scientific/ (accessed on 30 January 2024).
- Professional Photogrammetry and Drone Mapping Software. Available online: https://www.pix4d.com/ (accessed on 30 January 2024).
- Agisoft Metashape: Agisoft Metashape. Available online: https://www.agisoft.com/ (accessed on 30 January 2024).
- The R Project for Statistical Computing. Available online: https://www.r-project.org/ (accessed on 30 January 2024).
- Tucker, C.J. Red and Photographic Infrared Linear Combinations for Monitoring Vegetation. Remote Sens. Environ. 1979, 8, 127–150. [Google Scholar] [CrossRef]
- Gitelson, A.A.; Kaufman, Y.J.; Stark, R.; Rundquist, D. Novel Algorithms for Remote Estimation of Vegetation Fraction. Remote Sens. Environ. 2002, 80, 76–87. [Google Scholar] [CrossRef]
- Louhaichi, M.; Borman, M.M.; Johnson, D.E. Spatially Located Platform and Aerial Photography for Documentation of Grazing Impacts on Wheat. Geocarto Int. 2001, 16, 65–70. [Google Scholar] [CrossRef]
- Meyer, G.E.; Neto, J.C. Verification of Color Vegetation Indices for Automated Crop Imaging Applications. Comput. Electron. Agric. 2008, 63, 282–293. [Google Scholar] [CrossRef]
- Sakamoto, T.; Gitelson, A.A.; Nguy-Robertson, A.L.; Arkebauer, T.J.; Wardlow, B.D.; Suyker, A.E.; Verma, S.B.; Shibayama, M. An Alternative Method Using Digital Cameras for Continuous Monitoring of Crop Status. Agric. For. Meteorol. 2012, 154–155, 113–126. [Google Scholar] [CrossRef]
- Maimaitijiang, M.; Ghulam, A.; Paheding, S.; Hartling, S. Unmanned aerial system (UAS)—Based phe-notyping of soybean using multi-sensor data fusion and extreme learning machine. ISPRS J. Photogramm. Remote Sens. 2017, 134, 43–58. [Google Scholar] [CrossRef]
- De Resende, M.D.V.; Duarte, J.B. Precisão e controle de qualidade em experimentos de avaliação de cultivares. Pesqui. Agropecuária Trop. 2007, 37, 182–194. [Google Scholar]
- Cruz, C.D. GENES—A software package for analysis in experimental statistics and quantitative genetics. Acta Sci. Agron. 2013, 35, 271–276. [Google Scholar] [CrossRef]
- Huber, P.J. Robust Regression: Asymptotics, Conjectures and Monte Carlo. Ann. Stat. 1973, 1, 799–821. [Google Scholar] [CrossRef]
- Ronchetti, E.M.; Huber, P.J. Robust Statistics; John Wiley & Sons: Hoboken, NJ, USA, 2009. [Google Scholar]
- Rodene, E.; Xu, G.; Palali Delen, S.; Zhao, X.; Smith, C.; Ge, Y.; Schnable, J.; Yang, J. A UAV-based High-throughput Phenotyping Approach to Assess Time-series Nitrogen Responses and Identify Trait-associated Genetic Components in Maize. Plant Phenome J. 2022, 5, e20030. [Google Scholar] [CrossRef]
- Cooper, M. Integração de ganho genético e análise de lacunas para prever melhorias na produtividade das culturas. Crop Sci. 2020, 60, 582–604. [Google Scholar] [CrossRef]
- Scott, A.J.; Knott, M. A cluster analysis method for grouping means in the analysis of variance. Biometrics 1974, 30, 507. [Google Scholar] [CrossRef]
- Chivasa, W.; Onísimo; Burgueno, J. Fenotipagem de alto rendimento baseada em UAV para aumentar a precisão da previsão e seleção em variedades de milho sob inoculação artificial de MSV. Comput. E Eletrônica Na Agric. 2021, 184, 106128. [Google Scholar] [CrossRef]
- Galon, L. Períodos de interferência de plantas daninhas infestando a cultura do milho. Rev. De Ciências Agrárias 2018, 17, 197–205. [Google Scholar]
- Yu, N.; Li, L.; Schmitz, N.; Tian, L.F.; Greenberg, J.A.; Diers, B.W. Development of Methods to Improve Soybean Yield Estimation and Predict Plant Maturity with an Unmanned Aerial Vehicle Based Platform. Remote Sens. Environ. 2016, 187, 91–101. [Google Scholar] [CrossRef]
- Khan, Z.; Rahimi-Eichi, V.; Haefele, S.; Garnett, T.; Miklavcic, S.J. Estimation of vegetation indices for high-throughput phenotyping of wheat using aerial imaging. Métodos Veg. 2018, 14, 1–11. [Google Scholar] [CrossRef]
- Kefauver, S.C.; El-Haddad, G.; Vergara-Diaz, O.; Araus, J.L. RGB picture vegetation indexes for High-Throughput Phenotyping Platforms (HTPPs). In Remote Sensing for Agriculture, Ecosystems, and Hydrology XVII; SPIE: St Bellingham, WA, USA, 2015; pp. 82–90. [Google Scholar]
- Lussem, U. Avaliação de índices de vegetação baseados em RGB a partir de imagens de UAV para estimar a produção de forragem em pastagens. Os Arquivos Internacionais de Fotogrametria. Sensoriamento Remoto E Ciências Da Informação Espac. 2018, 42, 1215–1219. [Google Scholar]
- Macedo, F. Estimativa da Produtividade e Biomassa Aérea do Milho (Zea mays) através de Índices de Vegetação na Ilha da Madeira. Agricultura 2023, 13, 1115. [Google Scholar]
- Vian, A.L.; Bredemeier, C.; Silva, P.R.F.D.A.; Santi, A.L.; Silva, C.P.G.D.A.; Santos, F.L.D.O.S. Limites críticos de ndvi para estimativa do potencial produtivo do milho. Rev. Bras. Milho Sorgo 2018, 17, 91. [Google Scholar] [CrossRef]
- Zhang, H.; Lu, Y.; Ma, Y.; Fu, J.; Wang, G. Genetic and Molecular Control of Grain Yield in Maize. Mol. Breed. 2021, 41, 18. [Google Scholar] [CrossRef]
- Medeiros, A.D.; Pereira, M.D.; Silva, J.A. Processamento digital de imagens na determinação do vigor de sementes de milho. Rev. Bras. Cienc. Agrar./Braz. J. Agric. Sci. 2018, 13, 1–7. [Google Scholar] [CrossRef]
- Ma, X.; Zhu, K.; Guan, H.; Feng, J.; Yu, S.; Liu, G. High-throughput phenotyping analysis of potted soybean plants using colorized depth images based on a proximal platform. Remote Sens. 2019, 11, 1085. [Google Scholar] [CrossRef]
- Komyshev, E.; Genaev, M.; Afonnikov, D. Evaluation of the SeedCounter, A mobile application for grain phenotyping. Front. Plant Sci. 2017, 7, 1990. [Google Scholar] [CrossRef] [PubMed]
- Ramos, F. Leaf blade area of different plants estimated by linear and dry matter measures, calibrated with the ImageJ software. Interciencia 2015, 40, 570–575. [Google Scholar]


| Flight 1 | Flight 2 | Flight 3 | Flight 4 | |
|---|---|---|---|---|
| Ijaci | V5 | VT | R3 | R5 |
| Lavras | V5 | V10 | VT | R3 |
| Nazareno | V8 | VT | R4 | R6 |
| Hybrids AB | AB Mean | Hybrids CD | CD Mean |
|---|---|---|---|
| RB 9077 | 12,156 a | RB 9077 | 12,930 a |
| DKB 230 | 10,623 a | DKB 230 | 11,151 a |
| Hybrid AB 2 | 9707 b | Hybrid CD 2 | 7445 b |
| Hybrid AB 1 | 9559 b | Hybrid CD 1 | 10,235 a |
| Hybrid AB 4 | 9468 b | Hybrid CD 4 | 8242 b |
| Hybrid AB 5 | 9466 b | Hybrid CD 5 | 8711 b |
| Hybrid AB 6 | 9363 b | Hybrid CD 6 | 6236 b |
| Hybrid AB 3 | 8868 b | Hybrid CD 3 | 8732 b |
| Hybrid AB | 8306 b | Hybrid AB | 10,108 a |
| Hybrid CD | 6739 b | Hybrid CD | 7525 b |
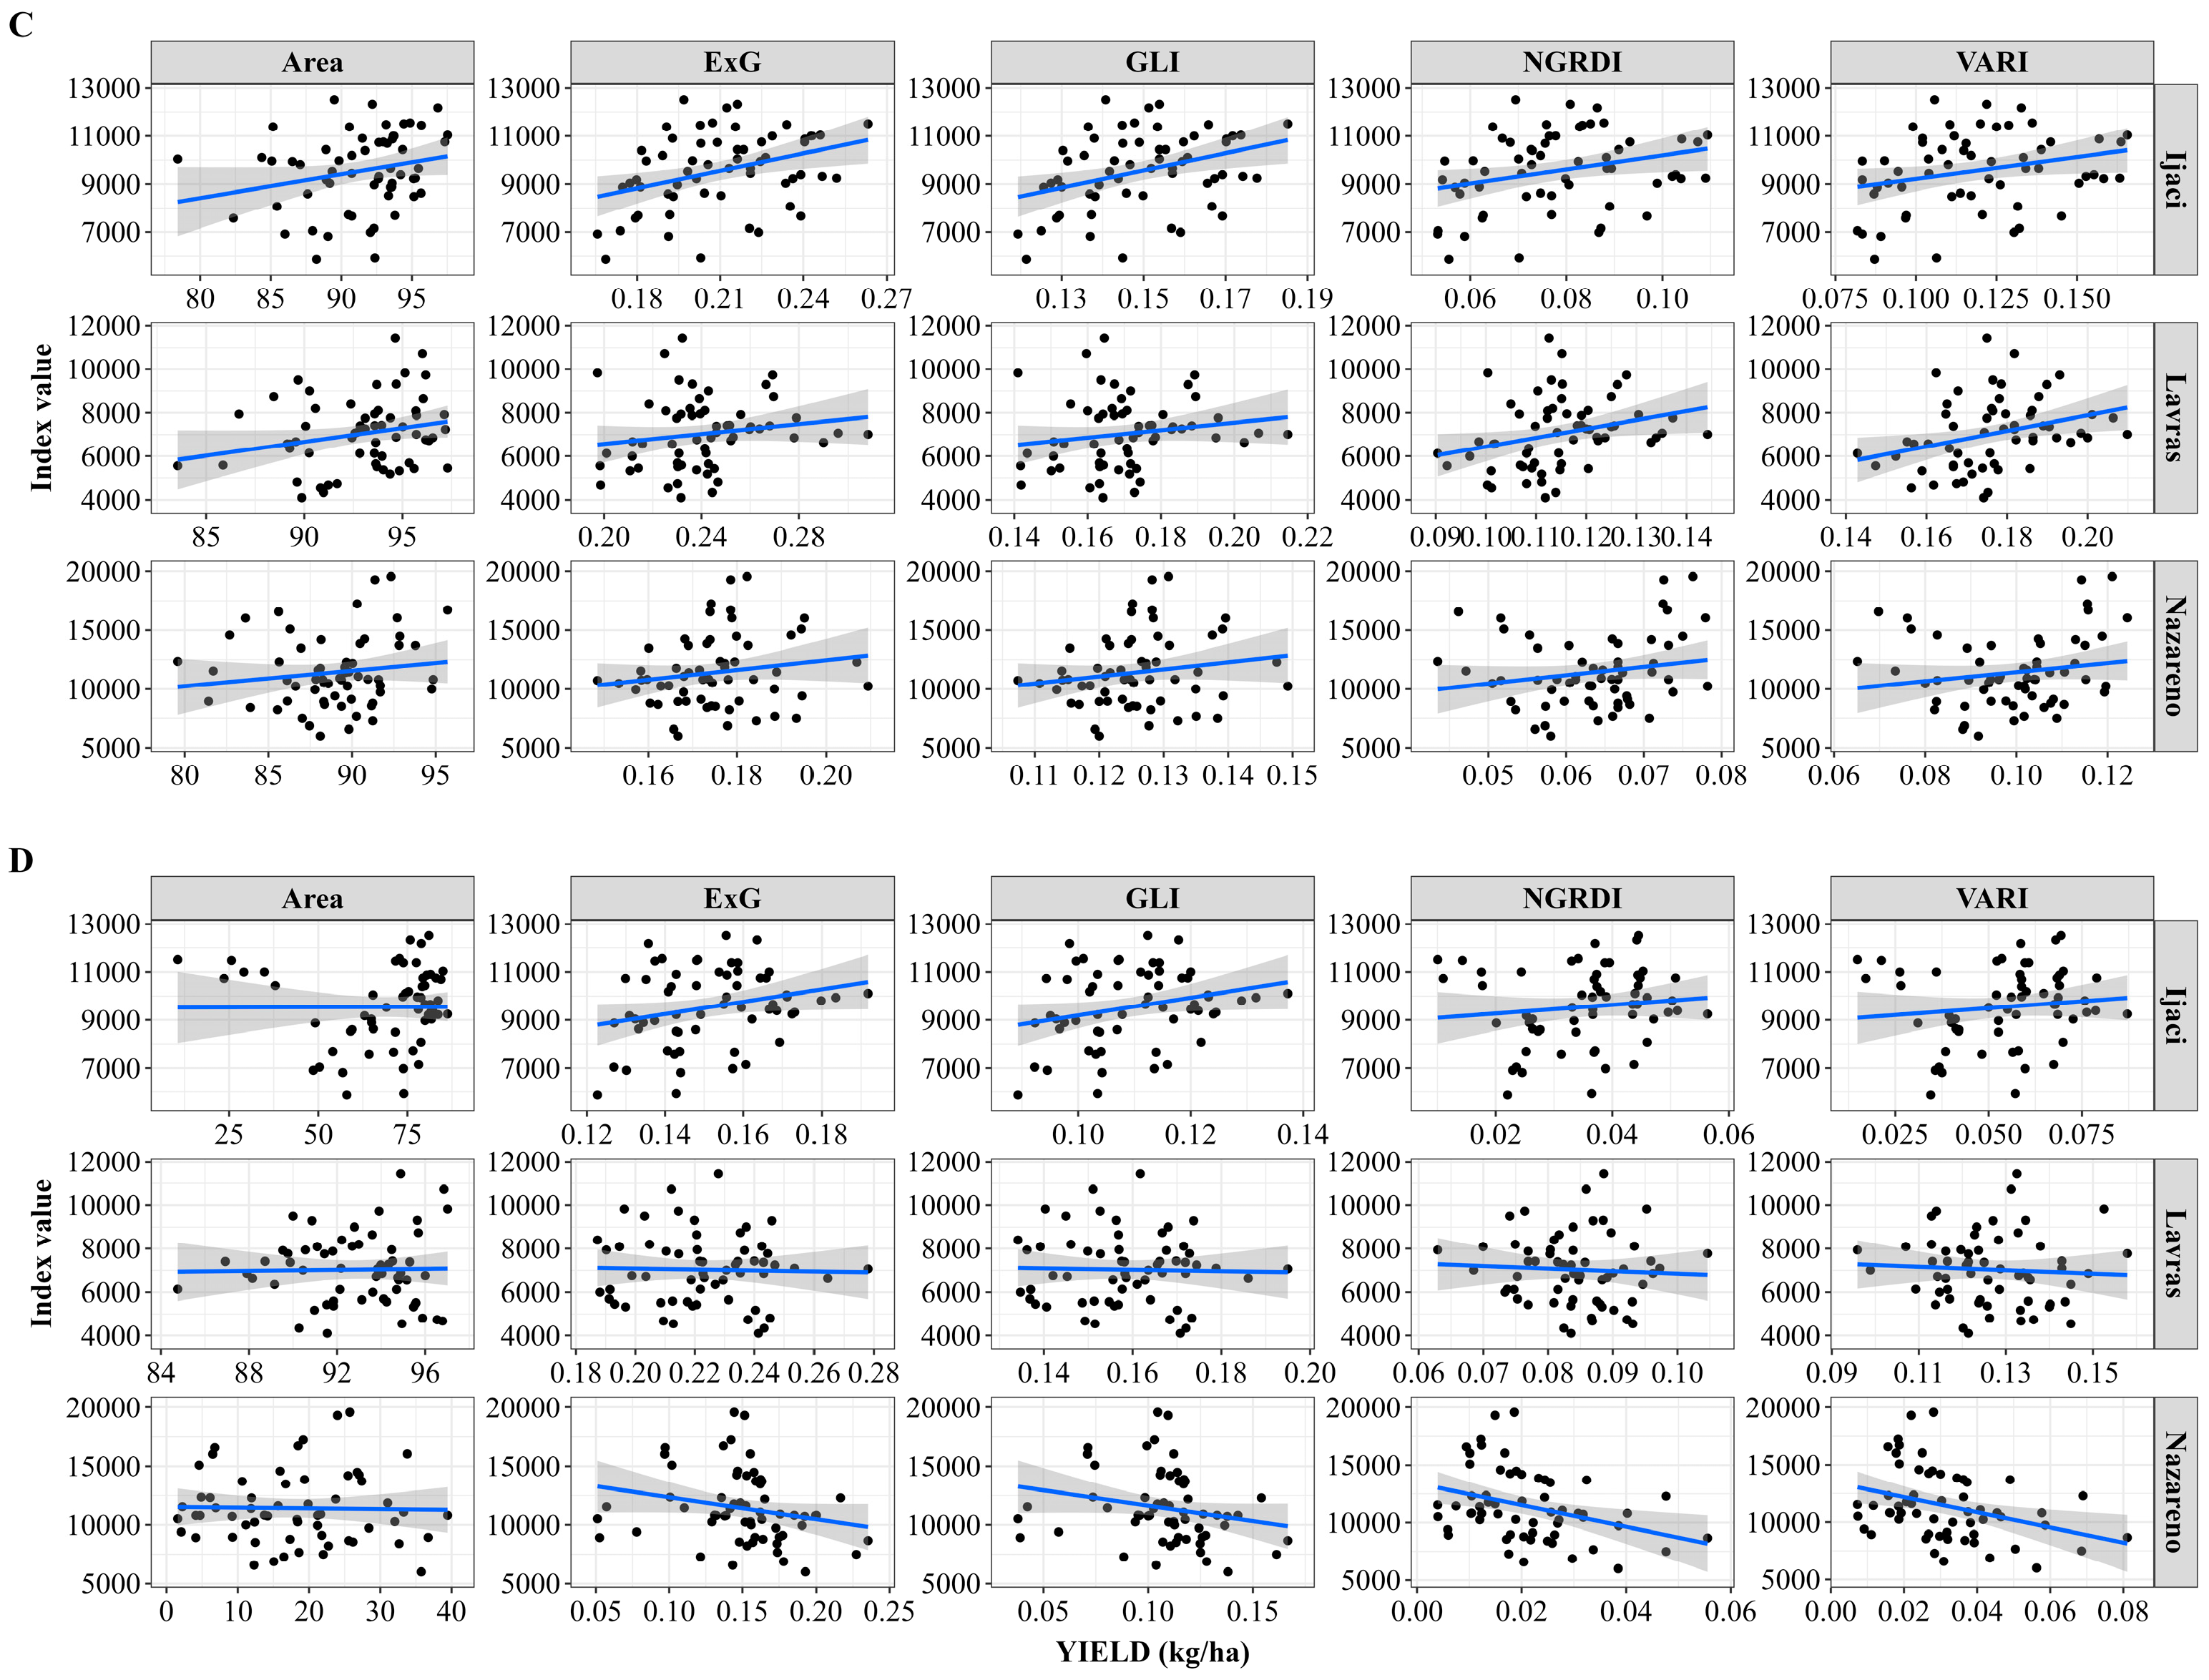
| Flight 1 | Flight 2 | |||||||||
|---|---|---|---|---|---|---|---|---|---|---|
| NGRDI | VARI | GLI | ExG | Area | NGRDI | VARI | GLI | ExG | Area | |
| Lavras | 0.07 * | 0.05 | 0.09 * | 0.09 * | 0.02 | 0.09 * | 0.09 * | 0.07 * | 0.07 * | 0.09 ** |
| Ijaci | 0.03 | 0.01 | 0.19 ** | 0.19 ** | 0.01 | 0.14 * | 0.14 ** | 0.08 * | 0.06 * | 0.15 ** |
| Nazareno | 0.04 | 0.03 | 0.02 | 0.04 * | 0.11 ** | 0.07 * | 0.06 * | 0.07 * | 0.07 * | 0.09 ** |
| Flight 3 | Flight 4 | |||||||||
| NGRDI | VARI | GLI | ExG | Area | NGRDI | VARI | GLI | ExG | Area | |
| Lavras | 0.08 ** | 0.10 ** | 0.03 | 0.03 | 0.05 | 0.003 | 0.004 | 0.001 | 0.001 | 0.0003 |
| Ijaci | 0.08 * | 0.07 * | 0.12 ** | 0.13 ** | 0.06 | 0.02 | 0.01 | 0.06 * | 0.06 * | 0.00 |
| Nazareno | 0.04 | 0.03 | 0.03 | 0.03 | 0.02 | 0.12 ** | 0.12 ** | 0.05 | 0.05 | 0.001 |
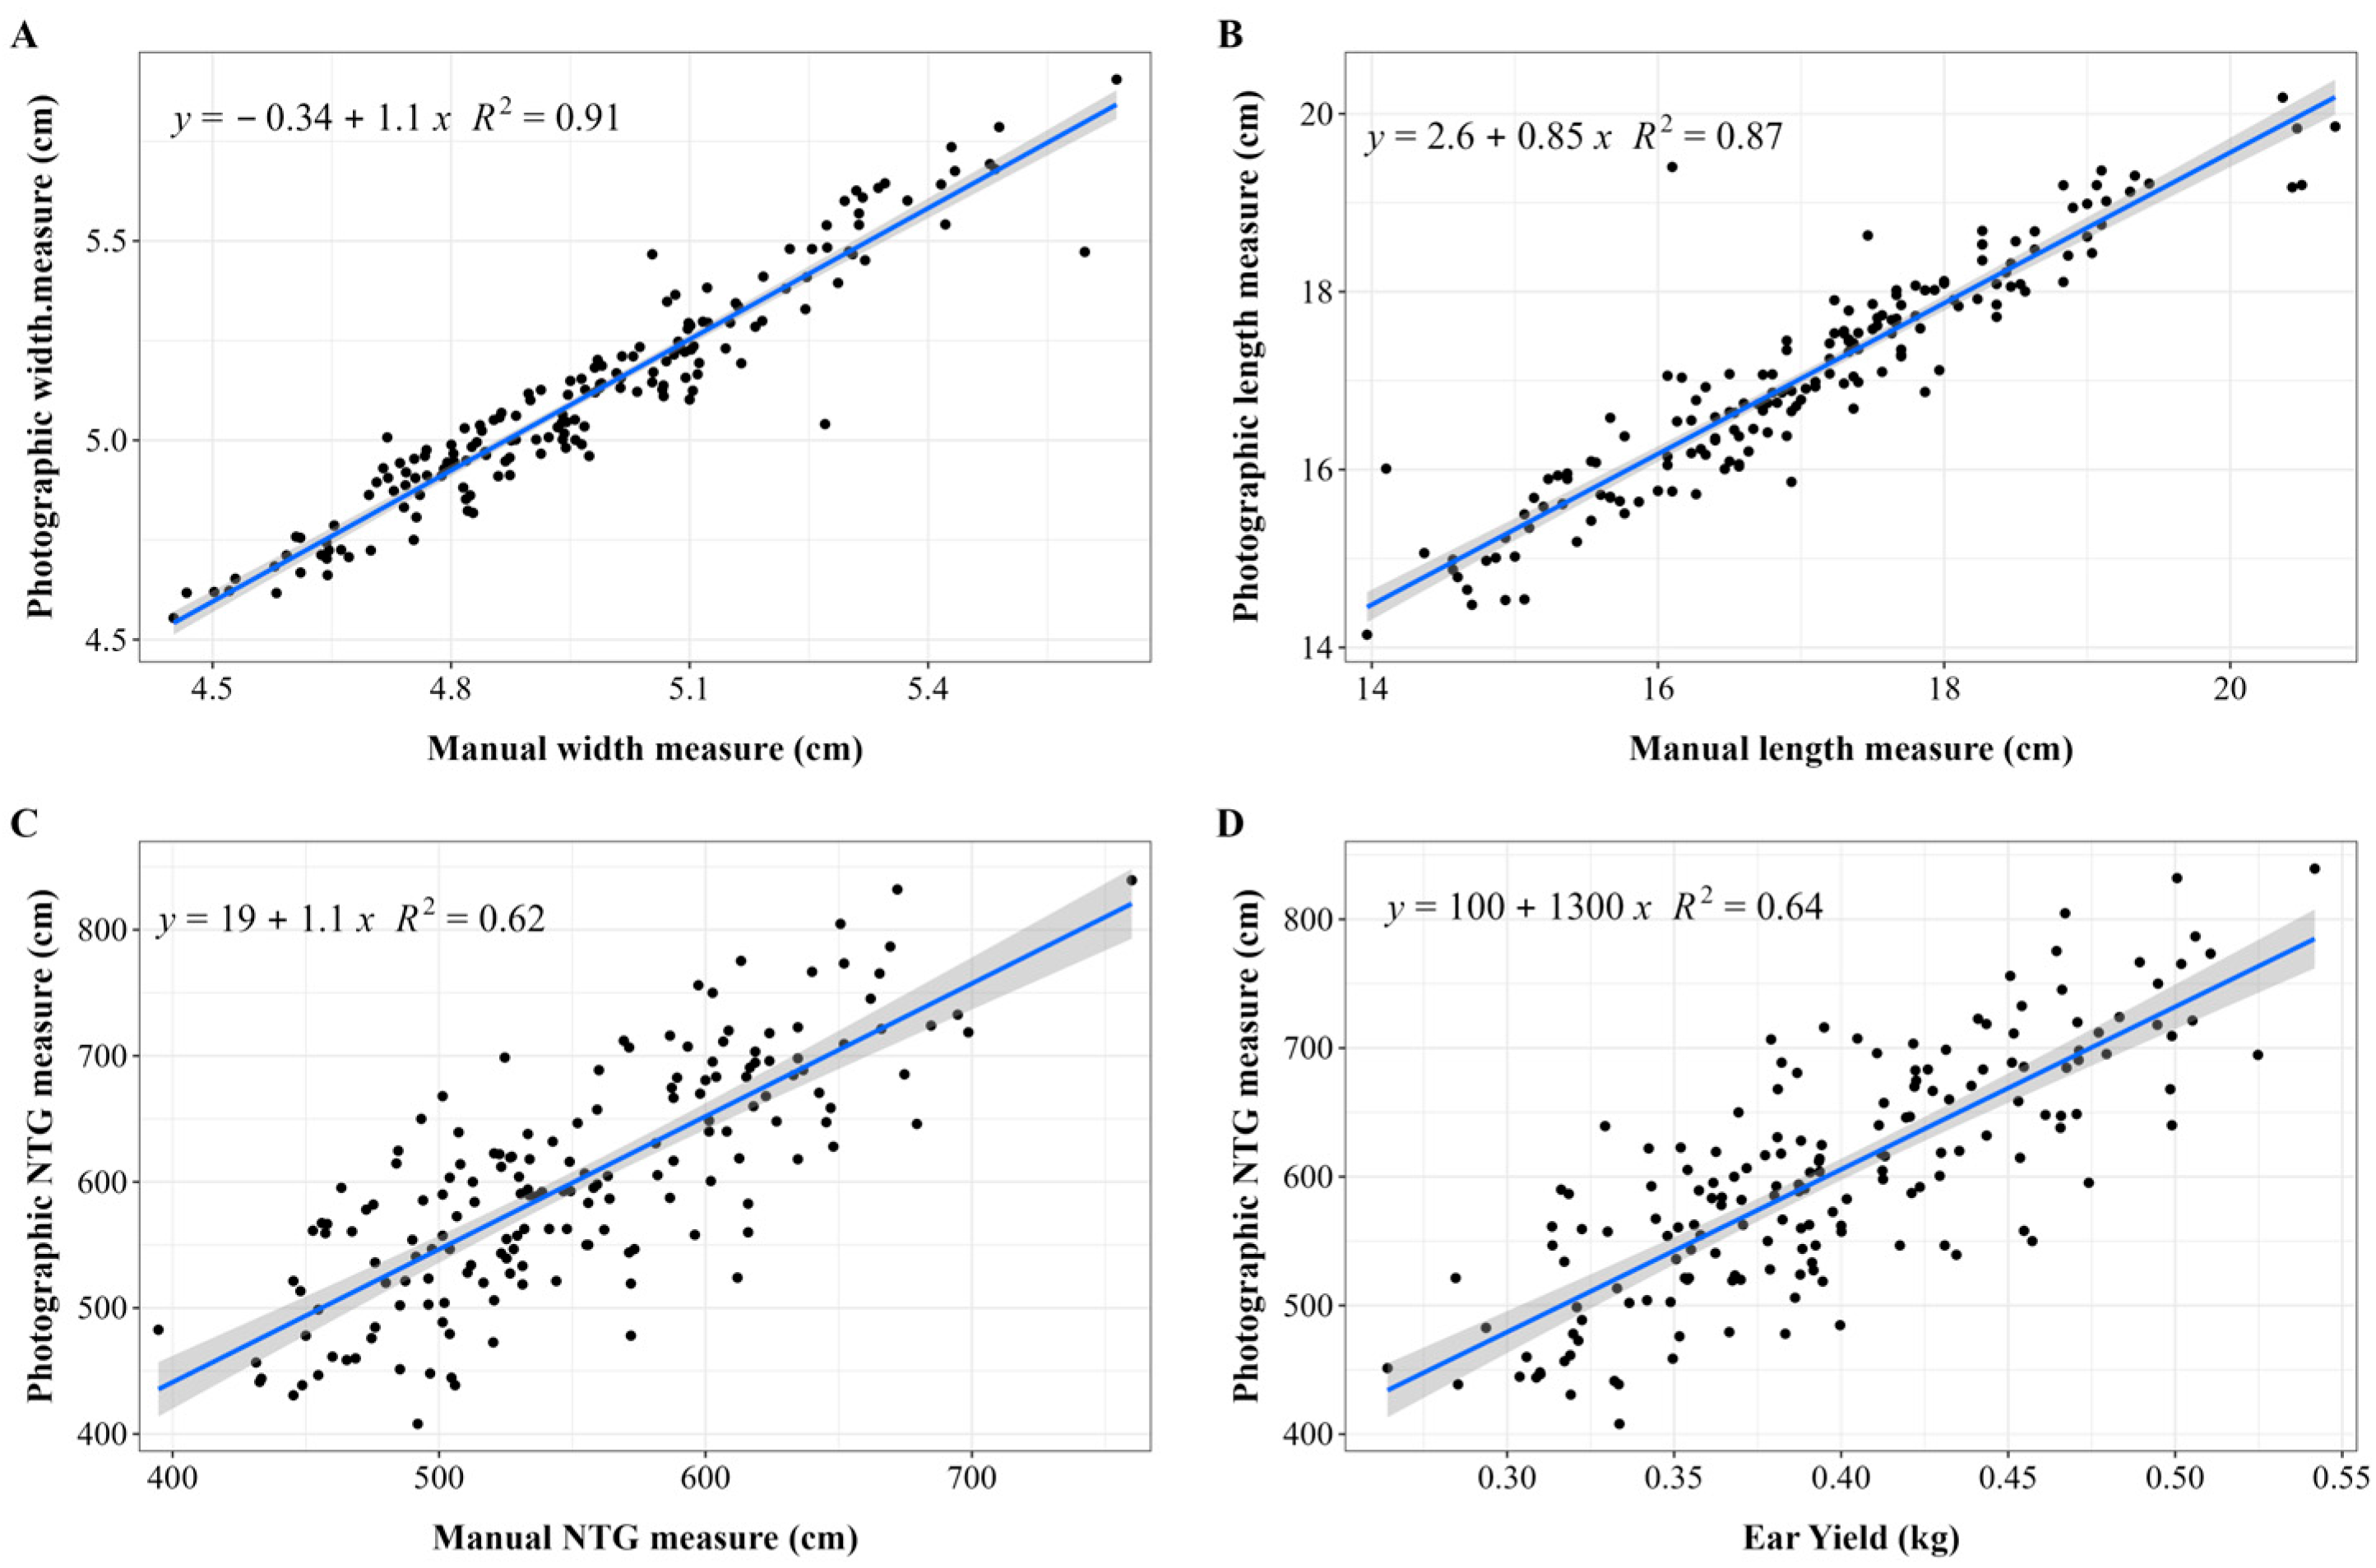
| Manual Accuracy | Photographic Accuracy | Correlation | |||||||
|---|---|---|---|---|---|---|---|---|---|
| Width | Length | TNG | Width | Length | TNG | Width | Length | TNG | |
| Ijaci AB | 68.95 | 67.94 | 84.56 | 77.12 | 72.85 | 84.58 | 0.90 ** | 0.95 ** | 0.65 ** |
| Ijaci CD | 85.55 | 74.48 | 76.00 | 82.58 | 73.27 | 87.86 | 0.96 ** | 0.98 ** | 0.70 ** |
| Lavras AB | 65.99 | 72.54 | 65.26 | 81.96 | 75.20 | 83.31 | 0.95 ** | 0.95 ** | 0.79 ** |
| Lavras CD | 92.39 | 17.78 | 78.82 | 93.66 | 69.47 | 83.77 | 0.98 ** | 0.83 ** | 0.80 ** |
| Nazareno AB | 57.02 | 80.58 | 83.73 | 71.58 | 79.97 | 93.52 | 0.97 ** | 0.97 ** | 0.75 ** |
| Nazareno CD | 79.78 | 82.20 | 51.23 | 78.62 | 80.78 | 64.96 | 0.98 ** | 0.97 ** | 0.71 ** |
Disclaimer/Publisher’s Note: The statements, opinions and data contained in all publications are solely those of the individual author(s) and contributor(s) and not of MDPI and/or the editor(s). MDPI and/or the editor(s) disclaim responsibility for any injury to people or property resulting from any ideas, methods, instructions or products referred to in the content. |
© 2024 by the authors. Licensee MDPI, Basel, Switzerland. This article is an open access article distributed under the terms and conditions of the Creative Commons Attribution (CC BY) license (https://creativecommons.org/licenses/by/4.0/).
Share and Cite
Resende, E.L.; Bruzi, A.T.; Cardoso, E.d.S.; Carneiro, V.Q.; Pereira de Souza, V.A.; Frois Correa Barros, P.H.; Pereira, R.R. High-Throughput Phenotyping: Application in Maize Breeding. AgriEngineering 2024, 6, 1078-1092. https://doi.org/10.3390/agriengineering6020062
Resende EL, Bruzi AT, Cardoso EdS, Carneiro VQ, Pereira de Souza VA, Frois Correa Barros PH, Pereira RR. High-Throughput Phenotyping: Application in Maize Breeding. AgriEngineering. 2024; 6(2):1078-1092. https://doi.org/10.3390/agriengineering6020062
Chicago/Turabian StyleResende, Ewerton Lélys, Adriano Teodoro Bruzi, Everton da Silva Cardoso, Vinícius Quintão Carneiro, Vitório Antônio Pereira de Souza, Paulo Henrique Frois Correa Barros, and Raphael Rodrigues Pereira. 2024. "High-Throughput Phenotyping: Application in Maize Breeding" AgriEngineering 6, no. 2: 1078-1092. https://doi.org/10.3390/agriengineering6020062