
Use of Unmanned Aerial Vehicle for Pesticide Application in Soybean Crop
by
 and
and
Luana de Lima Lopes
1,
João Paulo Arantes Rodrigues da Cunha
1,* and
Quintiliano Siqueira Schroden Nomelini
2 1
Institute of Agrarian Sciences, Federal University of Uberlândia, Uberlândia 38408-100, Brazil
2
Math College, Federal University of Uberlândia, Uberlândia 38408-100, Brazil
*
Author to whom correspondence should be addressed.
AgriEngineering 2023, 5(4), 2049-2063; https://doi.org/10.3390/agriengineering5040126
Submission received: 7 July 2023
/
Revised: 11 October 2023
/
Accepted: 19 October 2023
/
Published: 3 November 2023
(This article belongs to the Special Issue Unmanned Aerial Vehicle and Remote Sensing Systems Usage in Precision Agriculture)
Abstract
:The use of unmanned aerial vehicles (UAVs) for pesticide application has increased substantially. However, there is a lack of technical information regarding the optimal operational parameters. The aim of this study was to evaluate the quality of pesticide application on a soybean crop using a UAV employing different spray nozzles. The experiments were conducted using a completely randomized design with four treatments and eight repetitions. The trial was conducted in a soybean growing area during the soybean reproductive stage (1.1 m tall). The treatments included aerial application (rate: 10 L hm−2) using an Agras MG1-P UAV with XR 11001 (flat fan), AirMix 11001 (air-induction flat fan), and COAP 9001 (hollow cone spray) nozzles; for comparison, ground application (rate of 100 L hm−2) using a constant pressure knapsack sprayer with an XR 110015 (flat fan) nozzle was performed. The deposition was evaluated by quantifying a tracer (brilliant blue) using spectrophotometry and analyzing the droplet spectrum using water-sensitive paper. Furthermore, the application quality was investigated using statistical process control methodology. The best deposition performance was exhibited by the application via UAV using the COAP 9001 and AirMix 11001 nozzles. For all the treatments, the process remained under statistical control, indicating commendable adherence to quality standards. The aerial application provided greater penetration of the spray into the crop canopy. With the use of the UAV, the coverage on the water-sensitive paper was <1%; moreover, the AirMix 11001 and XR 110015 nozzles had the lowest drift potential.
1. Introduction
Soybean (Glycine max (L.) Merrill) is a legume species from the Fabaceae family with compound leaves, small white or purple flowers, and pods generally containing between one and four seeds. Production of the crop is concentrated in the United States, Brazil, and Argentina, and represented approximately 82% of global soybean production in 2021 [1]. In Brazil, currently the largest producing country in the world [2], it is one of the main agricultural commodities.
In a scenario of high productivity and the rapid development of modern agriculture, the popularization of new agricultural technologies can play a potentially positive role in ensuring food production and food security. Crop yields increase when modern technologies are adopted and efficiently used to achieve higher yields with limited resources [3]. The introduction of various technologies to farmers enables them to acquire the necessary skills to achieve socially, economically, and environmentally conscious agricultural production [4].
In the field of pesticide application, unmanned aerial vehicles (UAVs) are often considered a cutting-edge technology. UAVs are aerial vehicles, which operate without the need for a human pilot on board [5]. This aircraft is remotely controlled and capable of autonomous flight using pre-programmed flight routes. UAVs exhibit the capability to operate at low altitudes and adeptly hover in proximity to crops at different application heights and varying speeds while ensuring accuracy and safety, rendering them a potential tool in pesticide application [6].
Wang et al. [7] reported that the use of UAVs for the purpose of pesticide application can result in droplet drift at a certain altitude, which may cause harm to non-target organisms. One way to reduce drift is by increasing droplet size. However, applicators also consider optimal pest control efficacy when using small droplets, because fine droplets, despite being more susceptible to drift, possess a greater ability to penetrate and adequately cover the crop canopy [8].
To foster the desired outcome of uniform, sustainable, safe, and effective application of pesticides, various models and nozzle spray angles have emerged that effectively optimize the application process [9]. The characteristics and spectrum of the droplets may vary for different nozzles that have distinct structural characteristics [10]. Identifying the droplet size distribution of the nozzle under normal working conditions is, therefore, of great importance to guide the most appropriate choice in relation to the target, spray properties, and environmental conditions [11]. The flat fan nozzle is a widely used nozzle. It produces a relatively uniform distribution over the application range [12], has a fan-shaped flow field, and its spray cross-section is elliptical [13]. Standard flat fan nozzles can be enhanced with a Venturi system to achieve larger droplet sizes, thereby preventing the drifting of smaller droplets during the spraying process. These nozzles are known as air-induction or Venturi nozzles. It is important to remember that larger droplets reduce target coverage since, for a fixed application rate, numerous smaller droplets can cover a greater surface area than fewer larger droplets [14].
Another commonly used type of nozzle is the hollow cone spray nozzle. These nozzles contain a component called a diffuser, which has openings through which the pressurized spray is sprayed. In this process, a rotational velocity vector is generated in the fluid, which increases the pressure drop in the narrow zone between the diffuser and circular orifice disk [15], causing the spray to be sprayed in a spherical shape with fewer droplets in the center. The formation of smaller droplets by the hollow cone nozzles makes the application more prone to drift but tends to provide better coverage on the target.
There is limited research data regarding the performance of UAVs as an application technology in the agricultural regions of Brazil. Such studies are fundamental for achieving effective and safe aerial applications of agricultural products. Martin et al. [16] reported that research data comparing ground- and UAV-based sprayer applications are limited, and it is essential to characterize and compare the deposition and droplet spectra characteristics produced by the different application systems under field conditions to assess the viability of the technology.
In this context, we investigated soybean (Glycine max (L.) Merrill), which is considered one of the most important crops worldwide. The aim of this study was to evaluate the quality of aerial application of pesticides using a UAV on a soybean crop, employing different spray nozzles, and to compare it with ground application.
2. Materials and Methods
2.1. Experimental Site
The field experiment was conducted in a soybean field at the Federal University of Uberlândia (UFU) in the city of Uberlândia, Minas Gerais, Brazil. The coordinates of the location were 18°57′12″ S and 48°12′41″ W. The experiment was conducted in January 2023. The area has an average altitude of 867 m, and according to the Köppen classification, the characteristic climate of the region is humid tropical megathermal, that is, a tropical climate, characterized by hot and humid summers and cold and dry winters (Aw). The rainy season in summer runs from November to April, and the dry season in winter runs from May to October. The average monthly air temperature in this area varies between 20.9 and 23.1 °C. The average annual precipitation is 1500–1600 mm [17].
2.2. Cultivar
The field where the experiment was conducted was cultivated with the soybean variety “Pioneer 96y90”, which was sown on 24 October 2022. The inter-row spacing was set at 0.50 m, and the density of the plants was 160,000 hm−2. The plants had grown to an average height of 1.10 m on the day the application was made (Figure 1).
2.3. Experimental Unit, Equipment, and Treatments
The experimental area where applications were made using a UAV (Figure 2) consisted of three plots, with each measuring 50 m in length and 20 m in width. The plot that received the application using the CO2 pressurized knapsack sprayer was 40 m in length and 6 m in width. In each plot where the UAV was used for sampling, a 5.0 m section was disregarded on each of the side edges and at the ends along the length. In the plot where the ground application was used, a border effect was taken into account by disregarding 1.0 m on each border to ensure a constant speed of the sprayers. A 10 m distance was maintained between the plots as buffer zones. The aerial application working width was determined to be 4 m, based on the study conducted by [18], while the ground application working width was 2 m.
The replications of each treatment were positioned within each plot. When conducting an experiment using UAV, where the plots were typically larger in size, it was not feasible to perform repetitions in blocks. Therefore, this arrangement, which has been widely used by several other researchers [19,20,21], is justified and usual for this research field. Biglia et al. [22] reported that this facilitates the minimization of variation in environmental conditions between repetitions, thereby ensuring comparability of the acquired obtained data.
The application was performed during the reproductive phenological stage of early pod formation (R3) on 10 January 2023, which was 78 days after sowing (DAS). An AGRAS MG-1 (DJI, Shenzhen, China) UAV with eight engines (130 rpm/volt) was used for the application, as detailed in Table 1. Additionally, a CO2-pressurized knapsack sprayer, equipped with a boom containing four nozzles spaced 0.5 m apart, was used.
The following spray nozzles were used for the application: standard flat fans XR 11001 and XR 110015, both from Teejet Technologies (Glendale Heights, IL, USA), an AirMix 11001 air-induction flat fan from Agrotop Spray Technology (Obertraubling, Germany), and a COAP 9001 hollow cone spray from KGF (Vinhedo, Brazil).
For the UAV, the travel speed was 20.4 km h−1, the application rate was 10 L hm−2, and the flight height was 2.0 m. For the ground spraying, the working pressure was 100 kPa, the travel speed was 4.0 km h−1, the application rate was 100 L hm−2, and the working height was 0.5 m above the top of the plants.
During the experiment, the meteorological conditions in the area were as follows: an average relative humidity of 75.8%, average air temperature of 29.6 °C, and average wind speed of 2.2 km h−1, which were measured using a portable digital thermo-hygrometer, model KR825 from AKROM (São Leopoldo, Brazil).
The experiment was conducted using a completely randomized design with one factor (nozzle/application method), resulting in four treatments (nozzle XR 11001, AirMix 11001 nozzle, COAP 9001, and XR 110015) and eight repetitions, as shown in Table 2.
2.4. Evaluations
2.4.1. Deposition
The deposition on the crop was measured by adding a tracer to the spray. Brilliant Blue food dye (0.5 kg hm−2), which has been internationally cataloged as Food, Drug, and Cosmetic (FD&C) Blue No. 1, was used as the tracer. The spray consisted of water and dye. The UAV flight was carried out in a back-to-back manner (Figure 3).
After the application, samples were collected from the upper and lower parts of the plant. Ten leaves were randomly collected from each part of the plant (Figure 4), at eight different points per plot, while respecting the useful area. The leaves were stored in previously identified PVC bags, which were closed and placed in containers equipped with thermal and light insulation. They were then transported to the laboratory where subsequent analyses were performed.
The leaf deposit was removed from the samples in the laboratory. To achieve this, 100 mL of deionized water was added to each plastic bag containing the samples. The plastic bags were then shaken on a pendular shaking table, model TE240/I Tecnal (Piracicaba, Brazil), at 250 rpm for 15 min to ensure complete homogenization and extraction of all the tracers in the samples.
The amount of dye was estimated from these extracted samples based on the absorbance values obtained using a Bioespectro (Curitiba, Brazil) spectrophotometer, model SP-220, equipped with a tungsten halogen vapor lamp and glass cuvettes with a 10 mm optical path. The wavelength used for measuring the blue color was 630 nm.
To calculate the deposition, the absorbance values were converted into tracer concentrations in μg L−1 using a calibration curve based on solutions with known tracer concentrations. The amount of tracer deposited was then determined by taking into account the quantity of extraction solution used to wash the leaves. Next, the mass of the tracer was divided by the leaf area, measured in cm2 for each sample (10 leaves per sample), to determine the deposition in μg cm−2. The leaf area was measured using a Licor LI 3100C leaf area meter (Lincoln, NE, USA).
2.4.2. Droplet Spectrum
The droplet spectrum produced by the spray was analyzed using 76 × 26 mm water-sensitive paper (an artificial collector that turns from yellow to blue on contact with water) from Syngenta (Basel, Switzerland). For this, two papers were used per plant, on the upper and lower parts, for each repetition (Figure 5a,b). Metal clips were used to attach the papers to the plants to simulate the appearance of a leaf.
Soon after their application in each plot, the collectors were collected and placed inside labeled paper envelopes, and then sealed to prevent humidity from coming into contact with them. The envelopes were then taken to the laboratory, where they were scanned and analyzed using the DropScope system from SprayX (São Carlos, Brazil), which is equipment exclusively used for this type of analysis.
The droplet characteristics were analyzed for coverage (%), droplet density (drops cm−2), volume median diameter (VMD, μm), relative amplitude (RA), and percentage of volume in droplets smaller than 100 µm (% < 100 μm).
2.5. Statistical Analysis
In this study, the assumptions of the linear model were assessed using the Shapiro–Wilk (W) test for the normality of the residuals, Levene’s (L) test for the homogeneity of variances, and the Durbin–Watson (DW) test for independence of the residuals. Once the requisite conditions for these variable assumptions were satisfied, an analysis of variance study was conducted using a completely randomized design with an unbalanced repetition for the droplet spectrum variables.
When the assumptions of the linear model were not met, data transformations were performed. When the assumptions were not met even after the transformation, non-parametric statistics, such as the Kruskal–Wallis test [24], were used, and the data position measure was represented by medians due to the non-normality.
Additionally, to assess the quality of spray deposition, from a statistical process control point of view, within each plot and ensure that it was within the acceptable variability, control charts were created using the statistical process control methodology [25]. The analysis was conducted for the upper and lower portions of the plant.
Individual measurements for each treatment were used to construct the individual control charts. For the control charts measuring the variability between two consecutive measurements, the moving range was used following Montgomery [25].
3. Results and Discussion
3.1. Spray Deposition
The average tracer deposition values for different nozzles are presented in Table 3. On the upper part of the plant, higher deposition values ranging from 1.728 to 3.693 μg cm−2 were observed as compared to the lower part, for which the values ranged from 0.264 to 0.788 μg cm−2. This difference was expected, mainly due to the reproductive stage of the crop (R3), at which time the plants have a higher leaf area index, which acts as a barrier to deposition in the lower part of the plant.
The application using a UAV resulted in a better performance on the upper part when using the COAP 9001 hollow cone spray and AirMix 11001 air-induction flat fan nozzle, with average depositions of 3.693 and 3.180 μg cm−2, respectively. In a similar study, Pergher and Zucchiatti [28], while evaluating the deposition on a grapevine canopy using a tunnel ground sprayer, found that the AVI 8002 air-induction flat fan nozzle (Albuz, Evreux, France) did not substantially improve the deposition compared to the Abbà 1035.015 green hollow cone spray nozzle (Abbà, Centallo, Italy), with an average deposition of 0.703 μL cm−2 and 0.709 μL cm−2. Alheidary [29], while studying different types of spray nozzles, found that the hollow cone spray nozzle resulted in the best deposition (0.06 μL cm−2) compared to other nozzle types (flat fan and air-induction flat fan) under the same operating conditions for ground application using a knapsack sprayer. Wang et al. [30] found that air-induction nozzles performed better than standard flat fan nozzles, in general, for boom sprayer application in terms of increased deposition. The authors believe that the increased deposition was related to a greater potential for drift reduction.
Higher deposition values were observed for applications with UAV on the lower part of the plant, indicating better penetration of the spray into the crop canopy, which can be explained by the downwash effect. This effect occurs due to the downward airflow generated by the rotors during the application, which can create a strong airflow field toward the plants, potentially leading to effective deposition on the crop [31]. Lan et al. [32] noted that the average deposition decreased when the flight height increased due to the weakening of the downwash effect in the Z direction, resulting in decreased droplet deposition in the effective spray area.
Wang et al. [21], while evaluating the application at different rates, observed that the use of a high volume (450 L hm−2) led to a decrease in the deposition on wheat ears during ground application. They found that more than 38% of the spray was lost to the ground. When the application was performed using a UAV, losses to the ground ranged from 5.0% to 12.6%, with application rates of 9, 16.8, and 28.1 L hm−2. Xiao et al. [33] observed a higher deposition with UAV at 1.01 μg cm−2, which was 98% higher than that using an electric knapsack sprayer.
The results of this research demonstrate that it is possible to reduce the application rate without decreasing the spray deposition. The application rate was 10 L hm−2 and 100 L hm−2 for the UAV and ground-based applications, respectively. According to Machado et al. [34], a reduction in the application rate is associated with certain advantages such as reduced costs and an optimized process. Sun [35] describes that UAVs apply a small amount of spray at a high concentration of pesticide, due to the reduced application rate, taking less time to transport water for preparing the spray, to apply the pesticides, and to wash the tank.
Control charts can be used for the detection and identification of problems in processes. Their significance primarily stems from the ability to enhance quality and optimize procedures and techniques [36]. The process is statistically under control when only common causes of variation are present. In the absence of common causes of variation, the process is out of control, and causes of variation must be investigated and addressed to improve the process [37]. Achieving stability, specifically when it is under control, is a crucial element in meeting the expectations of what is anticipated as a response to the process [38].
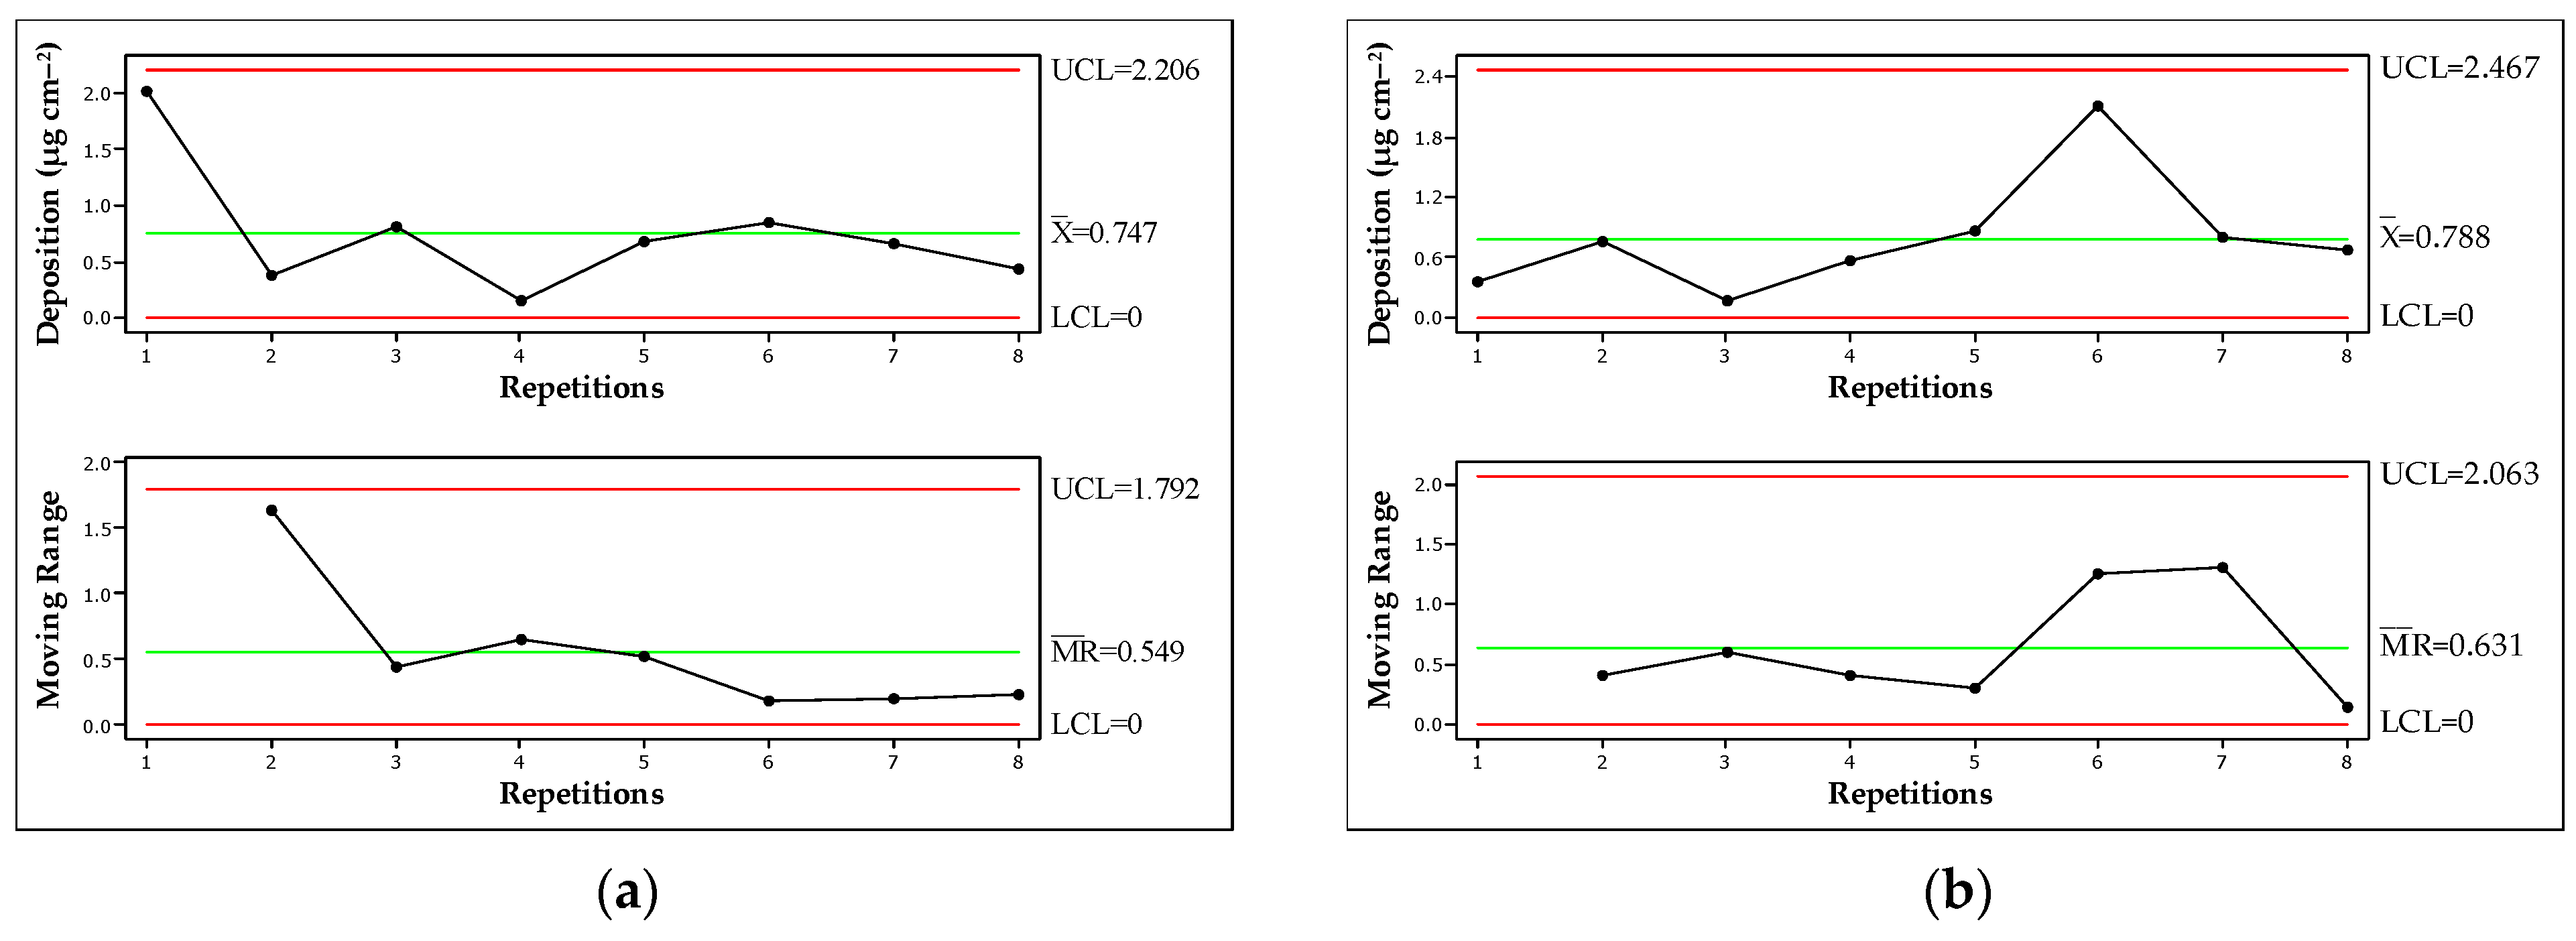
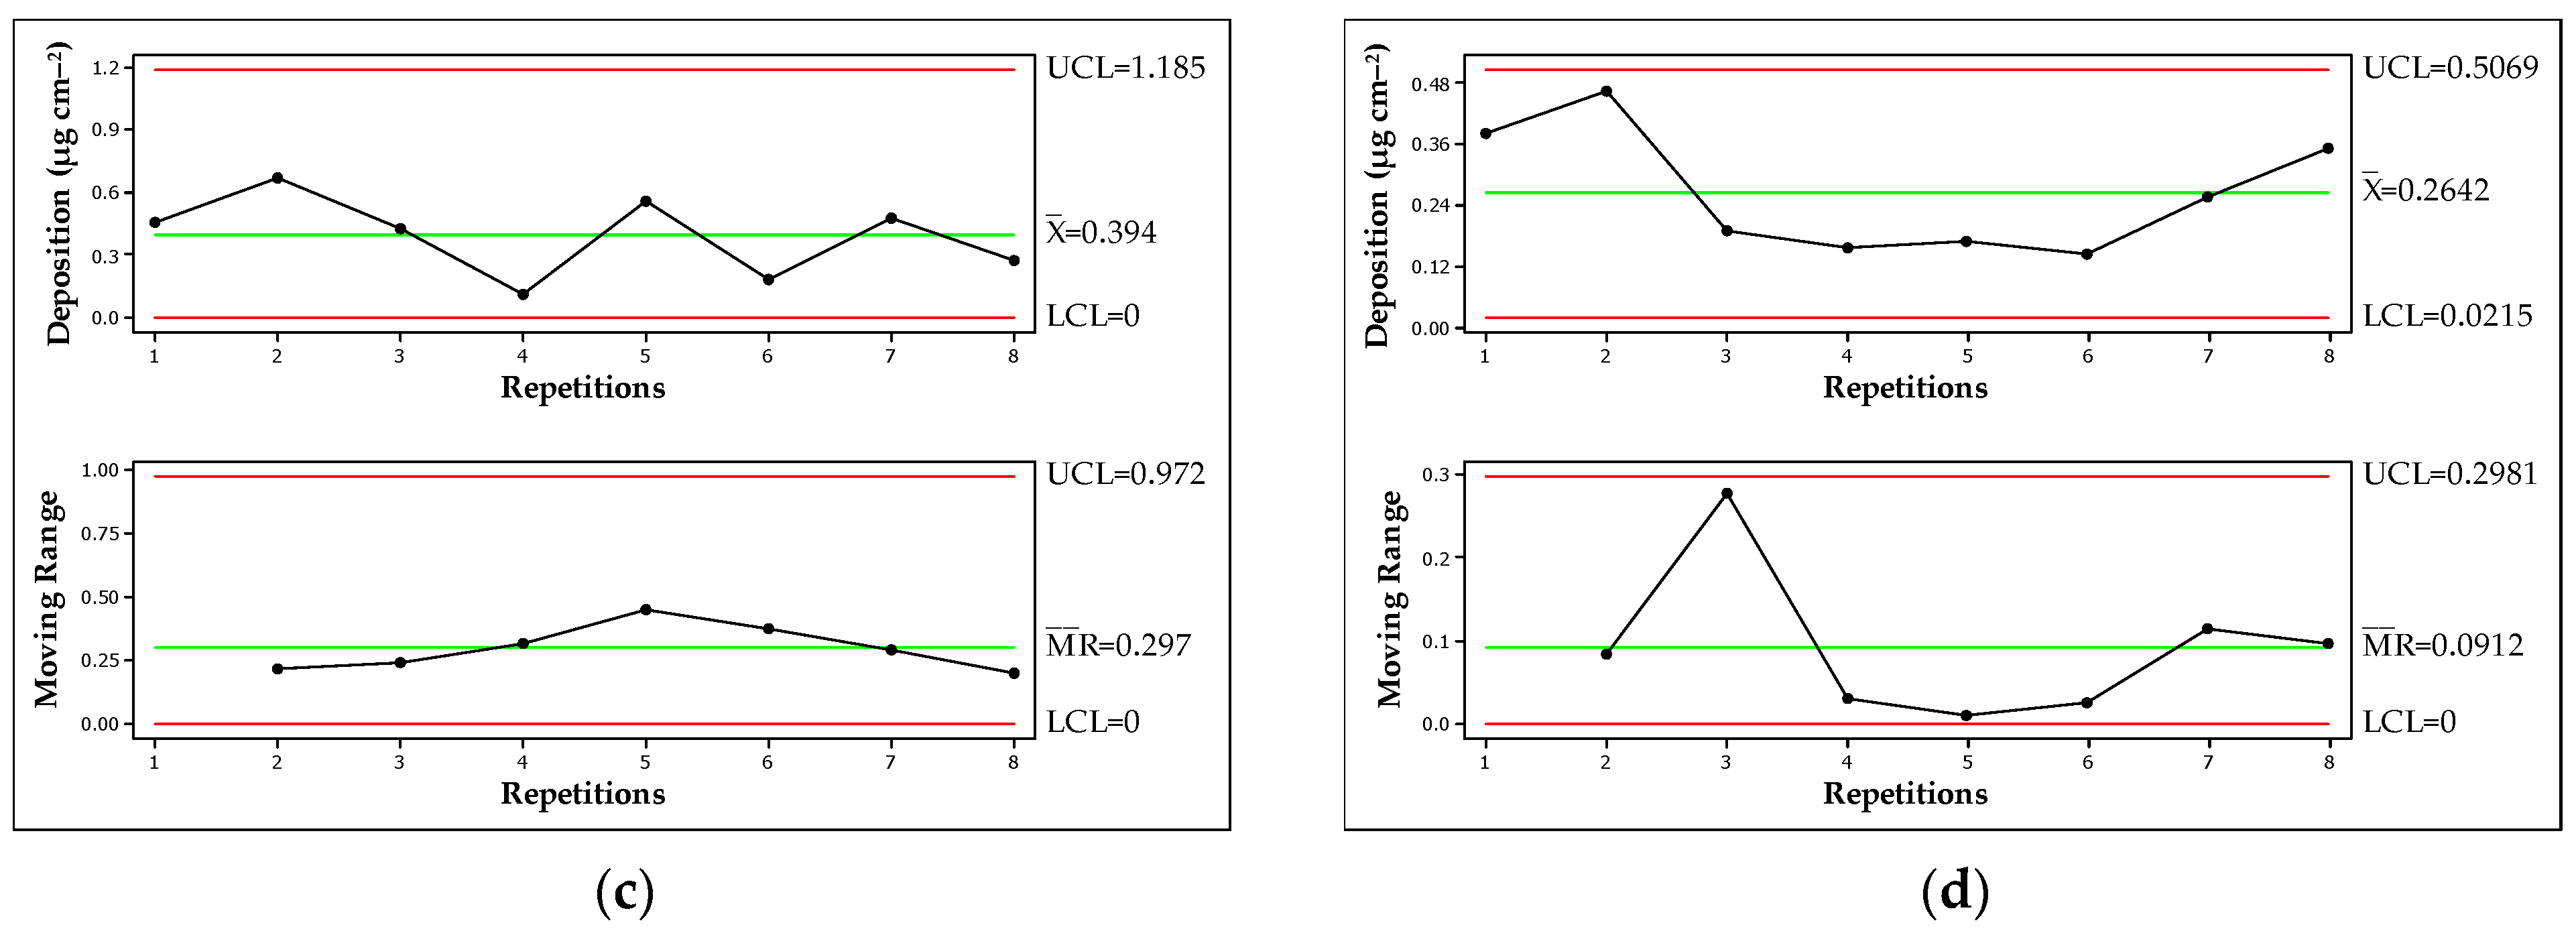
Figure 6 and Figure 7 show the control charts for the deposition on the upper and lower parts of the plant, respectively. These charts are based on the values obtained for each treatment. Regardless of the type of nozzle or application technique used, no patterns of non-randomness were observed. The deposition values obtained for the repetitions fell within the upper and lower control limits, indicating common causes of randomness in variation relative to the process mean value. It is important to note that the deposition on the target must be of high quality to ensure that the investment in the application effectively controls pests or diseases, thereby maximizing crop production.
The application on the upper part of the soybean plant using the COAP 9001 hollow cone spray nozzle (Figure 6a) showed the highest amplitude of deposition data. In repetition 8, the value was 6.057 μg cm−2, and in repetition 3, the deposition value was 1.604 μg cm−2, showing a difference of 4.453 μg cm−2. Even with this range, the values remained within the upper (8.630 μg cm−2) and lower (0 μg cm−2) limits. The application using the flat fan nozzle XR 11001 via UAV (Figure 6c) resulted in less variation, with values ranging from 0.853 to 2.560 μg cm−2; it also showed a lower average deposition of 1.728 μg cm−2, thus showing greater stability but providing lower average on-target deposition, despite being under statistical control.
On the lower part of the plant, the greatest variation among the treatments was observed upon the application using the AirMix 11001 air-induction flat fan nozzle via UAV (Figure 7b), where deposition ranged from 2.118 to 0.116 μg cm−2. The same probe also showed the highest average deposition value of 0.788 μg cm−2. Therefore, it is not the nozzle with the greatest uniformity of deposition, but rather the one with the highest average.
It is important to note that even if the process is under control, one must pay attention to the observed values, as these values indicate the quality of the application by revealing the amount of product reaching the target. Similar to this study, Nascimento et al. [39] found that regardless of the types of nozzles evaluated, a greater deposition was observed on the upper part of the soybean plant during the R4 phenological stage.
In pesticide application technology, research using statistical process control remains scarce. Silva et al. [40], while studying airblast sprayers on coffee crops using different nozzles and application rates, observed that deposition was under statistical process control, as was also observed in the current study. Soela et al. [41] conducted a study using statistical process control to evaluate the use of a UAV for spraying in the Conilon coffee crop. In this work, no non-random patterns were found within the treatments (flight height and coffee genotypes), resulting in efficient applications on the crop.
3.2. Droplet Spectrum
The values of the droplet spectrum are listed in Table 4. The coverage was the highest on both the upper and lower parts of the plant when using the XR 110015 flat fan nozzle for ground application. The applications made using the UAV did not show any statistical difference. Therefore, increasing the volume of the application can considerably improve the coverage. Martin et al. [16] also observed greater coverage when using the ground sprayer, with an application rate of 140 L hm−2, compared to the UAV application, with rates of 18.7 and 37.4 L hm−2. This indicates that the amount of spray applied has a significant impact on the coverage.
Ribeiro et al. [42], while evaluating the droplet spectrum for application via UAV on papaya crops using different nozzles (XR 110015 flat fan and MGA015 hollow cone spray), found that the XR 110015 nozzle provided the best coverage on the upper and middle thirds, regardless of the volume of spray applied. This indicates the good performance of this nozzle in terms of coverage, as was also observed in the current study.
Qi et al. [43], when performing the application using a UAV in pear orchards, found coverage values below 3.00% with a range of 0.66–2.67%. These values were obtained for different application rates (60, 75, and 90 L hm−2), flight heights (4.5, 5.0, and 5.5 m), travel speeds (1.5, 2.0, and 2.5 m s−1), and flight direction (parallel or perpendicular to the crop planting line). Cunha et al. [44] reported the difficulty in achieving good target coverage for applications with a UAV. Greater coverage results in greater ease in reaching the target. However, if the target is reached, an application with a low rate results in pesticide efficiency, as the spray contains the most concentrated product.
Corroborating the coverage data, the droplet density on the upper part of the soybean plant was the highest for the ground application using the XR 110015 flat fan nozzle, with 47.48 droplets cm−2, which is more than three times the amount observed for the other applications. The lower part had a lower droplet density per target area compared to the upper part. Additionally, the COAP 9001 and XR 11001 nozzles statistically performed the same as the XR 110015 nozzle. This result was consistent with the findings of the study conducted by Xiao et al. [33], who found that the droplet density values showed a reduction on the lower parts of pepper plants, with 34.91 droplets cm−2 on the upper third, 23.03 droplets cm−2 on the middle third, and 15.06 droplets cm−2 on the lower third for application via UAV and an application rate of 15 L hm−2. Sun et al. [45] observed the same trend using a UAV in the wheat flowering stage, wherein the droplet density in the lower layers decreased in relation to the upper layers.
The coverage and droplet density data should be assessed with caution, as described by Cunha and Silva [18]. This is because these data are obtained using water-sensitive paper, which tends to overestimate the applications with higher application rates, such as ground application, compared to those with lower rates, such as application via UAV, wherein spray concentration is not considered.
The size of the droplets sprayed during the application is determined using the volumetric median diameter (VMD). On the upper part of the plant, the size of the droplets varied depending on the nozzles used during the application. The XR 110015 flat fan nozzle, used with the ground sprayer, produces fine droplets, as stated in the manufacturer’s catalog. The nozzle’s classification is based on BCPC specifications and conforms with the ASABE S572.1 standard [46]. However, a VMD range of 301.40–354.62 μm was found on the upper and lower parts. These diameters fall into the medium and coarse categories [46]. The height at which the flight occurred may have had an impact on the size of the droplets. Guo et al. [47] reported that the droplets disperse more with an increase in application height. The smaller droplets move away from the spray jet due to reduced droplet velocity and drag airflow; this indicates that the smaller droplets are carried away from the spray jet, resulting in an overall increase in the VMD. These authors observed that the VMD value increased with increasing flight heights (1.0, 1.5, and 2.0 m) when evaluating the XR 110015 nozzle.
The AirMix 11001 air-induction flat fan nozzle did not show significant differences compared to the XR 110015 nozzle. It produced medium-sized droplets with a VMD of 270.97 μm on the upper part and 271.99 μm on the lower part. According to the manufacturer’s catalog, this nozzle produces a medium to fine droplet spectrum, which generally differs from other air-induction nozzles. The XR 11001 flat fan nozzle exhibited a VMD of 178.18 μm on the upper part and 210.81 μm on the lower part, indicating a classification of fine droplets. The COAP 9001 hollow cone spray nozzle produced fine-class droplets, with an average VMD of 166.35 μm on the upper part and 232.57 μm on the lower part.
An increase in VMD values on the lower part of the plant was observed for all the nozzles compared to those on the upper part. This indicates that larger droplets were able to penetrate the canopy more easily. This trend was also observed by Dengeru et al. [48], who applied an insecticide via UAV to a guandu (Cajanus cajan L. Millsp.) crop. With ground spraying, smaller droplets may provide better penetration than larger droplets because larger droplets fall faster due to gravity. These larger droplets reach the surface of the crop more quickly and can be deposited easily on the upper part unless there is runoff, and those larger droplets move into the canopy. However, when applying pesticides via UAV, the generated downwash can increase the speed of droplet deposition and cause leaves to move. This results in a greater number of larger droplets, which fall faster, reaching the lower parts of the plant within the action field of the rotor’s air current [49,50,51,52]. In this lower layer, no significant difference was observed between the nozzles, indicating that they had the same droplet size characteristics inside the crop canopy.
The relative amplitude (RA) is an index that indicates the uniformity in droplet size. Values closer to zero refer to the most homogeneous spectrum. We observed a significant difference on the upper part of the plant, with RA ranging from 0.64–1.09. The nozzles used in the UAV application did not show any statistical differences among them. On the lower part, no significant difference between the treatments was observed, with values ranging from 0.37–0.77.
Regardless of the evaluated plant part, the XR 110015 and AirMix 11001 flat fan nozzles showed less potential for drift due to their lower percentages of droplets smaller than 100 μm, which are more likely to drift. The XR 110015 nozzle was used for the ground application with a knapsack sprayer, which exposes the operator to a higher quantity of pesticides. In contrast, the aerial method via UAV sprays the pesticide without requiring the operator to enter the field, thereby eliminating the risk of exposure for the operator [53]. Based on experimental findings, it is recommended to use the AirMix 11001 nozzle when the objective is to reduce the potential drift. Wang et al. [30] observed that air-induction nozzles considerably reduce the amount of drift compared to conventional flat fan nozzles; this is of great relevance for environmental protection. The lower production of fine droplets occurs because the spray is mixed with air that enters through the nozzle orifices, resulting in droplets with air bubbles as well as a larger droplet size.
Regarding drift, smaller droplets tend to lose their kinetic energy after being released. This increases their suspension in the air, making them more easily directed away from the target by the air currents [54]. Liu et al. [55] agree with these findings by describing how the velocity of the finest droplets decays faster to its final velocity over a very short distance compared to the coarser droplets. Consequently, their residence time in the air is different, which affects the spray drift. Additionally, under extremely stable environmental conditions, temperature inversions can occur, in which the air closer to the soil or crop surface may be colder than the air further above. This can slow the droplet fall, making the droplets more susceptible to drift [56].
4. Conclusions
The highest spray deposition on the upper part of the soybean crop was achieved with the AirMix 11001 air-induction flat fan nozzle and COAP 9001 hollow cone spray when the applications were performed using the UAV. The deposition was even higher when using the COAP 9001 than that obtained with the ground application. On the lower part of the plant, the deposition with the UAV stood out, indicating greater penetration of the spray into the crop canopy compared to the ground application. Based on the process control charts for spray deposition under various operational conditions, no non-random behavior was observed, indicating a consistent and high-quality pattern from a statistical perspective.
The coverage on the upper and lower parts of the plant, as well as the droplet density on the upper part, was higher when using the XR 110015 flat spray nozzle for ground application, as the application rate was higher. With the use of the UAV, the coverage was less than 1%, which should be taken into account when planning the applications.
When considering the applications using the UAV, the AirMix 11001 air-induction flat fan nozzle had the lowest percentage of droplets smaller than 100 μm, which reduced the potential for drift.
Although the results show the potential of the UAV for crop protection, future studies with the application of pesticides to crops to evaluate disease and pest control using this technology would be interesting, given the lower coverage obtained.
Author Contributions
Conceptualization, L.d.L.L. and J.P.A.R.d.C.; methodology, L.d.L.L., J.P.A.R.d.C. and Q.S.S.N.; software, L.d.L.L., J.P.A.R.d.C. and Q.S.S.N.; formal analysis, L.d.L.L., J.P.A.R.d.C. and Q.S.S.N.; writing—review and editing, L.d.L.L. and J.P.A.R.d.C.; supervision, J.P.A.R.d.C. All authors have read and agreed to the published version of the manuscript.
Funding
This research was partially funded by Coordenação de Aperfeiçoamento de Pessoal de Nível Superior—Brasil (CAPES)—Finance Code 001, Fundação de Amparo a Pesquisa do Estado de Minas Gerais—Brazil (FAPEMIG)—APQ-00241-21, and Conselho Nacional de Desenvolvimento Científico e Tecnológico—Brazil (CNPq)—311371/2021-3.
Data Availability Statement
Data are contained within the article.
Conflicts of Interest
The authors declare no conflict of interest.
References
- Fang, C.; Kong, F. Soybean. Curr. Biol. 2022, 32, R902–R904. [Google Scholar] [CrossRef] [PubMed]
- Hoffmann, L.L.; Boller, W.; Forcelini, C.A. Fungicide Spraying Programs Reducing Asian Soybean Rust Impact on Soybean Yield Components. J. Agric. Sci. 2022, 14, 40. [Google Scholar] [CrossRef]
- Zhang, H.; Chandio, A.A.; Yang, F.; Tang, Y.; Ankrah Twumasi, M.; Sargani, G.R. Modeling the Impact of Climatological Factors and Technological Revolution on Soybean Yield: Evidence from 13-Major Provinces of China. Int. J. Environ. Res. Public Health 2022, 19, 5708. [Google Scholar] [CrossRef] [PubMed]
- Silva, L.L.; Baptista, F.; Cruz, V.F.; Silva, J.R.M. da Aumentar as competências dos agricultores para a prática de uma agricultura sustentável. Rev. Ciênc. Agron. 2020, 43, 240–252. [Google Scholar] [CrossRef]
- Gugan, G.; Haque, A. Path Planning for Autonomous Drones: Challenges and Future Directions. Drones 2023, 7, 169. [Google Scholar] [CrossRef]
- Martin, D.E.; Rodriguez, R.; Woller, D.A.; Reuter, K.C.; Black, L.R.; Latheef, M.A.; Taylor, M.; López Colón, K.M. Insecticidal Management of Rangeland Grasshoppers Using a Remotely Piloted Aerial Application System. Drones 2022, 6, 239. [Google Scholar] [CrossRef]
- Wang, Z.; Hussain, M.; Yin, J.; Yuan, M.; Mo, Y.; Quan, M.; Duan, L.; Tan, W. Analysis of Droplet Deposition and Maize (Zea mays L.) Growth Control: Application of Ethephon by Small Unmanned Aerial Vehicle and Electric Knapsack Sprayer. Field Crops Res. 2023, 292, 108822. [Google Scholar] [CrossRef]
- Da Cunha, J.P.A.R.; Marques, R.S.; Alves, G.S. Deposição da calda na cultura da soja em função de diferentes pressões de trabalho e pontas de pulverização. Rev. Ceres 2016, 63, 761–768. [Google Scholar] [CrossRef]
- Negrisoli, M.M.; de Souza, D.M.; Rodrigues, D.M.; de Jesus, P.J.; Raetano, C.G. Effect of Angled Spray Nozzle Designs on Spray Distribution and Droplet Spectrum. Rev. Ciênc. Agron. 2021, 52, e20197043. [Google Scholar] [CrossRef]
- Sayinci, B.; Demir, B.; Acik, N. Comparison of Spray Nozzles in Terms of Spray Coverage and Drop Distributionuniformity at Low Volume. Turk. J. Agric. For. 2020, 44, 262–270. [Google Scholar] [CrossRef]
- Cerruto, E.; Manetto, G.; Papa, R.; Longo, D. Modelling Spray Pressure Effects on Droplet Size Distribution from Agricultural Nozzles. Appl. Sci. 2021, 11, 9283. [Google Scholar] [CrossRef]
- Dafsari, R.A.; Yu, S.; Choi, Y.; Lee, J. Effect of Geometrical Parameters of Air-Induction Nozzles on Droplet Characteristics and Behaviour. Biosyst. Eng. 2021, 209, 14–29. [Google Scholar] [CrossRef]
- Vallet, A.; Tinet, C. Characteristics of Droplets from Single and Twin Jet Air Induction Nozzles: A Preliminary Investigation. Crop Prot. 2013, 48, 63–68. [Google Scholar] [CrossRef]
- Makhnenko, I.; Alonzi, E.R.; Fredericks, S.A.; Colby, C.M.; Dutcher, C.S. A Review of Liquid Sheet Breakup: Perspectives from Agricultural Sprays. J. Aerosol Sci. 2021, 157, 105805. [Google Scholar] [CrossRef]
- Singh, A.K. System of Mathematical Equations to Predict Wear Rate on Circular-Cone Orifice of Pesticide Spray Nozzles. Int. J. Precis. Agric. Aviat. 2019, 2, 76–80. [Google Scholar]
- Martin, D.; Singh, V.; Latheef, M.A.; Bagavathiannan, M. Spray Deposition on Weeds (Palmer Amaranth and Morningglory) from a Remotely Piloted Aerial Application System and Backpack Sprayer. Drones 2020, 4, 59. [Google Scholar] [CrossRef]
- De Azevedo Silva Rodrigues, E.; do Carmo Lima, S. Associação entre a incidência do levantamento de índice rápido de Aedes Aegypti (Liraa) e as condições climáticas em uberlândia, Minas Gerais, Brasil, entre 2014 A 2016. Caminhos Geogr. 2019, 20, 251–263. [Google Scholar] [CrossRef]
- Da Cunha, J.P.A.R.; da Silva, M.R.A. Spray Deposition from a Remotely Piloted Aircraft on the Corn Crop. Rev. Ciênc. Agron. 2023, 54, e20217862. [Google Scholar] [CrossRef]
- Chen, P.; Ouyang, F.; Wang, G.; Qi, H.; Xu, W.; Yang, W.; Zhang, Y.; Lan, Y. Droplet Distributions in Cotton Harvest Aid Applications Vary with the Interactions among the Unmanned Aerial Vehicle Spraying Parameters. Ind. Crops Prod. 2021, 163, 113324. [Google Scholar] [CrossRef]
- Meng, Y.; Lan, Y.; Mei, G.; Guo, Y.; Song, J.; Wang, Z. Effect of Aerial Spray Adjuvant Applying on the Efficiency of Small Unmanned Aerial Vehicle for Wheat Aphids Control. Int. J. Agric. Biol. Eng. 2018, 11, 46–53. [Google Scholar] [CrossRef]
- Wang, G.; Lan, Y.; Qi, H.; Chen, P.; Hewitt, A.; Han, Y. Field Evaluation of an Unmanned Aerial Vehicle (UAV) Sprayer: Effect of Spray Volume on Deposition and the Control of Pests and Disease in Wheat. Pest Manag. Sci. 2019, 75, 1546–1555. [Google Scholar] [CrossRef]
- Biglia, A.; Grella, M.; Bloise, N.; Comba, L.; Mozzanini, E.; Sopegno, A.; Pittarello, M.; Dicembrini, E.; Alcatrão, L.E.; Guglieri, G.; et al. UAV-Spray Application in Vineyards: Flight Modes and Spray System Adjustment Effects on Canopy Deposit, Coverage, and off-Target Losses. Sci. Total Environ. 2022, 845, 157292. [Google Scholar] [CrossRef] [PubMed]
- DJI. AGRAS MG-1 User Manual. V. 1.2 2016; DJI: Shenzhen, China, 2016; Available online: https://dl.djicdn.com/downloads/mg-1/en/MG-1_User_Manual_en_v1.2.pdf (accessed on 18 August 2023).
- De Morais, A.R. Estatística Experimental: Uma Introdução Aos Delineamentos e Análise de Experimentos; UFLA: Lavras, Brazil, 2001; p. 197. [Google Scholar]
- Montgomery, D.C. Introdução Ao Controle Estatístico Da Qualidade, 7th ed.; LTC: Rio de Janeiro, Brazil, 2017; p. 528. [Google Scholar]
- R Core Team. The R Foundation for Statistical Computing Platform 2020; R Foundation for Statistical Computing: Vienna, Austria, 2020; Available online: https://www.r-project.org (accessed on 3 October 2023).
- Minitab 16, Statistical Software; Minitab, Inc.: State College, PA, USA, 2010.
- Pergher, G.; Zucchiatti, N. Influence of Canopy Development in the Vineyard on Spray Deposition from a Tunnel Sprayer. J. Agric. Eng. 2018, 49, 164–173. [Google Scholar] [CrossRef]
- Alheidary, M.H.R. Influence of nozzle type, working pressure, and their interaction on droplets quality using knapsack sprayer. Iraqi J. Agric. Sci. 2019, 50, 857–866. [Google Scholar] [CrossRef]
- Wang, S.; Li, X.; Nuyttens, D.; Zhang, L.; Liu, Y.; Li, X. Evaluationof Compact Air-Induction Flat Fan Nozzles for Herbicide Applications: Spray Drift and Biological Efficacy. Front. Plant Sci. 2023, 14, 1018626. [Google Scholar] [CrossRef]
- Yang, S.; Zheng, Y.; Liu, X. Research Status and Trends of Downwash Airflow of Spray UAVs in Agriculture. Int. J. Precis. Agric. Aviat. 2019, 2, 1–8. [Google Scholar] [CrossRef]
- Lan, Y.; Qian, S.; Chen, S.; Zhao, Y.; Deng, X.; Wang, G.; Zang, Y.; Wang, J.; Qiu, X. Influence of the Downwash Wind Field of Plant Protection UAV on Droplet Deposition Distribution Characteristics at Different Flight Heights. Agronomy 2021, 11, 2399. [Google Scholar] [CrossRef]
- Xiao, Q.; Du, R.; Yang, L.; Han, X.; Zhao, S.; Zhang, G.; Fu, W.; Wang, G.; Lan, Y. Comparison of Droplet Deposition Control Efficacy on Phytophthora Capsica and Aphids in the Processing Pepper Field of the Unmanned Aerial Vehicle and Knapsack Sprayer. Agronomy 2020, 10, 215. [Google Scholar] [CrossRef]
- Machado, W.A.; Silva, S.M.; Carvalho, S.M.; da Cunha, J.P.A.R. Effect of Nozzles, Application Rates, and Adjuvants on Spray Deposition in Wheat Crops. Eng. Agríc. 2019, 39, 83–88. [Google Scholar] [CrossRef]
- Sun, W. Labor-Saving Control Technology Using Multicopters in Mountainous Areas. NARO Tech. Rep. 2020, 5, 30–33. [Google Scholar]
- Mammadova, U.; Özkale, M.R. Profile Monitoring for Count Data Using Poisson and Conway–Maxwell–Poisson Regression-Based Control Charts under Multicollinearity Problem. J. Comput. Appl. Math. 2021, 388, 113275. [Google Scholar] [CrossRef]
- Rakitzis, A.C.; Chakraborti, S.; Shongwe, S.C.; Graham, M.A.; Khoo, M.B.C. An Overview of Synthetic-Type Control Charts: Techniques and Methodology. Qual. Reliab. Eng. Int. 2019, 35, 2081–2096. [Google Scholar] [CrossRef]
- Özdemir, A. Development of Fuzzy X-S Control Charts with Unbalanced Fuzzy Data. Soft Comput. 2021, 25, 4015–4025. [Google Scholar] [CrossRef]
- Nascimento, R.S.M.; Ferreira, L.R.; Zambolim, L.; Parreira, D.F.; Oliveira, P.L.D.S.; Moraes, R.G.S. Influence of Spraying Tips on the Efficiency of Chemical Control of Soybean Rust. Crop Prot. 2022, 160, 106031. [Google Scholar] [CrossRef]
- Da Silva, J.E.R.; da Cunha, J.P.A.R.; Nomelini, Q.S.S. Controle estatístico de processo em pulverização hidropneumática na cultura do café. Coffee Sci. 2016, 43, 11–21. [Google Scholar]
- Soela, D.M.; da Vitória, E.L.; de Oliveira, R.F.; Crause, D.H.; de Jesu s Freitas, I.L.; Locatelli, T. Controle estatístico de processo em pulverização usando veículo aéreo não tripulado na cultura do café conilon. Braz. J. Prod. Eng. 2020, 6, 52–63. [Google Scholar]
- Ribeiro, L.F.O.; da Vitória, E.L.; Soprani Júnior, G.G.; Chen, P.; Lan, Y. Impact of Operational Parameters on Droplet Distribution Using an Unmanned Aerial Vehicle in a Papaya Orchard. Agronomy 2023, 13, 1138. [Google Scholar] [CrossRef]
- Qi, P.; Zhang, L.; Wang, Z.; Han, H.; Müller, J.; Li, T.; Wang, C.; Huang, Z.; He, M.; Liu, Y.; et al. Effect of Operational Parameters of Unmanned Aerial Vehicle (UAV) on Droplet Deposition in Trellised Pear Orchard. Drones 2023, 7, 57. [Google Scholar] [CrossRef]
- Da Cunha, J.P.A.R.; de Alvarenga, C.B.; Rinaldi, P.C.N.; Marques, M.G.; Zampiroli, R. Use of remotely piloted aircrafts for the application of plant protection products. Eng. Agríc. 2021, 41, 245–254. [Google Scholar] [CrossRef]
- Sun, T.; Zhang, S.; Xue, X.; Jiao, Y. Comparison of Droplet Distribution and Control Effect of Wheat Aphids under Different Operation Parameters of the Crop Protection UAV in the Wheat Flowering Stage. Agronomy 2022, 12, 3175. [Google Scholar] [CrossRef]
- ASABE S572.1; Droplet Size Classification. ASABE: St. Joseph, MI, USA, 2009.
- Guo, H.; Zhou, J.; Liu, F.; He, Y.; Huang, H.; Wang, H. Application of Machine Learning Method to Quantitatively Evaluate the Droplet Size and Deposition Distribution of the UAV Spray Nozzle. Appl. Sci. 2020, 10, 1759. [Google Scholar] [CrossRef]
- Dengeru, Y.; Ramasamy, K.; Allimuthu, S.; Balakrishnan, S.; Kumar, A.P.M.; Kannan, B.; Karuppasami, K.M. Study on Spray Deposition and Drift Characteristics of UAV Agricultural Sprayer for Application of Insecticide in Redgram Crop (Cajanus cajan L. Millsp.). Agronomy 2022, 12, 3196. [Google Scholar] [CrossRef]
- Chen, S.; Lan, Y.; Bradley, K.F.; Li, J.; Liu, A.; Mao, Y. Effect of Wind Field below Rotor on Distribution of Aerial Spraying Droplet Deposition by Using Multi-rotor UAV. Nongye Jixie Xuebao/Trans. Chin. Soc. Agric. Mach. 2017, 48, 105–113. [Google Scholar]
- Chen, S.; Lan, Y.; Zhou, Z.; Ouyang, F.; Wang, G.; Huang, X.; Deng, X.; Cheng, S. Effect of Droplet Size Parameters on Droplet Deposition and Drift of Aerial Spraying by Using Plant Protection UAV. Agronomy 2020, 10, 195. [Google Scholar] [CrossRef]
- Ferguson, J.C.; Chechetto, R.G.; Hewitt, A.J.; Chauhan, B.S.; Adkins, S.W.; Kruger, G.R.; O’Donnell, C.C. Assessing the Deposition and Canopy Penetration of Nozzles with Different Spray Qualities in an Oat (Avena sativa L.) Canopy. Crop Prot. 2016, 81, 14–19. [Google Scholar] [CrossRef]
- Fritz, B.K.; Hoffmann, W.C.; Lan, Y.B. Evaluation of the EPA Drift Reduction Technology (DRT) Low-Speed Wind Tunnel Protocol. J. ASTM Int. 2009, 6, 183–191. [Google Scholar] [CrossRef]
- Wang, G.; Han, Y.; Li, X.; Andaloro, J.; Chen, P.; Hoffmann, W.C.; Han, X.; Chen, S.; Lan, Y. Field Evaluation of Spray Drift and Environmental Impact Using an Agricultural Unmanned Aerial Vehicle (UAV) Sprayer. Sci. Total Environ. 2020, 737, 139793. [Google Scholar] [CrossRef]
- Ahmad, F.; Qiu, B.; Dong, X.; Ma, J.; Huang, X.; Ahmed, S.; Ali Chandio, F. Effect of Operational Parameters of UAV Sprayer on Spray Deposition Pattern in Target and Off-Target Zones during Outer Field Weed Control Application. Comput. Electron. Agric. 2020, 172, 105350. [Google Scholar] [CrossRef]
- Liu, Q.; Chen, S.; Wang, G.; Lan, Y. Drift Evaluation of a Quadrotor Unmanned Aerial Vehicle (UAV) Sprayer: Effect of Liquid Pressure and Wind Speed on Drift Potential Based on Wind Tunnel Test. Appl. Sci. 2021, 11, 7258. [Google Scholar] [CrossRef]
- Hunter, J.E.; Gannon, T.W.; Richardson, R.J.; Yelverton, F.H.; Leon, R.G. Coverage and drift potential associated with nozzle and speed selection for herbicide applications using an unmanned aerial sprayer. Weed Technol. 2020, 34, 235–240. [Google Scholar] [CrossRef]
Figure 1.
Experimental field with soybean crop (Pioneer 96y90 cultivar).

Figure 2.
Experimental setup.
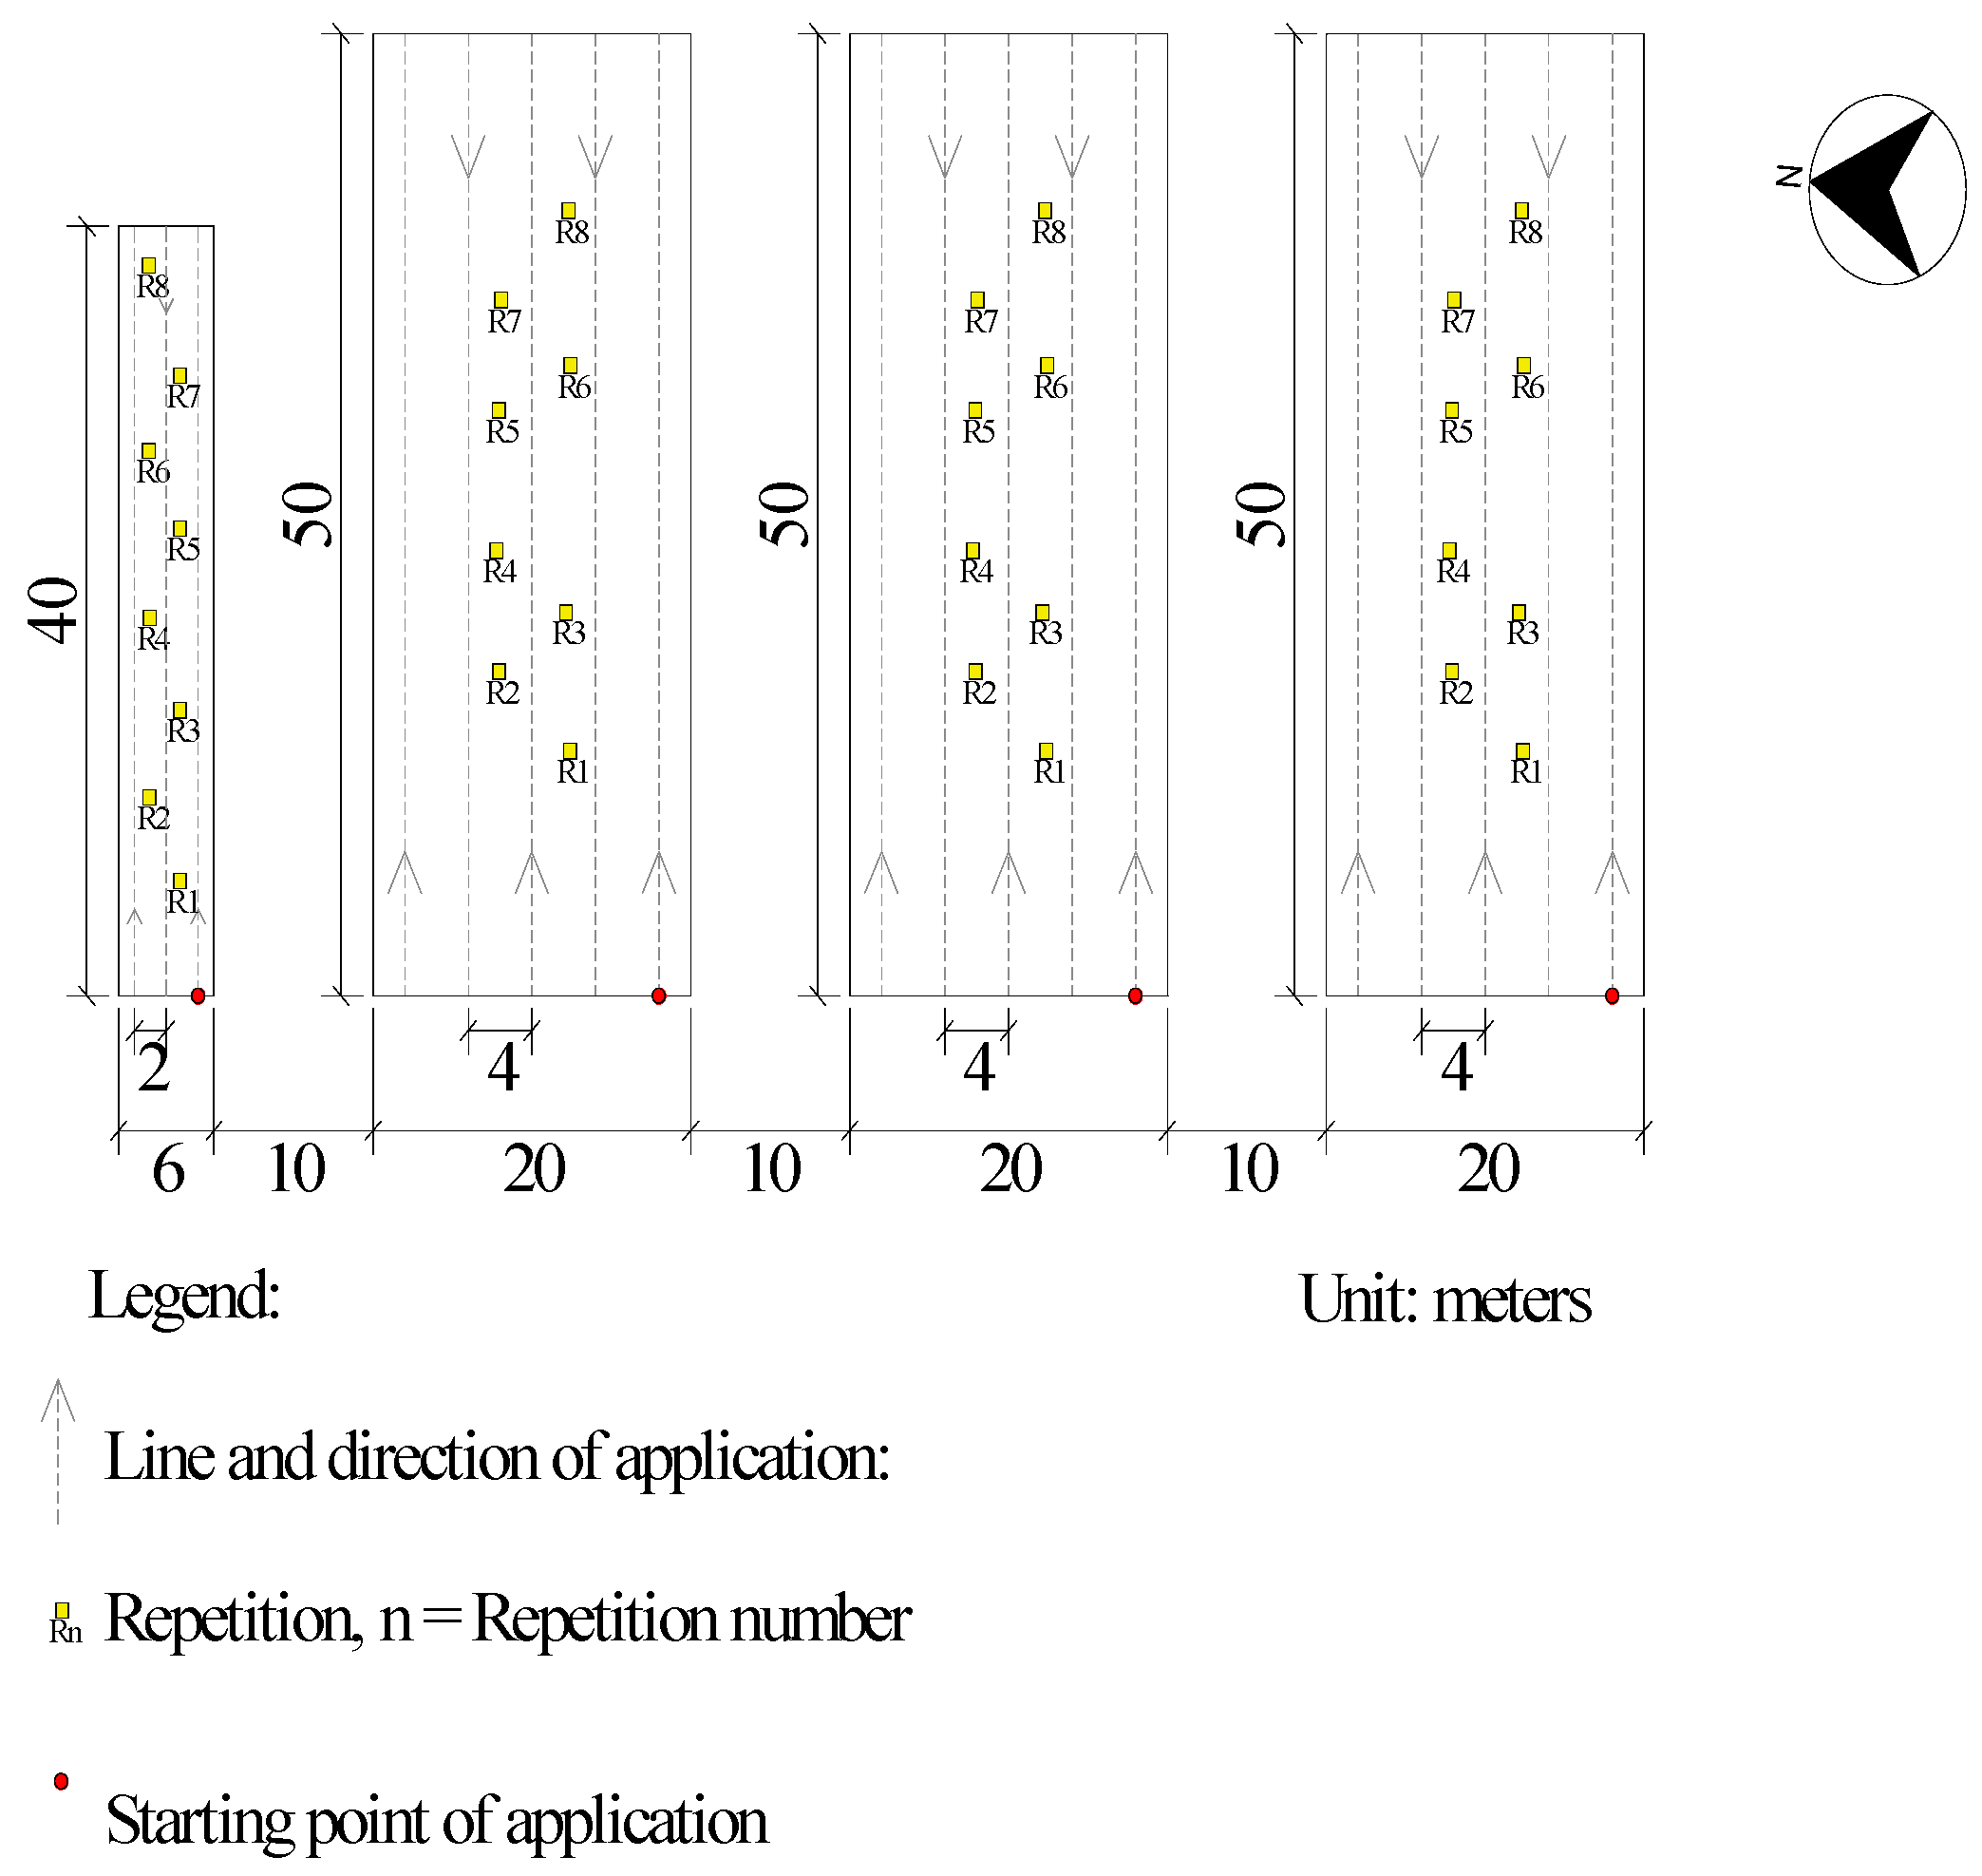
Figure 3.
Field applications. (a) Application via unmanned aerial vehicle (UAV). (b) Application via CO2 pressurized knapsack sprayer.
Figure 3.
Field applications. (a) Application via unmanned aerial vehicle (UAV). (b) Application via CO2 pressurized knapsack sprayer.
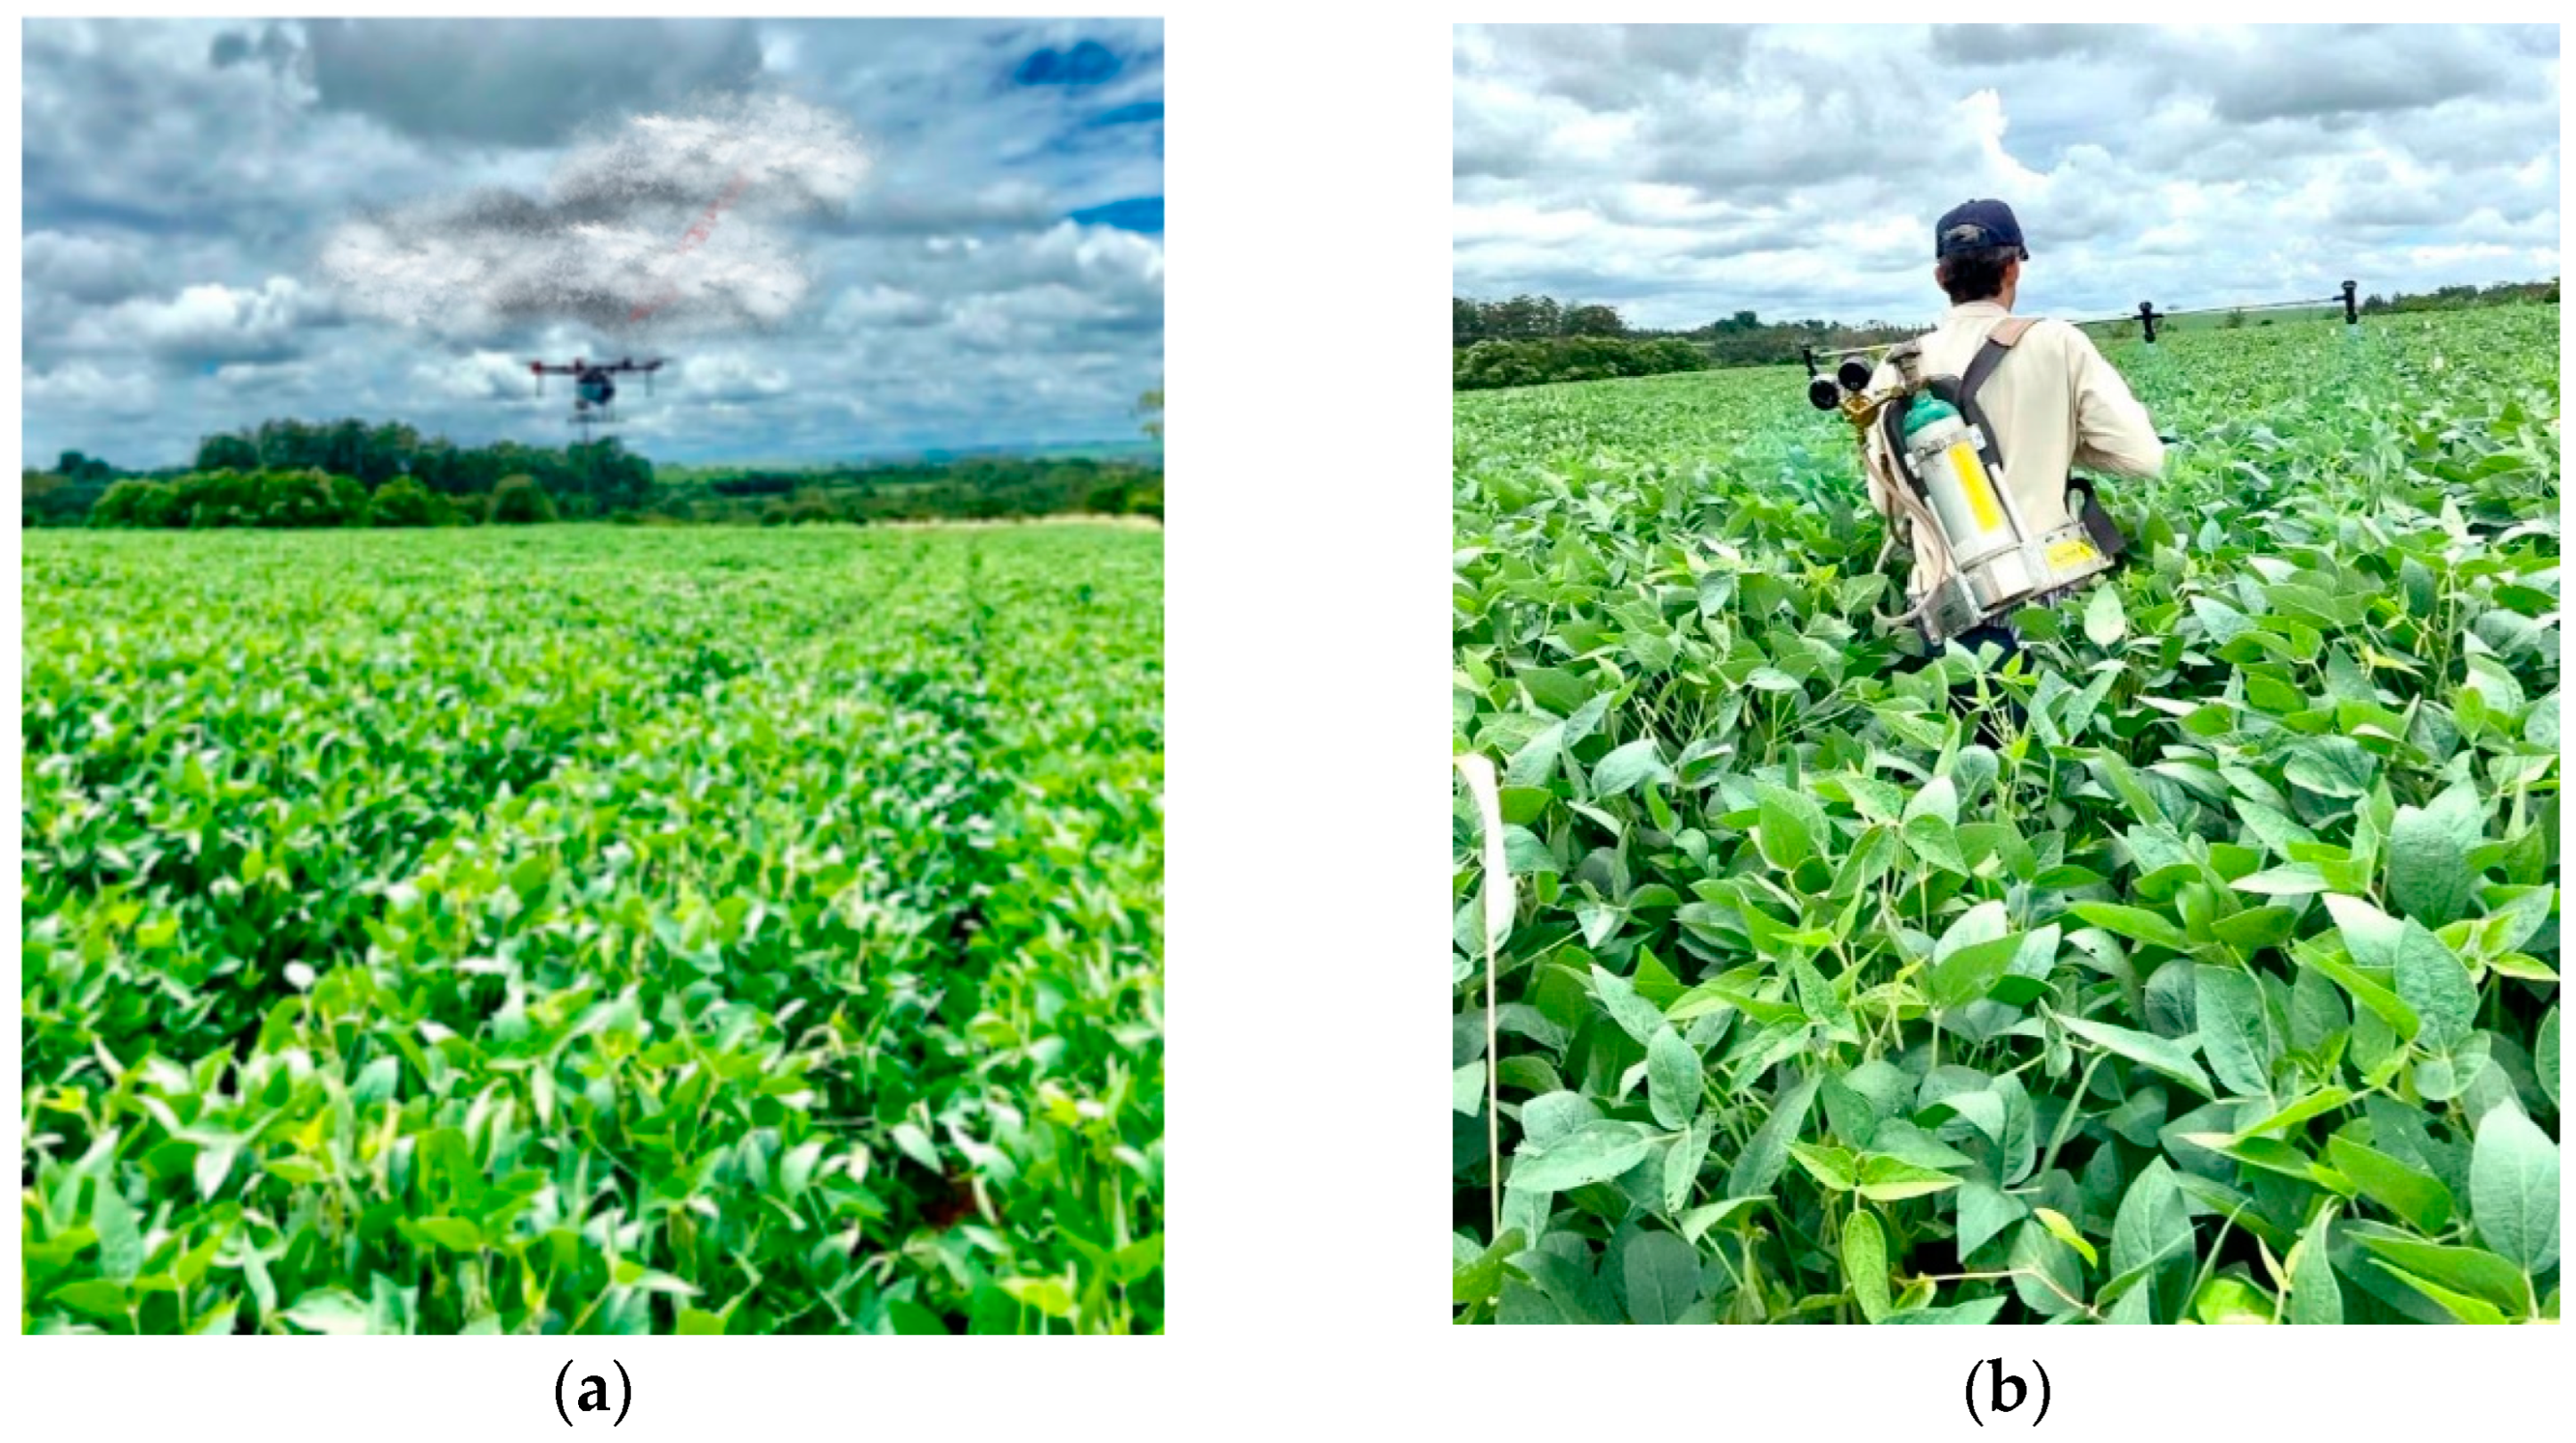
Figure 4.
Leaf sampling pattern to assess deposition.
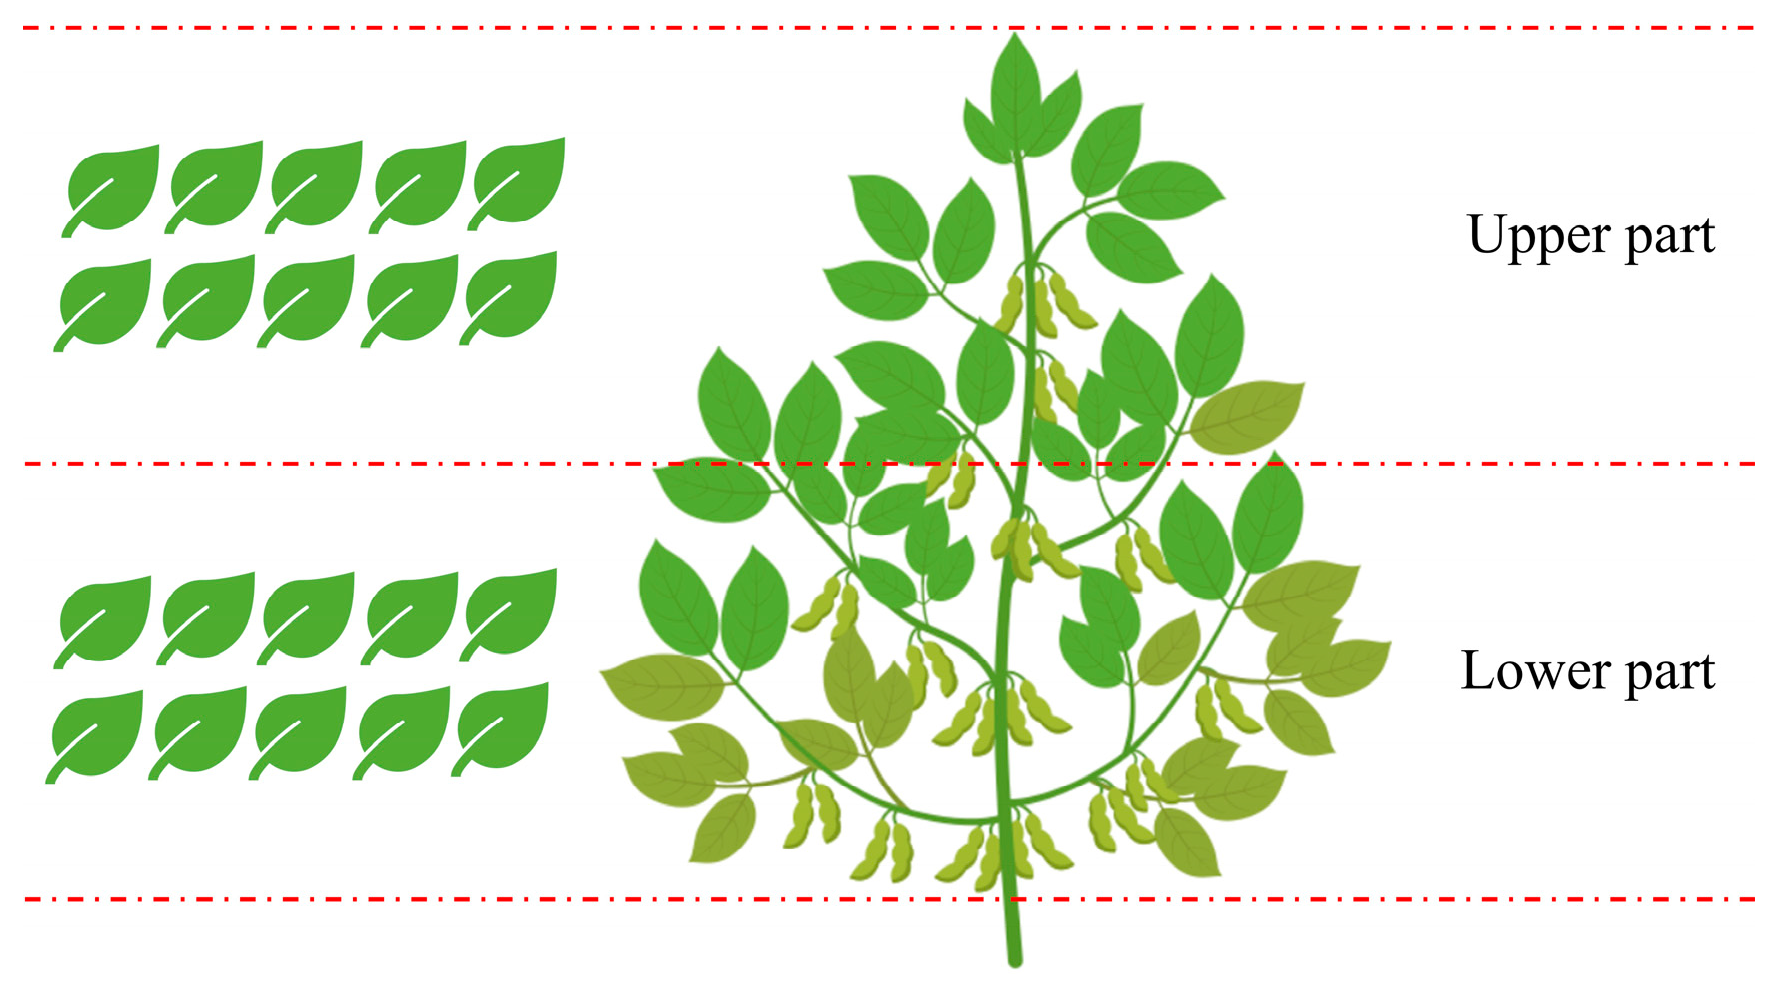
Figure 5.
Details of the water-sensitive paper positions. (a) Water-sensitive paper attached to the plant. (b) Water-sensitive paper sampling pattern for different parts of the plant.
Figure 5.
Details of the water-sensitive paper positions. (a) Water-sensitive paper attached to the plant. (b) Water-sensitive paper sampling pattern for different parts of the plant.
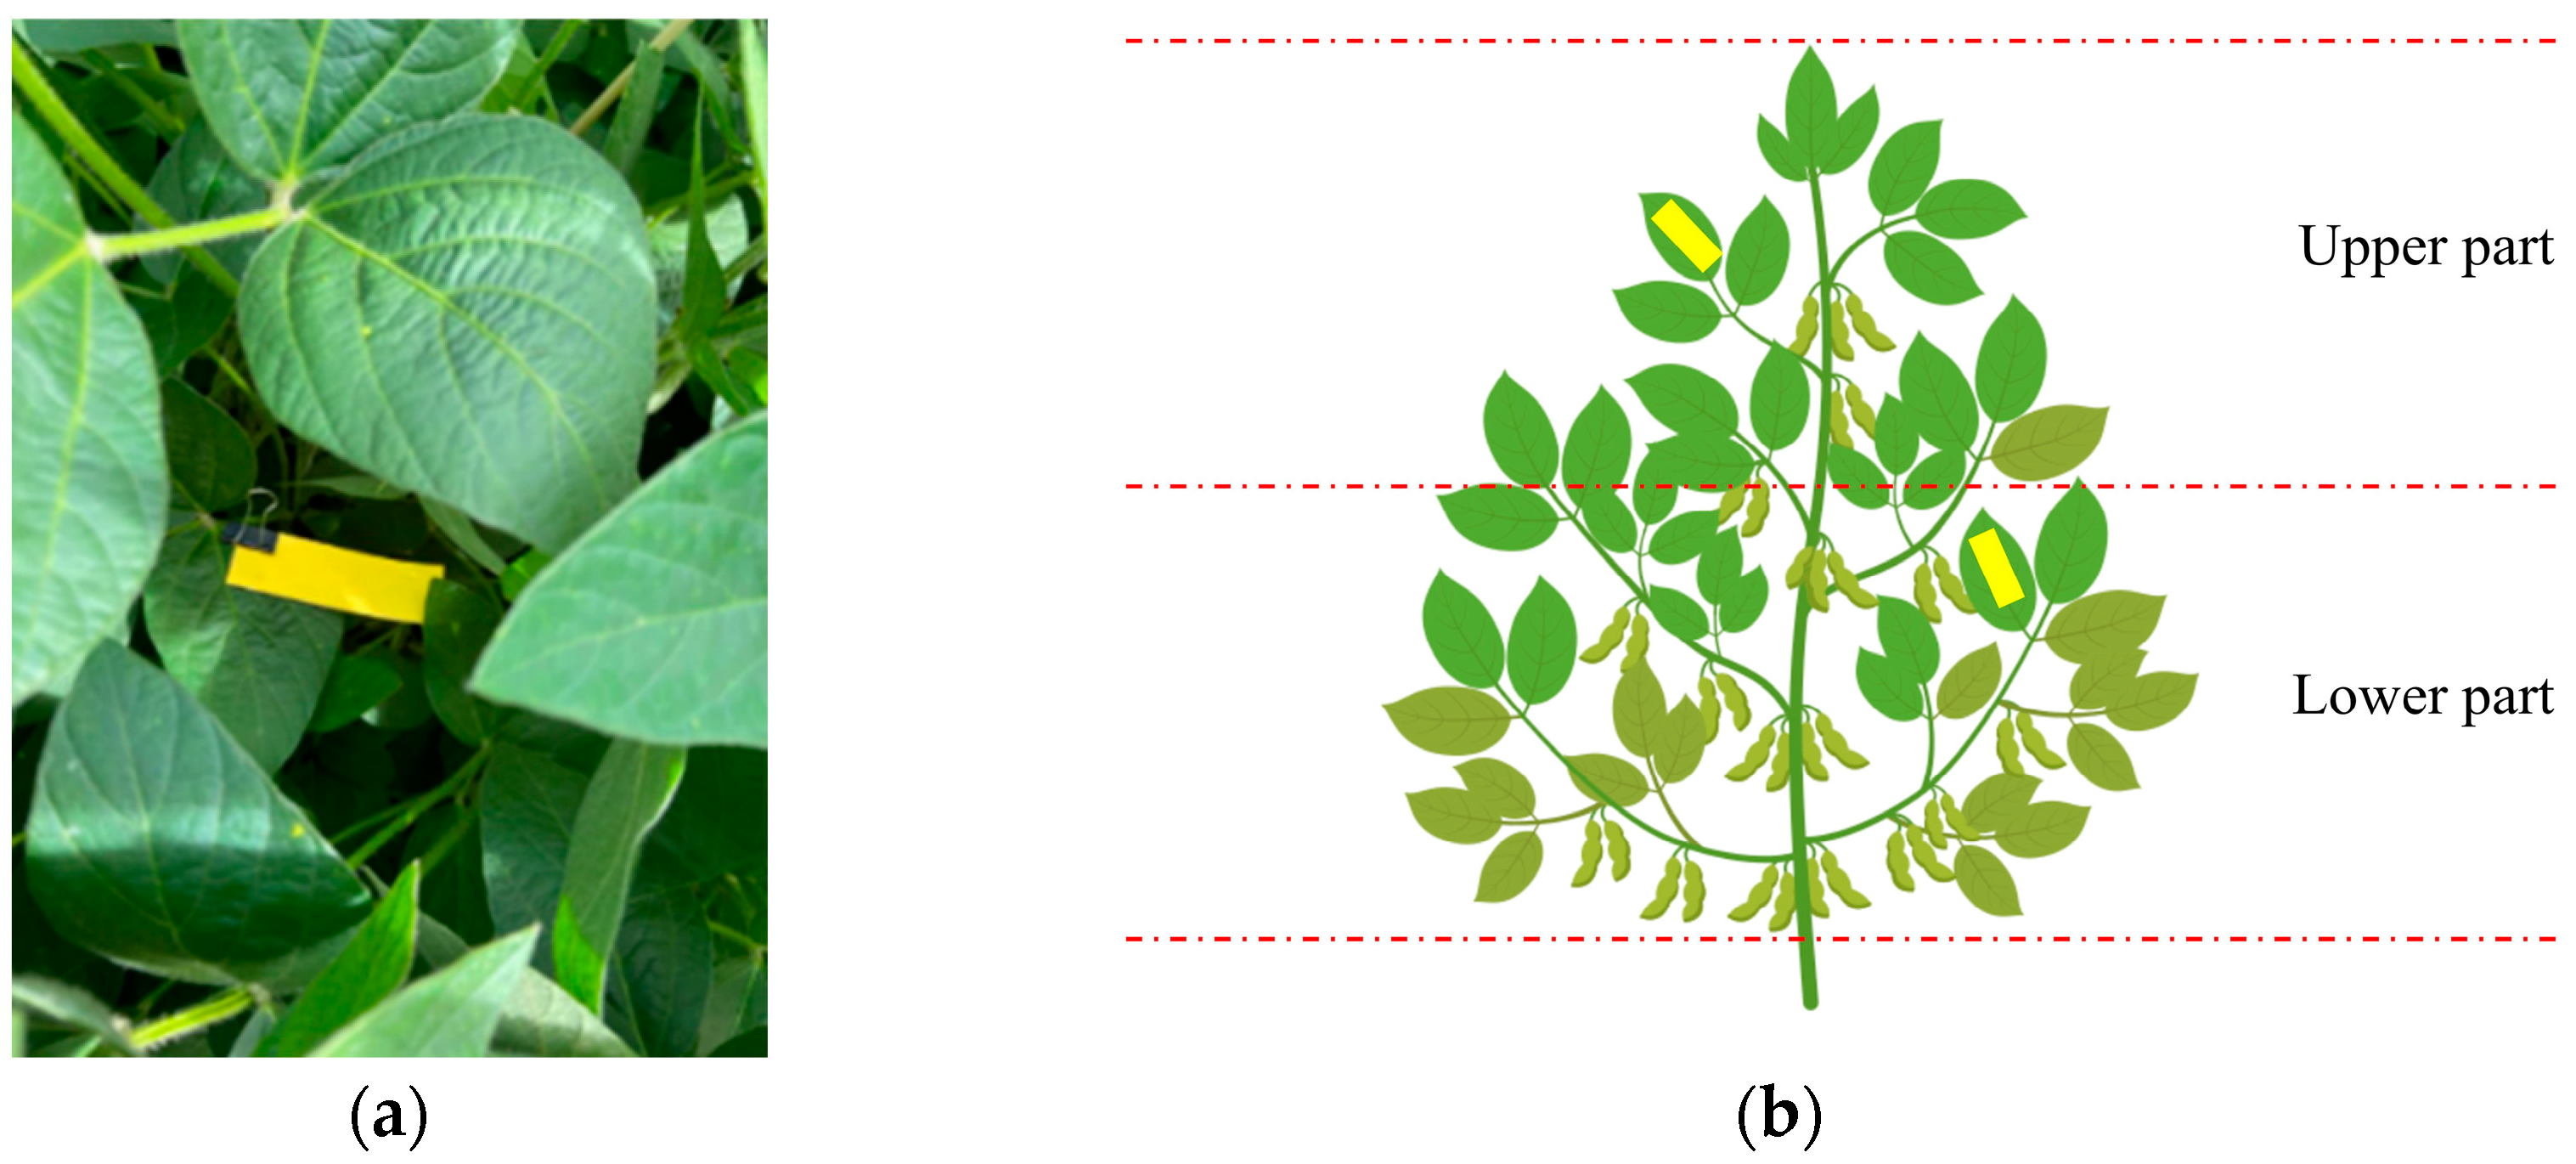
Figure 6.
Control charts for tracer deposition (μg cm−2) on the upper part of the soybean plant: (a) UAV-COAP 9001; (b) UAV-AirMix 11001; (c) UAV-XR 11001; (d) GROUND-XR 110015. UCL: upper limit, : treatment average, LCL: lower limit, : moving averages.
Figure 6.
Control charts for tracer deposition (μg cm−2) on the upper part of the soybean plant: (a) UAV-COAP 9001; (b) UAV-AirMix 11001; (c) UAV-XR 11001; (d) GROUND-XR 110015. UCL: upper limit, : treatment average, LCL: lower limit, : moving averages.
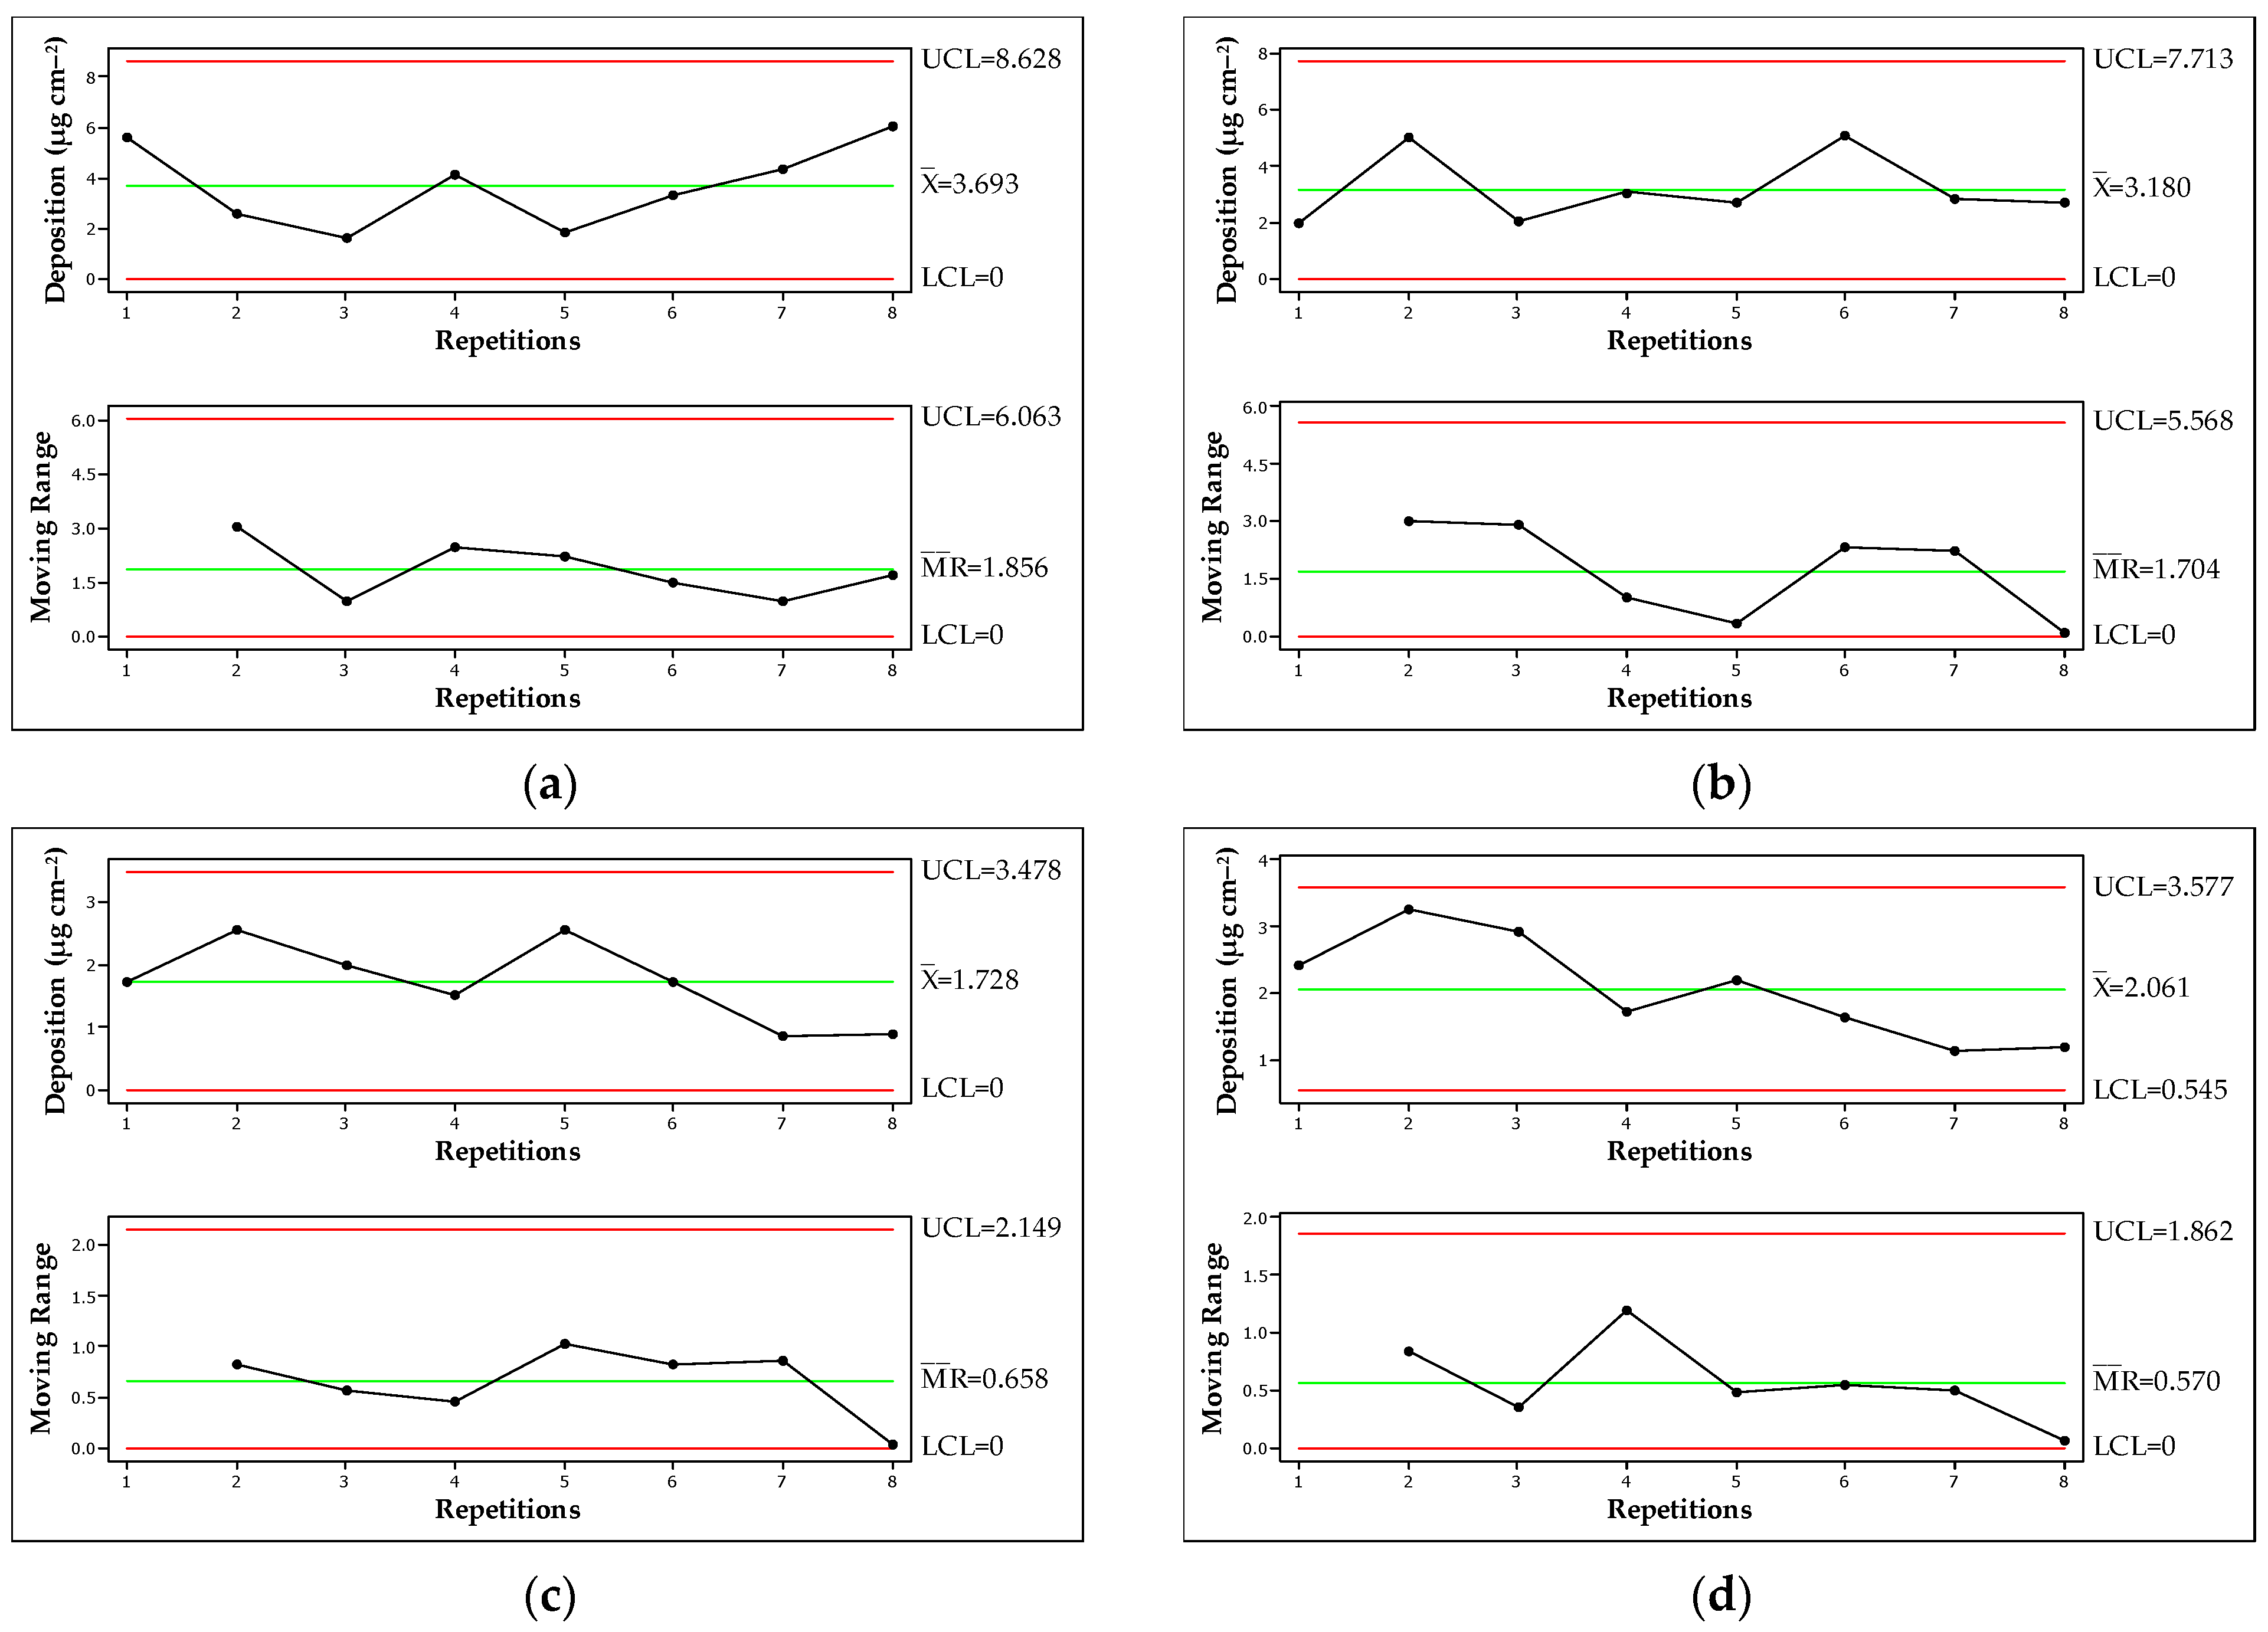
Figure 7.
Control charts for tracer deposition (μg cm−2) on the lower part of the soybean plant: (a) UAV-COAP 9001; (b) UAV-AirMix 11001; (c) UAV-XR 11001; (d) GROUND-XR 110015. UCL: upper limit, : treatment average, LCL: lower limit, : moving averages.
Figure 7.
Control charts for tracer deposition (μg cm−2) on the lower part of the soybean plant: (a) UAV-COAP 9001; (b) UAV-AirMix 11001; (c) UAV-XR 11001; (d) GROUND-XR 110015. UCL: upper limit, : treatment average, LCL: lower limit, : moving averages.

Table 1.
Unmanned aerial vehicle specifications.
| Parameter | Description |
|---|---|
| Method of operation | Remote control |
| Dimensions (mm) | 1471 × 1471 × 482 (measures with arms open) |
| Work capacity (ha h−1) | 2.80–4.05 |
| Spraying system | Atomized spraying |
| Tank capacity (L) | 10 |
| Number of nozzles | 4 |
| Application range (m) | 4–6 (with application 1.5–3.0 m from the crop) |
| Altitude detection accuracy (m) | 0.1 |
| Maximum operating speed (m s−1) | 8 |
| Positioning mode | GPS 1 or manual |
| Hovering accuracy (Strong GPS signal) | Horizontal ±0.6 m, vertical ±0.3 m (±0.1 m, radar module enabled) |
| Hovering time | 9–20 min |
| Max operating speed | 7 m s−1 |
| Max wind resistance | 8 m s−1 |
1 Global positioning system. Source: DJI [23].
Table 2.
Treatments characteristics.
| Treatment | Nozzle | Sprayer | Application Rate (L hm−2) |
|---|---|---|---|
| 1 | XR 11001 flat fan | UAV 1 | 10 |
| 2 | AirMix 11001 air-induction flat fan | UAV | 10 |
| 3 | COAP 9001 hollow cone spray | UAV | 10 |
| 4 | XR 110015 flat fan | Ground | 100 |
1 UAV: unmanned aerial vehicle.
Table 3.
Average deposition (μg cm−2) of spray on soybean crop performed using ground and aerial application (UAV) using different nozzles.
Table 3.
Average deposition (μg cm−2) of spray on soybean crop performed using ground and aerial application (UAV) using different nozzles.
| Treatments | Deposition on the Upper Part 1,2 | Deposition on the Lower Part 1,3 |
|---|---|---|
| UAV-COAP 9001 | 3.693 a | 0.747 a |
| UAV-AirMix 11001 | 3.180 ab | 0.788 a |
| UAV-XR 11001 | 1.728 c | 0.394 ab |
| GROUND-XR 110015 | 2.061 bc | 0.264 b |
| Assumptions | W= 0.97; L = 1.36; DW = 1.84 | W= 0.96; L = 0.21; DW = 2.18 |
1 Averages followed by different lowercase letters in the column differ from each other according to Tukey’s test at a significance level of 0.05. W, L, and DW: statistics from the Shapiro–Wilk test for normality of residuals, Levene’s test for homogeneity of variances, and Durbin–Watson test for independence of residuals, respectively; values in bold indicate normally distributed and independent residuals and homogeneous variances at a significance level of 0.05. 2 Square root transformation. 3 Logarithmic transformation.
Table 4.
Droplet spectrum obtained on the upper and lower parts of the soybean plant upon ground and aerial applications (UAV) using different nozzles.
Table 4.
Droplet spectrum obtained on the upper and lower parts of the soybean plant upon ground and aerial applications (UAV) using different nozzles.
| Treatments | Upper | ||||
|---|---|---|---|---|---|
| Coverage 1,3 (%) | Density 1,4 (Droplets cm−2) | VMD 1,4 (μm) | RA 1 | % < 100 μm 1,3 | |
| UAV-COAP 9001 | 0.22 b | 8.18 b | 166.35 c | 0.90 ab | 18.28 a |
| UAV-AirMix 11001 | 0.39 b | 4.90 b | 270.97 ab | 0.64 b | 3.04 b |
| UAV-XR 11001 | 0.48 b | 12.20 b | 178.18 bc | 1.04 ab | 8.58 a |
| GROUND-XR 110015 | 5.00 a | 47.48 a | 301.40 a | 1.09 a | 1.77 b |
| Assumptions | W = 0.94; L = 0.48; DW = 2.55 | W = 0.98; L = 2.77; DW = 2.51 | W = 0.97; L = 1.03; DW = 2.48 | W = 0.95; L = 1.84; DW = 2.35 | W = 0.98; L = 2.58; DW = 2.61 |
| Treatments | Lower | ||||
| Coverage 2 (%) | Density 1,4 (droplets cm−2) | VMD 1 (μm) | RA 1 | % < 100 μm2 | |
| UAV-COAP 9001 | 0.07 b | 2.62 ab | 232.57 a | 0.58 a | 8.30 ab |
| UAV-AirMix 11001 | 0.09 b | 1.15 b | 271.99 a | 0.37 a | 2.76 bc |
| UAV-XR 11001 | 0.09 b | 4.06 ab | 210.81 a | 0.68 a | 10.88 a |
| GROUND-XR 110015 | 0.40 a | 5.35 a | 354.62 a | 0.77 a | 1.28 c |
| Assumptions | W = 0.48; L = 1.21; DW = 2.39 | W = 0.99; L = 0.84; DW = 2.53 | W = 0.94; L = 2.31; DW = 2.12 | W = 0.97; L = 1.03; DW = 2.48 | W = 0.54; L = 0.37; DW = 2.30 |
1 Averages followed by different lowercase letters in the column differ from each other according to Tukey’s test at a significance level of 0.05. 2 Medians followed by different lowercase letters in the column differ from each other according to the Kruskal–Wallis test at a significance level of 0.05. W, L, and DW: statistics from the Shapiro–Wilk test for normality of residuals, Levene’s test for homogeneity of variances, and Durbin–Watson test for independence of residuals, respectively. Values in bold indicate normally distributed and independent residuals and homogeneous variances at a significance level of 0.05. 3 Logarithmic transformation. 4 Square root transformation. VMD: Volumetric Median Diameter. RA: Relative Amplitude.
Disclaimer/Publisher’s Note: The statements, opinions and data contained in all publications are solely those of the individual author(s) and contributor(s) and not of MDPI and/or the editor(s). MDPI and/or the editor(s) disclaim responsibility for any injury to people or property resulting from any ideas, methods, instructions or products referred to in the content. |
© 2023 by the authors. Licensee MDPI, Basel, Switzerland. This article is an open access article distributed under the terms and conditions of the Creative Commons Attribution (CC BY) license (https://creativecommons.org/licenses/by/4.0/).
Share and Cite
MDPI and ACS Style
Lopes, L.d.L.; Cunha, J.P.A.R.d.; Nomelini, Q.S.S. Use of Unmanned Aerial Vehicle for Pesticide Application in Soybean Crop. AgriEngineering 2023, 5, 2049-2063. https://doi.org/10.3390/agriengineering5040126
AMA Style
Lopes LdL, Cunha JPARd, Nomelini QSS. Use of Unmanned Aerial Vehicle for Pesticide Application in Soybean Crop. AgriEngineering. 2023; 5(4):2049-2063. https://doi.org/10.3390/agriengineering5040126
Chicago/Turabian StyleLopes, Luana de Lima, João Paulo Arantes Rodrigues da Cunha, and Quintiliano Siqueira Schroden Nomelini. 2023. "Use of Unmanned Aerial Vehicle for Pesticide Application in Soybean Crop" AgriEngineering 5, no. 4: 2049-2063. https://doi.org/10.3390/agriengineering5040126