Article

Pesticide and Adjuvant Mixture Impacts on the Physical–Chemical Properties, Droplet Spectrum, and Absorption of Spray Applied in Soybean Crop

by
Rafael Marcão Tavares
and
João Paulo Arantes Rodrigues da Cunha
*
Institute of Agrarian Sciences, Federal University of Uberlândia, Uberlândia 38408-100, Brazil
*
Author to whom correspondence should be addressed.
AgriEngineering 2023, 5(1), 646-659; https://doi.org/10.3390/agriengineering5010041
Submission received: 28 February 2023 / Revised: 20 March 2023 / Accepted: 20 March 2023 / Published: 22 March 2023

Abstract

:
Tank mixing of pesticides, a common practice in many countries, when performed incorrectly, can negatively impact the effectiveness of the pesticides. This study aimed to investigate the physical–chemical properties, droplet spectrum, and absorption by soybean plants of mixtures of the azoxystrobin fungicide with glyphosate herbicide and different adjuvants (mineral oil, propionic acid, and orange oil). The study design was completely randomized, with five treatments (T): T1, only fungicide; T2, fungicide + glyphosate; T3, fungicide + mineral oil; T4, fungicide + propionic acid; and T5, fungicide + orange oil. The spray concentrations simulated an application rate of 160 L ha−1 using the TT110015 nozzle. The physical stability, hydrogen ion potential, electrical conductivity, surface tension, droplet spectrum, and azoxystrobin absorption in soybean plants were evaluated. To measure absorption, soybean plants were sprayed at the reproductive growth stage, and leaf samples were collected after 0, 2, and 48 h. The amount of azoxystrobin absorbed was determined using gas chromatography. The results indicated that the spray mixtures were physically compatible. All mixtures produced a medium droplet spectrum. T2 had the lowest absorption percentages, suggesting that these pesticides should not be mixed. Adjuvants increased the amount of azoxystrobin absorbed by the plants, and it took 2 h on average for the soybean leaves to absorb 72.58% of the applied spray.

1. Introduction

Effective management of diseases and pests is a significant challenge in soybean crop. To address this, farmers often use a technique called tank mixing, which involves combining multiple pesticide products in a single application. However, if the mixture is not properly formulated, it can decrease the effectiveness of the products compared to using them individually [1].
Fungicides, which are essential for disease management, are often used in foliar applications during the vegetative stages of soybean growth. One common practice is to mix fungicides with the herbicide glyphosate, particularly in soybean crops with resistance to glyphosate. This allows for simultaneous disease management and weed control, while also being more efficient in saving time and fuel, with a single sprayer pass. In many cases, farmers also include an adjuvant in the mixture [2].
However, when multiple products are mixed in the sprayer tank, there can be interactions between the molecules that result in either synergistic or antagonistic effects on the control efficacy of pathogens. Moreover, antagonism can occur in an invisible way, such as chemical incompatibility and reduced absorption [3].
The components of the sprays can interfere with the physical stability of the mixture in various ways according to their chemical groups, doses, and formulations, altering the physical–chemical properties of the solutions, such as pH, electrical conductivity, and surface tension [3]. Separations of phases in the mixture can occur, with flocculation, precipitation, and formation of sludge inside the sprayer tank, circuit, and spray nozzles reducing the equipment’s lifespan and operational capacity. In general, mixture studies are difficult to perform and are further complicated by the fact that the observed interactions are often not predictable given our current knowledge. The combined effects of pesticides within the same class can be predicted fairly well based on our understanding of the mechanism of toxic action of these pesticides. However, the effects of across-class mixtures of pesticides are more difficult to predict and understand [4].
Furthermore, the droplet spectra, formed from the spraying of different phytosanitary products, are also influenced by the formulations of the active ingredients, with losses to target coverage and the possibility of spray loss due to the antagonistic characteristics of the involved components [5].
The ability of the fungicide molecule to be absorbed by the plant plays a crucial role in determining the efficacy of control. Factors that influence this include the weight and molecular size of the active ingredient, its lipophilicity (affinity for the plant’s cuticular wax layer), and the ionic charge of the products involved in the mixture. This process of diffusion takes place through the cuticular wax, cuticle, and plasma membrane of the epidermal cells of the leaves and the lipophilicity of the compounds is the most important property of the fungicide in relation to foliar absorption. This process can also be influenced by tank mixtures [6].
Thus, it is important to understand the influences of pesticide mixtures with other products on the application technology and absorption in soybean plants in order to help the growers to make better decisions. The correct choice of the spray solution components allows better plant health management, with lower resource demands and environmental impacts. This study aimed to investigate physical–chemical characteristics, droplet spectrum, and absorption by soybean plants of mixtures of the fungicide azoxystrobin with glyphosate and adjuvants.

2. Materials and Methods

This study was conducted in four different stages in 2020 and 2021. The physical stability of fungicide, herbicide, and adjuvant mixtures; physical–chemical characteristics; droplet spectra formed during the spray of these mixtures; and absorption of these mixtures by soybean plants after applications were evaluated.
The experiment was conducted using 5 treatments. These treatments were laid out in a completely randomized design (CRD) replicated 4 times, resulting in 20 experimental plots. The treatments, or pesticide mixtures, consisted of the fungicide (azoxystrobin) used alone, and then variations of mixtures involving this same fungicide: fungicide (FG), fungicide + glyphosate herbicide (GL), fungicide + mineral oil (MO), fungicide + multifunctional adjuvant (propionic acid) (PA), fungicide + vegetable orange oil (OO).
The pesticides and adjuvants used in the trial and their active ingredients and formulations for making the sprays were: 0.3 L ha−1 of Priori Xtra® fungicide (azoxystrobin 200 g L−1 + cyproconazole 80 g L−1, formulated as a concentrated suspension); 3 L ha−1 of Roundup Transorb® herbicide (potassium salt 588 g L−1, equivalent to glyphosate acid 480 g L−1, formulated as a soluble concentrate); 0.25 L ha−1 of Iharol Gold® adjuvant (mineral oil 756.8 g L−1, formulated as an emulsifiable concentrate); 0.10 L ha−1 of Li700® adjuvant (phosphatidylcholine + propionic acid 712.88 g L−1, formulation not specified by the manufacturer); and 0.15 L ha−1 of Orobor® adjuvant (essential oil from orange peel, formulation not specified by the manufacturer).
All the sprays were prepared at concentrations to simulate an application rate of 160 L ha−1 to simulate typical field applications. When preparing the sprays, the order of mixing for liquid formulations recommended by ABNT [7] was followed: concentrated suspensions were added first, followed by soluble concentrates and emulsifiable concentrates.

2.1. Physical Stability of the Spray Solution

The evaluations of the physical stability of the spray solutions were performed according to the standards of the ABNT NBR 13875 [7]. This standard specifies the evaluation methodology of the physicochemical compatibility of phytosanitary products in tank mixtures.
Initially, the mixtures were prepared in 1 L graduated glass beakers by initially filling 50% of their volume with water, then dosing the products. These were dosed with graduated pipettes, and after their dosages, sufficient water was added to reach 1 L of each of the spray solutions. These spray solutions were divided into two samples of 0.25 L, both placed in 0.5 L graduated glass test tubes, and sealed with plastic wrap. The remainder of the prepared spray solution was reserved in the beakers for subsequent physical–chemical analysis.
The test tubes were directed to different physical stability analyses: one evaluation for spray solutions established at rest, without agitation; and another evaluation for phytosanitary spray solutions established with agitation. For this agitation, prior to each mixture evaluation, the test tube was inverted by hand ten times in a rotary movement of 180°, once every 2 s, to obtain good homogenization. Then, the test tube was returned to its initial position to visually evaluate the stability of the mixtures.
The spray solutions were evaluated at four different times: immediately after the preparation of the mixtures (0 h), 2 h after preparation, 6 h after preparation, and 24 h after preparation. At each of these times, the spray solutions were visually evaluated with and without agitation to detect the presence or absence of flocculation, sedimentation, phase separation, clumping, oil separation, crystal formation, and cream formation. In addition, foam formation was evaluated.
Finally, the spray solutions were classified as either compatible, in which the mixtures were homogeneous in all evaluation periods; compatible under agitation, in which heterogeneity of the mixture occurred without agitation; or incompatible, in which heterogeneity occurred in any evaluation, even with agitation.

2.2. Physical and Chemical Analyses

Physical and chemical analyses were performed on 0.4 L of the spray solution, which was extracted from the graduated glass beakers prepared in the previous stage. The solution was divided into four volumetric flasks of 0.1 L each to compose four repetitions of the respective treatments.
The samples were then transferred to 0.1 L beakers and the pH and electrical conductivity of the phytosanitary solutions were measured using a portable pH meter and conductivity meter (Akso® model AK59). It is important to note that the equipment was calibrated using standard solutions prior to use.
To determine the surface tension of the spray solutions, a bench-top tensiometer with a platinum ring (Kruss® model K6) was used, following the methodology outlined by Du Nouy [8]. The tension was measured by placing the ring on the end of a flexible rod on the surface of the sample and adding tension until repulsion occurred.

2.3. Droplet Spectrum

We analyzed the droplet spectrum using a real-time laser particle analyzer (Sympatec® model Helos/Vario KF), which was set up with a R6 lens to measure particles between 9 and 1750 µm. This analyzer uses a laser diffraction sensor designed to measure particle size from 0.5 to 3500 µm.
We first checked the alignment of the optical beam to ensure proper positioning in the detector system, corrected any lens contamination, and calibrated the device. The spraying nozzle was positioned 50 cm above the light beam in a vertical displacement system, which allows the entire spray jet to pass through the laser beam, with one repetition per measurement pass [9]. Four repetitions were performed for all spectrum readings.
The nozzle used was the TT110015 from Teejet®, which sprays a flat jet via deflection. The tests were conducted at a working pressure of 200 kPa and flow rate of 0.48 L min−1 to simulate an application rate of 160 L ha−1 at an operational speed of 3.6 km h−1.
A 4-liter mixture of spray solution was prepared as the sample and stored in a stainless-steel tank with a capacity of 11.3 L. The system was pressurized using an air compressor.
Environmental conditions during the application were air temperature between 25.2 and 26.4 °C, relative humidity between 64% and 82%, and no wind, as the tests were conducted in a closed room.
The following parameters were evaluated: volume median diameter (VMD) in µm, relative span (AR), and percentage of volume of sprayed droplets with a diameter less than 100 µm (Dv < 100 µm).

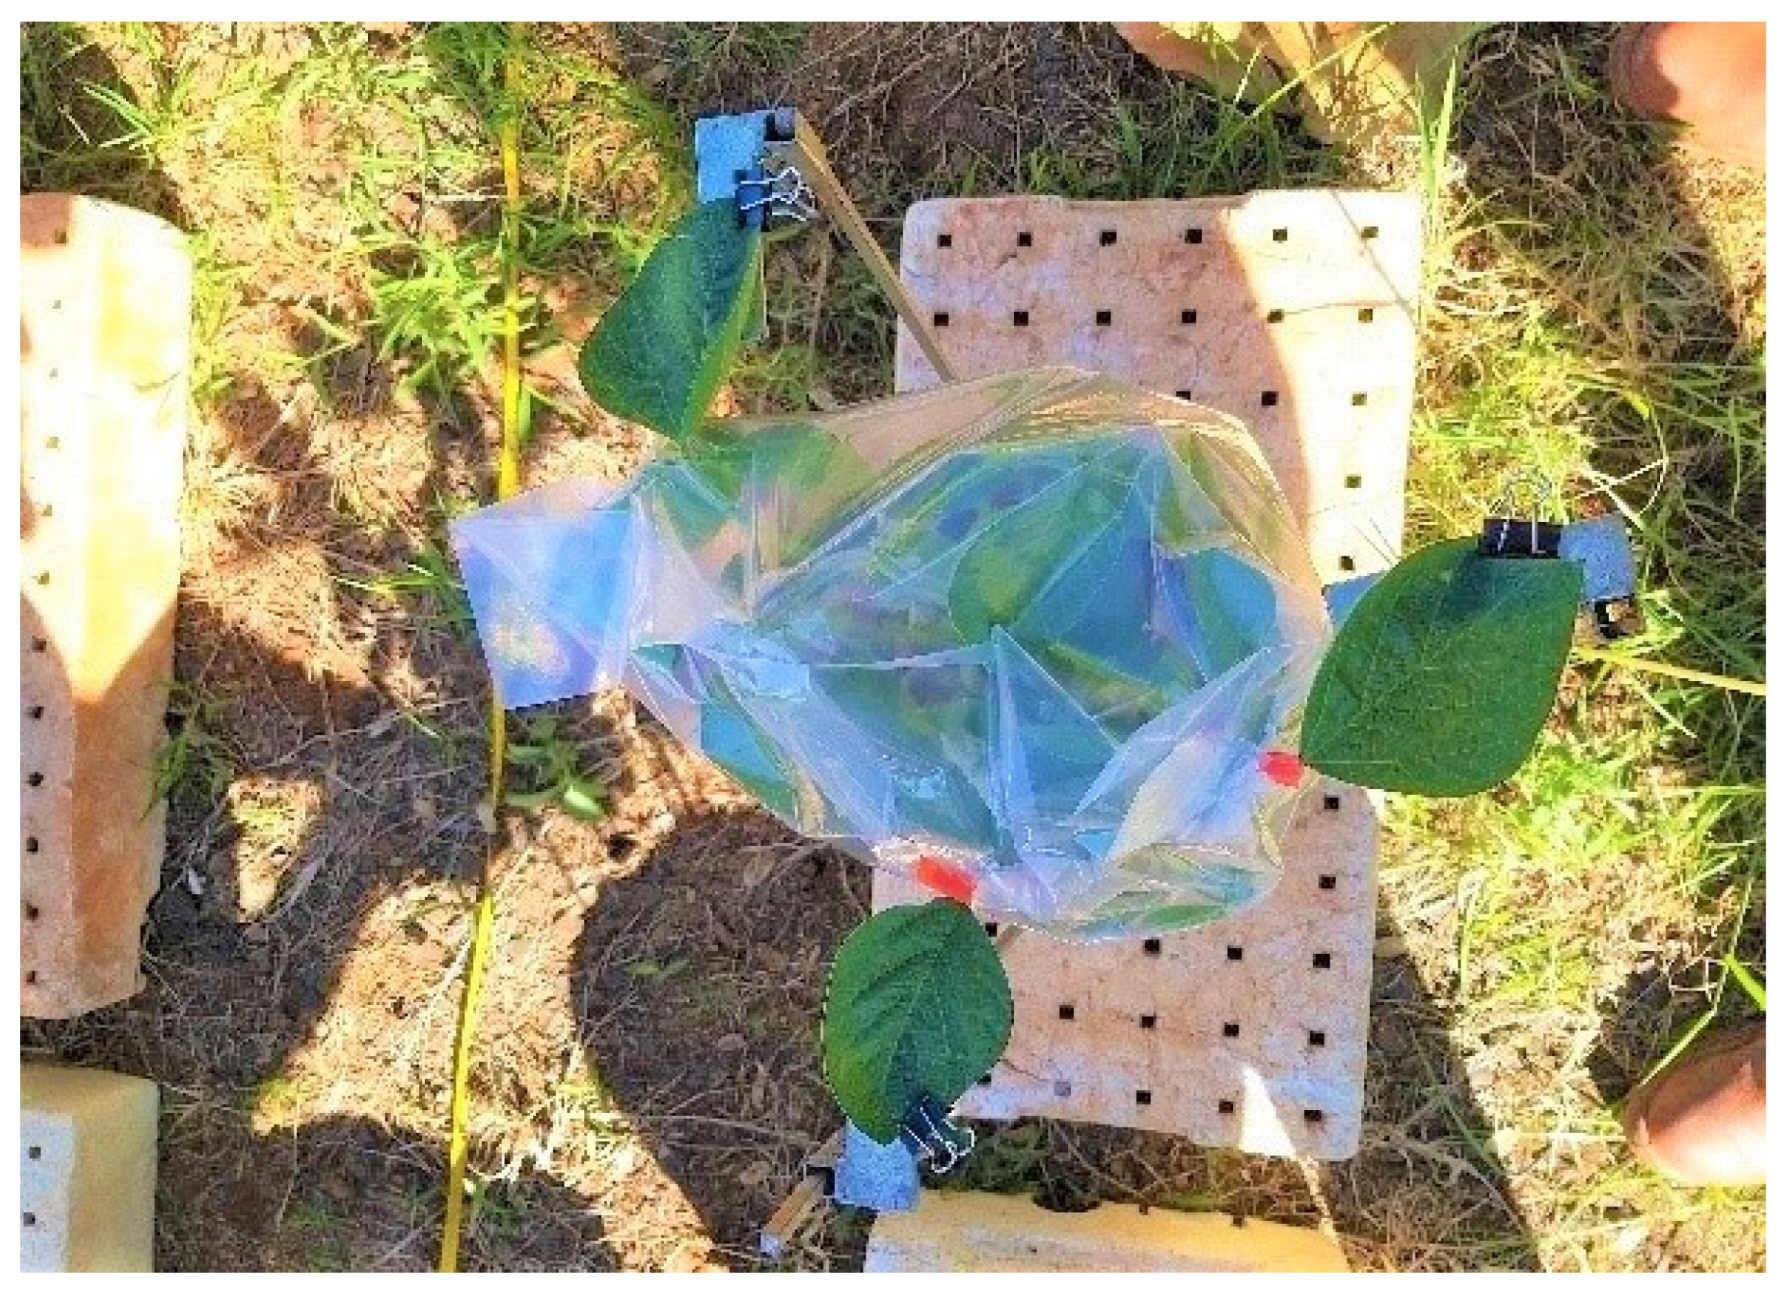
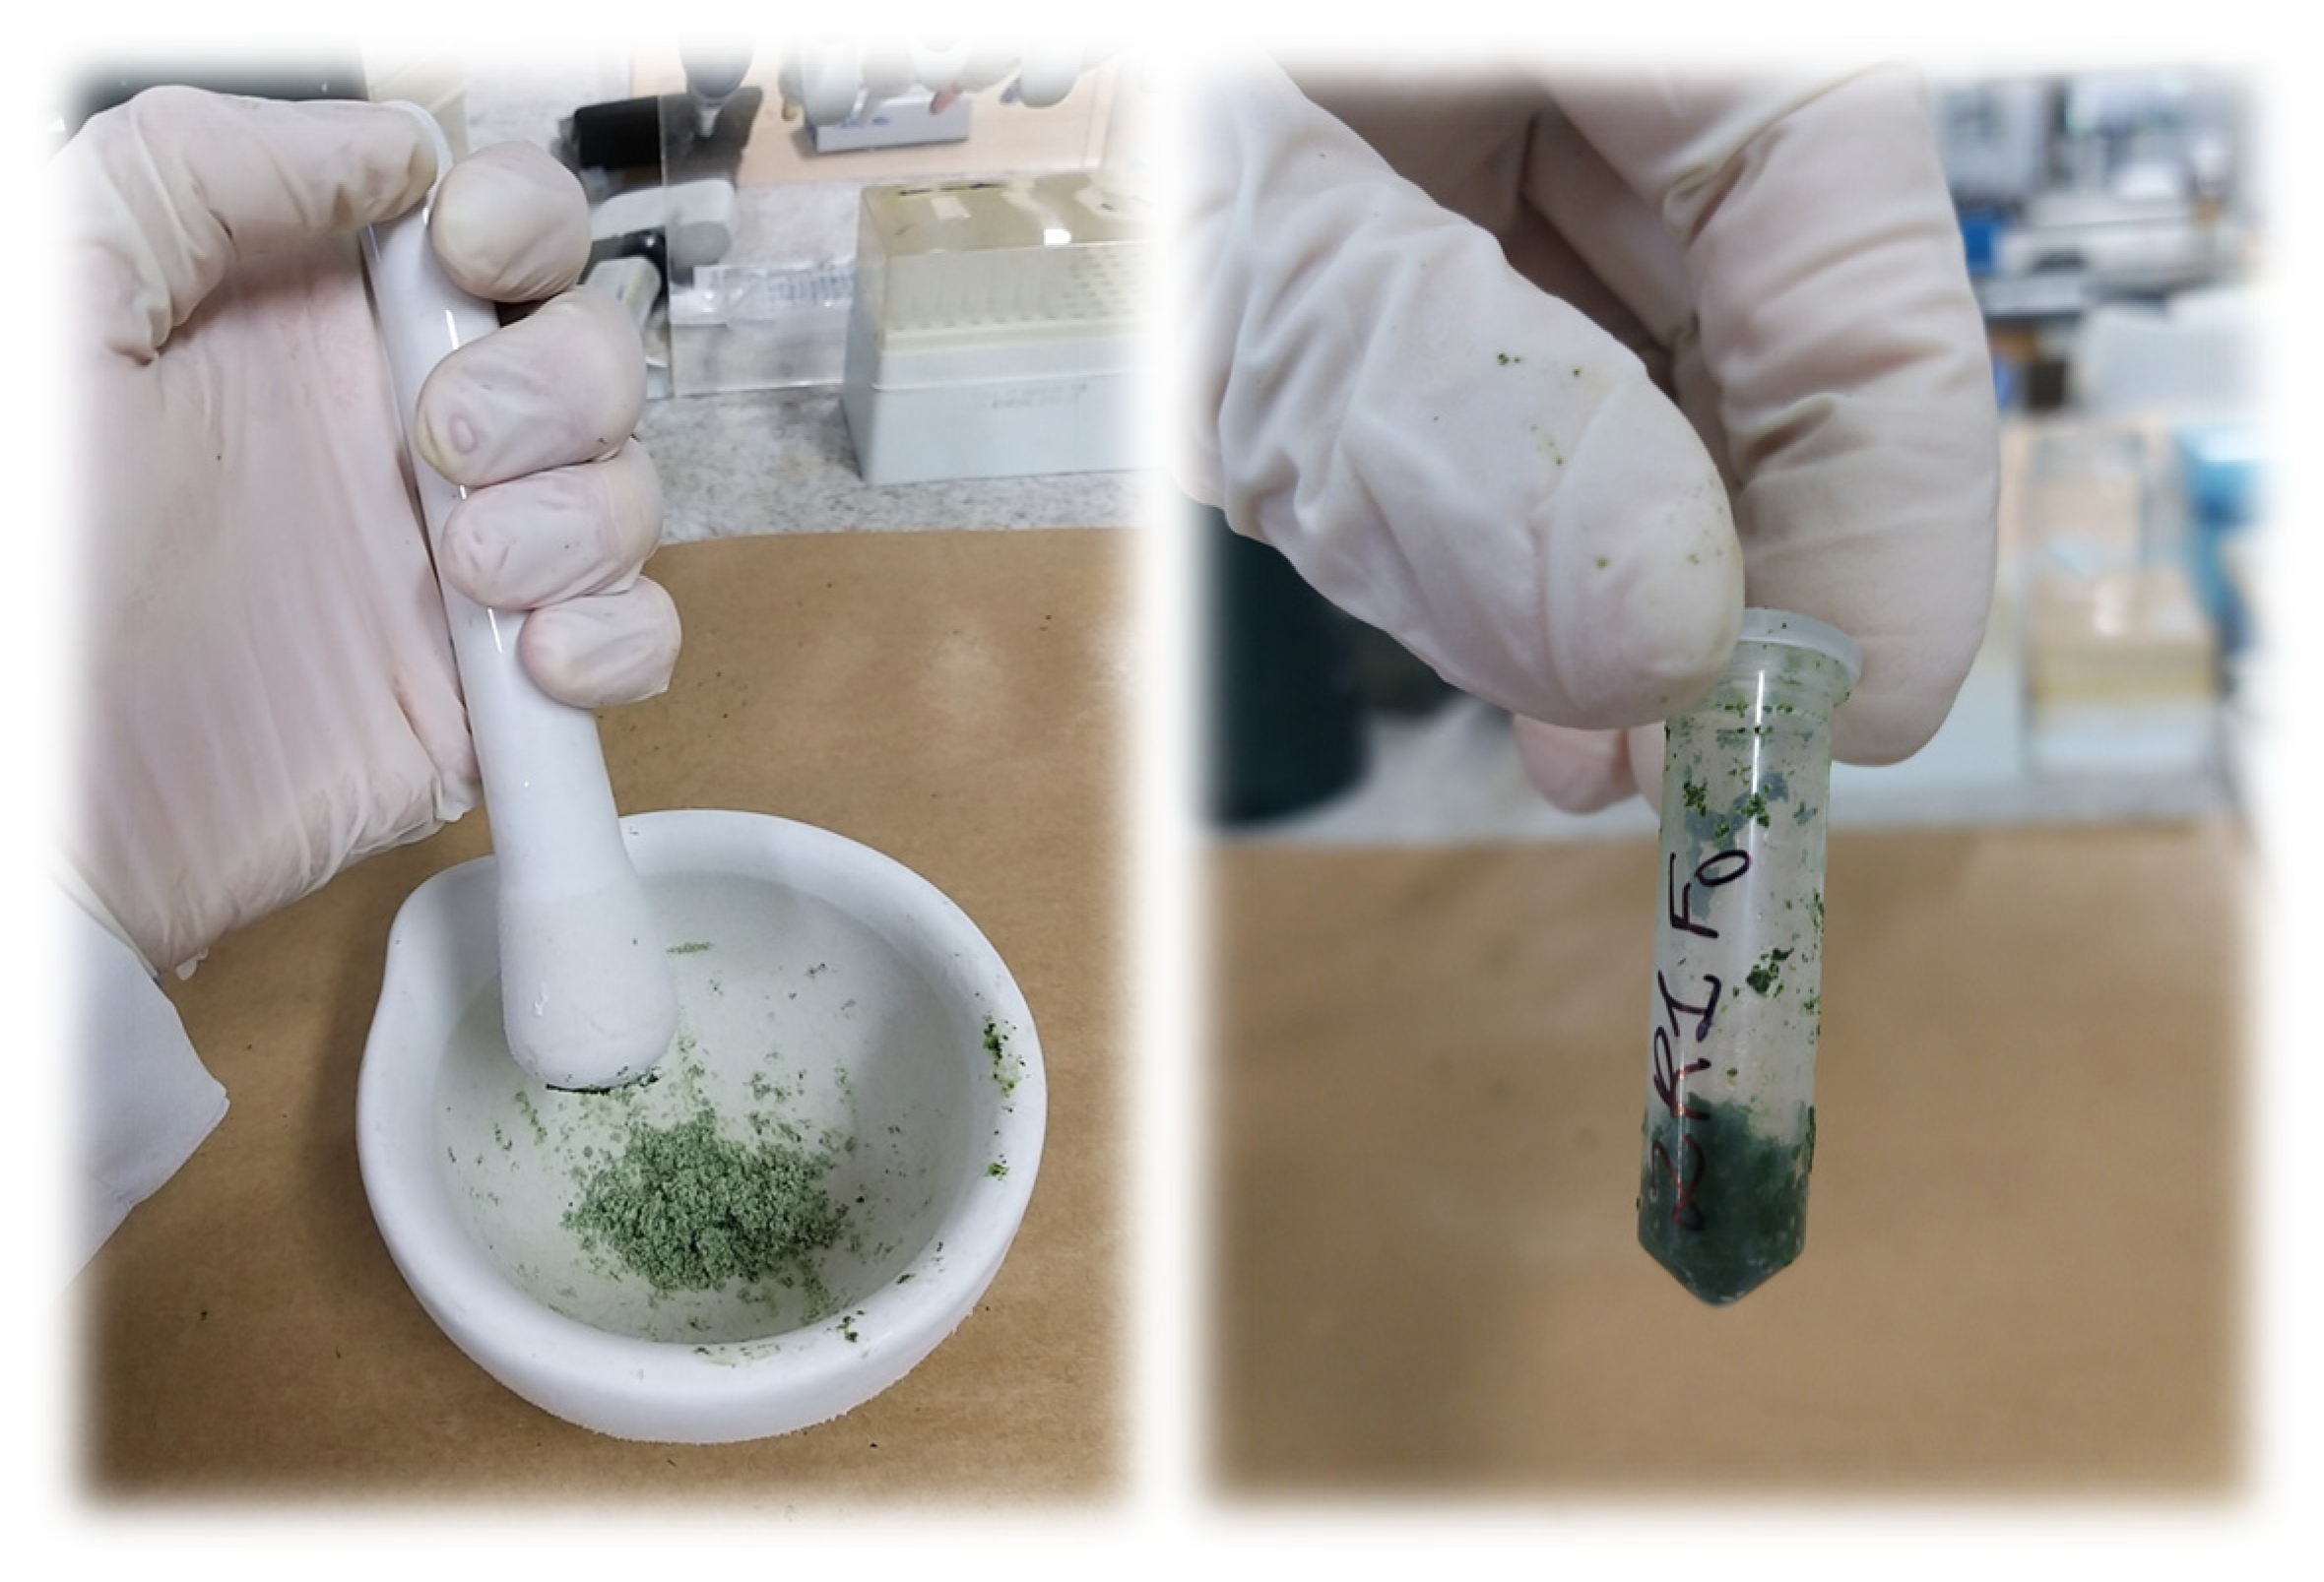
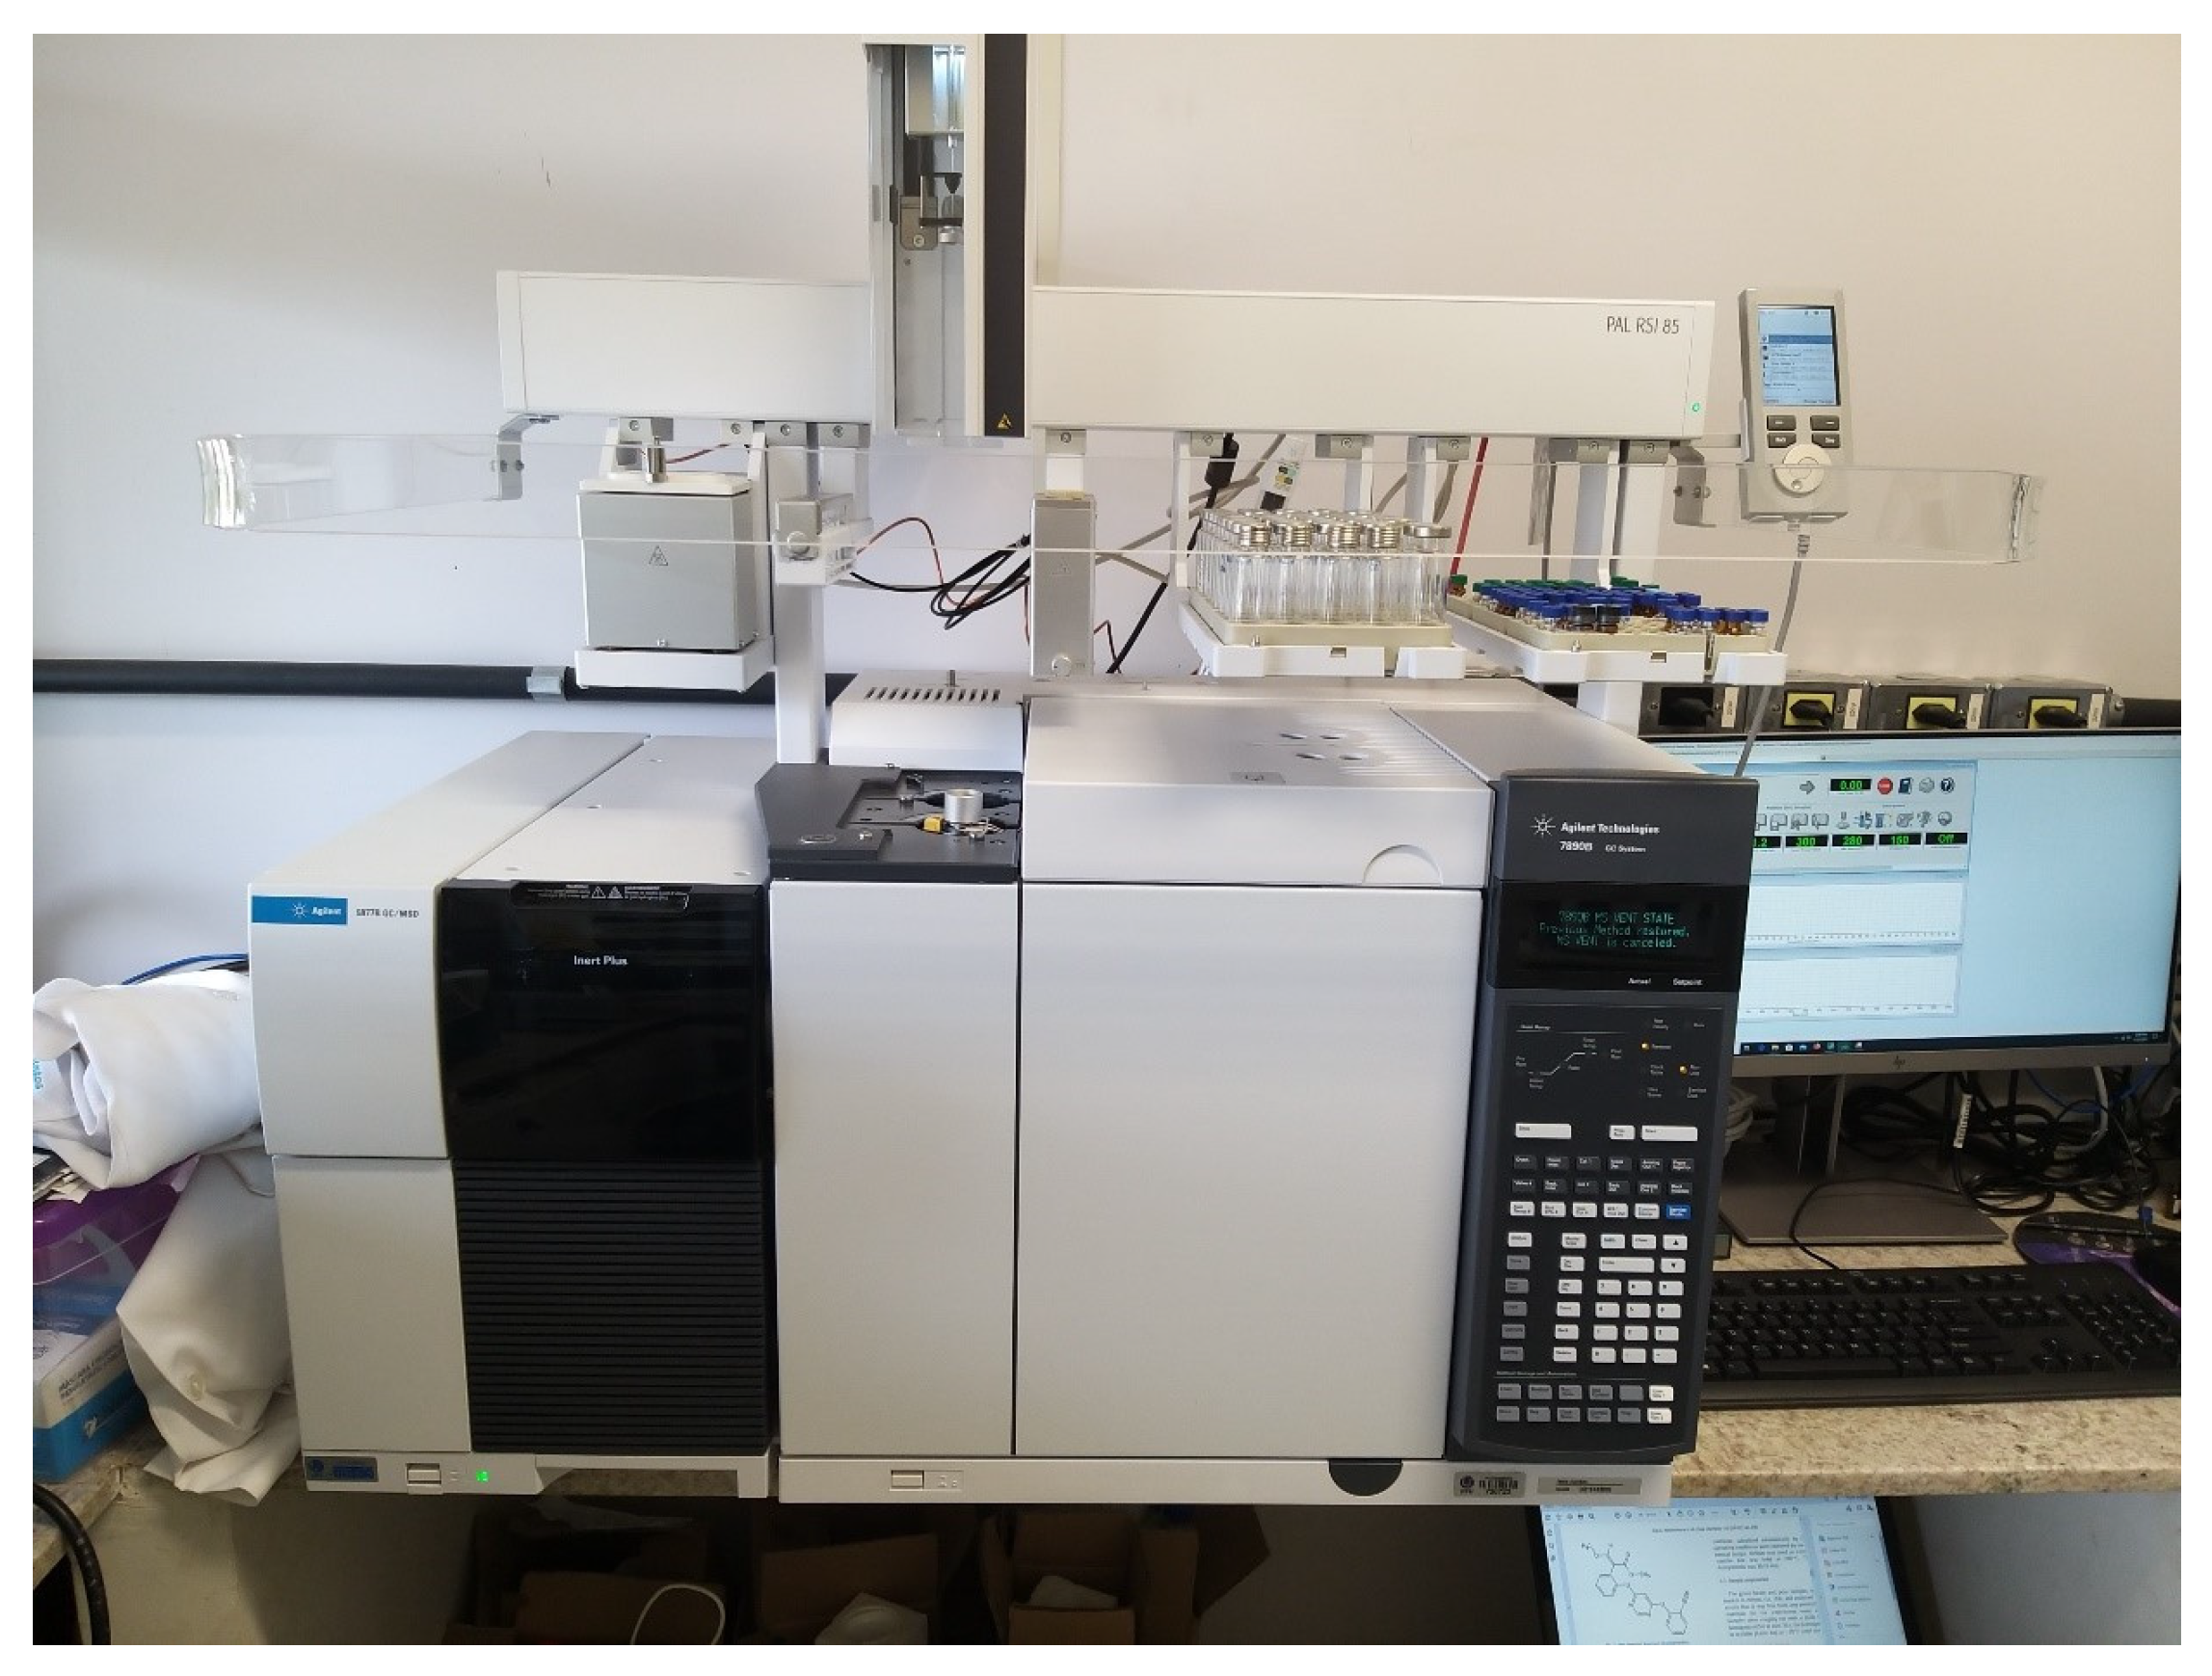
2.4. Azoxystrobin Absorption

In this analysis, we first set up pots in a greenhouse, where we also applied fungicide mixtures to soybean plants. After the applications, leaf samples were prepared and stored for later laboratory analysis, following the methodology outlined by Silva [10].
To prepare the pots, we screened the soil to ensure uniform granulometry using a 4 mm mesh sieve. This soil, classified as Dystrophic Red Latosol [11], was mixed in a 3:1 ratio with sand and added to the pots. Additionally, 17.69 g of limestone was added to each pot to simulate field conditions. The mixture was prepared using a concrete mixer. The soil density was considered to be 1.3 kg L−1 and 10.4 kg of soil was placed in 8 L pots. Each pot represented a replication, and 20 pots were used for the experimental plots.
For seed fertilization, 20.4 g of phosphorus, 0.9 g of nitrogen, and 0.7 g of potassium were applied to each pot at a depth of 10 cm. In addition, 0.7 g of potassium chloride and 0.9 g of urea were applied to each pot as a top dressing at 21 and 35 d after sowing.
Eight seeds of the BMX Foco RR variety were distributed per pot, with four plants thinned out 15 days after emergence. The pots were kept in the greenhouse and were uniformly irrigated three times a day until application at the R1 reproductive stage.
For fungicide spray applications, we used a CO2 pressurized sprayer, with a working speed of 3.6 km h−1, at an application rate of 160 L ha−1, using TT110015 nozzle tips spaced 50 cm apart, with a working pressure of 200 kPa and flow rate of 0.48 L min−1.
During the applications, environmental conditions were monitored using a digital thermo-hygro-anemometer, with minimum temperature of 22.3 °C and maximum temperature of 29.7 °C, relative humidity between 39.4% and 72.3%, and wind speed between 2.1 and 5.4 km h−1.
To receive applications of fungicide solutions, each experimental plot—that is, the plants inside pots, spaced apart by 50 cm—was covered with plastic bags and sealed with tape, exposing only the leaves directed towards collections and subsequent analyses, according to the respective evaluation times (Figure 1). Since there were three collection times, three leaves per plot were exposed to receive the fungicide solution application. The leaves exposed to sprays were marked with red adhesive tape and fixed in a horizontal position during application using metal rods with a flat support and clamps to prevent solution runoff. Plastic film was used on the metal supports in each applied treatment to prevent contamination between fungicide mixtures. Leaves in the upper thirds of the plants were randomly selected to receive the spray droplets.
Three collection times for the three leaves were established: 0, 2, and 48 h after application. After spraying, the plastic bags were cut and the plants were uncovered, and the 0 h samples were collected. The other pots were stored again in the greenhouse so that the plants would not suffer any physiological stress. The other samples were collected at the pre-established times of 2 and 48 h after the applications. The collected leaves were stored in plastic bags and taken to the laboratory for washing.
The leaves were washed with 100 mL of distilled water for 1 min. At this time, the samples were separated into (a) washed leaf and (b) washing water. These two sub-samples from each plot were stored in a freezer at −80 °C until their processing date.
As adapted from Silva [10] and Abdelraheem et al. [12], after being thawed at room temperature, the leaves were macerated with liquid nitrogen and 100 mg of fresh sample was weighed on an analytical balance and placed in 15 mL capacity “Falcon” tubes (Figure 2). The extraction method was carried out using 40 mL of ethanol for 10 mL of Milli-Q water (80:20), from which 10 mL was extracted and stored again in “Falcon”. These solutions were subjected to a Branson® ultrasonic system, model 5210, for 30 min, and then centrifuged at 4500 rpm for 5 min at 20 °C in a Thermo Scientific® Megafuge 16R centrifuge. The samples were added to the falcons, 1.77 mg L−1 of triphenylphosphate (TPP) to serve as an internal standard in the gas chromatograph. Finally, the samples were passed through a Genevac® miVac sample concentrator.
The amount of fungicide mixture in the samples was analyzed by determining the concentration of azoxystrobin (a strobilurin present in the spray mixture) in the samples using gas chromatography coupled with mass spectrometry (GC/MS) on an Agilent Technologies 7890B GC System/5977B GC/MSD instrument with an Agilent 19091S-433 HP-5ms capillary chromatography column (30 m × 250 µm × 0.25 µm) (Figure 3). The chromatographic conditions employed an injector temperature of 290 °C. The carrier gas was high-purity helium at a constant flow rate of 1.0 mL min−1. Injections of 4 µL were made to gain sensitivity without compromising the analysis. The scan mode was m/z 35–550 with a threshold count of 150 and solvent delay of 1 min. The quadrupole was maintained at 150 °C with the ion source at 240 °C.
The GC/MS analysis methodology used was the scan mode (all ions present) and the selected ion monitoring mode, in which ions are selected by the operator for each compound according to the retention time. These two methods are essential for identification, as together, they generate more accurate detection and quantification data [10,12].
Prior to the sample readings, a calibration curve for azoxystrobin was established using a pure sample in solution with TPP. The analytical curve comprised a range of 200 to 10,000 µg L−1 and the internal standard TPP at a concentration of 2000 µg L−1. With a correlation coefficient of 99.39%, the obtained calibration curve was:
y = 0.353923x + 0.061124
where y is the concentration of azoxystrobin in the samples (µg L−1) and x is the area determined in the graph obtained by chromatography, from the retention time of azoxystrobin, which was 28.8 min. The limit of detection (LOD) and limit of quantification (LOQ) were 0.21 and 2.16 µg L−1, respectively. The recovery was greater than 88%.
With the concentrations of azoxystrobin determined in all samples, the percentages of strobilurin absorbed by the soybean leaves were calculated according to the following equation, adapted from the work of Silva [10]:
QA = [QF/(QF + QL)] × 100
in which QA is the amount of azoxystrobin absorbed by the leaf (%), QF is the amount of azoxystrobin detected in the washed leaf sample (µg L−1), and QL is the amount of azoxystrobin detected in the washing water sample (µg L−1).
While QF + QL represents the total amount of azoxystrobin applied to the leaf (µg L−1), QF represents only the amount of this active ingredient detected in the macerated leaf samples (µg L−1), and QL represents only the amount detected in the washing water (µg L−1); that is, azoxystrobin deposited on the surface and not yet absorbed by the leaf. QA, in turn, is the amount absorbed (%) by the soybean leaf, or the percentage of azoxystrobin inside the leaf, deducted from the total application of this active ingredient, detected on the leaf surface (washing water) and not yet absorbed.

2.5. Statistical Analyses

In our study, we used R software version 3.6.1 [13] for all statistical analyses. The data were checked for assumptions such as normality and homogeneity of variances using Shapiro–Wilk and Kolmogorov–Smirnov tests and Levene’s test, respectively, all at a significance level of 0.01. Afterwards, we performed variance analyses and if necessary, mean comparisons using Tukey’s test at a significance level of 0.05.

3. Results and Discussion

3.1. Physical Stability of the Spray Solution

We observed physical instabilities, in the form of sedimentation, in the spray solutions containing both fungicide and glyphosate (FG and GL), as well as crystal formation when using PA. However, all spray solutions returned to their stable state after agitation at all observation times. Additionally, we noticed constant foam formation when agitating GL. Therefore, all spray solutions were deemed physically compatible (Table 1).
The results indicated that all the tested mixtures were compatible; however, it is important to note that proper agitation is necessary to maintain the stability of the solutions, particularly over time after preparation. This is likely due to the sedimentation of the mixture components that occurs when the solutions are left to rest. In a sprayer tank, if proper agitation is not maintained or is ineffective, the stability of the solutions may be compromised.
According to Oliveira Jr. et al. [14], agitation of pesticide solutions is a key factor in maintaining the quality of tank mixtures used in crop chemical management, along with other factors such as product formulation, the order in which products are added to the solution, the preparation techniques, and the supply and storage of the sprayer prior to application.
Additionally, this study observed instances of premature instability in the GL and PA solutions, including sedimentation and crystal formation. These occurrences may be related to the physical and chemical characteristics of the products or their formulation, but they do not render these solutions unsuitable for use.
The stability of phytosanitary product formulations is crucial for their proper application. Moraes et al. [15] found that two formulations of glyphosate (soluble liquid and water-dispersible granules) when mixed with the fungicides trifloxystrobin + cyproconazole and fluazinam, and the insecticide deltamethrin, resulted in differences in suspension stability due to the presence of glyphosate. Furthermore, the soluble liquid formulation of glyphosate was incompatible with the fungicides, making application impossible.
Another important factor to consider when studying suspension stability is foam formation. Gazziero [1] showed that this is a frequent problem in the spray solution preparation. The presence of foam in the GL suspension can make application difficult, as it can lead to loss of active ingredients and an underestimation of the amount of solution in the spray tank. Moreover, the solution may become more concentrated if the amount of water was diminished [16]. However, using foam-reducing adjuvants and proper preparation techniques can mitigate this issue. There are different types of foam-reducing adjuvants, and they can work through different mechanisms. Some adjuvants work by lowering the surface tension of the liquid, while others work by destabilizing the foam bubbles directly.
Similar to our study, Avila Neto [17] found that foam formation was a common problem in mixtures involving glyphosate formulations during agitation and preparation in their study on the physical–chemical compatibility, droplet spectra, use of adjuvants, and efficacy of control of broadleaf weeds of mixtures between herbicides (auxins, glyphosate and grassicides), fungicides (trifloxystrobin + prothioconazol, azoxysistrobin + benzovindiflupir and mancozeb), and insecticides (chlorantraniliprole and thiametoxam + lambda-cyhalothrin).

3.2. Physical and Chemical Analyses

Physical and chemical analyses revealed that glyphosate and propionic acid were acidic agents in the GL and PA solutions and were the only solutions within the acidic pH range (3.30 and 4.07, respectively). In contrast, solutions formed from mixtures with oily adjuvants, MO and OO, did not show any hydrogen-ion potential outside the neutral alkaline range (Table 2). Despite this variable often being associated with physical incompatibilities of phytosanitary solutions, this was not confirmed in this study, as both acidic and neutral alkaline solutions were found to be physically stable (Table 1).
There is a potential for chemical incompatibilities when using fungicides, as they are typically neutral to alkaline in terms of pH. Using them in acidic pH ranges can result in reduced effectiveness of the fungicide. Avila Neto [17] found that pH is a key factor in determining the effectiveness of chemical control of fungi and should be carefully considered during the preparation of fungicide solutions. Changes in pH can occur when other components are added to the fungicide solution, which can lead to degradation of the fungicide and changes in the way the fungicide is absorbed by plants. Avila Neto [17] found that the ideal pH range for fungicide solutions is between 5.9 and 6.5.
In a study on the physical–chemical compatibility of fungicides and adjuvants, Ribeiro et al. [3] evaluated various fungicides in combination with mineral and vegetable oils, as well as surfactants that reduce pH. They found that different fungicides have optimal pH ranges for effectiveness, with most falling between 6.0 and 6.5. However, they also found that some fungicides have optimal pH ranges that are more acidic. When the pH of a fungicide solution becomes too acidic, there is a risk of decreased fungitoxicity due to degradation of the fungicide and the formation of precipitates.
However, as most pesticide products are not as affected by acidity as they are by alkalinity, in most situations, when preparing the pesticide solutions, the aim is to lower the pH of the mixtures [3], especially through pH-reducing adjuvants. There is a possibility of error, as each pesticide product is formulated for a specific pH range, with guarantees of stability within its shelf life, without compromising its effectiveness. Excessive changes in the pH of the pesticide formulation, due to the mixing of components in tank mixtures, can lead to loss of effectiveness and physical instabilities.
For electrical conductivity, the GL solution also stood out more in comparison to FG, with about 28 times greater capacity to conduct electricity compared to the fungicide alone. Next, the PA solution presented about two times more capacity in this variable. This can be related to the hydrogen ion potential, since the solutions with lower pH presented the highest electrical conductivity. This is probably due to the presence of salts and ions in the composition of the herbicide and adjuvant, which increase this variable. However, the effect of electrical conductivity on pesticide effectiveness is not totally clear. The solubility of a pesticide in water, plant uptake and hydrolysis can be influenced. However, detailed information is still needed to better our understanding of these processes.
Assunção et al. [18], who evaluated the physical and chemical characteristics of azoxystrobin + benzovindiflupir fungicide, glyphosate herbicide in ammonium salt, and fenpropathrin insecticide in mixtures with mineral oil adjuvant, siliconized surfactant, and propionic acid, found that reductions in the pH of the mixtures leads to increases in electrical conductivity, as observed in the present study, and propionic acid was generally responsible for these changes.
All surfactants tested were found to decrease surface tension, with no significant differences observed between solutions made with MO, PA, and OO. Even though all products studied already had additives in their formulations, the solutions made with oils (MO and OO) and propionic acid (PA) showed the greatest reductions in surface tension, indicating better potential for target coverage.
According to Zheng et al. [19], the addition of mineral oil and vegetable oil-based surfactants to the solution can improve droplet deposition on leaf surfaces by increasing the droplets’ spreading and moisturizing effects. These mixtures result in droplets with longer lifetimes before evaporation, more uniform droplet size, and greater interaction with the leaf surface. This increased interaction is due to the decreased surface tension of the suspension, which allows for smaller contact angles with the leaf.
It is important to note that the use of surfactants that greatly decrease surface tension, particularly at high application rates and in crops with leaves that are difficult to adhere to, can increase the risk of suspension loss through runoff. Thus, they must be used with caution, avoiding soil contamination.
In a study conducted by Cação et al. [20], various agricultural adjuvants, including a mineral oil and propionic acid, among others, were evaluated for their impact on droplet retention and surface tension of a spray solution applied to coffee leaves. They found that all adjuvants reduced surface tension, with mineral oil being a more effective surfactant compared to propionic acid. This contrasts with the present study, in which these adjuvants were equivalent in terms of surfactant power. The authors observed a positive correlation between reduced surface tension and decreased droplet retention on leaves. When the surface tension is reduced to a certain point, known as the flow point, excessive droplet spread and solution loss occurs.

3.3. Droplet Spectrum

It was observed that AP resulted in a decrease in droplet diameters, with a VMD of 237.69 µm, followed by GL with a VDM of 243.53 µm. However, the use of oils did not significantly impact the VMD in comparison to FG (Table 3). Although these differences exist, it should be noted that all the spectra produced, regardless of the spray in question, fall within the medium droplet class as per the classification guidelines outlined in the ASABE S572.2 standard [21].
It is crucial to highlight the significance of VMD in relation to the coverage of spray droplets on target surfaces. Droplet spectra with smaller VMDs tend to provide superior coverage; however, VMD reductions may also entail increased risks of droplet losses, particularly through drift and evaporation. Conversely, droplet spectra with high VMD values, apart from having poor coverage on target surfaces, also pose risks of losses through runoff. Therefore, proper tank mixing practices should consider the interactive effects between products to enhance coverage efficiency and minimize spray losses to the environment. However, there are no fixed values in the literature that indicate these ranges; they depend on an analysis of each situation.
Kooij et al. [22] conducted studies on spray nozzles, working pressures, and spray solutions, determining the VMD of droplets sprayed in the laboratory, viscosity, and surface tension. They found that the interaction of these parameters results in the characteristics of the spectrum. Furthermore, they suggested that the surfactant characteristics of the sprays are related to the droplet spectra, but other parameters of the application technology, such as the spray nozzle and the working pressure, also play a role in determining the VMD.
With respect to the RA, or the variations in droplet diameters, the study found that the mixture of fungicide and propionic acid produced the most uniform droplet population. Additionally, this mixture was the only one that was able to affect this variable compared to the use of fungicide alone. Landim et al. [23] also reported RA reduction with the use of this adjuvant. They found that propionic acid and lauryl ether were the major contributors to the uniformity of droplet spectra in sprays of the fungicide azoxystrobin + benzovindiflupyr.
Queiroz [24] examined the behavior of sprays containing glyphosate and 2,4-D herbicides, either alone or in combination, with or without adjuvants, and applied using hydraulic flat spray tips with and without air induction. He observed differences in the RA of the droplet spectra for some of the additives used. He found that certain mixtures did not result in more uniform spectra, as observed in the present study. According to the author, reducing the RA is preferable, as it indicates greater uniformity in the droplet spectrum and tends to lower potential drift risks due to the reduction in the percentage of droplets smaller than the VMD.
In the present study, for droplets with a diameter of less than 100 µm, which can indicate a risk of drift loss, the sprays of mixtures with adjuvants were no different from FG. The exception was GL, which had a higher possibility of droplet loss due to drift. This is likely due to the lack of an adjuvant, which would increase the VMD and reduce the RA.
Sijs and Bonn [25] conducted research on agricultural adjuvants and their impact on droplet size distribution when using single fan spray nozzles and hollow cone nozzles. They discovered that the addition of adjuvants, including orange oil, led to a decrease in the VMD. However, they were unable to predict and generalize the effects of each adjuvant on the droplet size distribution because it depends on several other factors such as the type of spray nozzle used, the mixture density of the pesticides, the working pressure, and the surface tension of the spray mixture, all of which vary with the type and concentration of the adjuvant.
These results indicate potential risks of drift loss and evaporation; however, a decrease in VMD can also be considered an improvement in the droplets’ contact area, resulting in better distribution of the droplets on the target plants. Therefore, the spectrum produced by the application of AP spray—in which phosphatidylcholine, a lecithin from soybeans, is also present—in our study should be highlighted. This mixture generated the lowest VMD and did not result in a higher number of droplets that were prone to drift loss (DV < 100 µm.) This means that droplets with larger contact areas and better target coverage were produced due to the lower RA and better uniformity among the droplet population (Table 3).

3.4. Absorption of Azoxystrobin

The mixtures with adjuvants resulted in the best outcomes, with average absorptions ranging from 55.46% to 55.76%. GL had the lowest percentage of azoxystrobin absorption inside the leaves, with an average of 36.97%. The study did not find any interaction between the time factor and the different spray mixtures (Table 4). Regardless of the spray mixture used, it took approximately 2 h for the plants to absorb an average of 72.58% of the applied solution. After 48 h, this percentage increased to 78.25%, indicating that most of the fungicide solution was absorbed within the first two hours after application.
In this study, no incompatibilities were found among the mixtures (Table 1). The results can probably be explained by the relationships between the trials conducted (Table 2). One possible explanation is that the GL spray, which had the lowest pH of all sprays (outside the normal range for fungicides, indicating it was extremely acidic), also had the lowest absorption percentage among the evaluated sprays. Additionally, the GL spray had a higher electrical conductivity compared to the other sprays, which may have affected its absorption.
The formulations of oils OM and OO demonstrated the ability to reduce surface tension, promoting greater coverage on leaves, which leads to increased spray absorption. Additionally, these oils did not lower the pH of the mixture and did not raise the electrical conductivity. Another potential benefit of these oil formulations is that they can also break down the waxy layer on soybean leaves, making it easier for fungicide sprays to be absorbed. Penetrants adjuvants dissolve or penetrate waxy layers on leaves and allow other chemicals to interface with plant cells and enter the spaces between the epidermal cells [26].
Silva [10] evaluated the effectiveness of adjuvants, including two synthetic multifunctional surfactants, a mineral oil, and a vegetable oil, on the quality of fungicide application, retention, and translocation of azoxystrobin in soybean crops. He found that the mixture with mineral oil provided the best retention results of fungicide, particularly in the first two hours after application. After this time, the other adjuvants performed similarly in terms of retention, and all performed better than the spray without any additives.
Regarding the AP spray, although it had a lower pH value due to the presence of propionic acid, it had a lower electrical conductivity compared to GL. Another advantage of the AP spray was its behavior as an adjuvant on the surface tension and droplet spectrum. AP proved to be a surfactant, which helped to improve the spread of the spray on the target and provided a more uniform droplet spectrum. Additionally, the presence of phosphatidylcholine lecithin in the composition of AP, which interacts with propionic acid, was found to be influential in the absorption of this spray. Modified lecithins are obtained from the hydrogenation/hydroxylation of natural soya lecithin and are used as penetrant/wetting agents [27].
Galvão et al. [28] evaluated the effectiveness of disease control in soybean using mixtures containing trifloxystrobin + prothioconazole and adjuvants such as aliphatic mineral oil, ester vegetable oil, orange oil, paraffin mineral oil, fulvic acid, and homemade vegetable oil. They found that the oil-based adjuvants, both vegetable and mineral, provided better disease control. According to the authors, when the spray comes into contact with the leaf surface, there is a tendency for it to runoff, resulting in a loss of the active ingredient. However, oil-based adjuvants increase the adherence of the mixture to the target and promote better spread.
Regarding the absorption times of the fungicide mixtures, the active ingredients were not immediately taken up by the metabolism of soy plants, as 100% was still on the leaf surfaces. Absorption reached a peak of 72.58% within 2 h, with little stabilization until 48 h after application. While it is not possible to say for certain when absorption ends, it is likely that after 48 h, the absorption of the fungicide mixture is minimal or nonexistent. Additionally, approximately 22% of the solution not absorbed after 48 h may have been lost to the environment through drift, runoff, evaporation, or degradation of the molecules.
Sundravadana et al. [29] studied the persistence of azoxystrobin residues in mango fruits using liquid chromatography. They found that the half-life of azoxystrobin, when applied at the recommended dose and as the sole component of the solution, was only one day. Additionally, they found that azoxystrobin persisted in plant samples for up to three days after application, with no further residues being detected on the fifth day.
Abdelraheem et al. [12] validated a method for measuring the amount of azoxystrobin in pea and pod samples using GS/MS. They found that the fungicide was present with concentrations ranging from 76.29% to 100% in both crops when the samples were analyzed 2 h after being contaminated with pure strobilurin.
There are still challenges to be addressed in future research on how different combinations of products affect the application technology for fungicides. Studies can be carried out to determine the connection between pH and electrical conductivity and how they impact the effectiveness of fungicide molecules. Additionally, research can be conducted on the selection of adjuvants to understand whether pH and conductivity should be prioritized in these decisions or if surface tension and droplet spectra should be given more consideration. A deeper understanding of how surface tension, droplet spectra, pH, and electrical conductivity of the spray impact the absorption of fungicides is needed to advance our understanding of fungicide tank mixtures.

4. Conclusions

This study investigated the physical–chemical properties, droplet spectrum, and absorption by soybean plants of mixtures of the azoxystrobin fungicide with glyphosate herbicide and different adjuvants.
There were no physical issues with mixing azoxystrobin with glyphosate and the adjuvants tested. However, it was necessary to agitate the spray mixture in all cases.
The combination of azoxystrobin with glyphosate and propionic acid resulted in a more significant decrease in pH than the other mixtures and increased the electrical conductivity of the spray solution. Additionally, all the additives examined lowered the surface tension of the fungicide spray.
All mixtures created medium droplet spectrum. However, the inclusion of glyphosate in the fungicide raised the likelihood of spray drift.
Glyphosate can reduce the ability of soy plants to absorb azoxystrobin. However, using adjuvants can improve this absorption. The most effective absorption of azoxystrobin by soy plants occurred within two hours of application. After this, the absorption level tended to be stable.
It is not recommended to mix glyphosate with azoxystrobin. Addition of an adjuvant is a good strategy to enhance the fungicide absorption, but spray solution agitation is always necessary.

Author Contributions

Conceptualization, R.M.T. and J.P.A.R.d.C.; methodology, R.M.T. and J.P.A.R.d.C.; formal analysis, R.M.T. and J.P.A.R.d.C.; writing—original draft preparation, R.M.T.; writing—review and editing, J.P.A.R.d.C. All authors have read and agreed to the published version of the manuscript.

Funding

This research was partially funded by Fundação de Amparo a Pesquisa do Estado de Minas Gerais—Brazil (FAPEMIG)—Finance Code APQ-0041-21, and Conselho Nacional de Desenvolvimento Científico e Tecnológico—Brazil (CNPq)—Finance Code 311371/2021-3.

Data Availability Statement

Not applicable.

Conflicts of Interest

The authors declare no conflict of interest.

References

  1. Gazziero, D.L.P. Misturas de agrotóxicos em tanque nas propriedades agrícolas do Brasil. Planta Daninha 2015, 33, 83–92. [Google Scholar] [CrossRef] [Green Version]
  2. Gandini, E.M.M.; Costa, E.S.P.; Santos, J.B.; Soares, M.A.; Barroso, G.M.; Corrêa, J.M.; Carvalho, A.G.; Zanuncio, J.C. Compatibility of pesticides and/or fertilizers in tank mixtures. J. Clean. Prod. 2020, 268, 122–152. [Google Scholar] [CrossRef]
  3. Ribeiro, R.P.M.; Costa, L.L.; Leão-Araújo, E.F.; Oliveira, A. Physical-chemical compatibility of fungicide sprays and adjuvants. Sci. Electron. Arch. 2021, 13, 35–41. [Google Scholar] [CrossRef]
  4. Lydy, M.; Belden, J.; Wheelock, C.; Hammock, B.; Denton, D. Challenges in regulating pesticide mixtures. Ecol. Soc. 2004, 9, 1–6. [Google Scholar] [CrossRef] [Green Version]
  5. Gandolfo, U.D. Droplet Spectrum and Drift in the Spraying of Different Herbicide Formulations. Ph.D. Thesis, Universidade Estadual Paulista, Botucatu, Brazil, 2018. [Google Scholar]
  6. Santos, F.H.; Santos, L.A.; Faria, C.M.D.R. Translocation of triazoles and strobilurins in the control of soybean powdery mildew. Appl. Res. Agrotech. 2018, 11, 87–92. [Google Scholar] [CrossRef]
  7. NBR 13875:2014; Agrotóxicos e Afins-Avaliação de Compatibilidade Físico-Química. ABNT-Brazilian Association of Technical Standards: Rio de Janeiro, Brazil, 2014; pp. 1–12.
  8. Dopierala, K.; Prochaska, K. The effect of molecular structure on the surface properties of selected quaternary ammonium salts. J. Colloid Interface Sci. 2008, 321, 220–226. [Google Scholar] [CrossRef] [PubMed]
  9. Cunha, J.P.A.R.; França, J.A.L.; Alvarenga, C.B.; Alves, G.S.; Antuniassi, U.R. Performance of air induction spray nozzle models under different operating conditions. Eng. Agric. 2020, 40, 711–718. [Google Scholar] [CrossRef]
  10. Silva, A.C.A. Performance of Adjuvants in the Quality of Application and in the Retention and Translocation of Fungicide in Soybean Crop. Ph.D. Thesis, Universidade Estadual Paulista, Botucatu, Brazil, 2013. [Google Scholar]
  11. Embrapa-Brazilian Agricultural Research Corporation. Sistema Brasileiro de Classificação de Solos, 1st ed.; Embrapa: Brasília, Brazil, 1999; 200p. [Google Scholar]
  12. Abdelraheem, E.M.H.; Hassan, S.M.; Arief, M.M.H.; Mohammad, S.G. Validation of quantitative method for azoxystrobin residues in green beans and peas. Food Chem. 2015, 182, 246–250. [Google Scholar] [CrossRef] [PubMed]
  13. R Core Team. R: A Language and Environment for Statistical Computing; R Foundation for Statistical Computing: Vienna, Austria, 2019. [Google Scholar]
  14. Oliveira, R.S., Jr.; Biffe, D.F.; Machado, F.G.; Silva, V.F.V. Mecanismos de Ação de Herbicidas. In Matology: Studies on Weeds; Barroso, A.A.M., Murata, A.T., Eds.; Word Factory: Jaboticabal, Brazil, 2021; pp. 170–204. [Google Scholar]
  15. Moraes, H.M.F.; Costa, J.O.; Pereira, G.A.M.; Souza, W.M.; Silva, A.A.; Paixão, G.P. Physical compatibility and stability of pesticide mixtures at different spray volumes. Planta Daninha 2018, 37, 1–8. [Google Scholar] [CrossRef]
  16. Maciel, C.D.G.; Guera, N.; Oliveira Neto, A.M.; Poletine, J.P.; Bastos, S.L.W.; Dias, N.M.S. Tensão superficial estática de misturas em tanque de glyphosate + chlorimuron-ethyl isoladas ou associadas com adjuvantes. Planta Daninha 2010, 28, 673–675. [Google Scholar] [CrossRef]
  17. Avila Neto, R.C. Mixtures, Adjuvants, Water Hardness and Ph Interfere in the Application of Auxin Mimetic Herbicides. Master’s Dissertation, Universidade Federal de Santa Maria, Santa Maria, Brazil, 2021. [Google Scholar]
  18. Assunção, H.H.; Campos, S.F.B.; Sousa, L.A.; Lemes, E.M.; Zandonadi, C.H.S.; Cunha, J.P.A.R. Adjuvants plus phytosanitary products and the effects on the physical-chemical properties of the spray liquids. Biosci. J. 2019, 35, 1878–1885. [Google Scholar] [CrossRef]
  19. Zheng, L.; Cao, C.; Chen, Z.; Cao, L.; Huang, Q.; Song, B. Efficient pesticide formulation and regulation mechanism for improving the deposition of droplets on the leaves of rice (Oryza sativa L.). Pest Manag. Sci. 2021, 77, 3198–3207. [Google Scholar] [CrossRef] [PubMed]
  20. Cação, J.E.C.R.; Moreira, B.R.A.; Raetano, C.G.; Carvalho, F.K.; Prado, E.P. Spray retention on coffee leaves associated with type and concentration of adjuvants. Eng. Agríc. 2019, 39, 623–629. [Google Scholar] [CrossRef]
  21. Asabe-American Society of Agricultural and Biological Engineers. Spray Nozzle Classification by Droplet Spectra; ASAE S572.2; ASABE: St. Joseph, MI, USA, 2018; pp. 1–6. [Google Scholar]
  22. Kooij, S.; Sijs, R.; Denn, M.M.; Villermaux, E.; Bonn, D. What determines the drop size in sprays? Phys. Rev. X 2018, 8, 031019. [Google Scholar] [CrossRef] [Green Version]
  23. Landim, T.N.; Cunha, J.P.A.R.; Alves, G.S.; Marques, M.G.; Silva, S.M. Interactions between adjuvants and the fungicide azoxystrobin+benzovindiflupyr in hydraulic spraying. Eng. Agríc. 2019, 39, 600–606. [Google Scholar] [CrossRef]
  24. Queiroz, M.F.P. Droplet Spectrum and Physical Characteristics of Sprays with Surfactant Adjuvants and the Herbicides Glyphosate and 2,4-d, Alone and in Mixture. Master’s Dissertation, Universidade Estadual Paulista, Botucatu, Brazil, 2018. [Google Scholar]
  25. Sijs, R.; Bonn, D. The effect of adjuvants on spray droplet size from hydraulic nozzles. Pest Manag. Sci. 2020, 6, 3487–3494. [Google Scholar] [CrossRef] [PubMed] [Green Version]
  26. Xu, L.; Zhu, H.; Ozkan, H.E.; Bagley, W.E.; Derksen, R.C.; Krause, C.R. Adjuvant effects on evaporation time and wetted area of droplets on waxy leaves. Trans. Asabe 2010, 53, 13–20. [Google Scholar] [CrossRef]
  27. Menendez, J.; Camacho, D.; Fernandez-Cerejido, M.; Bastida, F. Effect of tank-mixed blended green adjuvants on glyphosate efficacy in four winter crop weed species. Weed Res. 2011, 51, 344–352. [Google Scholar] [CrossRef]
  28. Galvão, R.F.; Ecco, M.; Riffel, R.C.; Barbosa, A.P. Uso de diferentes adjuvantes na aplicação de fungicida na cultura da soja. Res. Soc. Dev. 2021, 10, 1–12. [Google Scholar] [CrossRef]
  29. Sundravadana, S.; Alice, D.; Samiyappan, R.; Kuttalam, S. Determination of azoxystrobin residue by UV detection high performance liquid chromatography in mango. J. Braz. Chem. Soc. 2008, 19, 60–63. [Google Scholar] [CrossRef]
Figure 1. Detail of plant exposure to spraying.
Agriengineering 05 00041 g001
Figure 2. Detail of sample preparation for extracting azoxystrobin.
Agriengineering 05 00041 g002
Figure 3. Equipment used to perform gas chromatography coupled to mass spectrometry.
Agriengineering 05 00041 g003
Table 1. Physical stability and compatibility of fungicide spray solutions at different observation times (0, 2, 6 and 24 h): fungicide only (FG), fungicide + glyphosate (GL), fungicide + mineral oil (MO), fungicide + propionic acid (PA), fungicide + orange oil (OO).
Spray SolutionTime (h)Compatibility
02624
FG+Compatible, under agitation
GL *++Compatible, under agitation
MO+Compatible, under agitation
PA++++Compatible, under agitation
OO+Compatible, under agitation
(−) Physical stability of the spray solution. (+) Physical instability of the spray solution. * Foam formation.
Table 2. Hydrogen-ion potential (pH), electrical conductivity (µS cm−1), and surface tension (mN m−1) of different fungicide solutions in mixture with glyphosate or adjuvants.
Spray SolutionpHElectrical Conductivity (µS cm−1)Surface Tension (mN m−1)
FG8.22 a69.50 d46.97 a
GL3.30 d1970.00 a45.89 a
MO7.57 b79.50 d42.02 b
PA4.07 c132.25 b41.35 b
OO7.50 b105.00 c40.44 b
Fc1692.00 *32,557.00 *31.79 *
W0.960.930.97
FLevene0.901.433.23
C.V. (%)1.801.972.38
Means followed by distinct letters in columns differ from each other according to Tukey’s test at 0.05. Fc; W; FLevene: calculated F value; statistics from the Shapiro–Wilk and Levene tests, respectively. C.V.: coefficient of variation. Values in bold indicate residues with normal distribution and homogeneous variances at 0.01. * Significant at 0.01. Fungicide (FG), fungicide + glyphosate (GL), fungicide + mineral oil (MO), fungicide + propionic acid (PA), fungicide + orange oil (OO).
Table 3. Volume median diameter (VMD, µm), relative amplitude (RA), and percentage of sprayed droplet volume with diameters smaller than 100 µm (DV < 100 µm, %) as a function of different fungicide solutions in mixture with glyphosate or adjuvants.
Spray SolutionVMD (µm)RADV < 100 µm (%)
FG263.81 c1.47 b7.49 b
GL243.53 b1.54 b9.56 a
OM250.66 bc1.46 b7.84 ab
AP237.69 a1.32 a8.24 ab
OO266.78 c1.50 b 7.65 ab
Fc33.55 *6.64 *3.30 *
W0.950.960.95
FLevene1.310.840.14
C.V. (%)1.724.4711.23
Averages followed by different letters in the columns according to Tukey’s test at 0.05. Fc; W; FLevene: calculated F value; statistics of Shapiro–Wilk and Levene tests, respectively. C.V.: coefficient of variation. Values in bold indicate residuals with normal distribution and homogeneous variances at 0.01. * Significant at 0.01. Fungicide (FG), fungicide + glyphosate (GL), fungicide + mineral oil (OM), fungicide + propionic acid (AP), fungicide + orange oil (OO).
Table 4. Absorption of azoxystrobin (%), applied alone or with glyphosate or adjuvants, evaluated over time after application (0, 2 and 48 h) in soybean leaves.
Spray SolutionHours after Application (h)Average
0248
FG0.0067.0578.3848.48 a b
GL0.0058.9451.9736.97 b
OM0.0078.9188.2355.71 a
AP0.0075.6688.6254.76 a
OO0.0082.3184.0855.46 a
Average0.00 B72.58 A78.25 A
FCalda = 5.16 *; FTempo = 255.23 *; FCalda × Time = 1.75 ns
W = 0.74; FLevene = 7.43
C.V. (%) = 24.29
Means followed by different letters, upper case in the row and lower case in the column, differed according to Tukey’s test at 0.05. Fc: calculated F value; W; FLevene: statistics of the Shapiro–Wilk and Levene tests, respectively. C.V.: coefficient of variation. * Significant at 0.01. ns Not significant. Fungicide (FG), fungicide + glyphosate (GL), fungicide + mineral oil (OM), fungicide + propionic acid (AP), fungicide + orange oil (OO).
Disclaimer/Publisher’s Note: The statements, opinions and data contained in all publications are solely those of the individual author(s) and contributor(s) and not of MDPI and/or the editor(s). MDPI and/or the editor(s) disclaim responsibility for any injury to people or property resulting from any ideas, methods, instructions or products referred to in the content.

