
Tomato Leaf Diseases Classification Based on Leaf Images: A Comparison between Classical Machine Learning and Deep Learning Methods


1
Modern Agricultural Equipment Research Institute, Xihua University, Chengdu 610039, China
2
School of Mechanical Engineering, Xihua University, Chengdu 610039, China
3
College of Biosystems Engineering and Food Science, Zhejiang University, Hangzhou 310058, China
*
Authors to whom correspondence should be addressed.
AgriEngineering 2021, 3(3), 542-558; https://doi.org/10.3390/agriengineering3030035
Submission received: 13 May 2021
/
Revised: 19 June 2021
/
Accepted: 7 July 2021
/
Published: 9 July 2021
(This article belongs to the Special Issue Information and Communications Technology in Agriculture)
Abstract
:Tomato production can be greatly reduced due to various diseases, such as bacterial spot, early blight, and leaf mold. Rapid recognition and timely treatment of diseases can minimize tomato production loss. Nowadays, a large number of researchers (including different institutes, laboratories, and universities) have developed and examined various traditional machine learning (ML) and deep learning (DL) algorithms for plant disease classification. However, through pass survey analysis, we found that there are no studies comparing the classification performance of ML and DL for the tomato disease classification problem. The performance and outcomes of different traditional ML and DL (a subset of ML) methods may vary depending on the datasets used and the tasks to be solved. This study generally aimed to identify the most suitable ML/DL models for the PlantVillage tomato dataset and the tomato disease classification problem. For machine learning algorithm implementation, we used different methods to extract disease features manually. In our study, we extracted a total of 52 texture features using local binary pattern (LBP) and gray level co-occurrence matrix (GLCM) methods and 105 color features using color moment and color histogram methods. Among all the feature extraction methods, the COLOR+GLCM method obtained the best result. By comparing the different methods, we found that the metrics (accuracy, precision, recall, F1 score) of the tested deep learning networks (AlexNet, VGG16, ResNet34, EfficientNet-b0, and MobileNetV2) were all better than those of the measured machine learning algorithms (support vector machine (SVM), k-nearest neighbor (kNN), and random forest (RF)). Furthermore, we found that, for our dataset and classification task, among the tested ML/DL algorithms, the ResNet34 network obtained the best results, with accuracy of 99.7%, precision of 99.6%, recall of 99.7%, and F1 score of 99.7%.
1. Introduction
A series of diseases has threatened crop production, resulting in large losses in fresh and processed crop production. These diseases are caused by several factors, including fungal, bacterial, and viral infections [1,2]. Most of the foliar diseases, such as late blight, target, and bacterial spots, are favored by warm temperatures or prolonged periods of wetness, which are typical in most tomato-producing areas.
Advancements in agricultural technology have offered opportunities for plant detection through spectroscopy [3,4,5,6,7]. Ground-level reflectance spectra can be obtained for the in-field detection of plant nitrogen [8,9,10]. Spectral features of the spectra have been analyzed in leaves to estimate crop yield [11], detect variations in leaf area index [12], characterize agricultural crop biophysical variables [13], and differentiate diseases [14]. Different diseases are often associated with specific physiological and visual changes in their host plants. Some studies have reported the use of non-destructive methods to detect leaf diseases on certain varieties [15,16,17].
Computer vision technology is another kind of effective non-destructive method for plant detection, which has the advantages of having a small impact on the environment and a reasonable price. Moreover, one of the most obvious symptoms of plant disease is scars on leaves. Compared with the healthy leaves, the diseased ones are distributed on the spot with uneven leaf color or irregular texture. Furthermore, the disease spot shape of diseased leaves is different. The various imaging methods and the illumination environment stability have been studied in the laboratory. Many researchers have investigated the various imaging methods and disease feature extraction approaches. They have used scientific methods to capture the leaf images and establish classification models [18,19,20,21].
At present, the highest classification accuracy rate for plant diseases in the laboratory-based machine vision technology reaches 100% [14,22]. It achieved the same maximum accuracy as the spectral technique. However, the calculation of image feature extraction or selection is complex. Specific features have high accuracies in distinguishing certain types of plant or disease species. If plant variety or disease species is changed, the feature extracting steps, such as image segmentation or spectral processing, need to be renewed. When the type of disease changes, the accuracy of disease classification is reduced. Nowadays, deep learning (DL) algorithms, especially those based on convolutional neural networks (CNNs), which is a subset of DL, are widely used in plant disease classification tasks [23,24,25,26]. In our previous work [22], we studied spectral and image data reduction methods for multi-diseased leaves with similar symptoms regardless of the plant variety. In the present study, we aimed to perform in-depth research on the classification of diseased crop leaves. Since the performance of ML models changes with the dataset and the problem to be solved, the objective of our study was to identify the traditional ML or DL algorithms with the highest classification accuracies based on the PlantVillage dataset and the tomato disease classification problem [27].
This study was specifically designed, firstly, to preprocess images from a public image dataset (PlantVillage) and extract image features (color and texture features). Then, classical ML algorithms, including the support vector machine (SVM), k-nearest neighbor (kNN), and random forest (RF) algorithms, and DL classification networks (AlexNet, VGG16, ResNet34, EfficientNet-b0, and MobileNetV2) were implemented to classify tomato diseases. Finally, we compared the classification results of machine learning and deep learning algorithms and aimed to identify the most suitable ML/DL models for the PlantVillage dataset and the tomato disease classification problem.
2. Materials and Methods
2.1. Image Acquisition
The image data were collected from a publicly available plant image database called “PlantVillage” [28]. It comprises images of plant leaves taken in a controlled environment [29]. The dataset includes over 50,000 images of 14 crops, such as tomato, grape, apple, corn, and soybean.
We used all the tomato images from the “PlantVillage” dataset, which contained 10 classes, for our research, including healthy images. The number of diseased leaf images varied from 373 to 5357 for each disease class, as is shown in Table 1. The healthy class contained 1591 images.
From Table 1, we can see that the number of each class was not balanced: the minimum value was 373, but the maximum value was 5357. We knew that if there was one class with a particularly large number of images, the classification network would be biased towards this class. To solve this problem, we reorganized the entire dataset so that the number of images in each category was between 1500 and 2000. For the three categories (early blight, leaf mold, and tomato mosaic virus), we increased the numbers of images from 1000, 952, and 373 to 2000, 1904, and 1492, respectively, using traditional image data augmentation methods, such as adjustment of the contrast and brightness and flipping the images horizontally. For tomato yellow leaf curl virus (TYLCV) diseases, we decreased the number of images from 5357 to 1985. The number distributions of the original dataset and the reorganized dataset can be seen in Figure 1.
Examples of each of the categories are provided in Figure 2. Images in the database were all RGB images. The symptoms of diseases varied from color changes to spots on leaves. Some diseases had similar symptoms, like obvious color change (e.g., early blight, late blight, and TYLCV). The dataset used in this work had many classes, containing a total of 10 types. When we want to classify high-dimensional data, but it is not clear whether the dataset has good separability—that is, the intervals between the same types are small, and the intervals between different types are large—we can use the t-distributed stochastic neighbor embedding (t-SNE) [30] algorithm to project high-dimensional data into two- or three-dimensional space for observation. If the data have separability in the low-dimensional space, the dataset is definitely divisible. To verify the separability of our dataset, we used the t-SNE algorithm to project the images into three-dimensional space and observed the separability of the dataset. The projection result is shown in Figure 3. Pictures of the same classes were on the same plane, while pictures of different classes were on different planes; that is, in a three-dimensional space, our dataset was separable. From Figure 3 we can clearly see that our data were highly separable.
As shown in Figure 4, besides image augmentation, we used various other image pre-processing operations, including resizing, background segmentation, gray processing, and channel decomposition. Firstly, we resized all images to 256 × 256 pixels. For the regularized process of data collection in the case of the PlanVillage dataset, which was judged to have the potential to introduce some inherent bias in the dataset [31], all images were segmented. Following Radovanovic et al. (2020) [29], in order to extract protentional infected tomato leaf areas, we removed all pixels for which green channel value exceeded those of the red and blue channels. Disease symptoms, like color change, are obvious in some diseases (e.g., early blight, late blight, TYLCV). So, for implementation of the machine learning algorithms, besides extracting texture features, we also extracted color features. After background segmentation, we performed channel decomposition (RGB to R, G, and B) and gray processing (RGB to gray). Then, we selected single-channel images (R, G, B, and gray) for texture and color features extraction. Finally, the extracted features were input into machine learning classifiers for the classification task.
2.2. Texture Features Extraction
Texture features [32,33,34] of leaves were extracted using the gray level co-occurrence matrix (GLCM) [35]. The results are represented as , which can be further normalized using Equation (1) [36]:
where is the normalized matrix element value, and is the summation of all leaf pixel element values in the matrix. Further, and are defined as the gray values of pixels of and , respectively ( and are located along the x-coordinate, whereas and are located along the y-coordinate, and the x-coordinate is the column of the grayscale image, whereas the y-coordinate is the row of the grayscale image); and are any two points in the grayscale image; is the distance between and ; and is the angle between and , which can be 0°, 45°, 90°, or 135°.
The following four parameters [14,37] are then calculated in four directions (0°, 45°, 90°, and 135°) using Equations (2)–(5) to represent the gray distribution and texture roughness of the leaf area:
the angular second moment ():
the entropy ():
the contrast ():
and the correlation ():
where
The four parameters (, , , ) were used to represent the textures features of the image. As mentioned above, each parameter has four directions. In this study, we used a step-size of 1 pixel and used four angles (0°, 45°, 90°, and 135°) for both segmented images and images with removed green pixels. For each GLCM, we calculated four features (, , , ). In total, we extracted 32 texture features with the GLCM method.
The local binary pattern (LBP) was first proposed by Ojala et al. in 1994 [38]. It is used for texture feature extraction and has significant advantages, such as rotation invariance and gray invariance. The original LBP operator is defined as in a 3 × 3 window, with the central pixel of the window as the threshold and the gray values of the adjacent 8 pixels are compared with it. If the adjacent pixel value is larger than the threshold, then the position of the adjacent pixel is marked as 1; otherwise it is marked as 0. In this way, 8 eight in the 3 × 3 neighborhood can be compared to generate an 8-bit binary number [39,40,41] (usually converted to a decimal number using LBP code); that is, the LBP value of the center pixel of the window is obtained and this value is used to reflect the texture of the area.
Following the introduction of the original LBP operator, researchers have continued to propose various improvements and optimizations. For example, the uniform pattern proposed by Ojala et al. [42] solves the problem of excessive binary modes. The rotation invariant pattern proposed by Maenpaa et al. [43] is more robust for image rotation. In this study, we used a uniform pattern with bins = 10. With the LBP method, we also extracted texture features from segmented images and images with removed green pixels. In total, we extracted 20 texture features with the LBP method.
2.3. Color Features Extraction
For color feature extraction, we used two methods, the color moment and color histogram. In 1995, Stricker and Orengo [44] proposed the color moment, which is a simple and effective method for color feature representation. Since the color information is mainly distributed in low-order moments, the first moment (the mean), the second moment (the variance), and the third moment (the skewness) are sufficient to express the color distribution of an image. In this study, we used the mean, standard deviation (the square root of the variance), and skewness parameters [44] to extract color features. The three parameters can be obtained using Equations (6)–(8).
Mean ():
Standard deviation ():
Skewness ():
where represents the i-th color component of the j-th pixel of a color image and represents the number of pixels in the image. With the color moment, we calculated three features (mean, standard deviation, and skewness) for the R, G, and B channels. In total, we calculated nine color features with the color moment.
Michael et al. [45] first proposed the color histogram as a representation method for image color features. The color histogram can simply describe the global distribution of colors in an image; that is, the proportion of different colors in the image that are not affected by image rotation and translation changes. We calculated a color histogram with 32 buckets per channel and used the pixel count per bucket as the features, which, multiplied by 3 channels, gave us 96 features [29].
As shown in Figure 5, after pre-processing, we extracted color features and texture features for the classification of tomato diseases. To extract color features, we used two methods, the color moment and color histogram. For the color moment, we used three features (mean, skewness, and standard deviation) per color channel (R, G, and B), resulting in nine features in total. For the color histogram, we calculated a histogram with 32 buckets per channel (R, G, and B) and used the pixel count per bucket as the features, which gave us 96 features in total. In total, we obtained 105 color features. To extract texture features, we also used two methods, the GLCM and LBP methods. For the GLCM method, we calculated four GLCMs for both segmented images and images with removed green pixels. We used four angles (0°, 45°, 90°, and 135°) and one distance (1 pixel). For each GLCM, we calculated four features (ASM, ENT, CON, and COR). In total, we extracted 32 texture features with the GLCM method. For the LBP, we selected the uniform pattern and set the value of bins to 10. With the LBP, we also used segmented images and images with removed green pixels. Thus, we extracted 20 texture features with the LBP method; that is to say, we had 52 texture features in total. Finally, we selected the extracted color and/or texture features and input them into the machine learning classifiers.
2.4. Machine Learning Classification Methods
In this study, we used both machine learning and deep learning algorithms to classify tomato diseases in PlantVillage. This study aimed to compare the performance of ML (kNN, SVM, and RF) and DL (VGG16, VGG19, ResNet34, ResNeXt50(32×4d), EfficientNet-b7, and MobileNetV2) methods in terms of tomato disease classification. Although there are many ML/DL methods discussed in the literature, we chose these nine ML/DL methods because they are widely used and judged to be effective in the community.
For every leaf sample, there were four images, which were R, G, and B component images and gray images. From these images, 157 texture features and color features were calculated. In this way, the spatial information was transferred into numerical values that could be estimated in a classifier for classification. The calculated features of all samples were randomly divided into a training set and a testing set at the ratio of 4:1. Three classifiers were evaluated in this study: kNN, SVM, and RF.
The kNN algorithm is a simple classifier that works well for basic recognition problems in machine learning techniques [46]. When predicting a new sample to be tested, kNN determines which class the sample belongs to based on its distance to its nearest k sample points. That is, if most of these k samples belong to a certain class, the sample to be tested also belongs to this class. This method is easy to implement and can obtain good results if the neighbors (the k value) are chosen carefully. When k has a different value, the results change. A small k value may result in the model overfitting the data, while a large k value requires too much computation time and would make predictions incorrect. In our study, variations in the parameter k from 5 to 10 did not change the accuracy much, so we only present the best accuracy with k varying from 5 to 10.
The SVM algorithm [47] is a machine learning algorithm that uses statistical learning theory to solve binary classification problems. C is a very important parameter of the SVM model that reflects the tolerance of errors. The smaller the penalty parameter C is, the smaller the misclassification penalty is, and vice versa. In the case of nonlinear separability of samples, the SVM algorithm introduces a kernel function to map the sample features to higher dimensions, so that the samples are linearly separable in the high dimensional space, which transforms the difficult-to-solve nonlinear problem into the easier-to-solve linear problem. The commonly used kernel functions include the linear, polynomial, Gaussian, sigmoid, and radial basis function kernels. We experimented with different configurations and found that the best results were obtained by using the radial basis function kernel and the parameter C = 100.
The random forest (RF) algorithm, developed by Breiman in 2001 [48], is a combinatorial classifier based on multiple decision trees, and the final result is determined by multiple decision trees by voting. The steps of implementing the RF algorithm are as follows: First, the number of trees is determined according to the actual demand. Then, the data are sampled independently and used to train the decision trees. The decision trees are combined and the final classification result is obtained by voting. The number of trees and criteria are important parameters of the RF algorithm. In our work, the best parameters were obtained by GridSearchCV, with the number of trees set to 24 and the criterion set to entropy.
2.5. Deep Learning Classification Methods
Deep learning does not need a lot of artificial feature engineering like traditional machine learning (such as the SVM and kNN algorithms). For example, CNNs, one example of DL models, have a strong feature learning ability. CNNs can map data into multiple layers and then learn layer-by-layer, so that some useful features can be learned from a large amount of data. The deep learning classification model usually includes a convolutional layer, a pooling layer, and a fully connected layer. The convolutional layer is mainly used to extract features of plant leaf images. The shallow convolutional layer is used to extract some edge and texture information, the middle layer is used to extract complex texture information and part of the semantic information, and the deep layer is used to extract high-level semantic features. The convolutional layer is followed by a max-pooling layer, which is used to retain the important information in the image. At the end of the architecture is a classifier consisting of full connection layers, which is used to classify the high-level semantic features extracted by the feature extractor.
In this study, the size of the input image was set to be 256 × 256 × 3. It was composed of many slices in the depth direction. One slice corresponds to many neurons. The weight in neurons can be thought of as the convolution kernel, which is a square filter, such as 16×16, 9 × 9 or 5 × 5. These neurons respectively correspond to a local area in the image that is used to extract the feature of the region. Assume that the size of the input image is , the size of the convolution kernel is , and the mobile stride of the convolution kernel is (generally = 2). Padding is used to fill in the input image boundary (usually = 0). The size of the image after convolution is .
Each output map feature combines multiple input maps with convolutions. Generally, the output can be denoted with Equation (9):
where l represents the l layer, represents the convolutional kernel, represents the bias, and represents a set of input maps. In-depth implementations of CNNs may use a sigmoid function, a tanh function, or an additive bias. For example, the value of the unit at the position in the -th feature map and the -th layer, denoted as , is given in Equation (10):
where is the sigmoid function, is the bias for the feature map, and are the height and width of the kernel, and is the kernel weight value at the position connected to the layer. The parameters of CNNs, such as the bias and the kernel weight , are usually trained using unsupervised approaches.
For image classification tasks, various deep learning classification models have been developed. In this work, we used six deep learning classification models: AlexNet, VGG16, ResNet34, EfficientNet-b0, and MobileNetV2.
Figure 6 shows the whole process of this study. After the tomato dataset was preprocessed, in order to use machine learning methods to classify tomato diseases, we extracted disease features manually. The deep learning classifier could automatically extract features, so manual feature extraction was unnecessary in this respect. The preprocessed images and the extracted features were input into the DL and ML networks, respectively, for training. After the training process was completed, we obtained the trained models. Then, we classified the test dataset by using the trained model.
Our implementation was based on the PyTorch framework and PyCharm Integrated Development Environment. The experiment was conducted on a single-CPU/single-GPU platform; the models of the CPU and GPU were an Intel (R) Core (TM) i5-9400F CPU @ 2.90GHz and an NVIDIA GeForce RTX 2060 SUPER, respectively.
3. Results and Discussion
After preprocessing, the experimental dataset contained a total of 17,859 tomato disease images. The preprocessed dataset was split into training and testing subsets with proportions of 80% and 20%. The deep learning models automatically extracted disease features through a series of convolution operations, without manual extraction. However, for machine learning algorithms, the feature extraction process had to be done manually. Therefore, the features manually extracted earlier were only used for the machine learning methods. The classification results of the deep learning and machine learning methods were evaluated by different evaluation metrics, and the accuracy, precision, recall, and F1 score (F1) were included. The four evaluation metrics were calculated using Equations (11)–(14).
Accuracy:
Precision (P):
Recall (R):
F1-scorre (F1):
where true positive () is the correctly predicted positive values, false positive () is the incorrectly predicted positive values, true negative () is the correctly predicted negative values, and false negative () is the incorrectly predicted negative values.
3.1. Results of Tested ML/DL Algorithms
First of all, for the machine learning used for the tomato leaf disease classification, different features previously extracted manually were used to train the same classifier to determine which features showed the best classification performance. Then, the features with the best classification results were used to train different machine learning classifiers. In this way, we could explore the impact of feature extraction methods and classifiers on the classification results. To explore the impact of different feature extraction methods on the classification results, we combined different extracted features: (a) when only texture or color features were used, we used the LBP, GLCM, LBP + GLCM, and the color moment + color histogram (COLOR); and (b) when texture and color features were used simultaneously, we used the COLOR + GLCM, COLOR + LBP, and all methods combined (ALL; COLOR, LBP, and GLCM).
The classification results for the kNN classifier with different feature extraction methods are shown in Table 2. Table 2 shows the different classification results obtained using different feature extraction methods (LBP, GLCM, LBP + GLCM, COLOR, COLOR + GLCM, COLOR + LBP, and COLOR + LBP + GLCM) for each disease type with the KNN classifier. The first column in Table 2 indicates the ten categories of our dataset, and the remaining columns indicate the precision and recall values for a particular class under different feature extraction methods. For the convenience of presentation, the table mainly lists the results of two evaluation metrics (precision and recall). As shown in Table 2, using the same feature extraction method for different tomato diseases resulted in different recognition results. For example, using the GLCM or COLOR feature extraction methods, the recognition results for the target spot and bacterial spot diseases were relatively good, but poor for the TYLCV disease. One possible reason is that the color and texture characteristics of the diseases with better recognition results were more obvious. Furthermore, from the comparison in Table 2, it can be seen that, among all the feature extraction methods, the COLOR + GLCM method obtained the best results. For example, for the same disease, bacterial spot, the precision and the recall of the COLOR + GLCM method were 85.0% and 97.0%, respectively; both evaluation metrics were higher than those of any of the other feature extraction methods. This shows that, in the classification task, the quality of extracted features directly affected the final classification result, and it is not that the higher the dimension of the extracted features, the better the result. Researchers should design appropriate feature extraction schemes based on disease characteristics.
From Table 2 we can see that, among the seven feature extraction methods, COLOR+GLCM resulted in the best results; therefore, in the ensuing research, for the machine learning methods, we only used the features extracted with the COLOR+GLCM method.
Table 3, shows the different classification results of three machine learning classifiers (the kNN, SVM, and random forest algorithms) and five deep learning networks (AlexNet, VGG16, ResNet34, EfficientNet-b0, and MobileNetV2). For metrics, we used accuracy, precision, recall, and F1 score. Precision, recall, and F1 score were macro-averaged for this multi-classification problem.
From Table 3, we can see that the metrics of the tested deep learning networks were all better than those of the measured machine learning algorithms. For example, the accuracy of the tested machine learning methods was 82.1% (kNN), 91.0% (SVM), and 82.7% (RF), while for the tested deep learning algorithms, it was 92.7% (AlexNet), 98.9% (VGG16), 99.7% (ResNet34), 98.9% (EfficientNet-b0), and 91.2% (MobileNetV2). The values of all the tested metrics were higher than 82.0% of tested machine learning methods and higher than 91.0% of tested deep learning algorithms. Among the three tested machine learning methods, the classification results of the SVM algorithm were the best, followed by those of the RF algorithm, and finally the kNN algorithm. Meanwhile, the order of the classification results for the tested deep learning algorithms, from high to low, was ResNet34, EfficientNet-b0, VGG16, AlexNet, and finally MobileNetV2.
3.2. Discussion
To better present the classification results, we used confusion matrix plots and receiver operator characteristic (ROC) curves to show the different classification results for each tomato class with different ML/DL algorithms. Figure 7 shows the confusion matrix plots of the three tested machine learning algorithms. In a confusion matrix plot, the abscissa is the true label and the ordinate is the predicted label. The diagonal of the confusion matrix holds the data of the correctly classified instances, and the values above and below the diagonal are the incorrectly classified instances [49]. As shown in Figure 7, with the three machine learning methods (kNN, SVM, and RF) there were many cases (<13.0%) where the bacterial spot and early blight diseases were identified as leaf mold disease. For the kNN algorithm, the ratios of bacterial spot and early blight diseases being identified as leaf mold disease were 9.0% and 13.0%, respectively; for the SVM algorithm, they were 3.0% and 6.0%, respectively; and for the RF algorithm, they were 5.0% and 11.0%, respectively. Similarly, there were many cases where leaf mold disease was identified as the bacterial spot and early blight diseases. What caused this phenomenon? By observing the experimental dataset, we found that the disease characteristics of these three diseases were relatively similar compared to other diseases, which may explain this phenomenon. Figure 7 shows that, with regard to incorrect predictions, the ratio of diseases being wrongly identified as leaf mold disease was the highest. This phenomenon indicates that there was an overfitting problem in our experiment, so we must expand our experimental dataset in our future work.
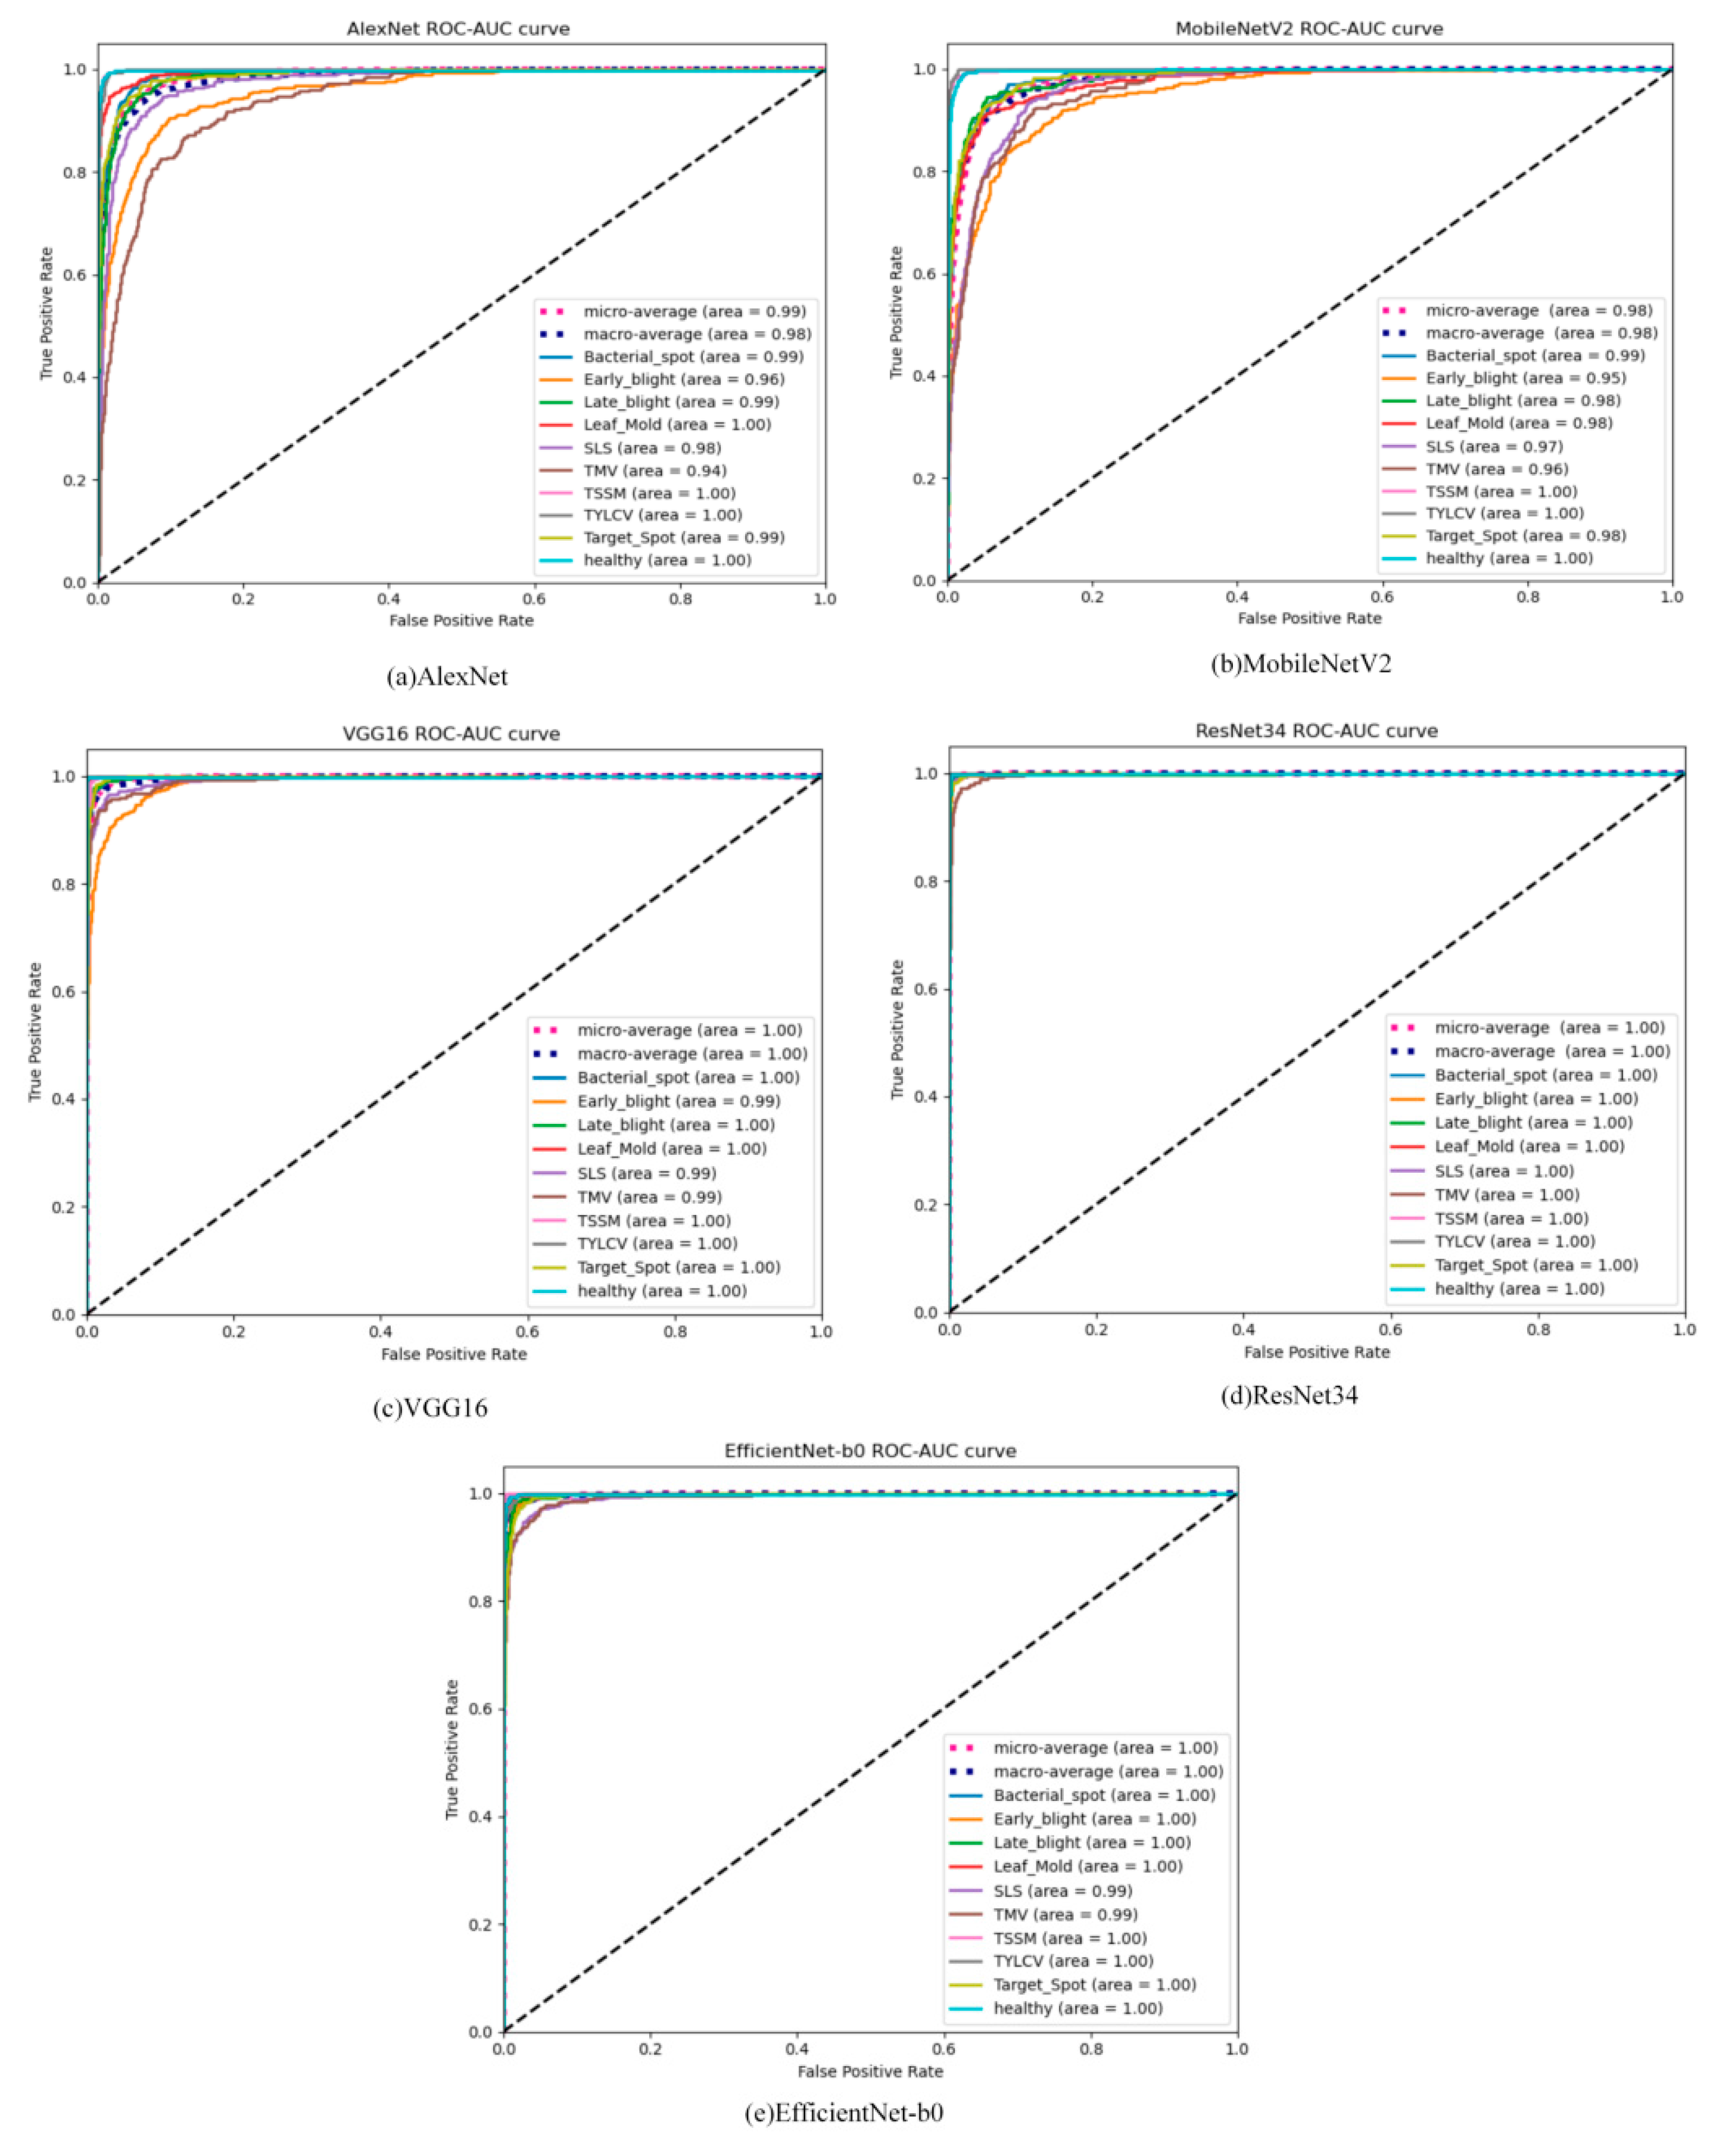
Figure 8 shows the ROC curves of the five tested deep learning networks. As shown in the figure, the areas under the curve (AUCs) for each tomato class with different deep learning networks were higher than 94.0%; some even reached 100%. From Figure 8, we can see that the ResNet34 algorithm obtained the best result, for which the AUCs for each tomato class were as high as 100%. Although the AlexNet and MobileNetV2 networks obtained results that were not as good as the other tested deep learning models, they had fewer model parameters and shorter running times. As shown in Figure 8, for the same algorithm, the classification results for different types were different. This means that the performance of each algorithm varied from dataset to dataset. Therefore, it is important to choose the right model for specific data and tasks. It can be seen from Table 3 and Figure 8 that for our dataset and classification task, among the tested ML/DL algorithms, the ResNet34 network obtained the best results.
4. Conclusions
The quality and quantity of tomato plants are affected by disease attacks. This study aimed to identify the most suitable ML/DL models for the PlantVillage dataset and the tomato disease identification problem, and we found that the performance of each ML/DL model varied from dataset to dataset and from problem to problem. In this study, we tested three machine learning algorithms (kNN, RF, and SVM), and five deep learning algorithms (AlexNet, VGG16, ResNet34, EfficientNet-b0, and MobileNetV2) for their classification of tomato diseases. The influence of the quality of the extracted features on the classification results was studied. We extracted 52 texture features with the LBP and GLCM methods and 105 color features with the color moment and color histogram methods for the implementation of the machine learning models. Through comparative experiments, we found that, for the machine learning models, the quality of the extracted features ad a great impact on the final classification results. Among all the feature extraction methods, the COLOR+GLCM method obtained the best results. We also found that, for different tomato diseases, using the same feature extraction method would result in different recognition results. By undertaking comparisons of the methods, we found that the metrics (accuracy, precision, recall, and F1 score) of the tested deep learning networks were all better than those of the measured machine learning algorithms. The values of all the tested metrics were found to be higher than 82.0% for the tested machine learning methods and higher than 91.0% for the measured deep learning algorithms. Furthermore, we found that, for our dataset and classification task, among the tested ML/DL algorithms, the ResNet34 network obtained the best results, with an accuracy of 99.7%, precision of 99.6%, recall of 99.7%, and F1 score of 99.7%, which meets the accuracy requirements of disease classification. In future work, we will try to deploy the tested ML algorithms with a mobile phone, which will be of more practical value.
Author Contributions
Conceptualization, J.L., H.J.; Supervision, J.L.; Visualization, J.L., H.J.; Writing—Original Draft Preparation, L.T.; Writing—Review & Editing, L.T., J.L. All authors have read and agreed to the published version of the manuscript.
Funding
This research was funded by the Sichuan Science and Technology Program under grant 2021YFN0020, by the Postgraduate Innovation Fund of Xihua University under grant YCJJ2020041, as a Key Project of Xihua University under grant DC1900007141, and by the National Natural Science Foundation of China under grant 31870347.
Institutional Review Board Statement
Not applicable.
Informed Consent Statement
Not applicable.
Conflicts of Interest
The authors declare no conflict of interest.
References
- Batuman, O.; Kuo, Y.-W.; Palmieri, M.; Rojas, M.R.; Gilbertson, R.L. Tomato chocolate spot virus, a member of a new torradovirus species that causes a necrosis-associated disease of tomato in Guatemala. Arch. Virol. 2010, 155, 857–869. [Google Scholar] [CrossRef] [Green Version]
- Gleason, M.L. Recent Progress in Understanding and Controlling Bacterial Canker of Tomato in Eastern North America. Plant Dis. 1993, 77, 1069–1076. [Google Scholar] [CrossRef] [Green Version]
- Sankaran, S.; Mishra, A.; Ehsani, R.; Davis, C. A review of advanced techniques for detecting plant diseases. Comput. Electron. Agric. 2010, 72, 1–13. [Google Scholar] [CrossRef]
- Xing, J.; Symons, S.; Shahin, M.; Hatcher, D. Detection of sprout damage in Canada Western Red Spring wheat with multiple wavebands using visible/near-infrared hyperspectral imaging. Biosyst. Eng. 2010, 106, 188–194. [Google Scholar] [CrossRef]
- Jones, C.; Jones, J.; Lee, W.S. Diagnosis of bacterial spot of tomato using spectral signatures. Comput. Electron. Agric. 2010, 74, 329–335. [Google Scholar] [CrossRef]
- Ye, H.; Huang, W.; Huang, S.; Cui, B.; Dong, Y.; Guo, A.; Ren, Y.; Jin, Y. Identification of banana fusarium wilt using supervised classification algorithms with UAV-based multi-spectral imagery. Int. J. Agric. Biol. Eng. 2020, 13, 136–142. [Google Scholar] [CrossRef]
- Zhang, J.; Wang, B.; Zhang, X.; Liu, P.; Dong, Y.; Wu, K.; Huang, W. Impact of spectral interval on wavelet features for detecting wheat yellow rust with hyperspectral data. Int. J. Agric. Biol. Eng. 2018, 11, 138–144. [Google Scholar] [CrossRef] [Green Version]
- Vigneau, N.; Ecarnot, M.; Rabatel, G.; Roumet, P. Potential of field hyperspectral imaging as a non destructive method to assess leaf nitrogen content in Wheat. Field Crop. Res. 2011, 122, 25–31. [Google Scholar] [CrossRef] [Green Version]
- Stroppiana, D.; Boschetti, M.; Brivio, P.A.; Bocchi, S. Plant nitrogen concentration in paddy rice from field canopy hyperspectral radiometry. Field Crop. Res. 2009, 111, 119–129. [Google Scholar] [CrossRef]
- Zhao, D.; Reddy, K.R.; Kakani, V.G.; Reddy, V. Nitrogen deficiency effects on plant growth, leaf photosynthesis, and hyperspectral reflectance properties of sorghum. Eur. J. Agron. 2005, 22, 391–403. [Google Scholar] [CrossRef]
- Panda, S.S.; Ames, D.P.; Panigrahi, S. Application of Vegetation Indices for Agricultural Crop Yield Prediction Using Neural Network Techniques. Remote Sens. 2010, 2, 673–696. [Google Scholar] [CrossRef] [Green Version]
- Brantley, S.T.; Zinnert, J.C.; Young, D.R. Application of hyperspectral vegetation indices to detect variations in high leaf area index temperate shrub thicket canopies. Remote Sens. Environ. 2011, 115, 514–523. [Google Scholar] [CrossRef] [Green Version]
- Thenkabail, P.S.; Smith, R.B.; De Pauw, E. Hyperspectral Vegetation Indices and Their Relationships with Agricultural Crop Characteristics. Remote Sens. Environ. 2000, 71, 158–182. [Google Scholar] [CrossRef]
- Lu, J.; Zhou, M.; Gao, Y.; Jiang, H. Using hyperspectral imaging to discriminate yellow leaf curl disease in tomato leaves. Precis. Agric. 2017, 19, 379–394. [Google Scholar] [CrossRef]
- Schubert, T.S.; Rizvi, S.A.; Sun, X.; Gottwald, T.R.; Graham, J.H.; Dixon, W.N. Meeting the challenge of Eradicating Citrus Canker in Florida—Again. Plant Dis. 2001, 85, 340–356. [Google Scholar] [CrossRef] [PubMed] [Green Version]
- Swarbrick, P.J.; Schulze-Lefert, P.; Scholes, J.D. Metabolic consequences of susceptibility and resistance (race-specific and broad-spectrum) in barley leaves challenged with powdery mildew. Plant Cell Environ. 2006, 29, 1061–1076. [Google Scholar] [CrossRef]
- Mojjada, R.K.; Kumar, K.K.; Yadav, A.; Prasad, B.S.V. Detection of plant leaf disease using digital image processing. Mater. Today. 2020. [Google Scholar] [CrossRef]
- Senthilkumar, T.; Jayas, D.S.; White, N.D.; Fields, P.G.; Gräfenhan, T. Detection of fungal infection and Ochratoxin A contamination in stored barley using near-infrared hyperspectral imaging. Biosyst. Eng. 2016, 147, 162–173. [Google Scholar] [CrossRef]
- Lopez-Maestresalas, A.; Keresztes, J.C.; Goodarzi, M.; Arazuri, S.; Jarén, C.; Saeys, W. Non-destructive detection of blackspot in potatoes by Vis-NIR and SWIR hyperspectral imaging. Food Control. 2016, 70, 229–241. [Google Scholar] [CrossRef] [Green Version]
- Karuppiah, K.; Senthilkumar, T.; Jayas, D.; White, N. Detection of fungal infection in five different pulses using near-infrared hyperspectral imaging. J. Stored Prod. Res. 2016, 65, 13–18. [Google Scholar] [CrossRef]
- Jafari, M.; Minaei, S.; Safaie, N.; Torkamani-Azar, F. Early detection and classification of powdery mildew-infected rose leaves using ANFIS based on extracted features of thermal images. Infrared Phys. Technol. 2016, 76, 338–345. [Google Scholar] [CrossRef]
- Lu, J.; Ehsani, R.; Shi, Y.; De Castro, A.I.; Wang, S. Detection of multi-tomato leaf diseases (late blight, target and bacterial spots) in different stages by using a spectral-based sensor. Entific Rep. 2018, 8, 2793. [Google Scholar] [CrossRef] [Green Version]
- Xiong, Y.; Liang, L.; Wang, L.; She, J.; Wu, M. Identification of cash crop diseases using automatic image segmentation algorithm and deep learning with expanded dataset. Comput. Electron. Agric. 2020, 177, 105712. [Google Scholar] [CrossRef]
- Too, E.C.; Yujian, L.; Njuki, S.; Yingchun, L. A comparative study of fine-tuning deep learning models for plant disease identification. Comput. Electron. Agric. 2019, 161, 272–279. [Google Scholar] [CrossRef]
- Chen, J.; Chen, J.; Zhang, D.; Sun, Y.; Nanehkaran, Y. Using deep transfer learning for image-based plant disease identification. Comput. Electron. Agric. 2020, 2020, 105393. [Google Scholar] [CrossRef]
- Sharma, P.; Berwal, Y.P.S.; Ghai, W. Performance analysis of deep learning CNN models for disease detection in plants using image segmentation. Inf. Process. Agric. 2020, 7, 566–574. [Google Scholar] [CrossRef]
- Awan, F.M.; Saleem, Y.; Minerva, R.; Crespi, N. A Comparative Analysis of Machine/Deep Learning Models for Parking Space Availability Prediction. Sensors 2020, 20, 322. [Google Scholar] [CrossRef] [PubMed] [Green Version]
- Hughes, D.; Salathe, M. An open access repository of images on plant health to enable the development of mobile disease diagnostics through machine learning and crowdsourcing. arXiv 2015, arXiv:1511.08060. [Google Scholar]
- Radovanovic, D.; Dukanovic, S. Image-Based Plant Disease Detection: A Comparison of Deep Learning and Classical Machine Learning Algorithms. In Proceedings of the 2020 24th International Conference on Information Technology (IT), Zabljak, Montenegro, 18–22 February 2020. [Google Scholar]
- Devassy, B.M.; George, S. Dimensionality reduction and visualisation of hyperspectral ink data using t-SNE. Forensic Sci. Int. 2020, 311, 110194. [Google Scholar] [CrossRef]
- Mohanty, S.P.; Hughes, D.P.; Salathe, M. Using Deep Learning for Image-Based Plant Disease Detection. Front. Plant Sci. 2016, 7, 1419. [Google Scholar] [CrossRef] [Green Version]
- Grigorescu, S.E.; Petkov, N.; Kruizinga, P. Comparison of texture features based on Gabor filters. IEEE Trans. Image Process. 2002, 11, 1160–1167. [Google Scholar] [CrossRef] [Green Version]
- Manjunath, B.; Ma, W. Texture features for browsing and retrieval of image data. IEEE Trans. Pattern Anal. Mach. Intell. 1996, 18, 837–842. [Google Scholar] [CrossRef] [Green Version]
- Unser, M.; Eden, M. Multiresolution feature extraction and selection for texture segmentation. IEEE Trans. Pattern Anal. Mach. Intell. 1989, 11, 717–728. [Google Scholar] [CrossRef] [Green Version]
- Wu, C.-M.; Chen, Y.-C.; Hsieh, K.-S. Texture features for classification of ultrasonic liver images. IEEE Trans. Med Imaging 1992, 11, 141–152. [Google Scholar] [CrossRef]
- Yang, S.-W.; Lin, C.-S.; Lin, S.-K.; Tseng, Y.-C. Automatic inspection system for defects of printed art tile based on texture feature analysis. Instrum. Sci. Technol. 2013, 42, 59–71. [Google Scholar] [CrossRef]
- Lu, J.; Zhang, N.; Jiang, H. Discriminating Leaves Affected with Tomato Yellow Leaf Curl through Fluorescence Imaging Using Texture and Leaf Vein Features. Trans. Asae Am. Soc. Agric. Eng. 2016, 59, 1507–1515. [Google Scholar] [CrossRef]
- Ojala, T.; Pietikainen, M.; Harwood, D. Performance evaluation of texture measures with classification based on Kullback discrimination of distributions. Pattern Recognition—Conference A: Computer Vision and Image Processing. In Proceedings of the 12th IAPR International Conference, Jerusalem, Israel, 9–13 October 1994. [Google Scholar]
- Ojala, T.; Pietik Inen, M.; Harwood, D.A. Comparative Study of Texture Measures with Classification Based on Feature Distri-butions. Pattern Recognit. 1996, 29, 51–59. [Google Scholar] [CrossRef]
- Ojala, T.; Valkealahti, K.; Oja, E.; Pietikäinen, M. Texture discrimination with multidimensional distributions of signed gray-level differences. Pattern Recognit. 2001, 34, 727–739. [Google Scholar] [CrossRef] [Green Version]
- Pietik Inen, M.; Ojala, T.; Xu, Z. Rotation-invariant texture classification using feature distributions. Pattern Recognit. 2000, 33, 43–52. [Google Scholar] [CrossRef] [Green Version]
- Ojala, T.; Pietikainen, M.; Maenpaa, T. Multiresolution gray-scale and rotation invariant texture classification with local binary patterns. IEEE Trans. Pattern Anal. Mach. Intell. 2002, 24, 971–987. [Google Scholar] [CrossRef]
- Mäenpää, T.; Pietikäinen, M. Texture analysis with local binary patterns. In Handbook of Pattern Recognition and Computer Vision, 3rd ed.; World Scientific Pub Co Pte Lt: Singapore, 2005; Volume 1, pp. 197–216. [Google Scholar]
- Stricker, M.A.; Orengo, M. Similarity of color images. In Storage and Retrieval for Image and Video Databases III; International Society for Optics and Photonics: Bellingham, WA, USA, 1995; Volume 2420, pp. 381–392. [Google Scholar] [CrossRef]
- Swain, M.J.; Ballard, D.H. Color indexing. Int. J. Comput. Vis. 1991, 7, 11–12. [Google Scholar] [CrossRef]
- Abdullah, N.E.; Rahim, A.A.; Hashim, H.; Kamal, M.M. Classification of Rubber Tree Leaf Diseases Using Multilayer Perceptron Neural Network. In Proceedings of the 2007 5th Student Conference on Research Development, Selangor, Malaysia, 12–11 December 2007. [Google Scholar]
- Cortes, C.; Vapnik, V. Support-vector networks. Mach. Learn. 1995, 20, 273–297. [Google Scholar] [CrossRef]
- Breiman, L. Random Forests. Mach. Learn. 2001, 45, 5–32. [Google Scholar]
- Sujatha, R.; Chatterjee, J.M.; Jhanjhi, N.; Brohi, S.N. Performance of deep learning vs machine learning in plant leaf disease detection. Microprocess. Microsyst. 2021, 80, 103615. [Google Scholar] [CrossRef]
Figure 1.
Comparison of the number distributions of the original dataset and reorganized dataset.
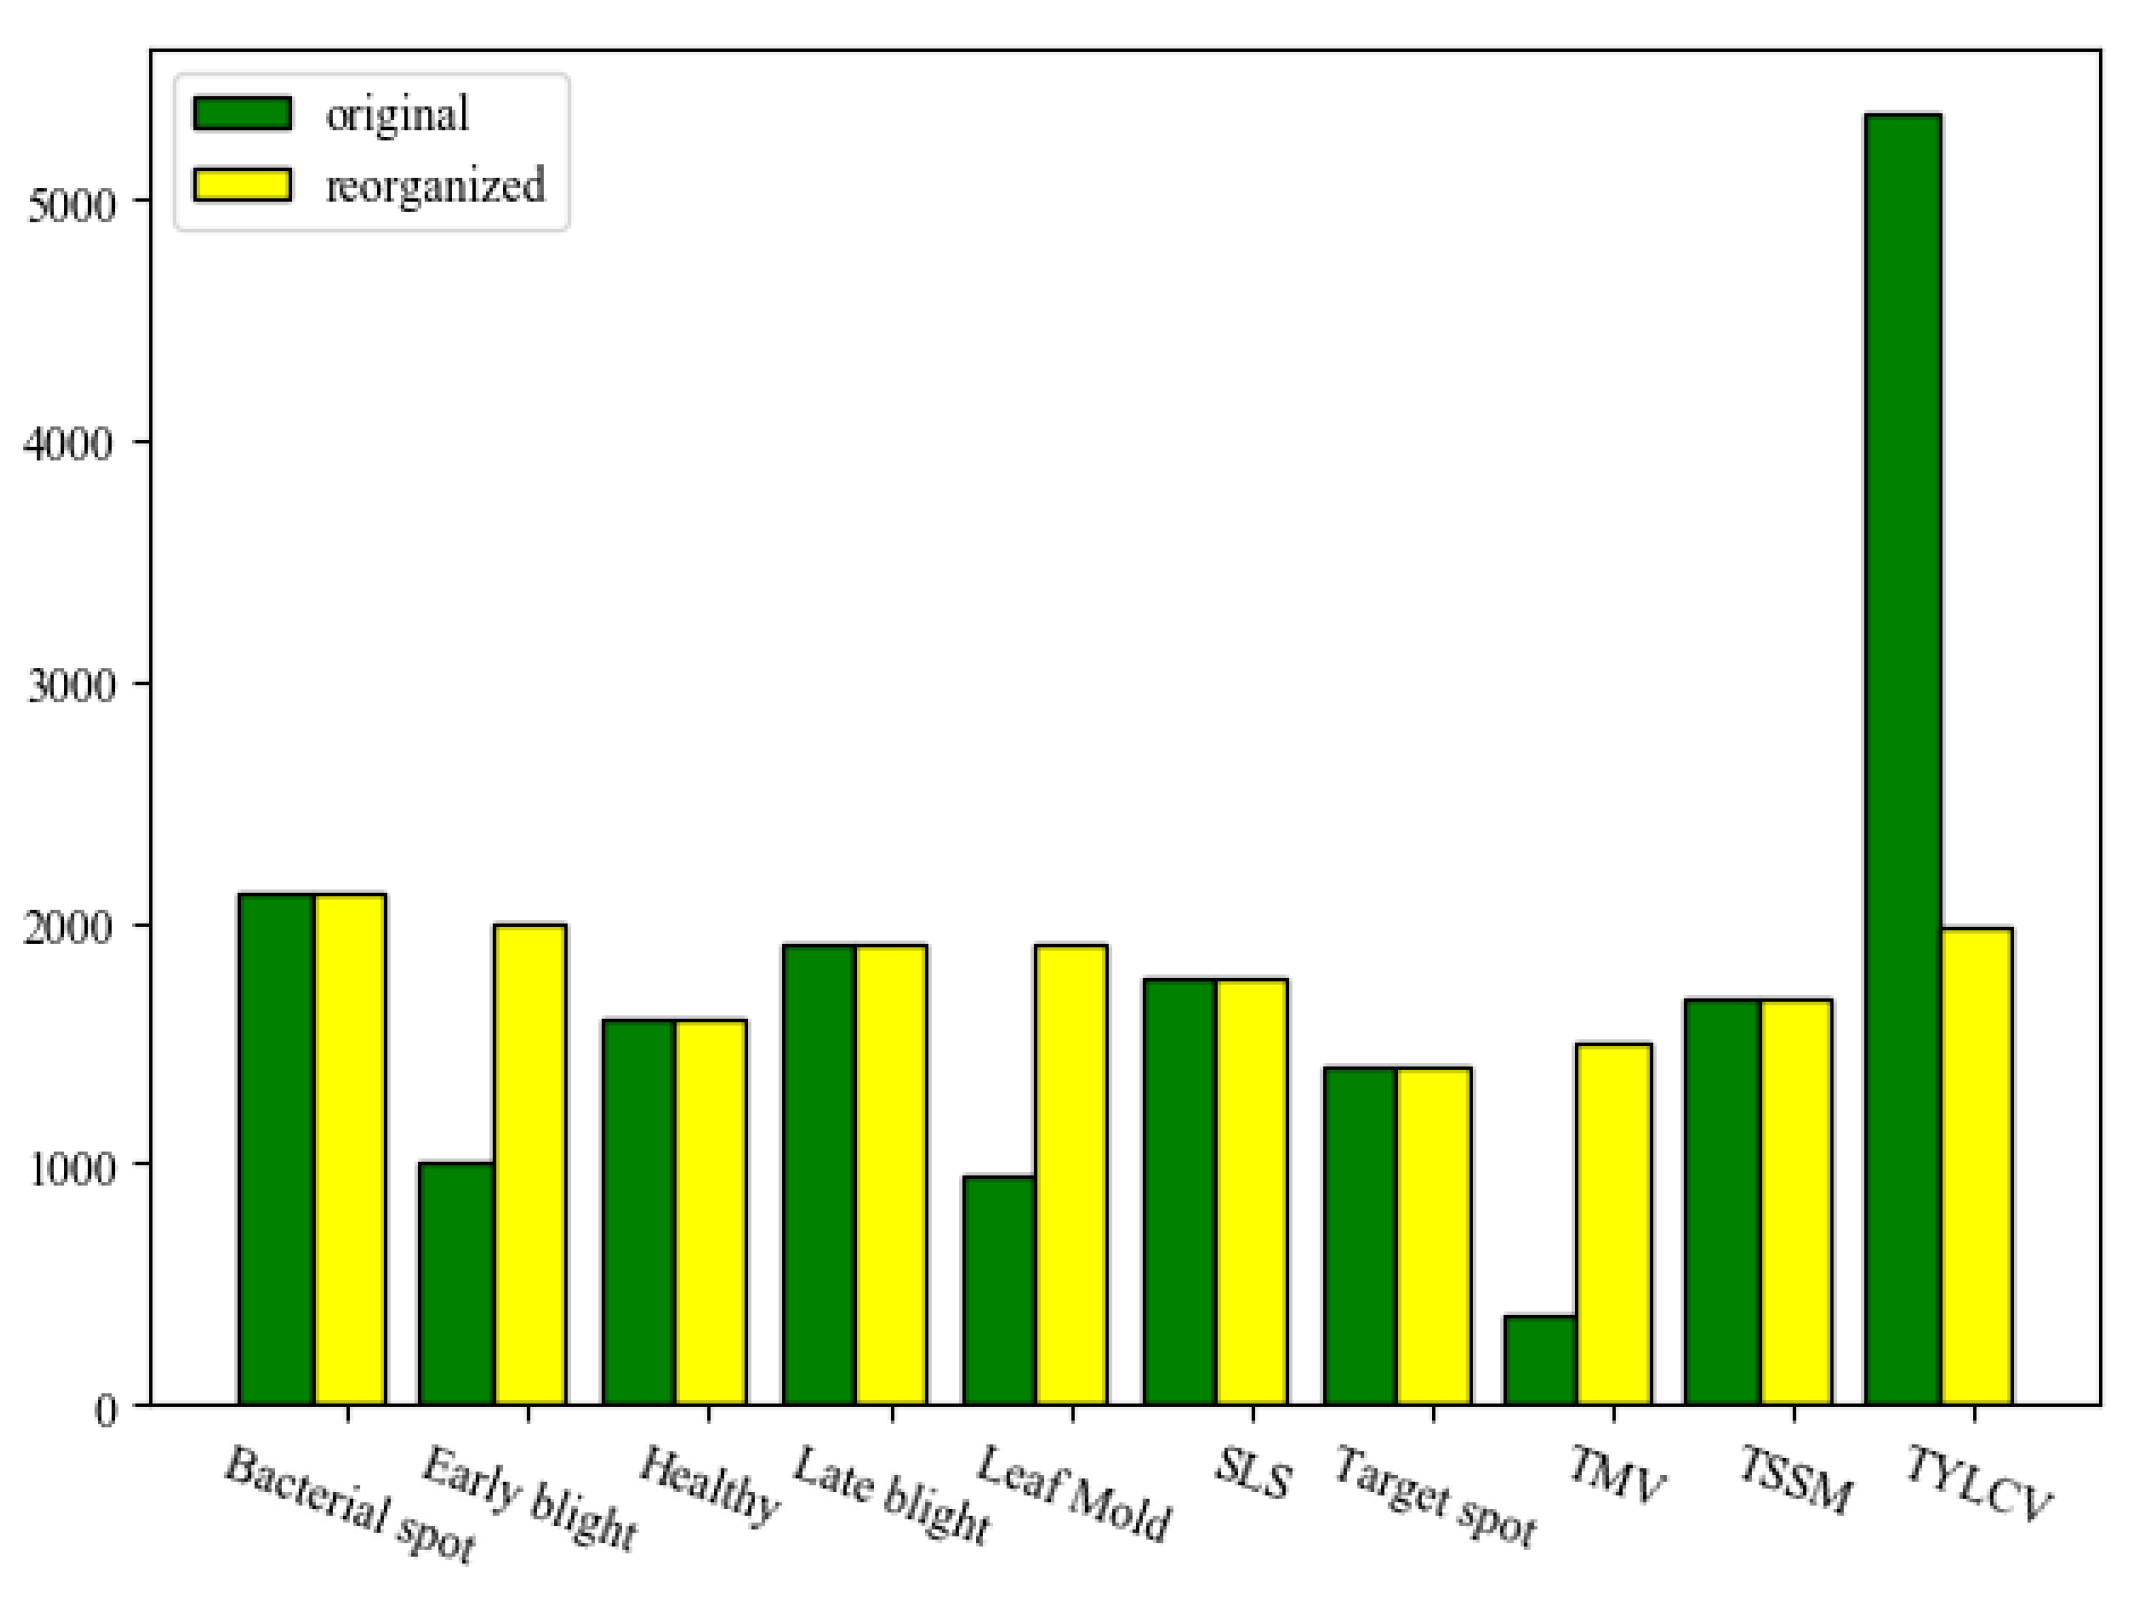
Figure 2.
Examples of tomato images from PlantVillage dataset.
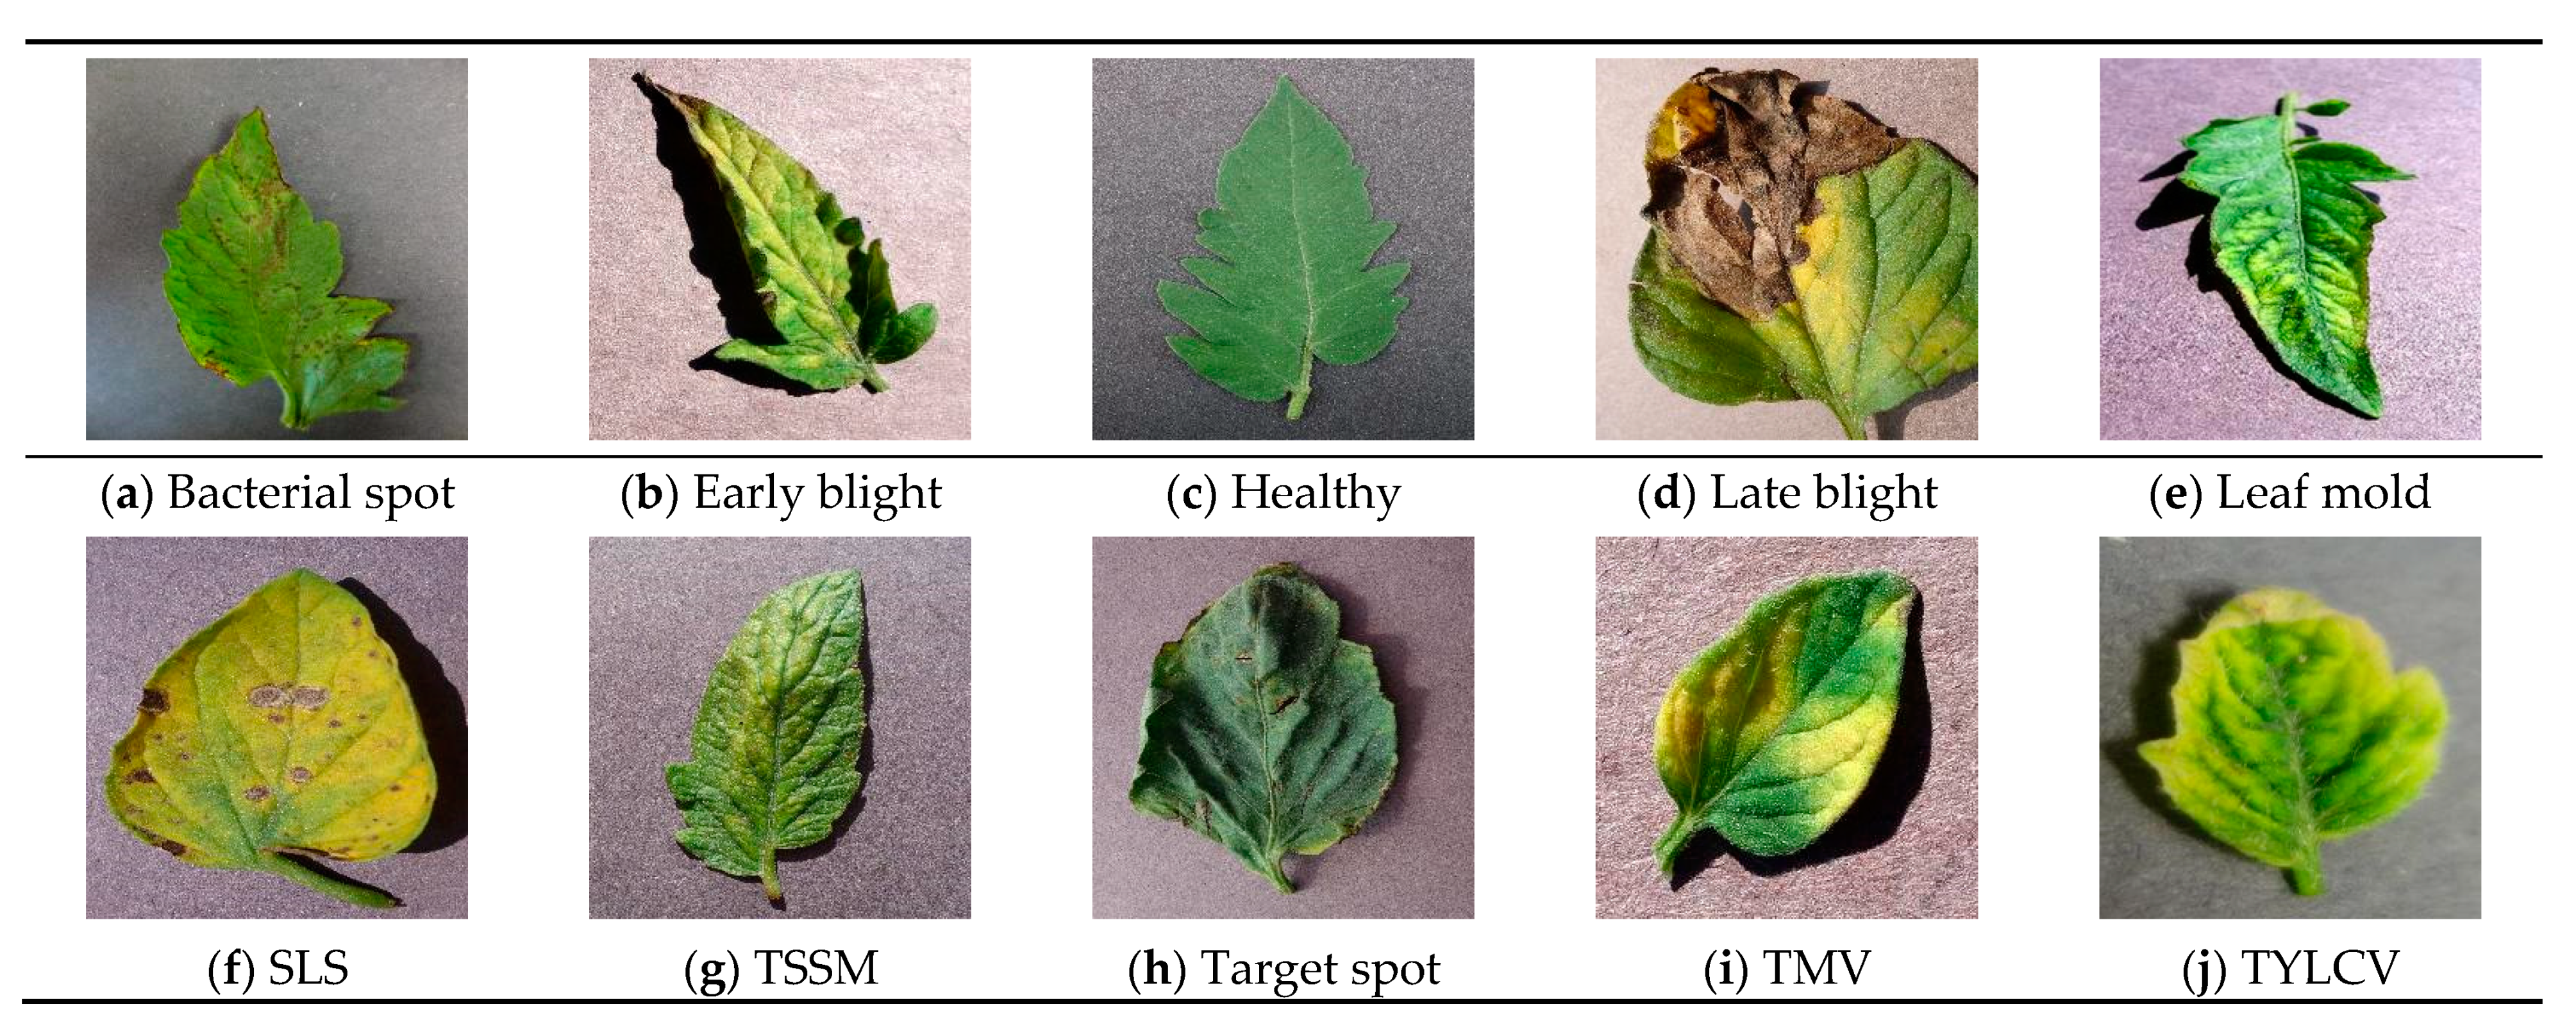
Figure 3.
Dataset clustering results based on t-SNE. We can see from (a,b) that there is a spatial distance between different clusters (diseases), thus proving that the dataset is divisible.
Figure 3.
Dataset clustering results based on t-SNE. We can see from (a,b) that there is a spatial distance between different clusters (diseases), thus proving that the dataset is divisible.

Figure 4.
Flowchart of image preprocessing.

Figure 5.
Flowchart of feature extraction.
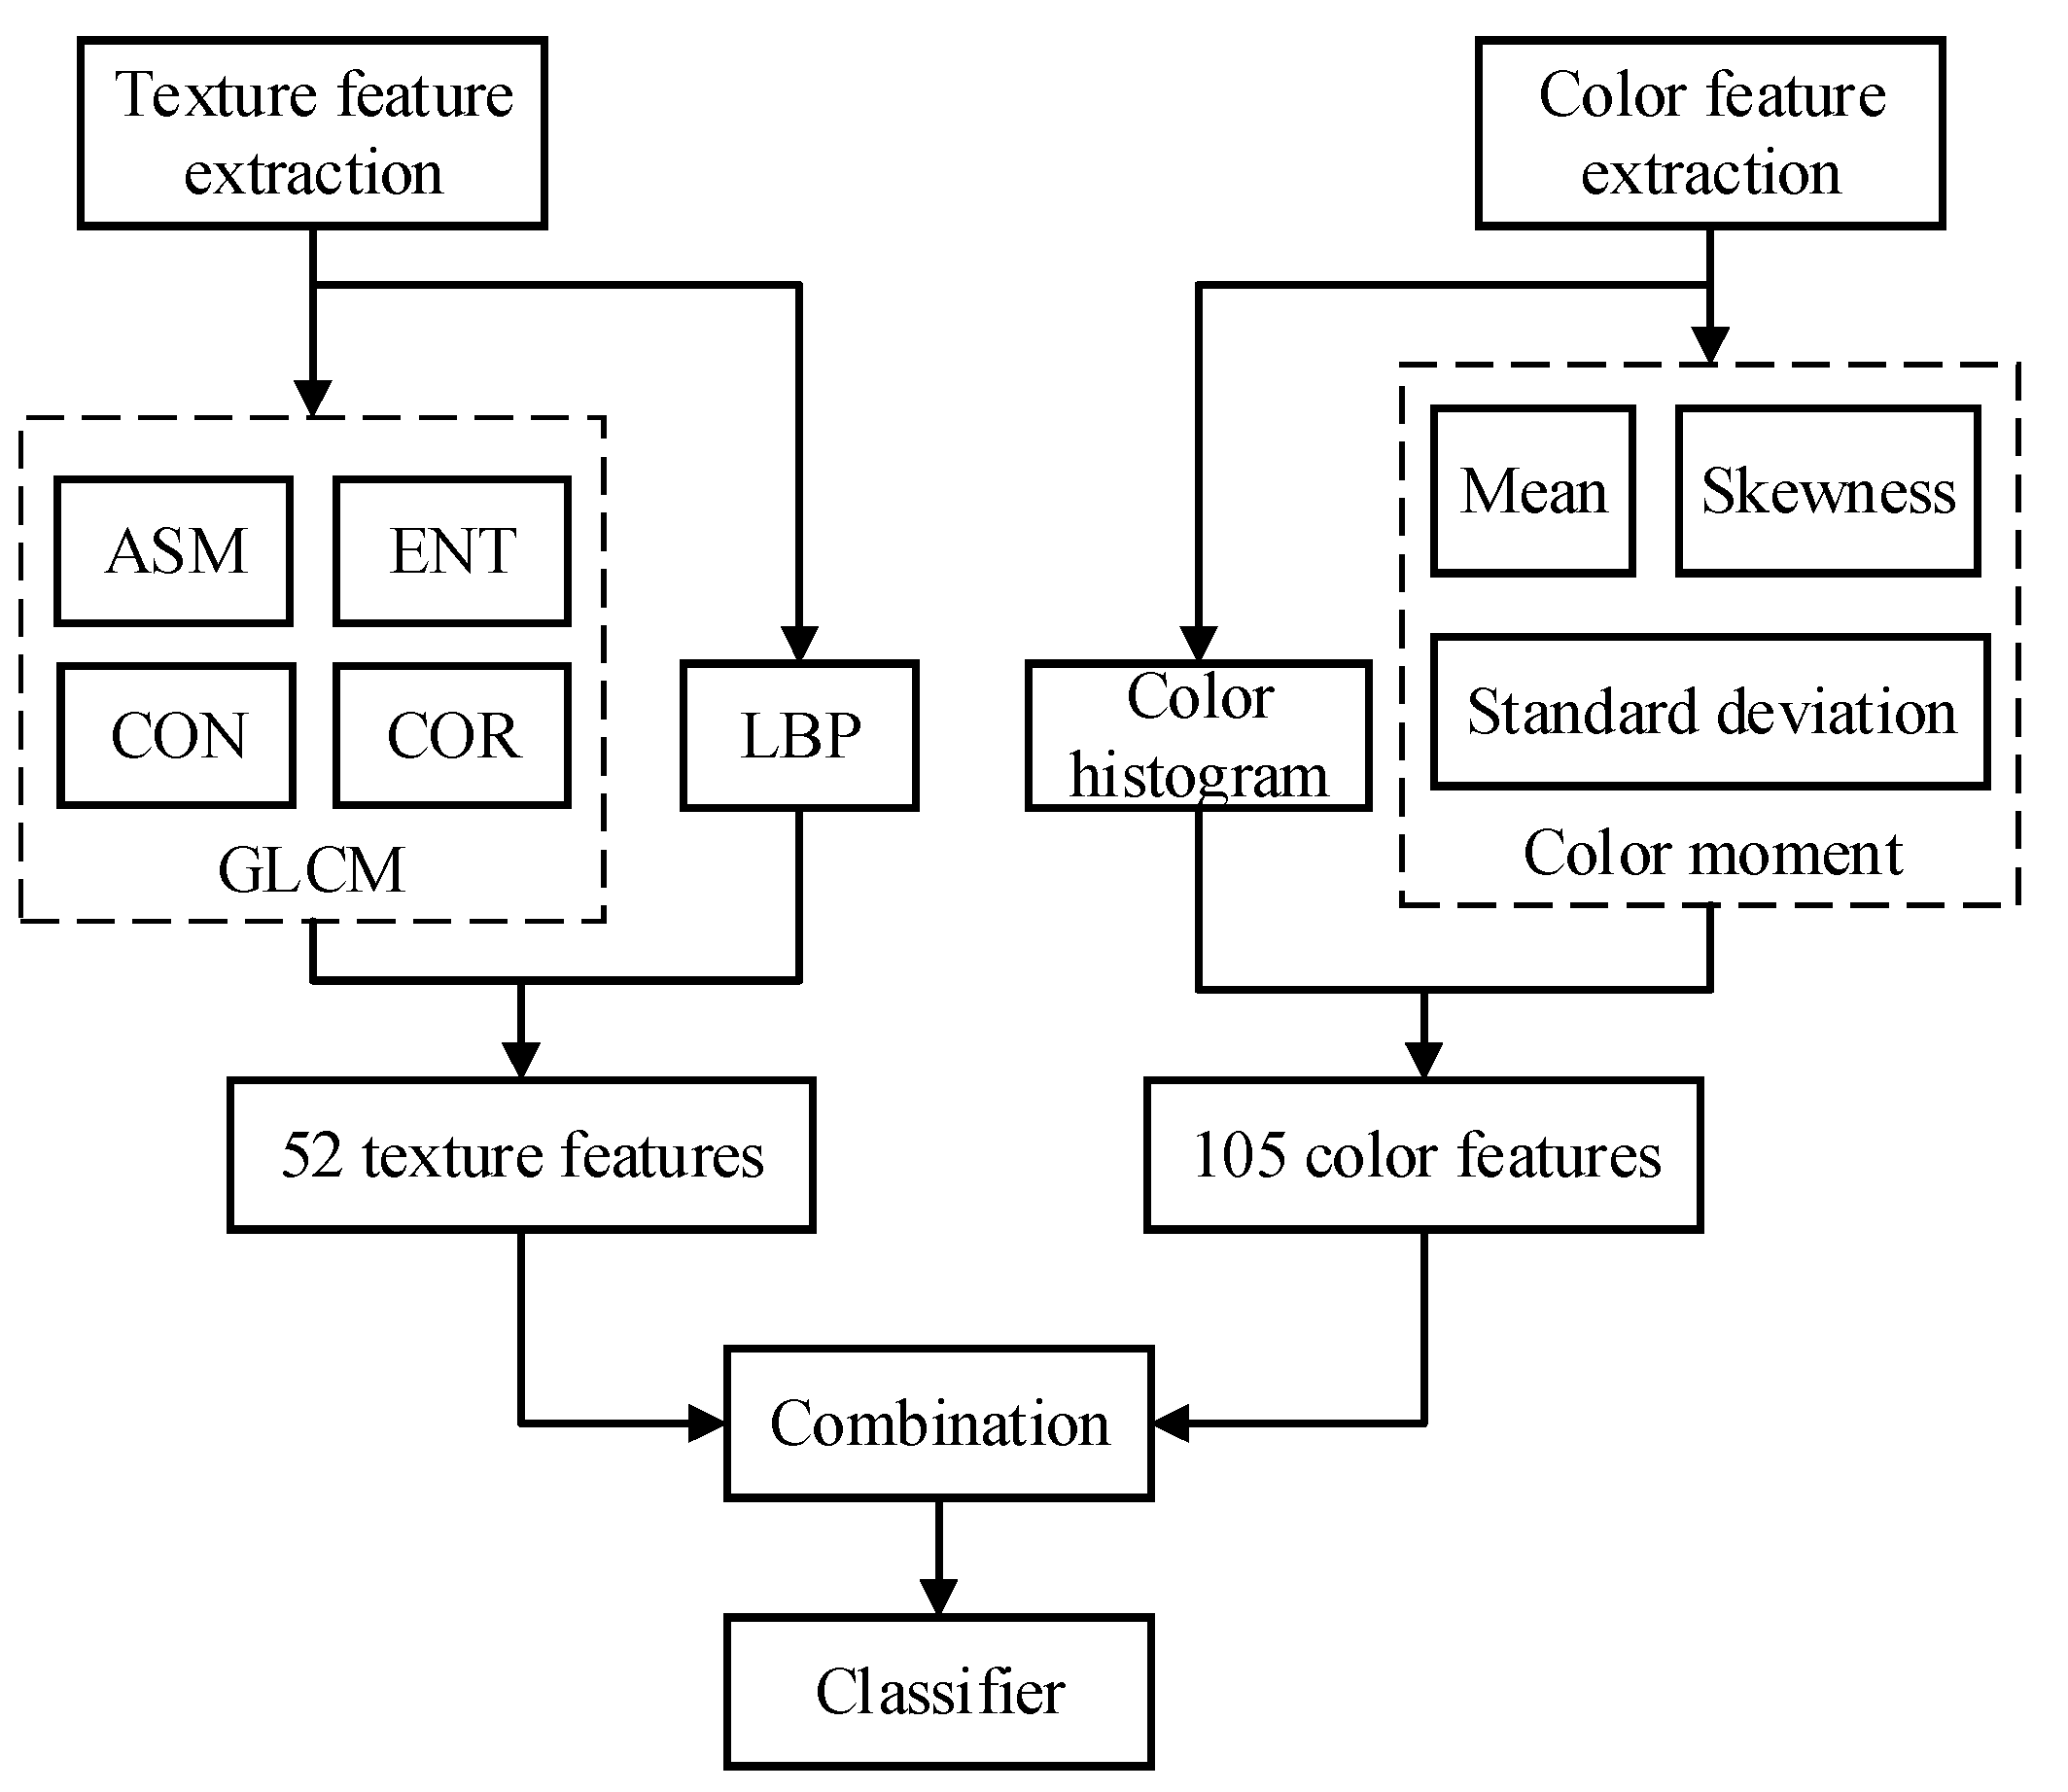
Figure 6.
Flowchart of tomato disease classification.
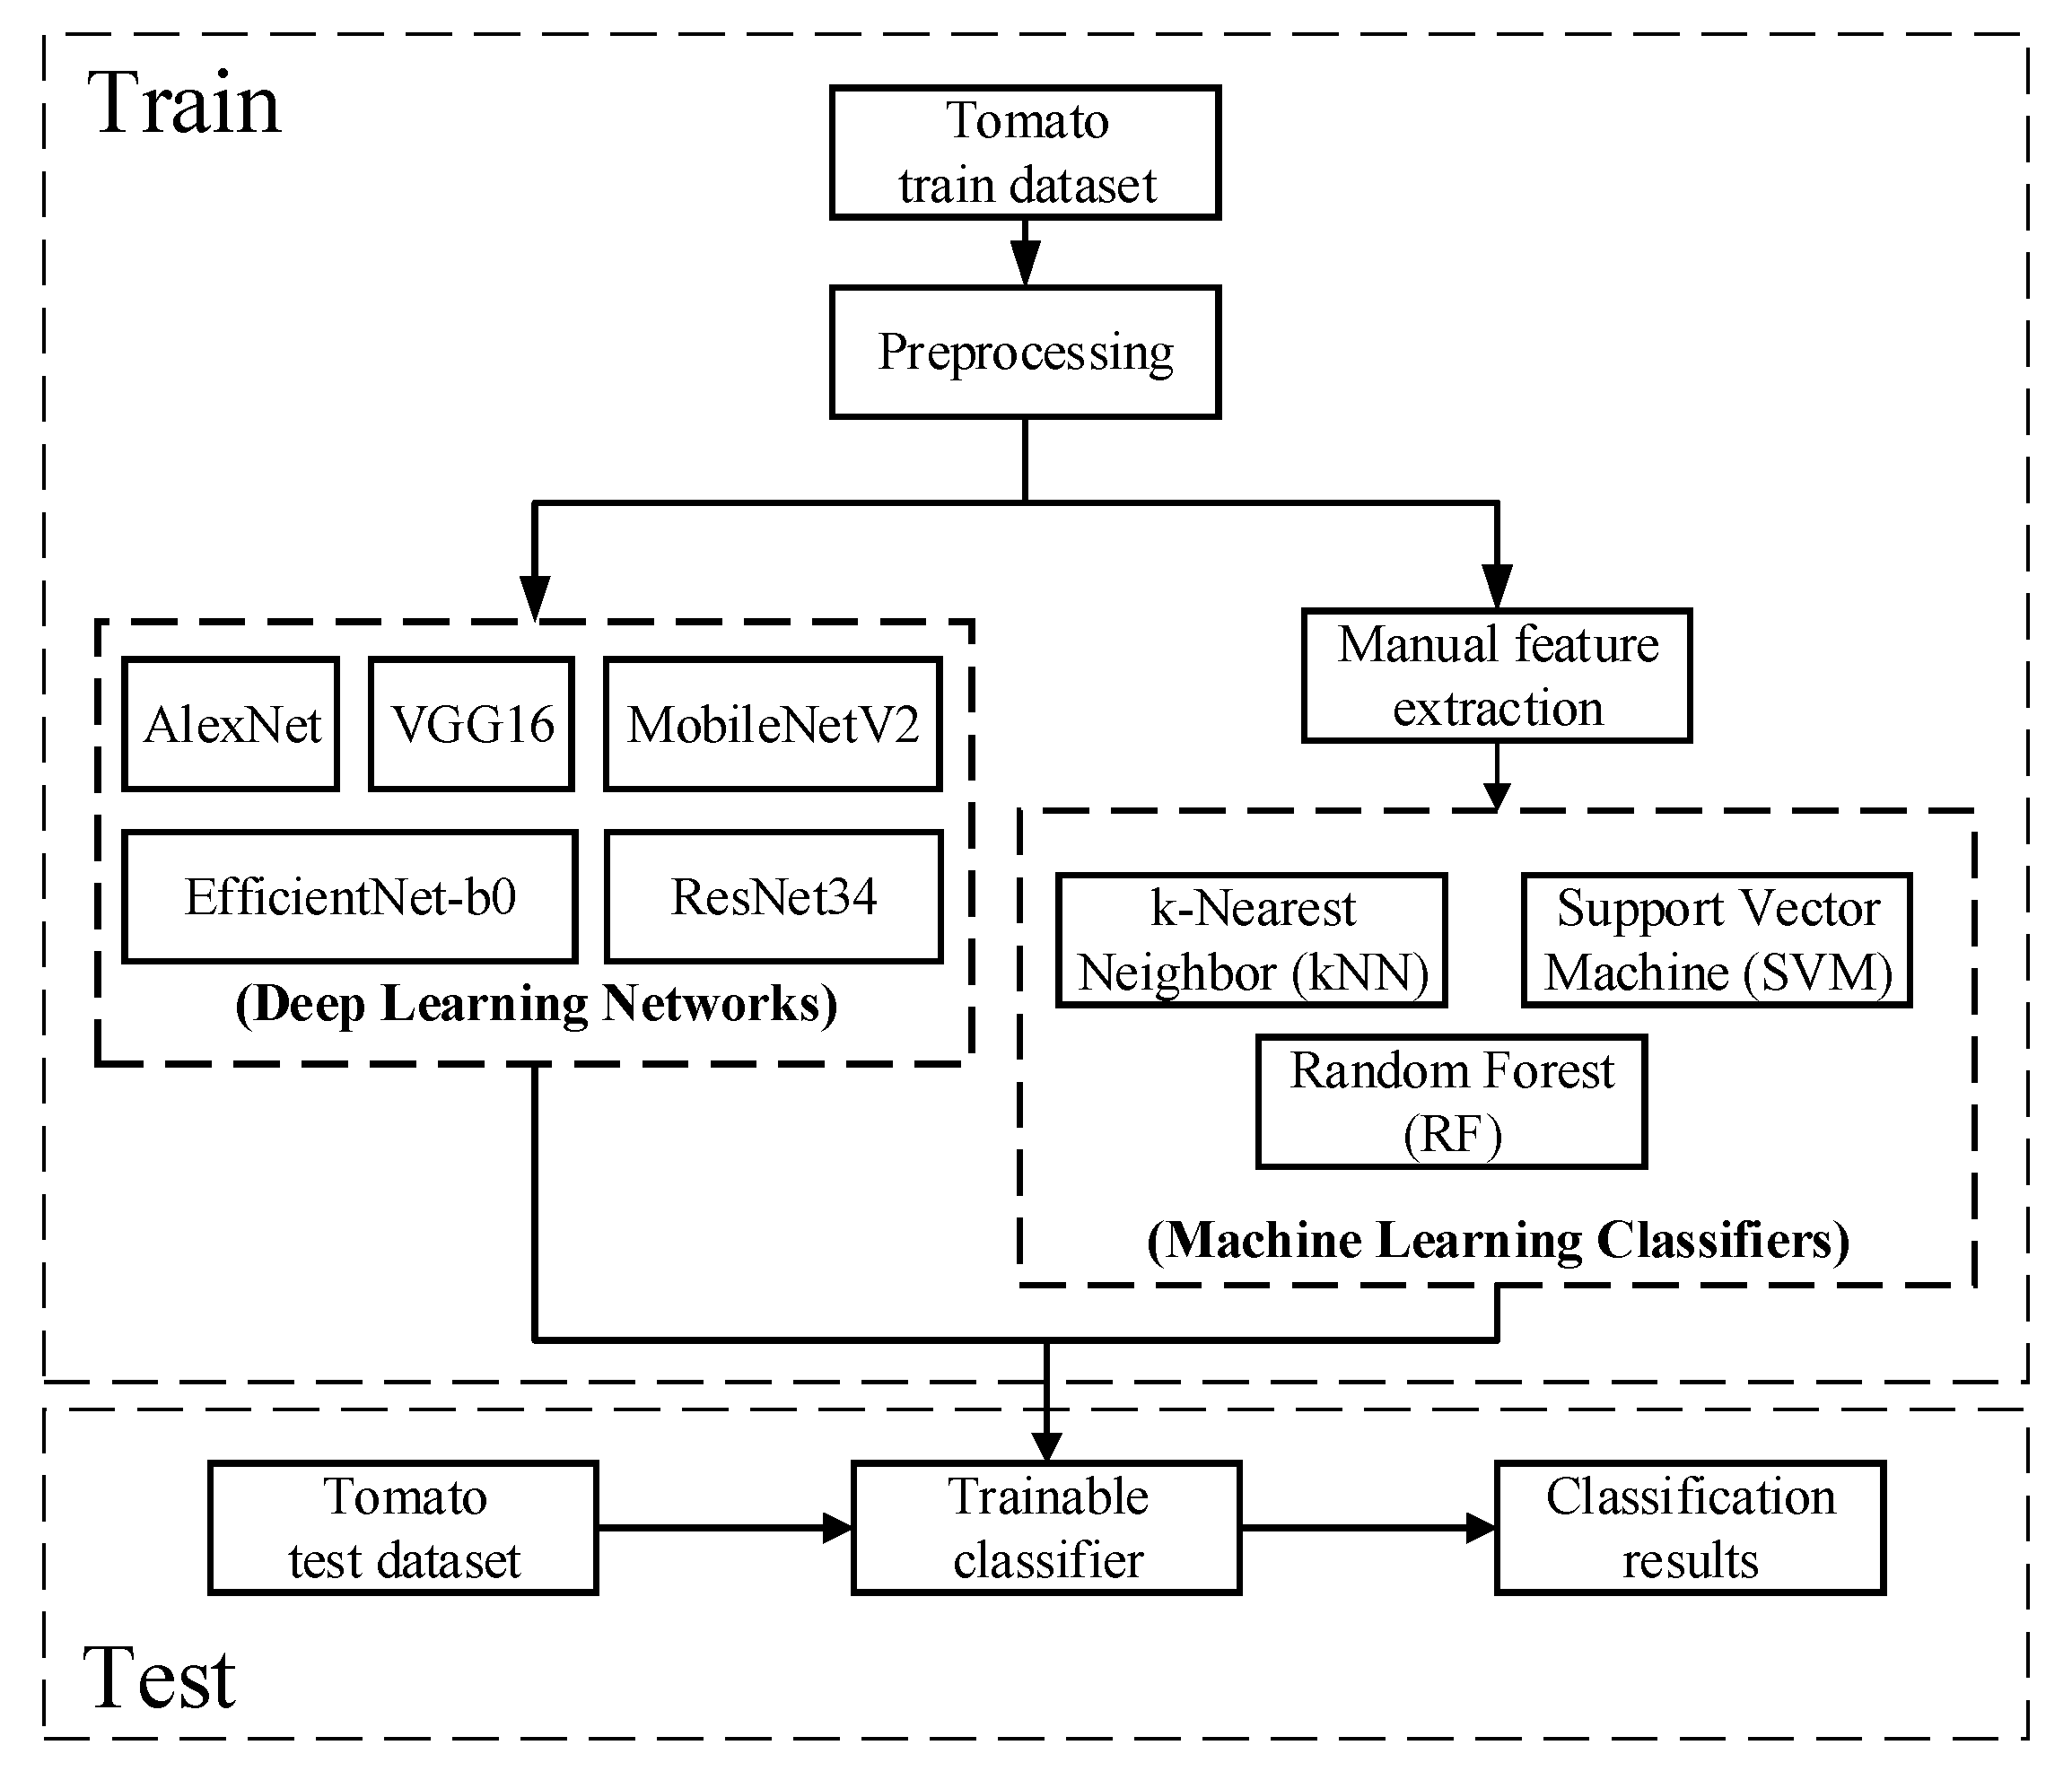
Figure 7.
Confusion matrixes for the (a) kNN, (b) SVM, and (c) random forest algorithms.

Figure 8.
ROC curves of tested deep learning algorithms.

Table 1.
The number of images of each tomato disease class in the PlantVillage dataset.
| Disease Common Name | Disease Scientific Name | Image Number |
|---|---|---|
| Bacterial spot | Xanthomonas campestris pv.Vesicatoria | 2127 |
| Early blight | Alternaria solani | 1000 |
| Late blight | Phytophthora infestans | 1909 |
| Leaf mold | Fulvia fulva | 952 |
| Septoria leaf spot (SLS) | Septoria lycopersici | 1771 |
| Two-spotted spider mite (TSSM) | Tetranychus urticae | 1676 |
| Target spot | Corynespora cassiicola | 1404 |
| Tomato mosaic virus (TMV) | Tomato mosaic virus | 373 |
| Tomato yellow leaf curl virus (TYLCV) | Begomovirus (Fam. Geminiviridae) | 5357 |
Table 2.
Results for different feature extraction methods with the kNN classifier; results are displayed as tuples (precision percentage and recall percentage) with two significant digits.
Table 2.
Results for different feature extraction methods with the kNN classifier; results are displayed as tuples (precision percentage and recall percentage) with two significant digits.
| Disease Type | Feature Extraction Method | ||||||
|---|---|---|---|---|---|---|---|
| LBP | GLCM | LBP+GLCM | COLOR | COLOR+LBP | COLOR+GLCM | ALL | |
| Bacterial spot | (57,75) | (67,87) | (71,92) | (83,79) | (85,85) | (85,97) | (85,90) |
| Early blight | (52,41) | (66,57) | (73,58) | (83,64) | (81,72) | (85,76) | (81,78) |
| Late blight | (59,71) | (62,77) | (78,86) | (68,92) | (80,93) | (90,97) | (90,95) |
| Leaf mold | (64,44) | (66,58) | (70,61) | (73,43) | (78,55) | (78,69) | (82,65) |
| SLS | (63,65) | (60,43) | (69,65) | (68,75) | (76,82) | (81,85) | (75,84) |
| TMV | (61,49) | (56,49) | (70,59) | (77,66) | (83,71) | (87,82) | (85,78) |
| TSSM | (51,62) | (57,72) | (66,79) | (63,76) | (75,84) | (80,88) | (79,86) |
| TYLCV | (43,43) | (49,58) | (55,62) | (63,67) | (67,70) | (78,80) | (74,72) |
| Target spot | (75,83) | (75,81) | (81,86) | (78,99) | (79,100) | (93,95) | (89,98) |
| Healthy | (76,73) | (67,53) | (85,73) | (82,87) | (88,90) | (99,89) | (91,89) |
| Average | (60,61) | (63,63) | (72,72) | (74,75) | (79,80) | (86,86) | (83,83) |
Table 3.
Results for the tested ML/DL algorithms.
| Methods | Evaluation Metrics | |||
|---|---|---|---|---|
| Accuracy | Precision | Recall | F1 Score | |
| kNN | 82.1% | 82.1% | 82.5% | 82.0% |
| SVM | 91.0% | 90.9% | 91.0% | 91.0% |
| Random forest | 82.7% | 82.6% | 83.0% | 82.7% |
| AlexNet | 92.7% | 92.5% | 92.6% | 92.4% |
| VGG16 | 98.9% | 98.6% | 98.5% | 98.5% |
| ResNet34 | 99.7% | 99.6% | 99.7% | 99.7% |
| EfficientNet-b0 | 98.9% | 98.9% | 98.9% | 98.8% |
| MobileNetV2 | 91.2% | 91.3% | 91.3% | 91.2% |
Publisher’s Note: MDPI stays neutral with regard to jurisdictional claims in published maps and institutional affiliations. |
© 2021 by the authors. Licensee MDPI, Basel, Switzerland. This article is an open access article distributed under the terms and conditions of the Creative Commons Attribution (CC BY) license (https://creativecommons.org/licenses/by/4.0/).
Share and Cite
MDPI and ACS Style
Tan, L.; Lu, J.; Jiang, H. Tomato Leaf Diseases Classification Based on Leaf Images: A Comparison between Classical Machine Learning and Deep Learning Methods. AgriEngineering 2021, 3, 542-558. https://doi.org/10.3390/agriengineering3030035
AMA Style
Tan L, Lu J, Jiang H. Tomato Leaf Diseases Classification Based on Leaf Images: A Comparison between Classical Machine Learning and Deep Learning Methods. AgriEngineering. 2021; 3(3):542-558. https://doi.org/10.3390/agriengineering3030035
Chicago/Turabian StyleTan, Lijuan, Jinzhu Lu, and Huanyu Jiang. 2021. "Tomato Leaf Diseases Classification Based on Leaf Images: A Comparison between Classical Machine Learning and Deep Learning Methods" AgriEngineering 3, no. 3: 542-558. https://doi.org/10.3390/agriengineering3030035