

Stability Analysis and Prediction of Traffic Flow of Trucks at Road Intersections Based on Heterogenous Optimal Velocity and Artificial Neural Network Model


Abstract
:1. Introduction
- This research proposed a heterogenous optimal velocity model to systematically evaluate the long-short-medium truck traffic flow at signalized road intersections.
- This research proposed a Levenberg–Marquardt artificial neural network to model the traffic flow of long-short-medium trucks at signalized road intersections using traffic flow parameters such as speed, time, traffic density, and traffic volume.
- This research developed an ANN model for the stability analysis of long-short-medium trucks at signalized road intersections.
2. Materials and Methods
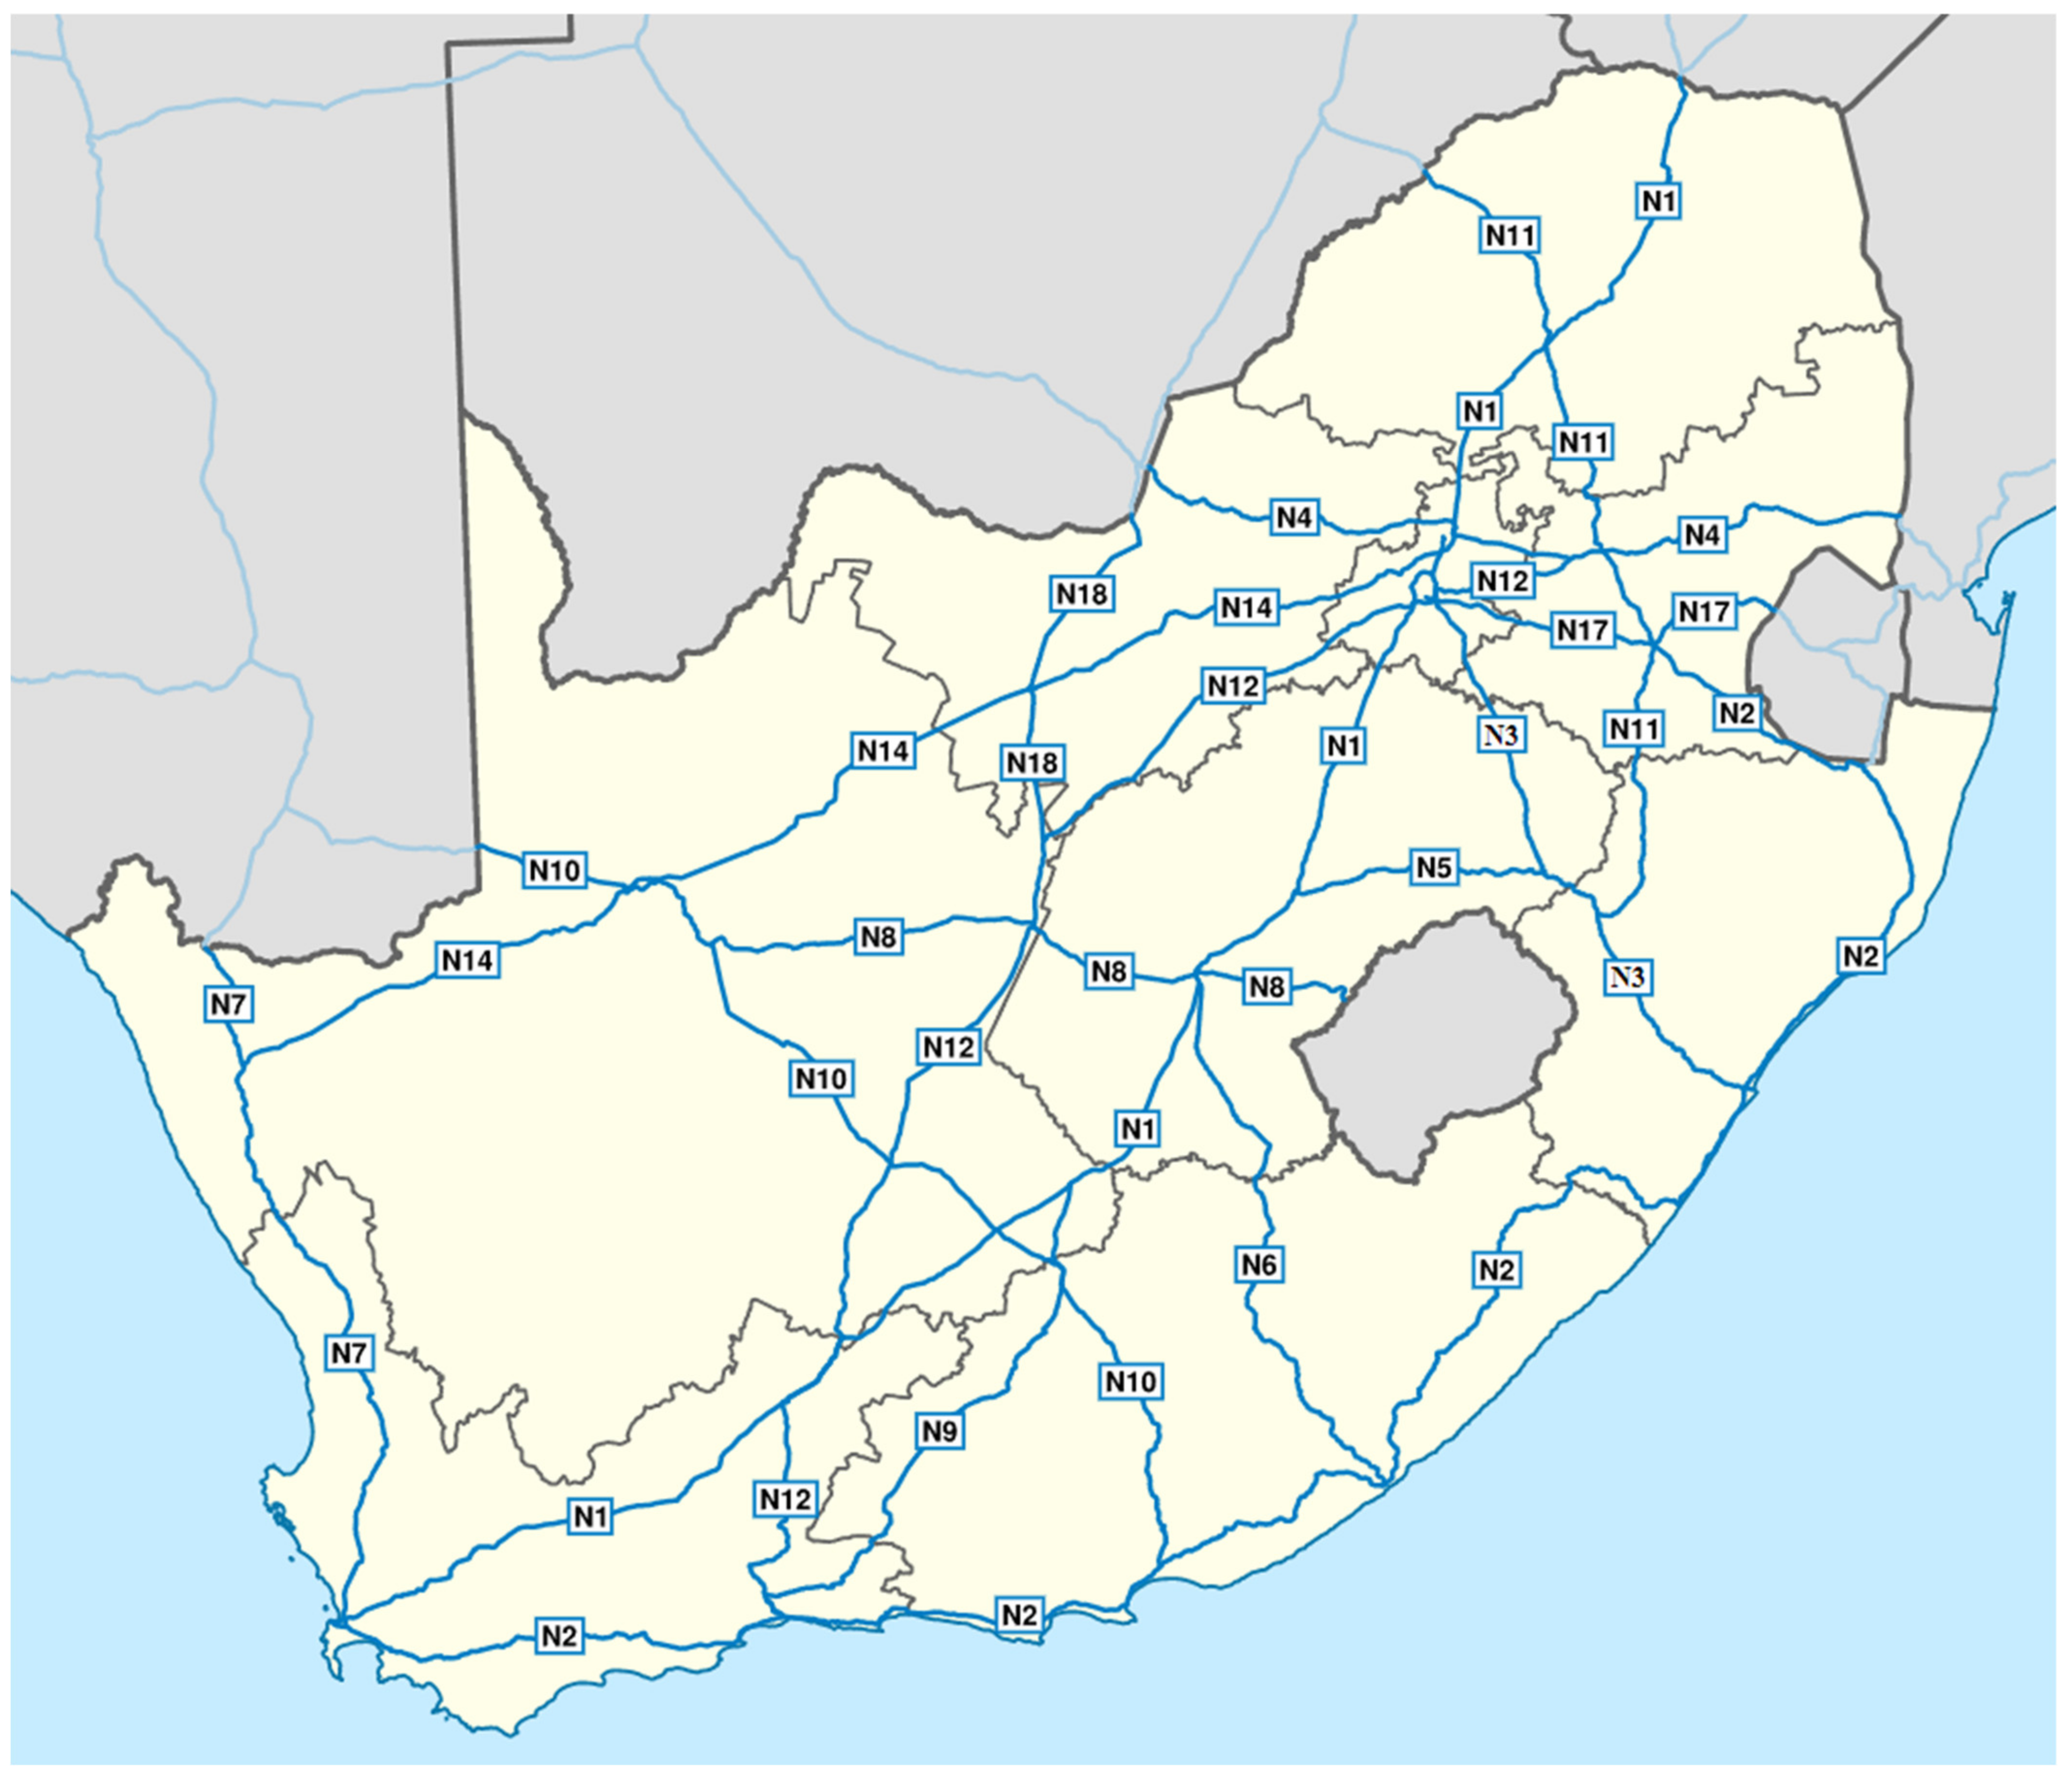
2.1. Data Collection and Study Location
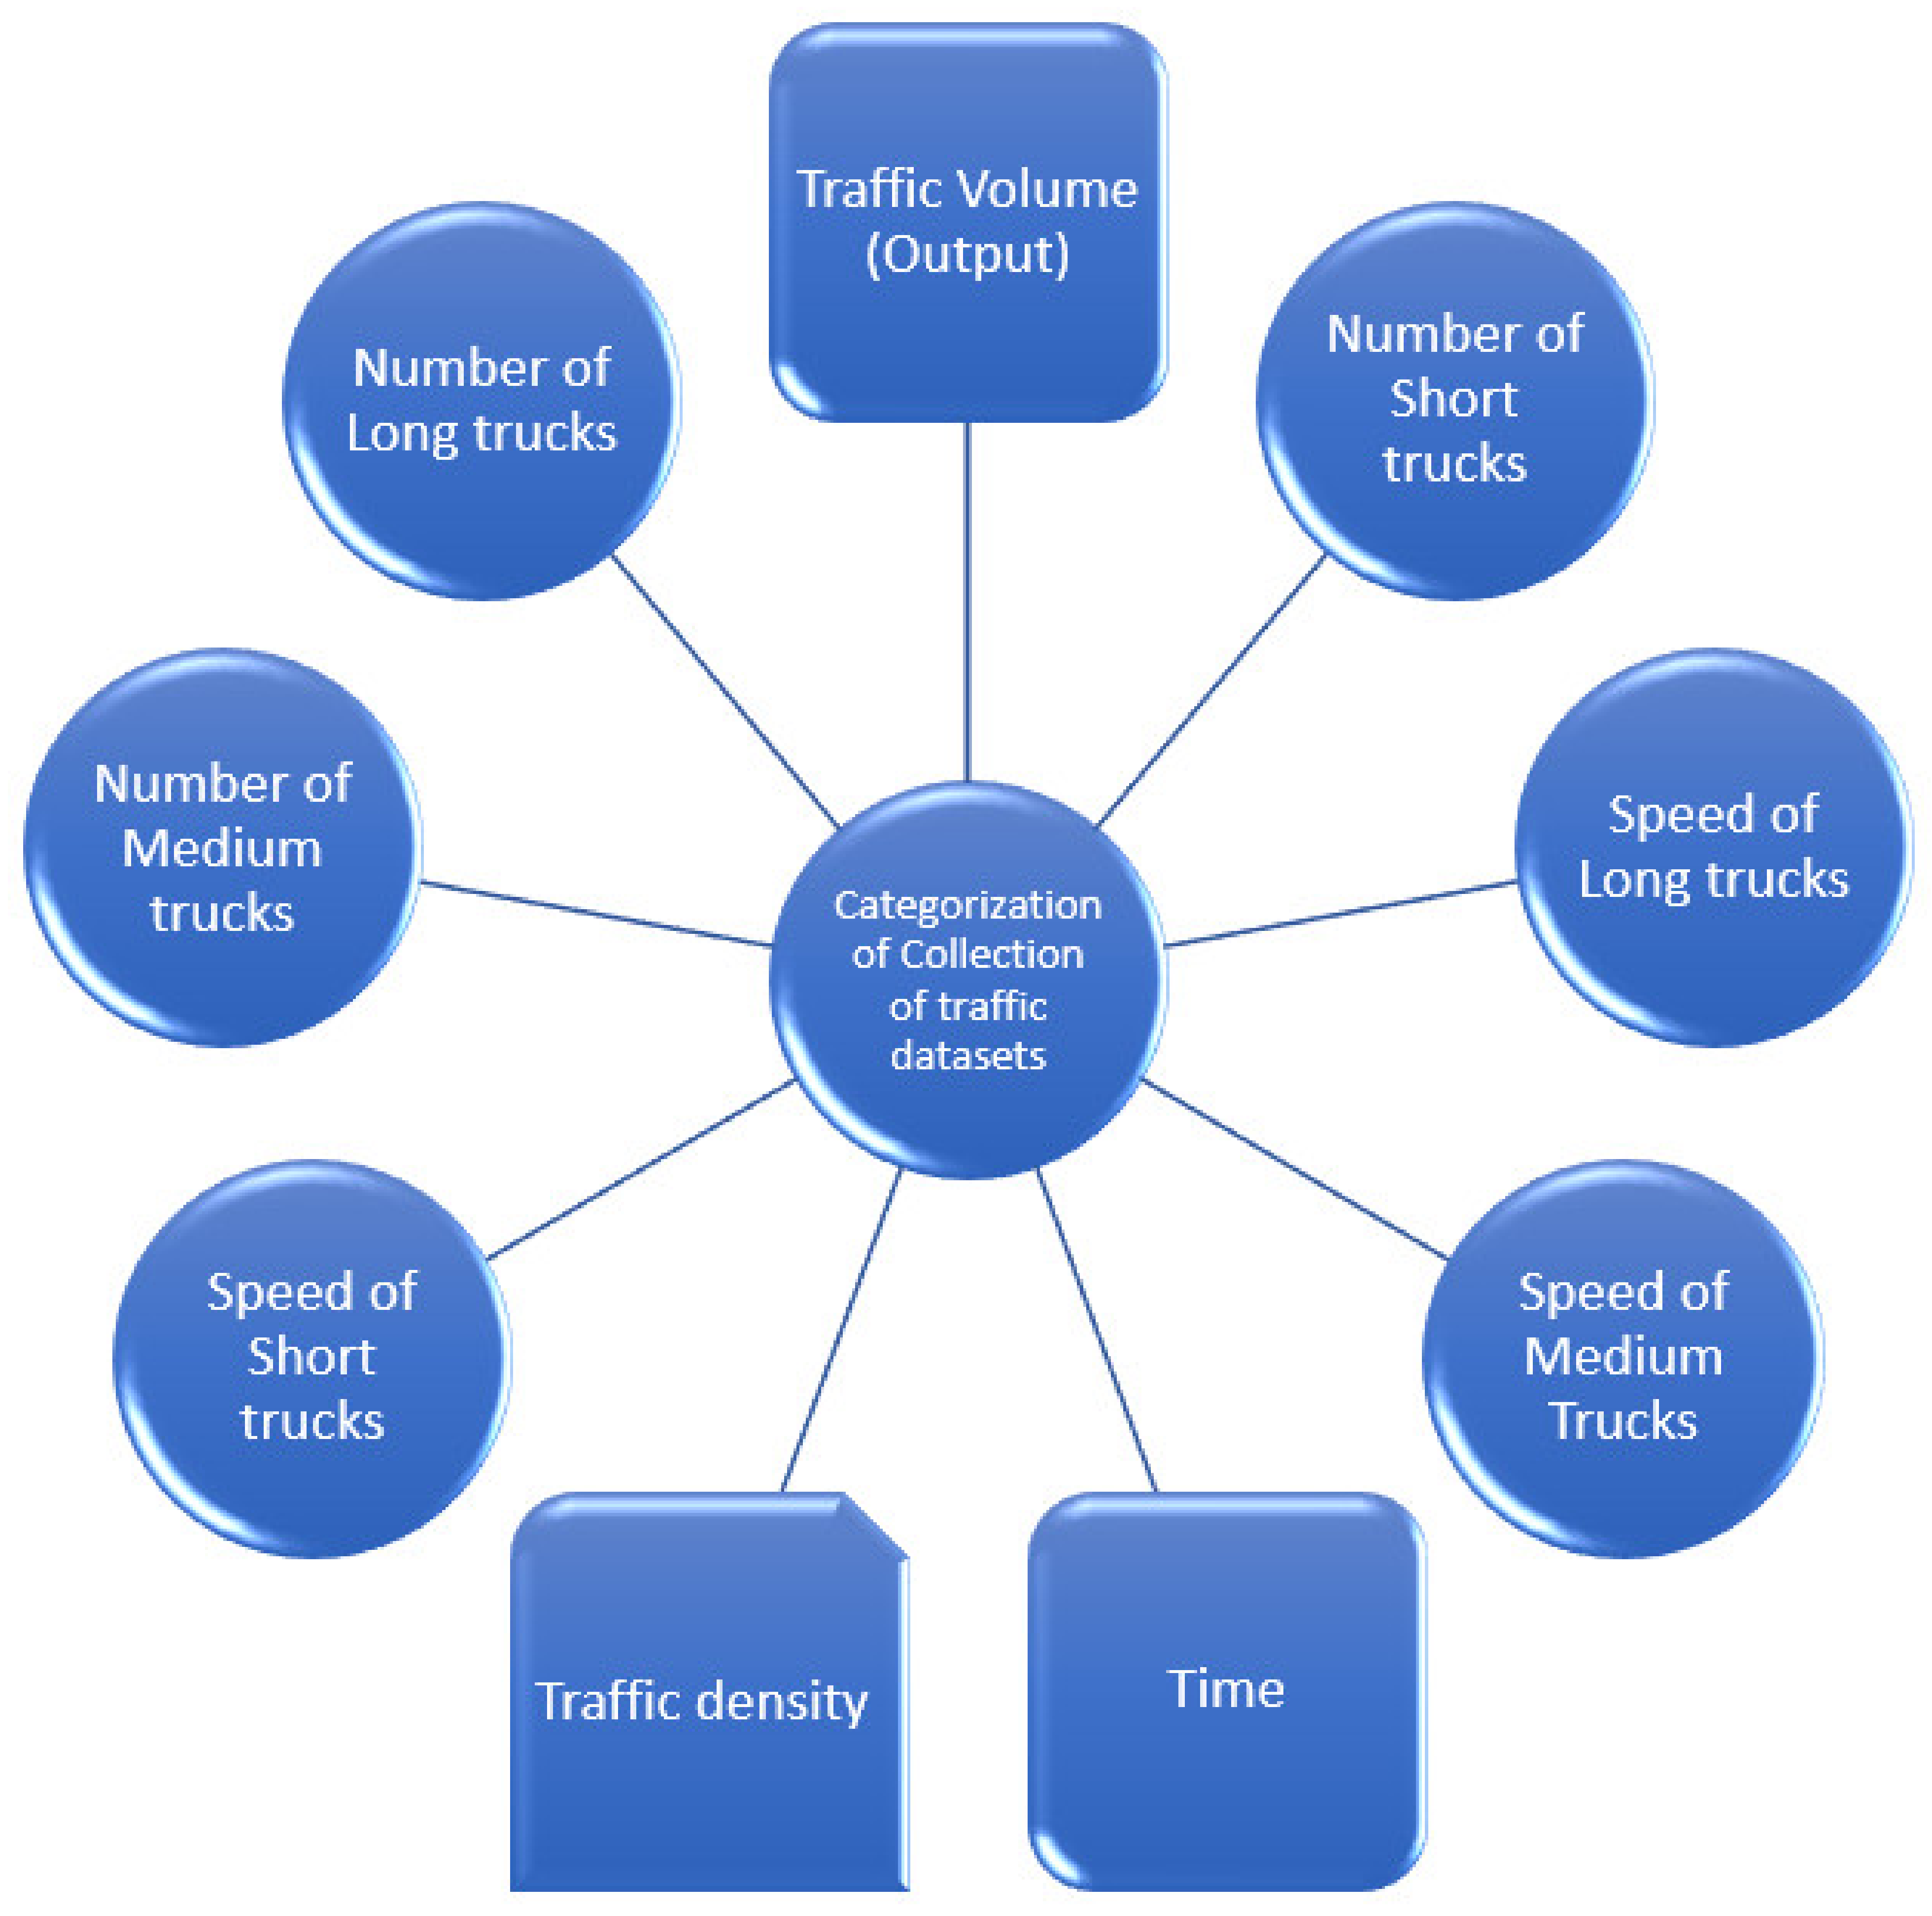
- Traffic density: This is the number of vehicles per unit length. It is calculated as:
- Traffic volume: This is the number of vehicles depending on a specific period.
- The number of short/medium/long trucks: This is the total number of different types of trucks on a specific road depending on the time of the day and traffic volume.
- Time of day of the short/medium/long trucks: This parameter depends on the speed of the vehicles or trucks and the distance of the specific road site. For example, the road sites used as a case study in this research study have their own distance. Its mathematical expression is:
- The average speed of the short/medium/long trucks: This is the speed of the vehicles on the road at a specific period. Each road has its speed limit. The road sites used for this study all have a speed limit of 120 km/h.
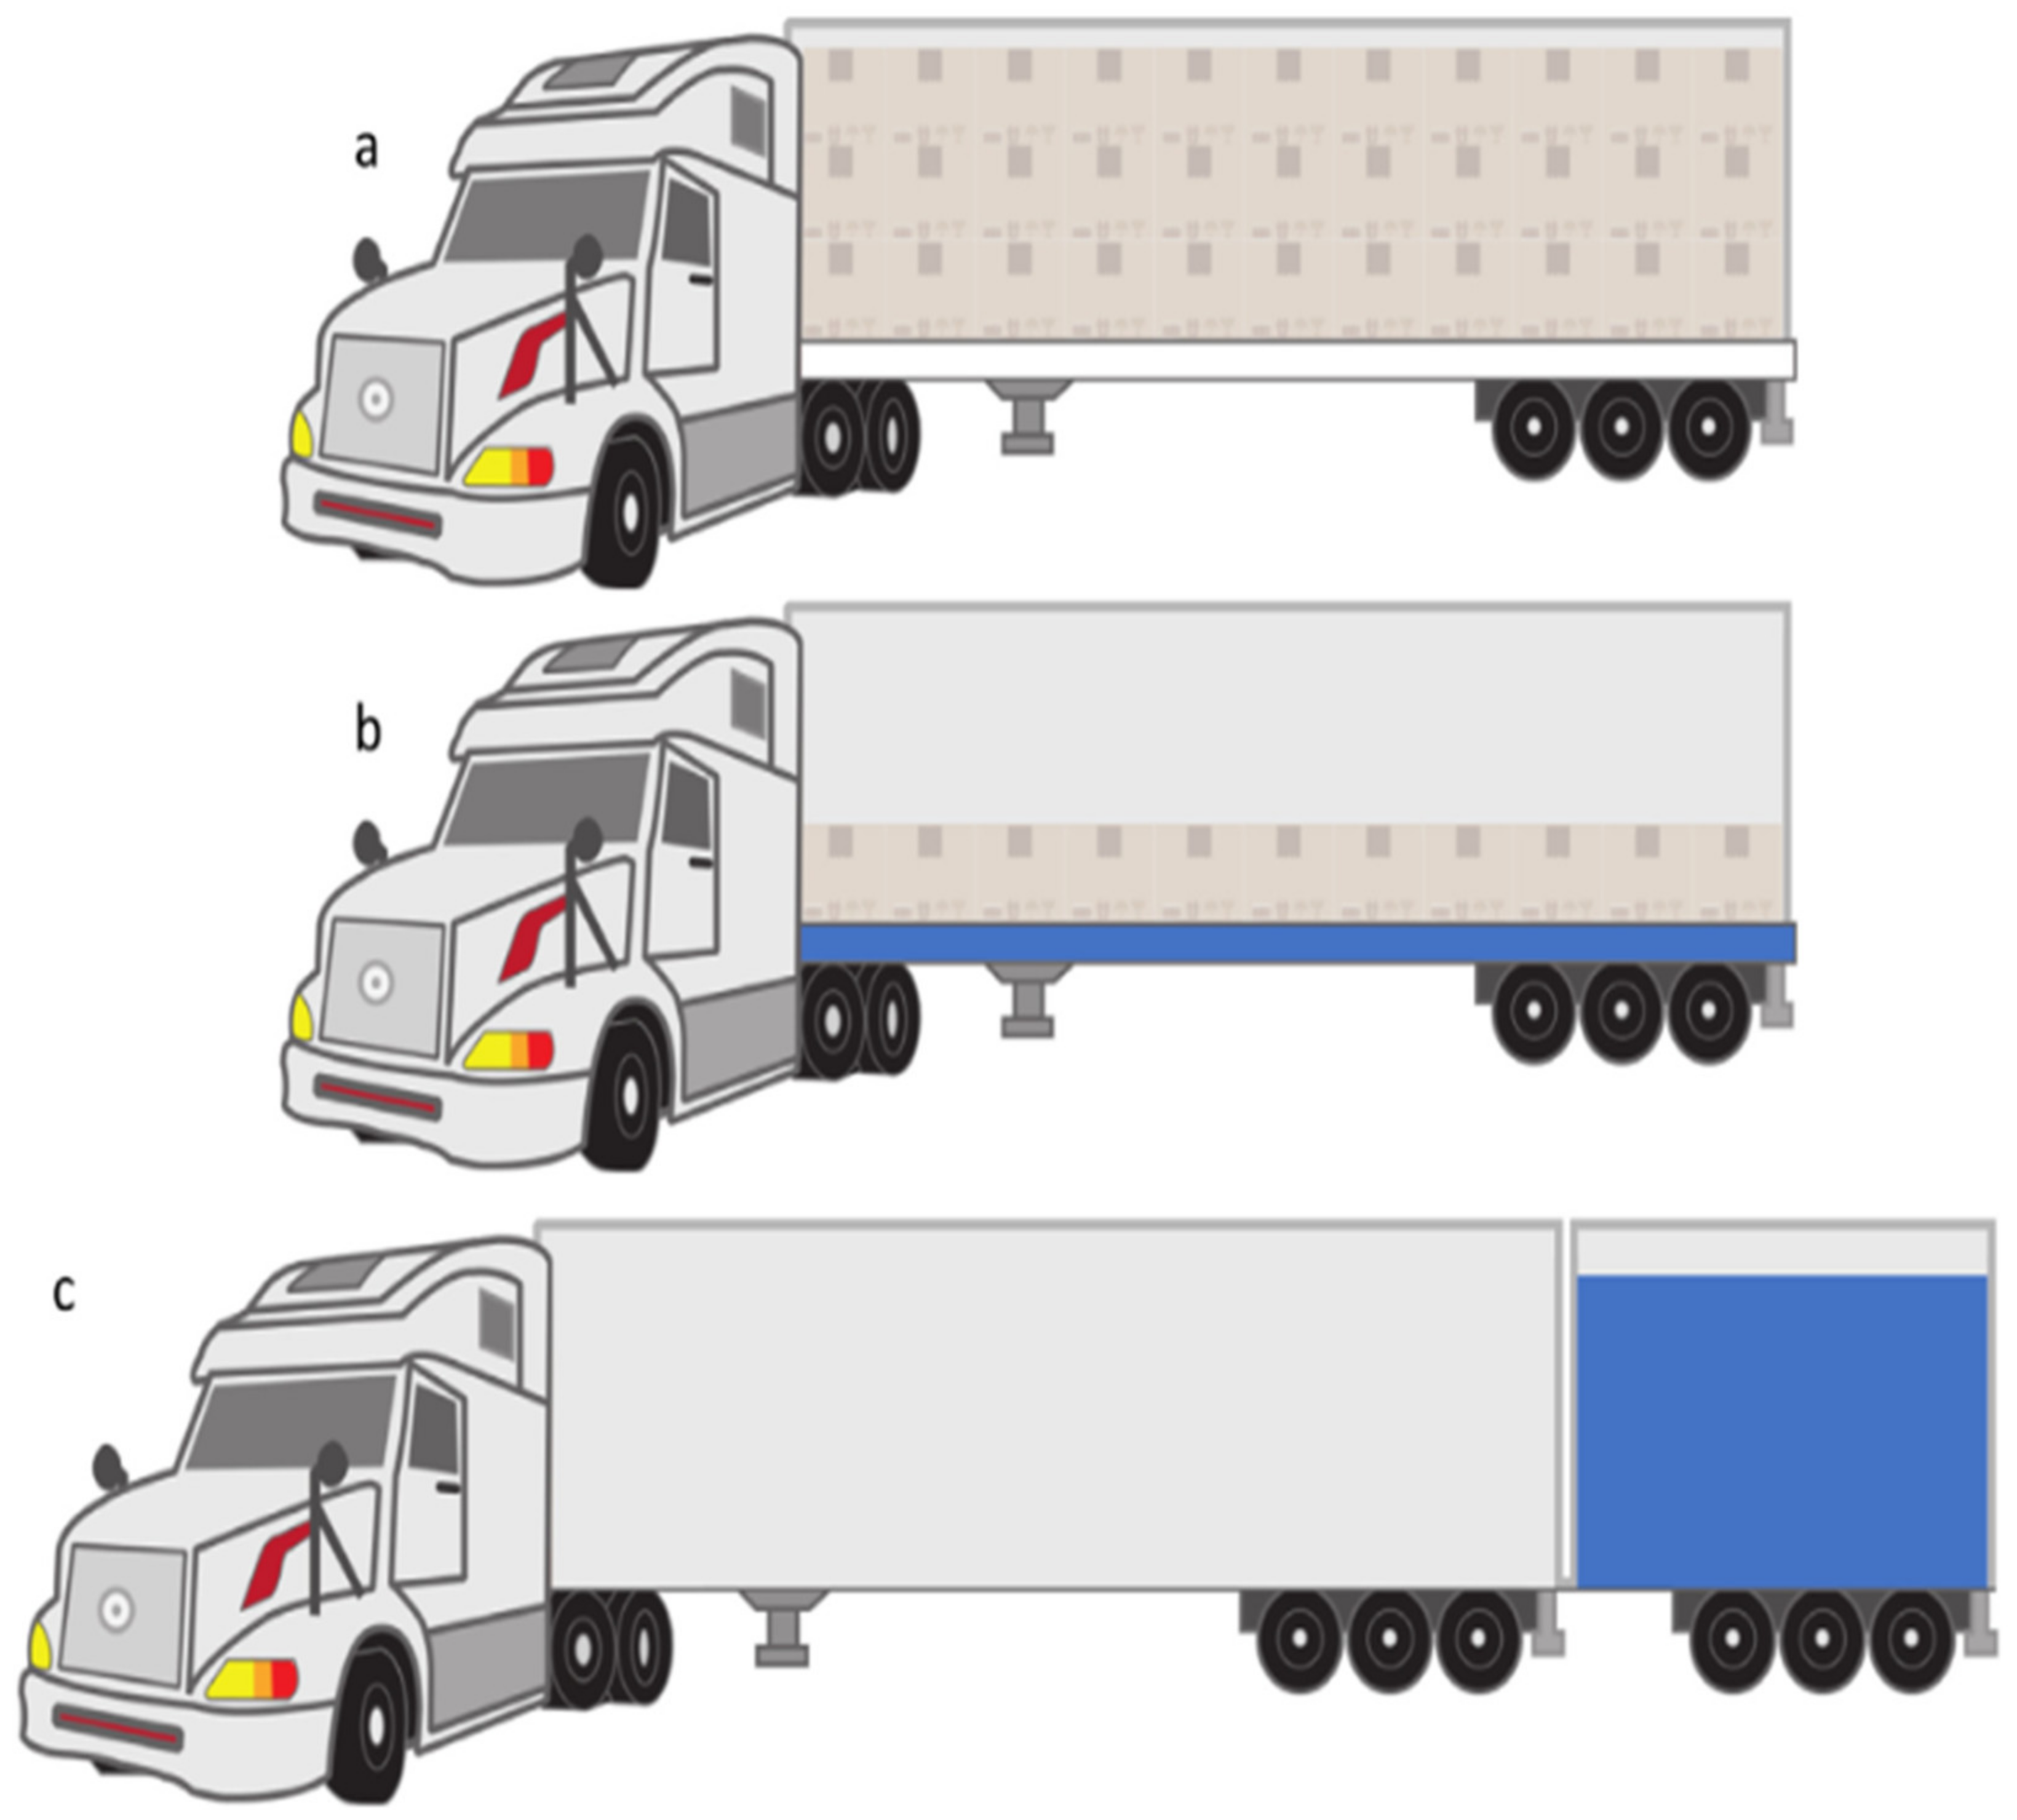
- Long trucks: These types of trucks are also called heavy trucks. They usually weigh between 26,000 lb to 32,000 lb. Examples of long trucks are log carrier trucks, refrigeration trucks, and environmental refuse trucks.
- Short Trucks: They are also known as mini trucks, bigger but smaller when compared to medium trucks. They are usually minivans, SUVs, and tow trucks.
- Medium Trucks: They are also known as large trucks but smaller when compared to heavy trucks. They weigh between 14,000 and 26,000. They are usually fire service trucks and box trucks.
2.2. Method of Data Collection
- Data loggers: These loggers are operated electronically and usually installed near a traffic light at signalized road intersections to obtain information from vehicles on a 24-h cycle.
- Loop detectors: These detectors, also called the inductive loop detectors, are usually installed inside road bumps, zebra crossings, and road intersections. They are used to know the number of vehicles and the distance travelled by each vehicle on the road.
- Video Cameras: These cameras have a wide range of views and are usually installed on traffic light poles in underground tunnels, freeways, and on rare occasions at roundabouts. Sometimes, governments use them to monitor traffic offenders and for security purposes. However, they are majorly installed to monitor the traffic situations at congested road intersections.
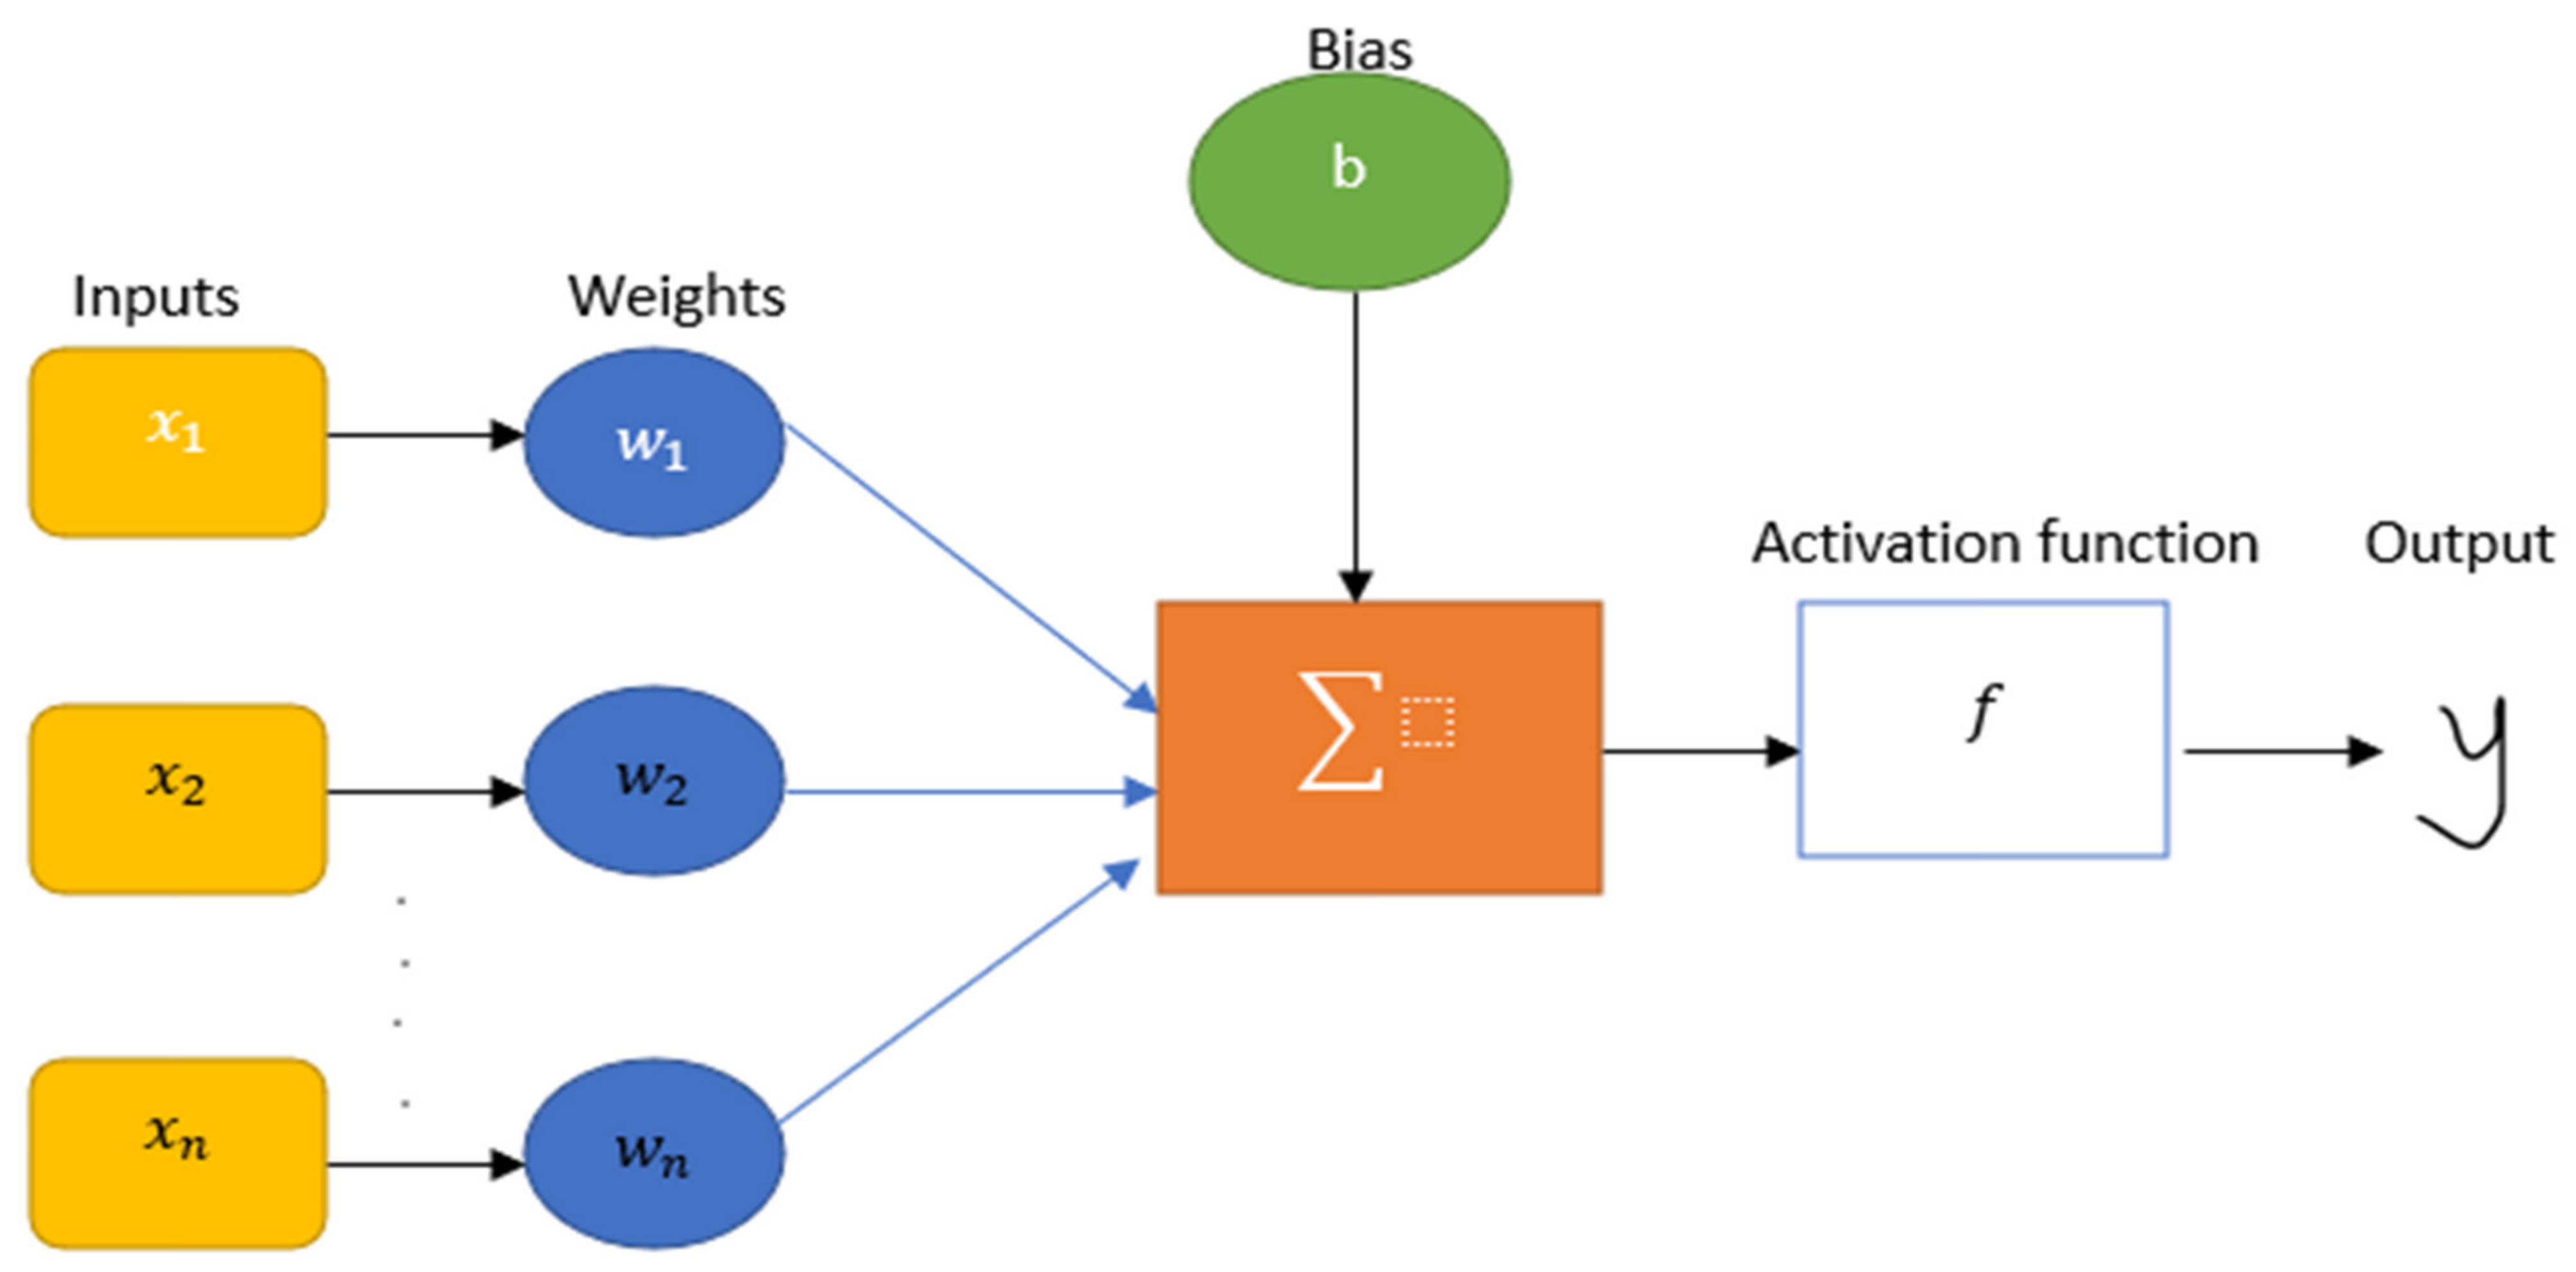
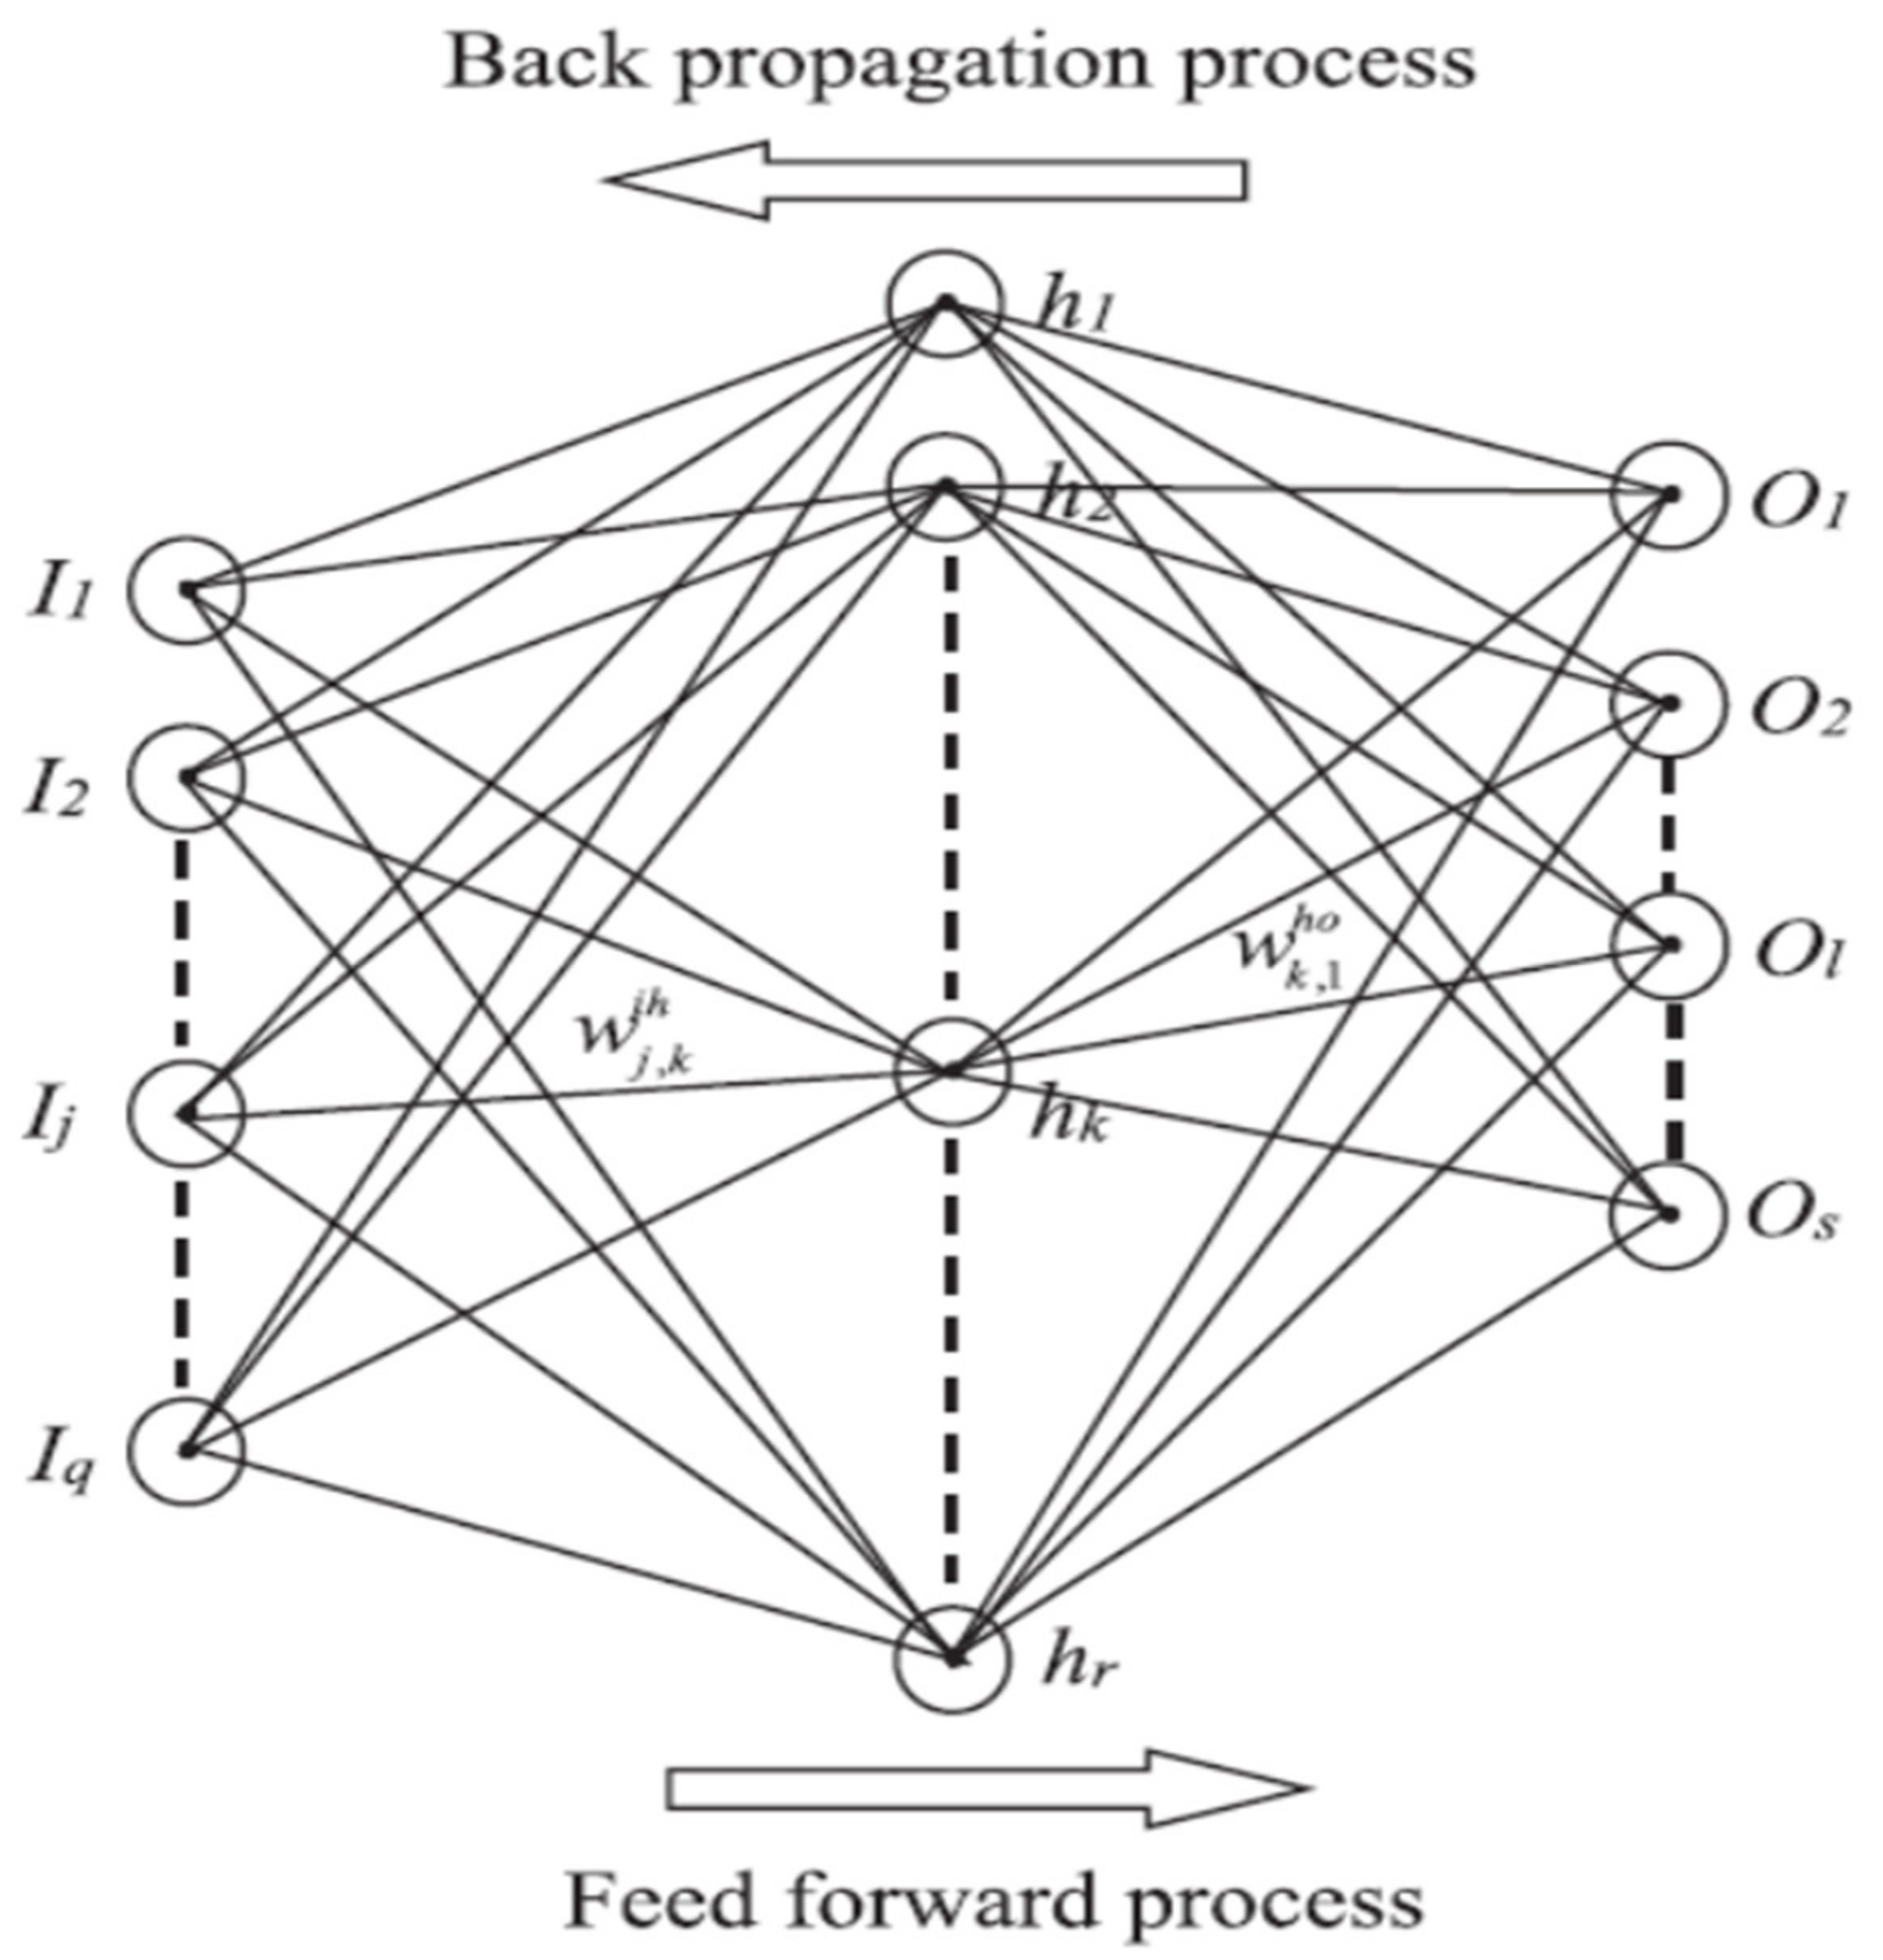
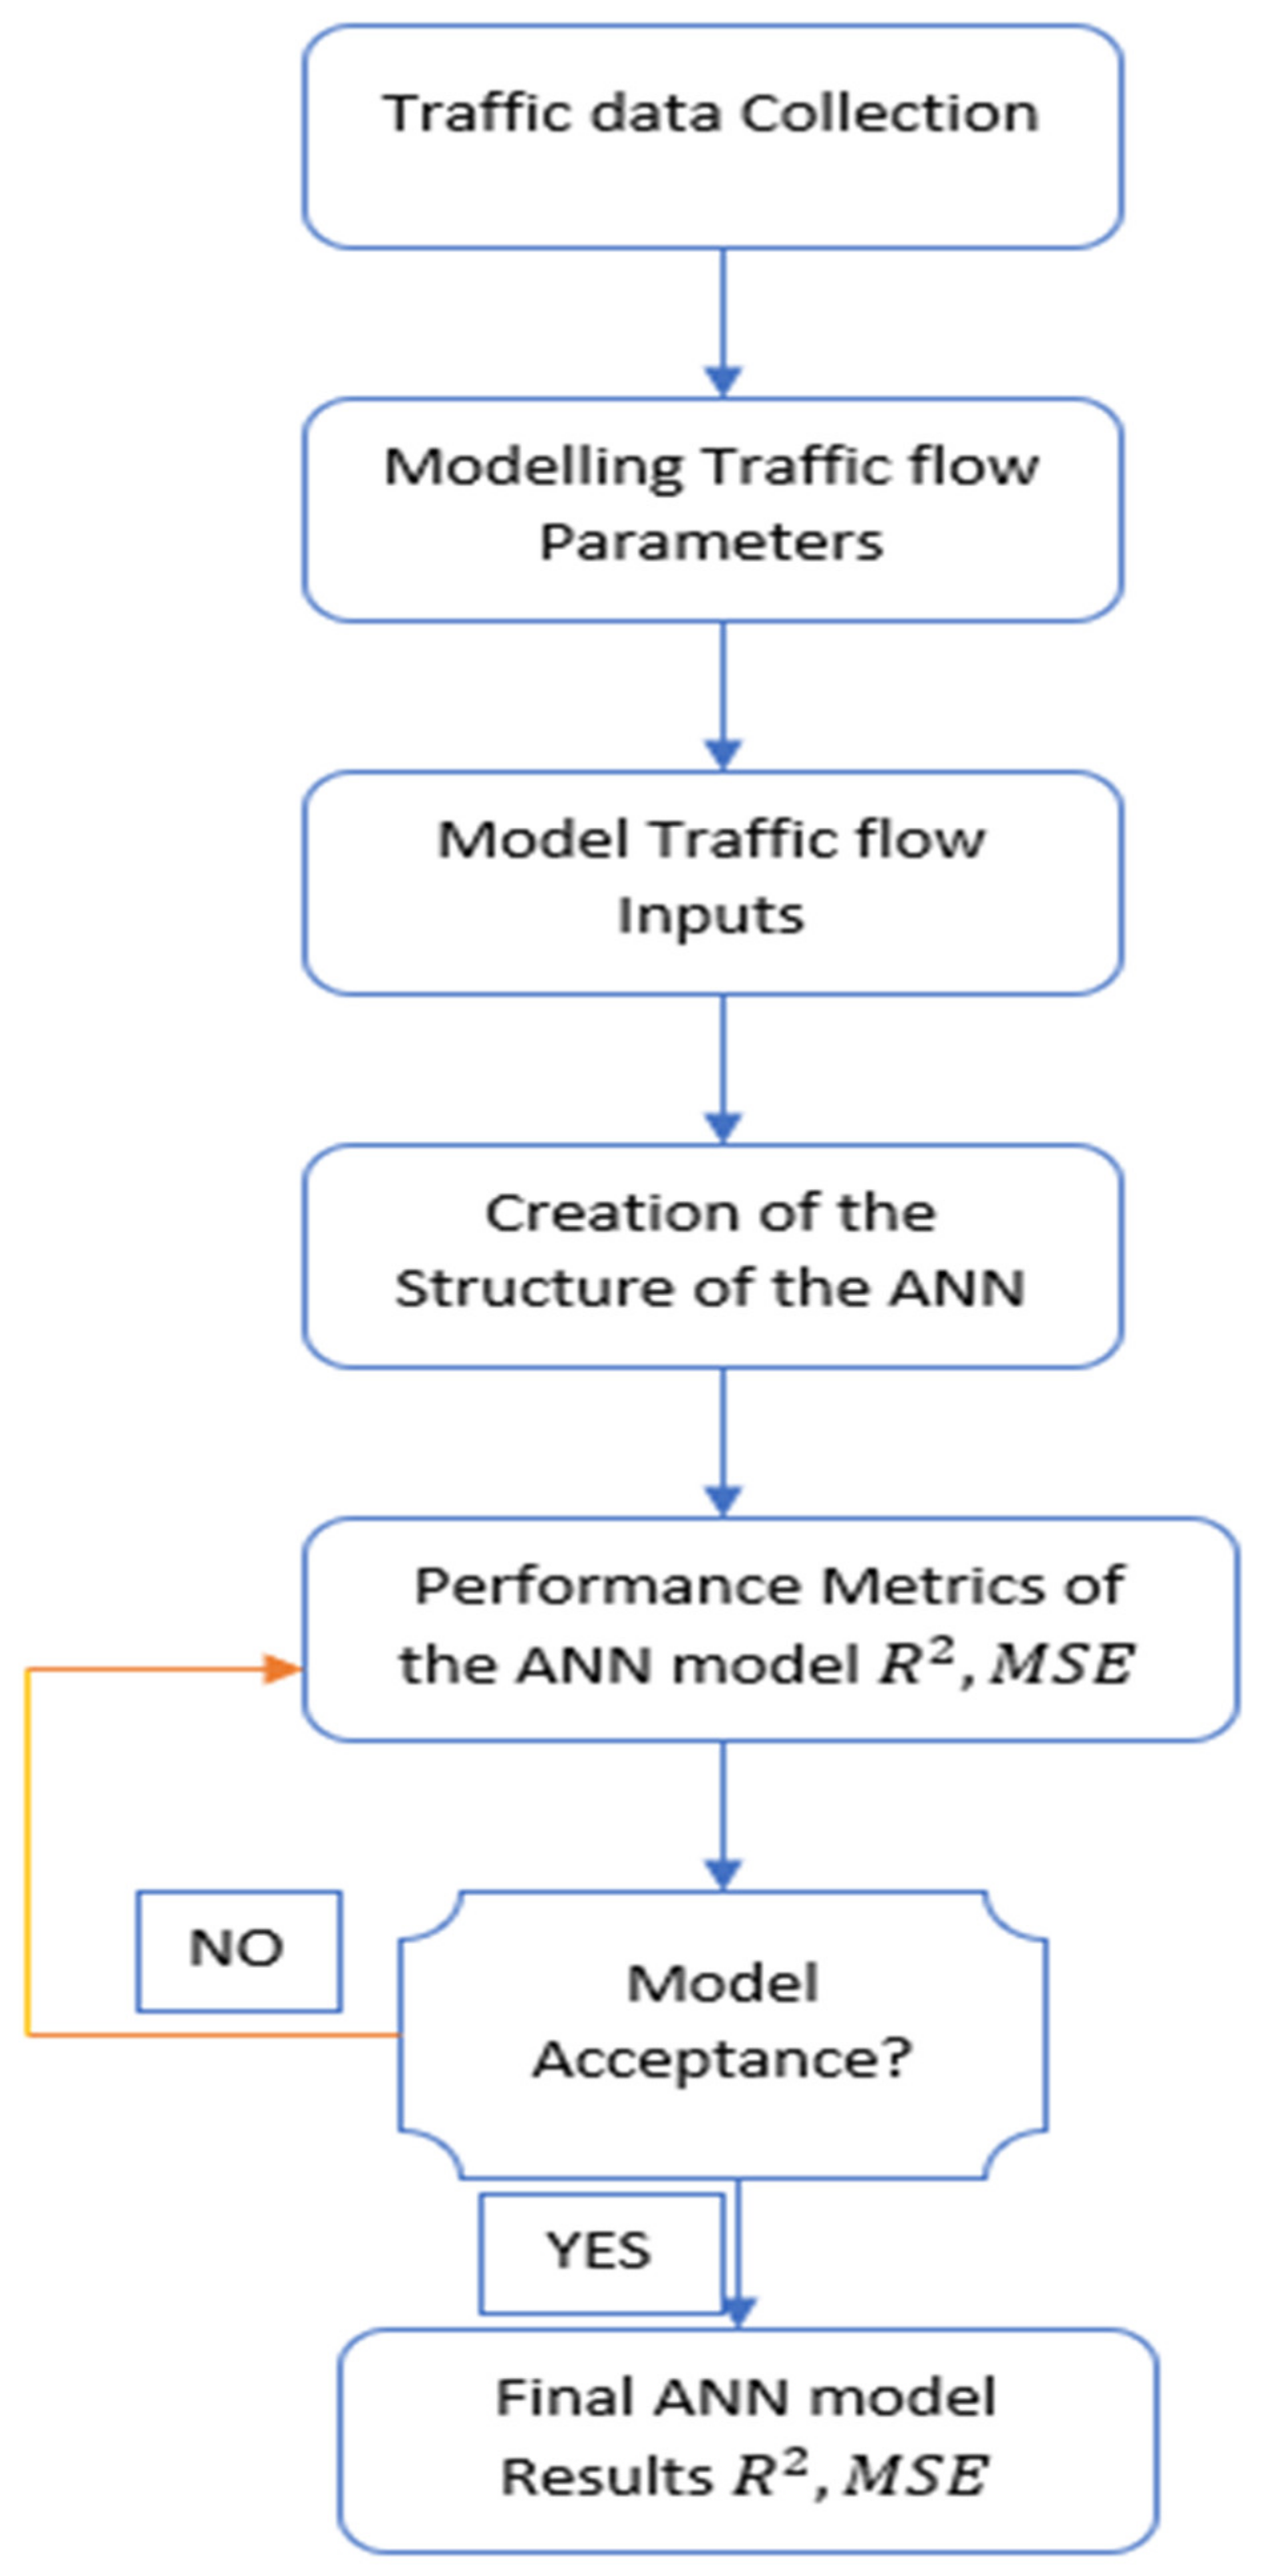
2.3. Development of the Artificial Neural Network Model
2.4. Input and Output Traffic Flow Parameters of the Trucks
2.5. Performance, Training, and Architecture of the Artificial Neural Network Model
- are known as the nodal values in previous layer i and the current layer j.
- n is the overall number of the nodal values from the previous layer.
- and are known as the weights and biases of the network.
2.6. Evaluation of the ANN Model
2.7. Model Description of the Heterogenous Optimal Velocity of Long, Short, and Medium Trucks at the Signalized Road Intersection
- represents the position of the long-short-medium trucks n at a certain time t
- is the coefficient of sensitivity
- signifies the headway of long-short-medium trucks “n”
- represents the optimal velocity of the long-short-medium trucks
- represents the maximum velocity of the long-short-medium trucks
- indicates the safe distance to drive between the long-short-medium trucks.
- The difference in reaction time between the trucks is based on the research done by [38].
- The difference in the required velocity of the long-short-medium trucks.
- n represents the ‘nth’ truck, which can be long, short, or medium.
- and have similar representation in the homogenous model, but their parameters are based on the features of the different long, short, and medium truck combinations.
- comprises of four options, they are ,
- only possesses three options, they are
Evaluation of the Linear Stability of the Heterogenous Bando’s Optimal Velocity Model
- Uniform flow in the long, short, and medium truck traffic flow
- The stability evaluation of the HEOV model
- The long, short, and medium trucks possess different features.
- Satisfying Equation (15) using the long, short, and medium trucks traffic flow can ensure traffic flow stability at signalized road intersections. However, it is too rigid to ensure the everlasting stability of these trucks at road intersections.
- All the truck-following pairs (LS, ST, and MT) do not need to be stable to ensure stability. Their stability depends on the suppression of the effects of unstable pairs by the stable pairs.
- It is important to create less strict stability criteria when compared to Equation (15).
- trucks are travelling along a signalized road intersection.
- The can be small or in a more significant number
- Headway Perturbation
- Velocity Perturbation
- represents the Fourier modes
- signifies the actual part of the signalized road intersection
- is the constant (and not dependent on ‘t’)
- can be formulated as (which is known as the discrete wave mathematical number)
- represents an even functionality
- represents the odd function
3. Results and Discussions
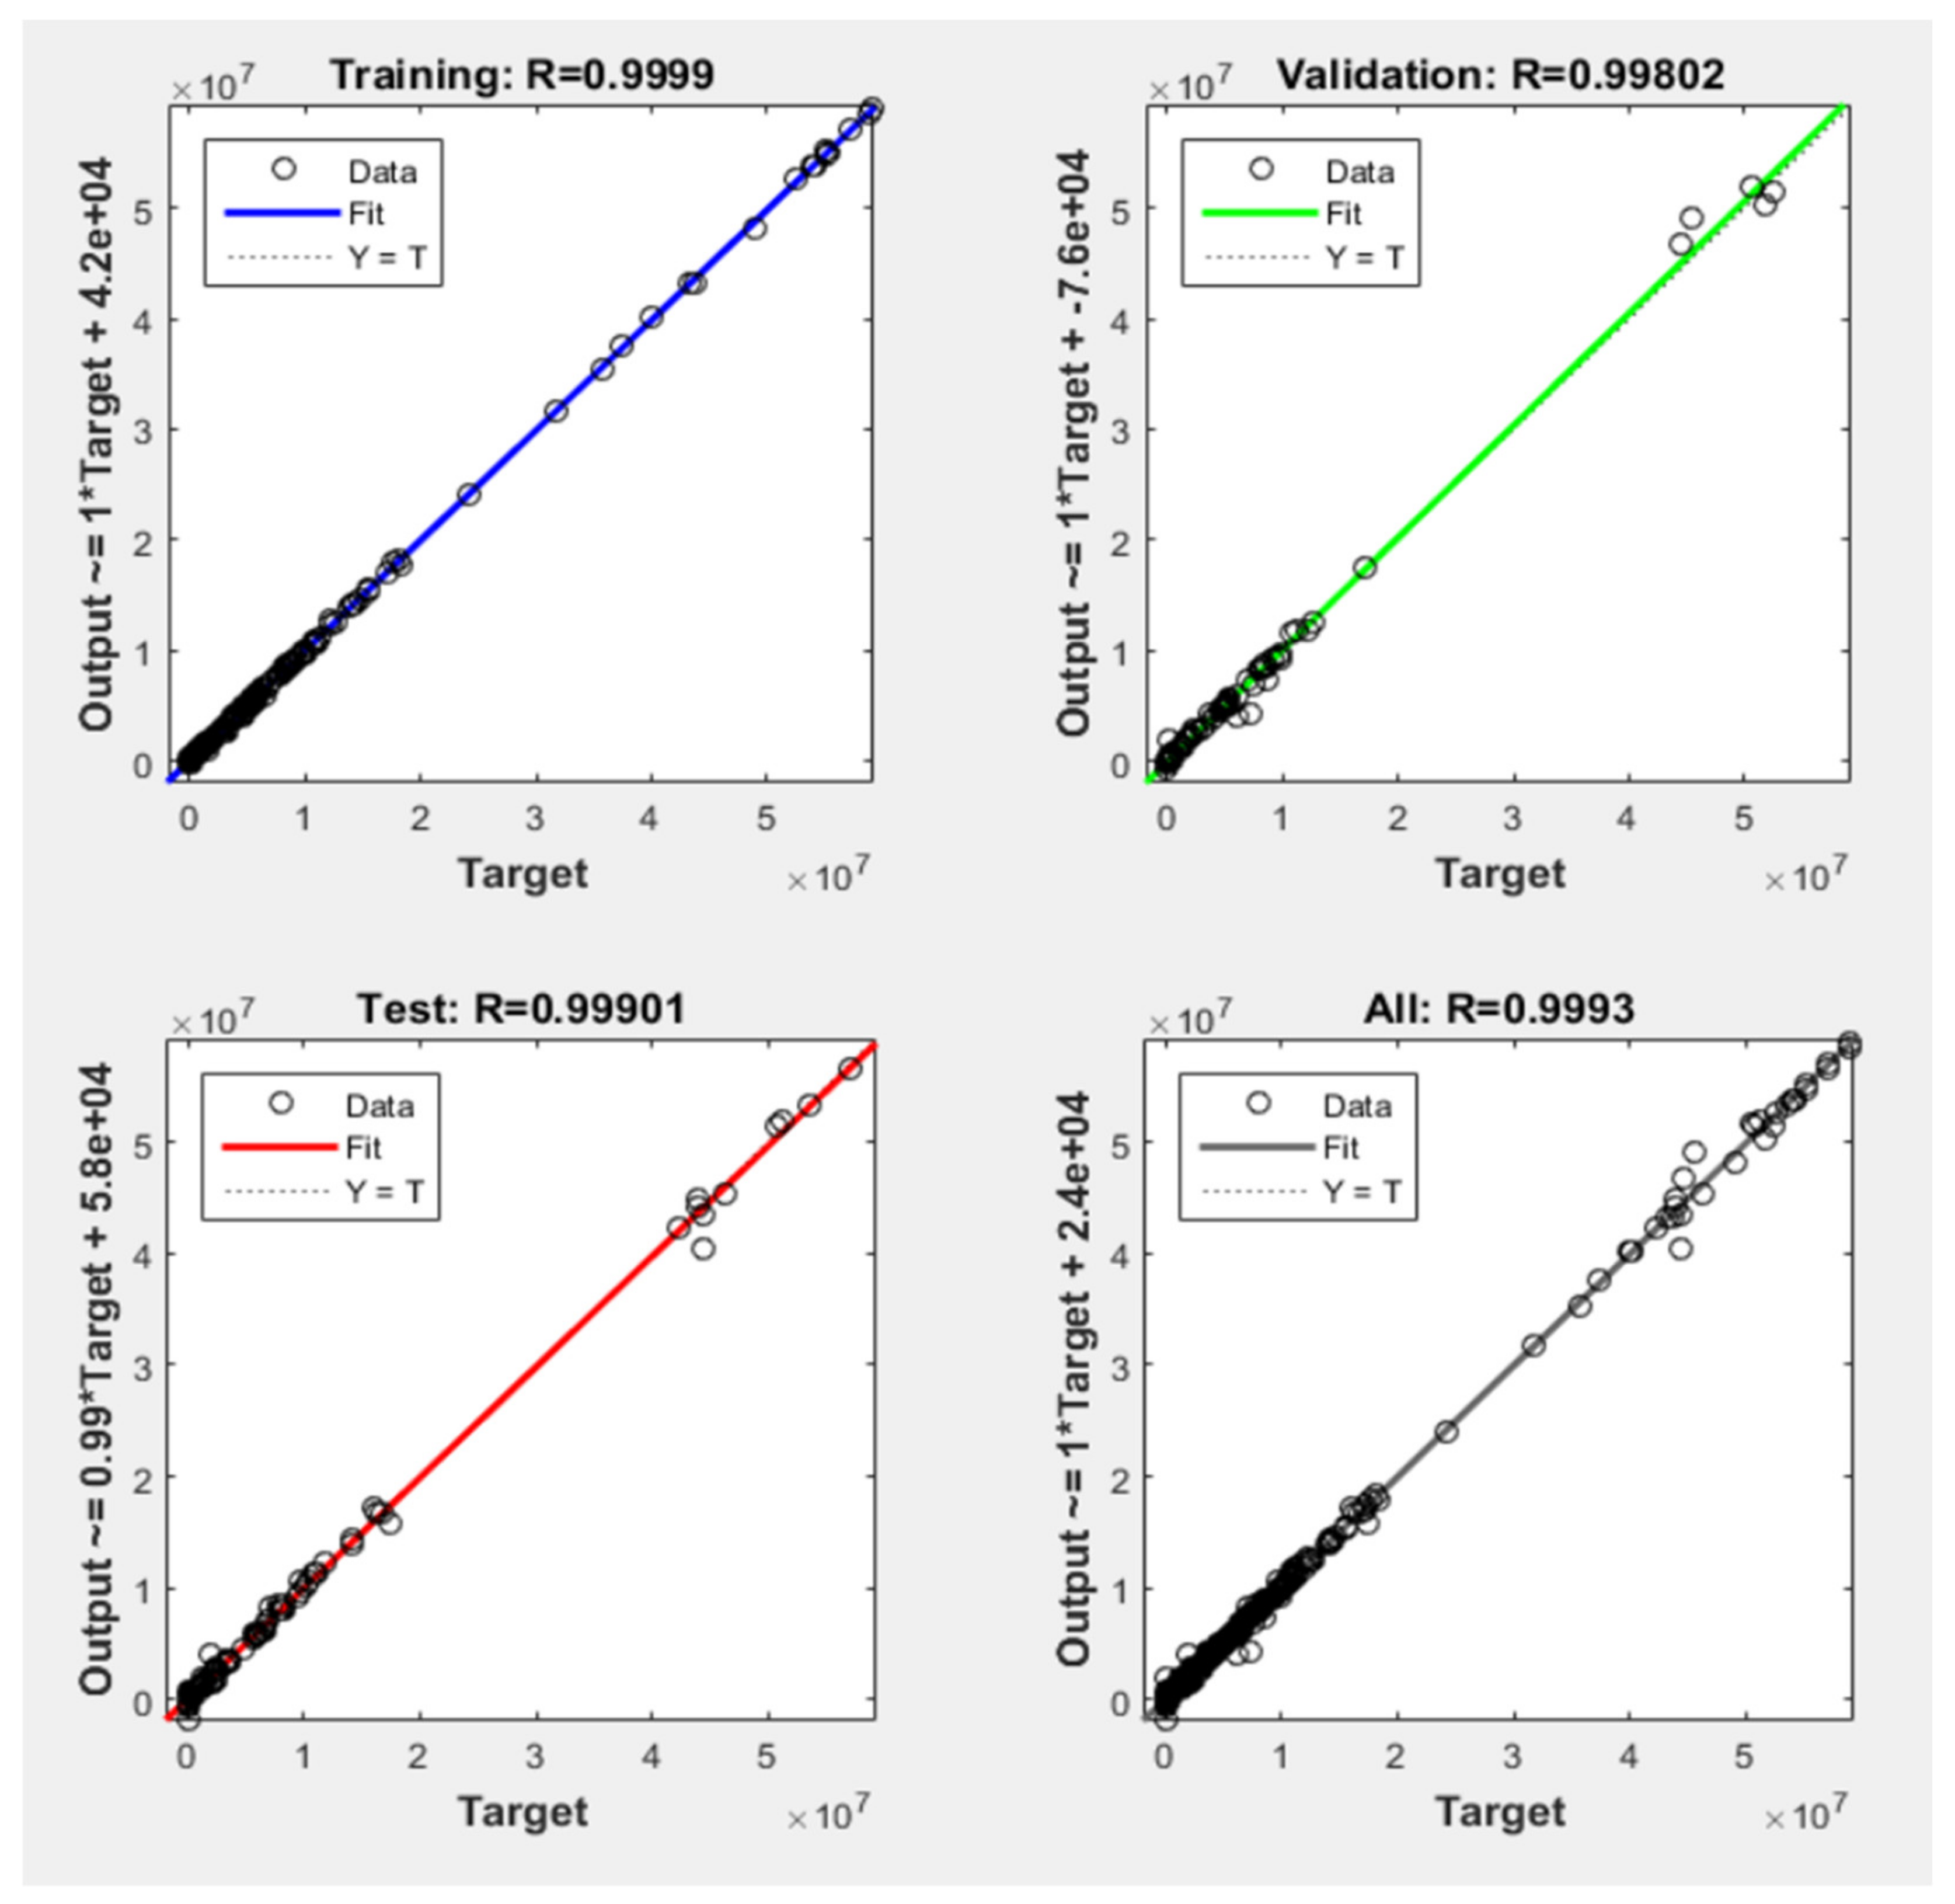
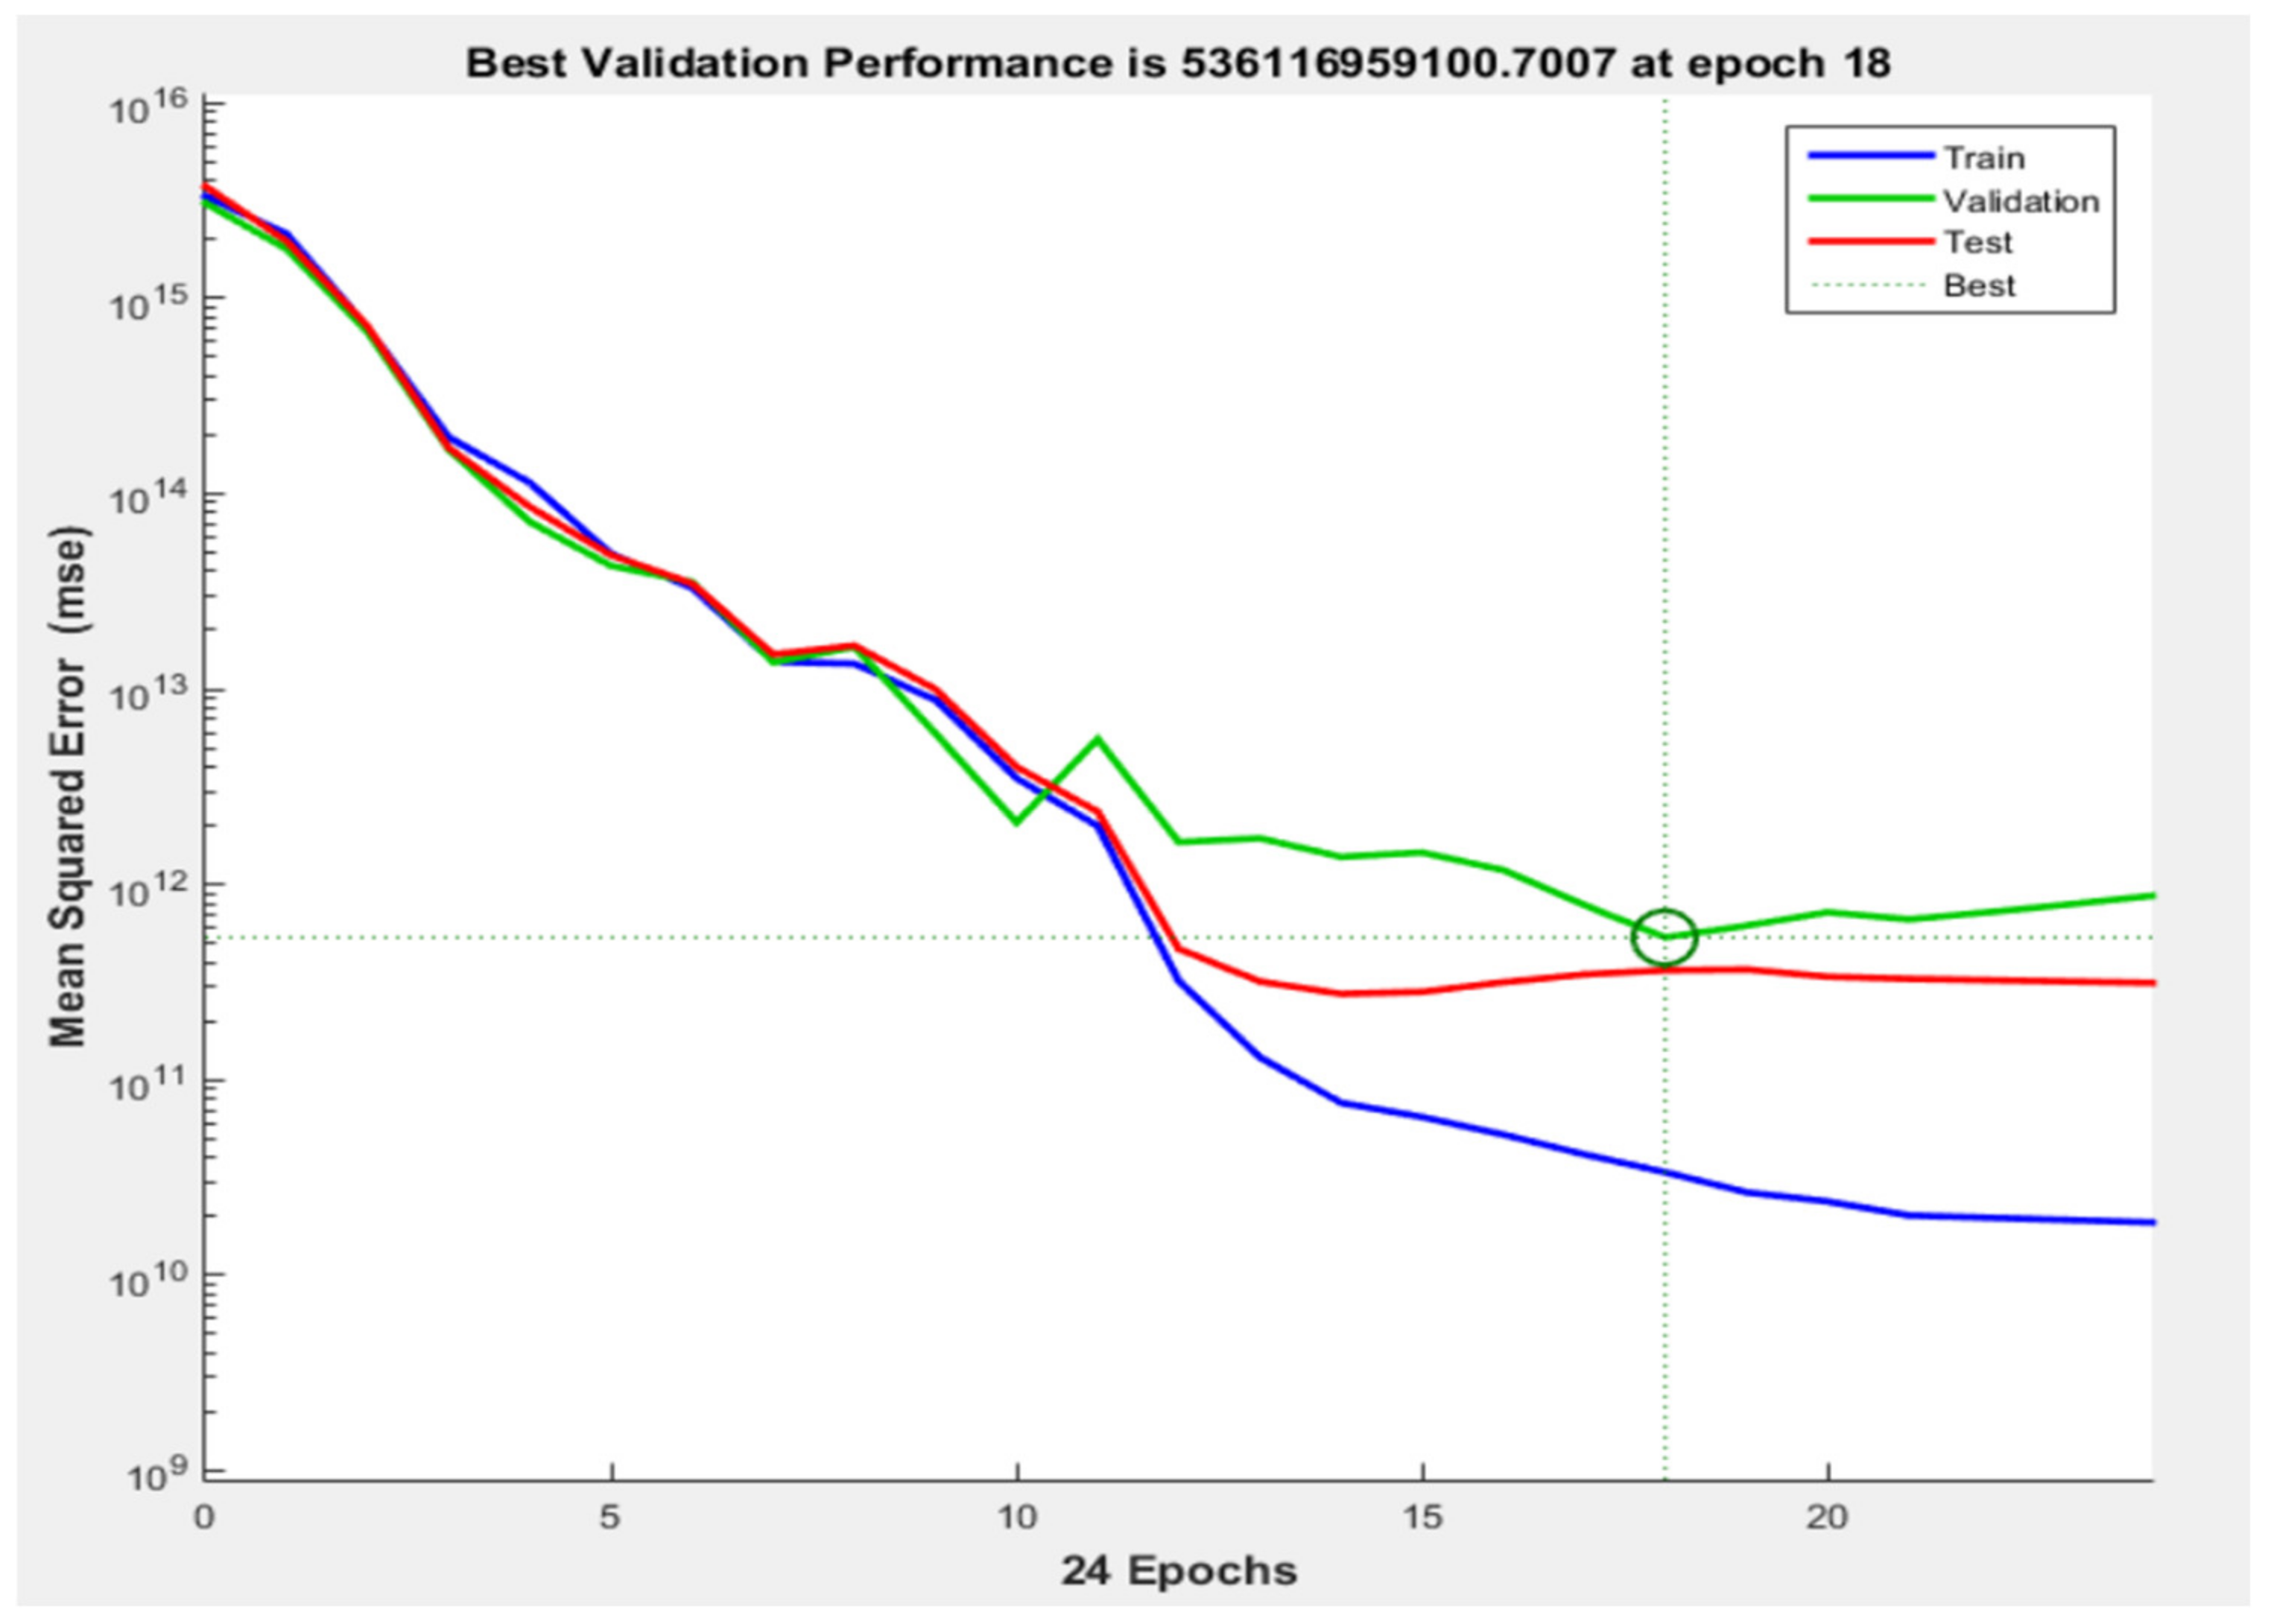
Artificial Neural Network Model
4. Conclusions and Recommendations
4.1. Conclusions
- One of the most significant findings to emerge from this research is that the stability of the long-short-medium trucks linearly is evaluated by the different proportions of the LT-ST-MT traffic flow occurrences in comparison to using the overall number of trucks on the road.
- The second significant finding was that the stabilization and destabilization of the long, short, and medium trucks at the signalized road intersections depend on the trucks’ density at the road intersections and on the traffic flow parameters of the HEOV model.
- The relevance of the Levenberg–Marquardt training algorithm in the artificial neural network model is clearly supported by the current findings of the (which is closer to 1).
- This study has shown that the traffic density, speed, and time are significant in modelling trucks’ traffic flow at signalized road intersections.
- The most apparent findings to emerge from this research are that traffic density and speed of long, short, and medium trucks significantly impact the traffic flow of other vehicles at the road intersections.
- This research extends our knowledge of traffic flow modelling of long, short, and medium trucks at signalized road intersections using machine learning (artificial neural network model).
- The current findings of this study also add to the growing body of knowledge regarding the application of a heterogenous optimal velocity model for traffic flow of long, short, and medium trucks.
- Finally, the results of this study have shown that the stabilization and destabilization of truck traffic flow at road intersections depend on the traffic density of both the long, short, and medium trucks.
4.2. Recommendations
- It would be interesting to assess the impacts of long, short, and medium trucks on the prevention analysis of accidents on freeways.
- Further research might explore the varying speed and traffic density of long and short trucks and their effects on driver behavior and pedestrians.
- Future research investigating the usage of particle swarm optimizations and genetic algorithms to predict the traffic flow of trucks on freeways would be interesting.
- Transportation researchers should also focus on comparing artificial neural network models with other emerging deep neural network models.
- Future researchers can explore other ways of validating heuristics models by using the 10-fold cross-validation.
Author Contributions
Funding
Data Availability Statement
Acknowledgments
Conflicts of Interest
Appendix A

| Notations | Explanation |
|---|---|
| The position of the long-short-medium trucks n at a certain time t. | |
| Coefficient of sensitivity | |
| The headway of long-short-medium trucks “n” | |
| The optimal velocity of the long-short-medium trucks | |
| The maximum velocity of the long-short-medium trucks | |
| The safe distance to drive between the long-short-medium trucks | |
| N | The ‘nth’ truck, which can be long, short, or medium |
| The uniform headway of medium trucks corresponding to the uniform velocity of medium trucks at a signalized road intersection | |
| The uniform headway of long trucks corresponding to the uniform velocity of long trucks at a signalized road intersection | |
| The uniform headway of short trucks corresponding to the uniform velocity of short trucks at a signalized road intersection | |
| The optimal velocity derivatives function at the uniform headway distance of long, short, and medium trucks | |
| The small headway perturbation of the long, short, and medium trucks at the signalized road intersection | |
| The velocity perturbation of the long, short, and medium trucks at the signalized road intersection. | |
| The function of the optimal velocity of the long, short, and medium trucks ‘x’ at uniform headway | |
| The Fourier modes | |
| The actual part of the signalized road intersection | |
| The constant (and not dependent on ‘t’) | |
| Even functionality | |
| Odd function |
References
- Isaac, O.O.; Tartibu, L.K.; Okwu, M.O. Prediction and Modelling of Traffic Flow of Human-driven Vehicles at a Signalized Road Intersection Using Artificial Neural Network Model: A South Africa Road Transportation System Scenario. Transp. Eng. 2021, 6, 100095. [Google Scholar]
- Olayode, I.O.; Tartibu, L.K.; Okwu, M.O. Traffic flow Prediction at Signalized Road Intersections: A case of Markov Chain and Artificial Neural Network Model. In Proceedings of the 2021 IEEE 12th International Conference on Mechanical and Intelligent Manufacturing Technologies (ICMIMT), Cape Town, South Africa, 13–15 May 2021; pp. 287–292. [Google Scholar]
- Taylor, J.; Zhou, X.; Rouphail, N.M.; Porter, R.J. Method for investigating intradriver heterogeneity using vehicle trajectory data: A dynamic time warping approach. Transp. Res. Part B Methodol. 2015, 73, 59–80. [Google Scholar] [CrossRef]
- Ossen, S.; Hoogendoorn, S.P. Driver heterogeneity in car following and its impact on modeling traffic dynamics. Transp. Res. Rec. 2007, 1999, 95–103. [Google Scholar] [CrossRef]
- Davis, L. Effect of adaptive cruise control systems on mixed traffic flow near an on-ramp. Phys. A Stat. Mech. Its Appl. 2007, 379, 274–290. [Google Scholar] [CrossRef]
- Islam, M.M.; Choudhury, C.F. A Violation Behavior Model for Non-Motorized Vehicle Drivers in Heterogeneous Traffic Streams. 2012. Available online: https://trid.trb.org/view/1130163 (accessed on 15 May 2022).
- Xiao, X.; Duan, H.; Wen, J. A novel car-following inertia gray model and its application in forecasting short-term traffic flow. Appl. Math. Model. 2020, 87, 546–570. [Google Scholar] [CrossRef]
- Olayode, I.O.; Tartibu, L.K.; Okwu, M.O.; Ukaegbu, U.F. Development of a Hybrid Artificial Neural Network-Particle Swarm Optimization Model for the Modelling of Traffic Flow of Vehicles at Signalized Road Intersections. Appl. Sci. 2021, 11, 8387. [Google Scholar] [CrossRef]
- Severino, A.; Pappalardo, G.; Curto, S.; Trubia, S.; Olayode, I.O. Safety Evaluation of Flower Roundabout Considering Autonomous Vehicles Operation. Sustainability 2021, 13, 10120. [Google Scholar] [CrossRef]
- Olayode, O.I.; Tartibu, L.K.; Okwu, M.O. Application of Adaptive Neuro-Fuzzy Inference System Model on Traffic Flow of Vehicles at a Signalized Road Intersections. In Proceedings of the ASME 2021 International Mechanical Engineering Congress and Exposition, Virtual, Online, 1–5 November 2021; V009T09A015; Engineering Education. ASME: New York, NY, USA, 2021; Volume 9. [Google Scholar] [CrossRef]
- Feng, X.; Ling, X.; Zheng, H.; Chen, Z.; Xu, Y. Adaptive multi-kernel SVM with spatial–temporal correlation for short-term traffic flow prediction. IEEE Trans. Intell. Transp. Syst. 2018, 20, 2001–2013. [Google Scholar] [CrossRef]
- Ma, D.; Song, X.; Li, P. Daily traffic flow forecasting through a contextual convolutional recurrent neural network modeling inter-and intra-day traffic patterns. IEEE Trans. Intell. Transp. Syst. 2020, 22, 2627–2636. [Google Scholar] [CrossRef]
- Olayode, I.O.; Severino, A.; Campisi, T.; Tartibu, L.K. Prediction of Vehicular Traffic Flow using Levenberg-Marquardt Artificial Neural Network Model: Italy Road Transportation System. Commun.-Sci. Lett. Univ. Zilina 2022, 24, E74–E86. [Google Scholar] [CrossRef]
- Hamed, M.M.; Al-Masaeid, H.R.; Said, Z.M.B. Short-term prediction of traffic volume in urban arterials. J. Transp. Eng. 1995, 121, 249–254. [Google Scholar] [CrossRef]
- Wang, Y.; Papageorgiou, M. Real-time freeway traffic state estimation based on extended Kalman filter: A general approach. Transp. Res. Part B Methodol. 2005, 39, 141–167. [Google Scholar] [CrossRef]
- Sun, H.; Liu, H.X.; Xiao, H.; He, R.R.; Ran, B. Use of local linear regression model for short-term traffic forecasting. Transp. Res. Rec. 2003, 1836, 143–150. [Google Scholar] [CrossRef]
- Cai, P.; Wang, Y.; Lu, G.; Chen, P.; Ding, C.; Sun, J. A spatiotemporal correlative k-nearest neighbor model for short-term traffic multistep forecasting. Transp. Res. Part C Emerg. Technol. 2016, 62, 21–34. [Google Scholar] [CrossRef]
- Olayode, I.O.; Tartibu, L.K.; Okwu, M.O.; Severino, A. Comparative Traffic Flow Prediction of a Heuristic ANN Model and a Hybrid ANN-PSO Model in the Traffic Flow Modelling of Vehicles at a Four-Way Signalized Road Intersection. Sustainability 2021, 13, 10704. [Google Scholar] [CrossRef]
- Chen, X.; Wei, Z.; Liu, X.; Cai, Y.; Li, Z.; Zhao, F. Spatiotemporal variable and parameter selection using sparse hybrid genetic algorithm for traffic flow forecasting. Int. J. Distrib. Sens. Netw. 2017, 13, 1550147717713376. [Google Scholar] [CrossRef]
- Deng, S.; Jia, S.; Chen, J. Exploring spatial–temporal relations via deep convolutional neural networks for traffic flow prediction with incomplete data. Appl. Soft Comput. 2019, 78, 712–721. [Google Scholar] [CrossRef]
- Thomas, T.; Weijermars, W.; van Berkum, E. Predictions of urban volumes in single time series. IEEE Trans. Intell. Transp. Syst. 2009, 11, 71–80. [Google Scholar] [CrossRef]
- Ahmed, M.S.; Cook, A.R. Analysis of Freeway Traffic Time-Series Data by Using Box-Jenkins Techniques; No. 722; Transportation Research Board: Washington, DC, USA, 1979. [Google Scholar]
- Okutani, I.; Stephanedes, Y. Dynamic prediction of traffic volume through Kalman filtering theory. Transp. Res. Part B Methodol. 1984, 18, 1–11. [Google Scholar] [CrossRef]
- Drucker, H.; Burges, C.J.; Kaufman, L.; Smola, A.; Vapnik, V. Support vector regression machines. Adv. Neural Inf. Process. Syst. 1996, 9, 155–161. [Google Scholar]
- Suykens, J.A.; Vandewalle, J.; de Moor, B. Optimal control by least squares support vector machines. Neural Netw. 2001, 14, 23–35. [Google Scholar] [CrossRef]
- Peng, X. TSVR: An efficient twin support vector machine for regression. Neural Netw. 2010, 23, 365–372. [Google Scholar] [CrossRef] [PubMed]
- Huang, H.-J.; Ding, S.-F.; Shi, Z.-Z. Primal least squares twin support vector regression. J. Zhejiang Univ. Sci. C 2013, 14, 722–732. [Google Scholar] [CrossRef]
- Zhang, W.; Feng, Y.; Lu, K.; Song, Y.; Wang, Y. Speed prediction based on a traffic factor state network model. IEEE Trans. Intell. Transp. Syst. 2020, 22, 3112–3122. [Google Scholar] [CrossRef]
- Zheng, F.; Liu, C.; Liu, X.; Jabari, S.E.; Lu, L. Analyzing the impact of automated vehicles on uncertainty and stability of the mixed traffic flow. Transp. Res. Part C Emerg. Technol. 2020, 112, 203–219. [Google Scholar] [CrossRef]
- Tan, H.; Feng, G.; Feng, J.; Wang, W.; Zhang, Y.-J.; Li, F. A tensor-based method for missing traffic data completion. Transp. Res. Part C Emerg. Technol. 2013, 28, 15–27. [Google Scholar] [CrossRef]
- Li, L.; Li, Y.; Li, Z. Efficient missing data imputing for traffic flow by considering temporal and spatial dependence. Transp. Res. Part C Emerg. Technol. 2013, 34, 108–120. [Google Scholar] [CrossRef]
- Shao, Y.-H.; Zhang, C.-H.; Yang, Z.-M.; Jing, L.; Deng, N.-Y. An ε-twin support vector machine for regression. Neural Comput. 2013, 23, 175–185. [Google Scholar] [CrossRef]
- Parastalooi, N.; Amiri, A.; Aliheidari, P. Modified twin support vector regression. Neurocomputing 2016, 211, 84–97. [Google Scholar] [CrossRef]
- Bando, M.; Hasebe, K.; Nakayama, A.; Shibata, A.; Sugiyama, Y. Dynamical model of traffic congestion and numerical simulation. Phys. Rev. E 1995, 51, 1035. [Google Scholar] [CrossRef]
- Hunt, J.D.; Jurasz, J.; Zakeri, B.; Nascimento, A.; Cross, S.; Ten Caten, C.S.; de Jesus Pacheco, D.A.; Pongpairoj, P.; Leal Filho, W.; Tomé, F.M.C.; et al. Electric Truck Hydropower, a flexible solution to hydropower in mountainous regions. Energy 2022, 248, 123495. [Google Scholar] [CrossRef]
- Olayode, O.; Tartibu, L.; Okwu, M. Application of Artificial Intelligence in Traffic Control System of Non-autonomous Vehicles at Signalized Road Intersection. Procedia CIRP 2020, 91, 194–200. [Google Scholar] [CrossRef]
- Gupta, T.; Patel, K.; Siddique, S.; Sharma, R.K.; Chaudhary, S. Prediction of mechanical properties of rubberised concrete exposed to elevated temperature using ANN. Measurement 2019, 147, 106870. [Google Scholar] [CrossRef]
- Sarvi, M.; Young, W.; Wang, Y.; Aghabayk, K. Investigating heavy-vehicle interactions during car-following process. In Proceedings of the Transportation Research Board 91st Annual Meeting, Washington, DC, USA, 22–26 January 2012. [Google Scholar]
| Signalized Road Intersections | Video Camera | Position of the Camera | Time and Date | Total Duration | Speed Limit (km/h) | Road Type | Number of Lanes |
|---|---|---|---|---|---|---|---|
| Road intersection 1 | 1 | First View Second View | 22/07/2019 (Monday: 12:00 am to 12 pm) 23/07/2019 (Tuesday: 12:00 am to 12:00 pm) | 24 h | 120 | Pavement | 4 |
| Road Intersection 2 | 2 | First View Second View | 22/07/2019 (Monday: 12:00 am to 12 pm) 23/07/2019 (Tuesday: 12:00 am to 12:00 pm) | 24 h | 120 | Pavement | 5 |
| Road Intersection 3 | 3 | First View Second View | 24/07/2019 (Wednesday: 12:00 am to 12 pm) 25/07/2019 (Thursday: 12:00 am to 12:00 pm) | 24 h | 120 | Pavement | 4 |
| Road Intersection 4 | 4 | First View Second View | 25/07/2019 (Thursday: 12:00 am to 12 pm) 26/07/2019 (Friday: 12:00 am to 12:00 pm) | 24 h | 120 | Pavement | 5 |
| LT | ST | MT | |
|---|---|---|---|
| Responsive Sensitivity | MH | ML | L |
| Maximum Velocity | H | L | L |
Publisher’s Note: MDPI stays neutral with regard to jurisdictional claims in published maps and institutional affiliations. |
© 2022 by the authors. Licensee MDPI, Basel, Switzerland. This article is an open access article distributed under the terms and conditions of the Creative Commons Attribution (CC BY) license (https://creativecommons.org/licenses/by/4.0/).
Share and Cite
Olayode, I.O.; Tartibu, L.K.; Campisi, T. Stability Analysis and Prediction of Traffic Flow of Trucks at Road Intersections Based on Heterogenous Optimal Velocity and Artificial Neural Network Model. Smart Cities 2022, 5, 1092-1114. https://doi.org/10.3390/smartcities5030055
Olayode IO, Tartibu LK, Campisi T. Stability Analysis and Prediction of Traffic Flow of Trucks at Road Intersections Based on Heterogenous Optimal Velocity and Artificial Neural Network Model. Smart Cities. 2022; 5(3):1092-1114. https://doi.org/10.3390/smartcities5030055
Chicago/Turabian StyleOlayode, Isaac Oyeyemi, Lagouge Kwanda Tartibu, and Tiziana Campisi. 2022. "Stability Analysis and Prediction of Traffic Flow of Trucks at Road Intersections Based on Heterogenous Optimal Velocity and Artificial Neural Network Model" Smart Cities 5, no. 3: 1092-1114. https://doi.org/10.3390/smartcities5030055