
A Multiobjective Optimization Approach for Retrofitting Decision-Making towards Achieving Net-Zero Energy Districts: A Numerical Case Study in a Tropical Climate


Abstract
:1. Introduction
2. Literature Review
3. Materials and Methods
4. Results
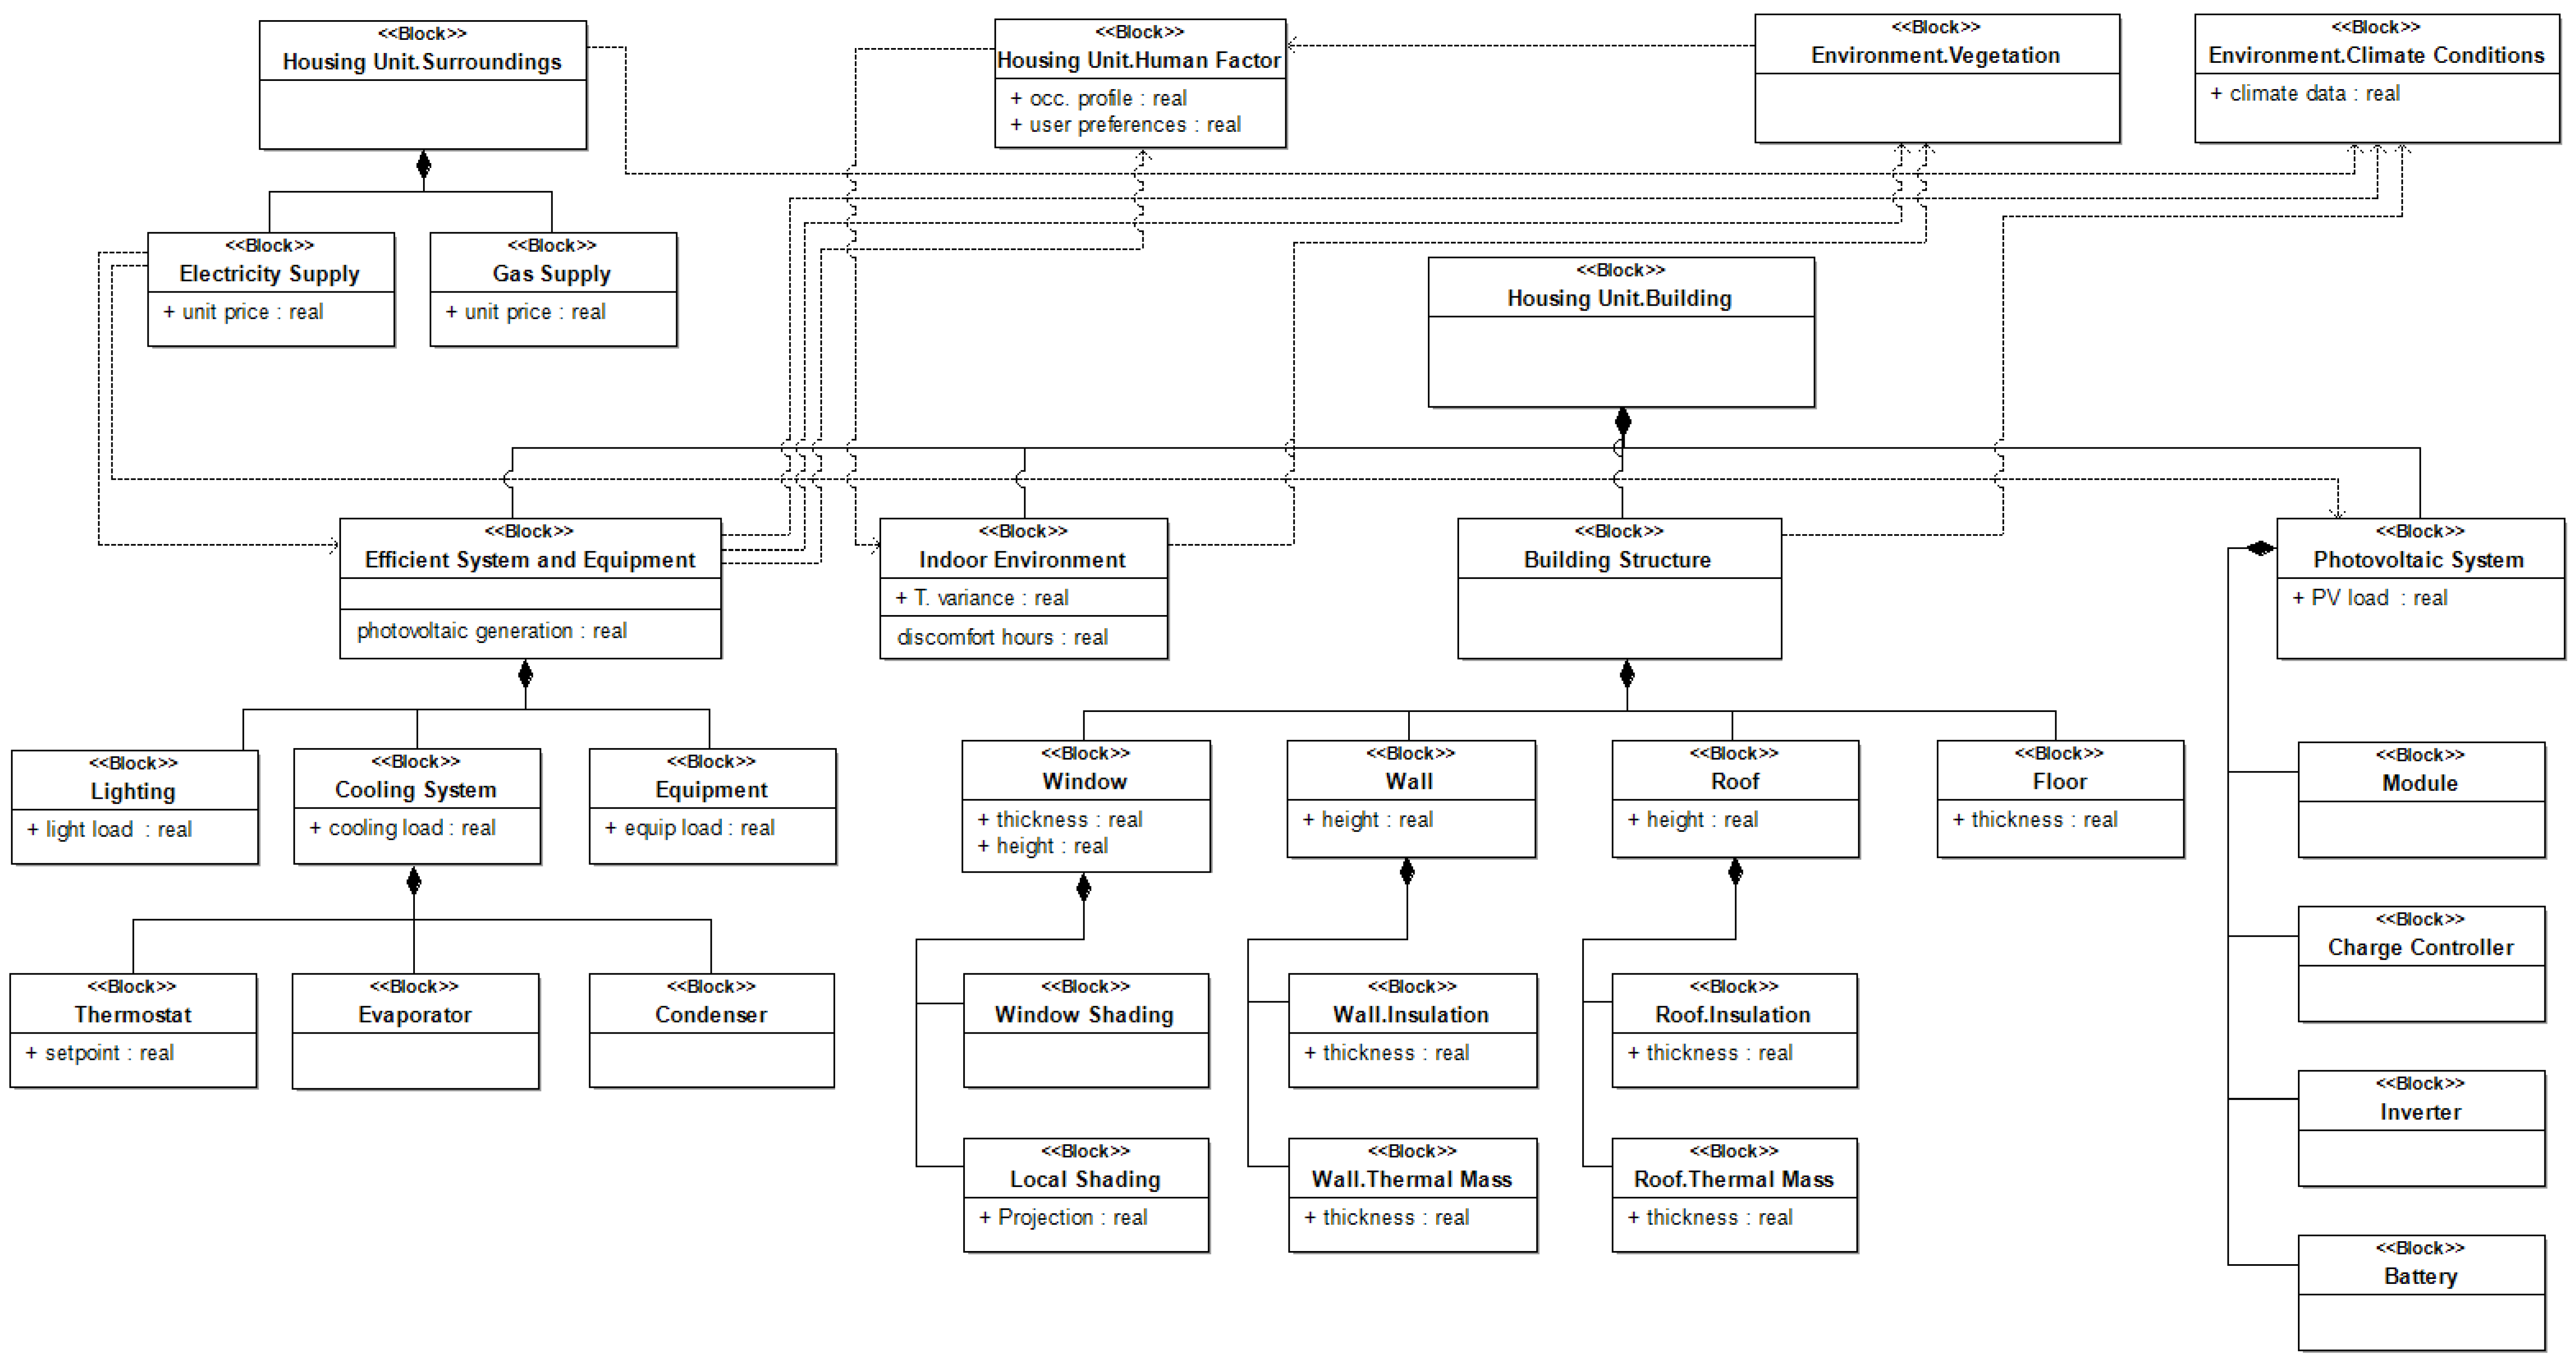
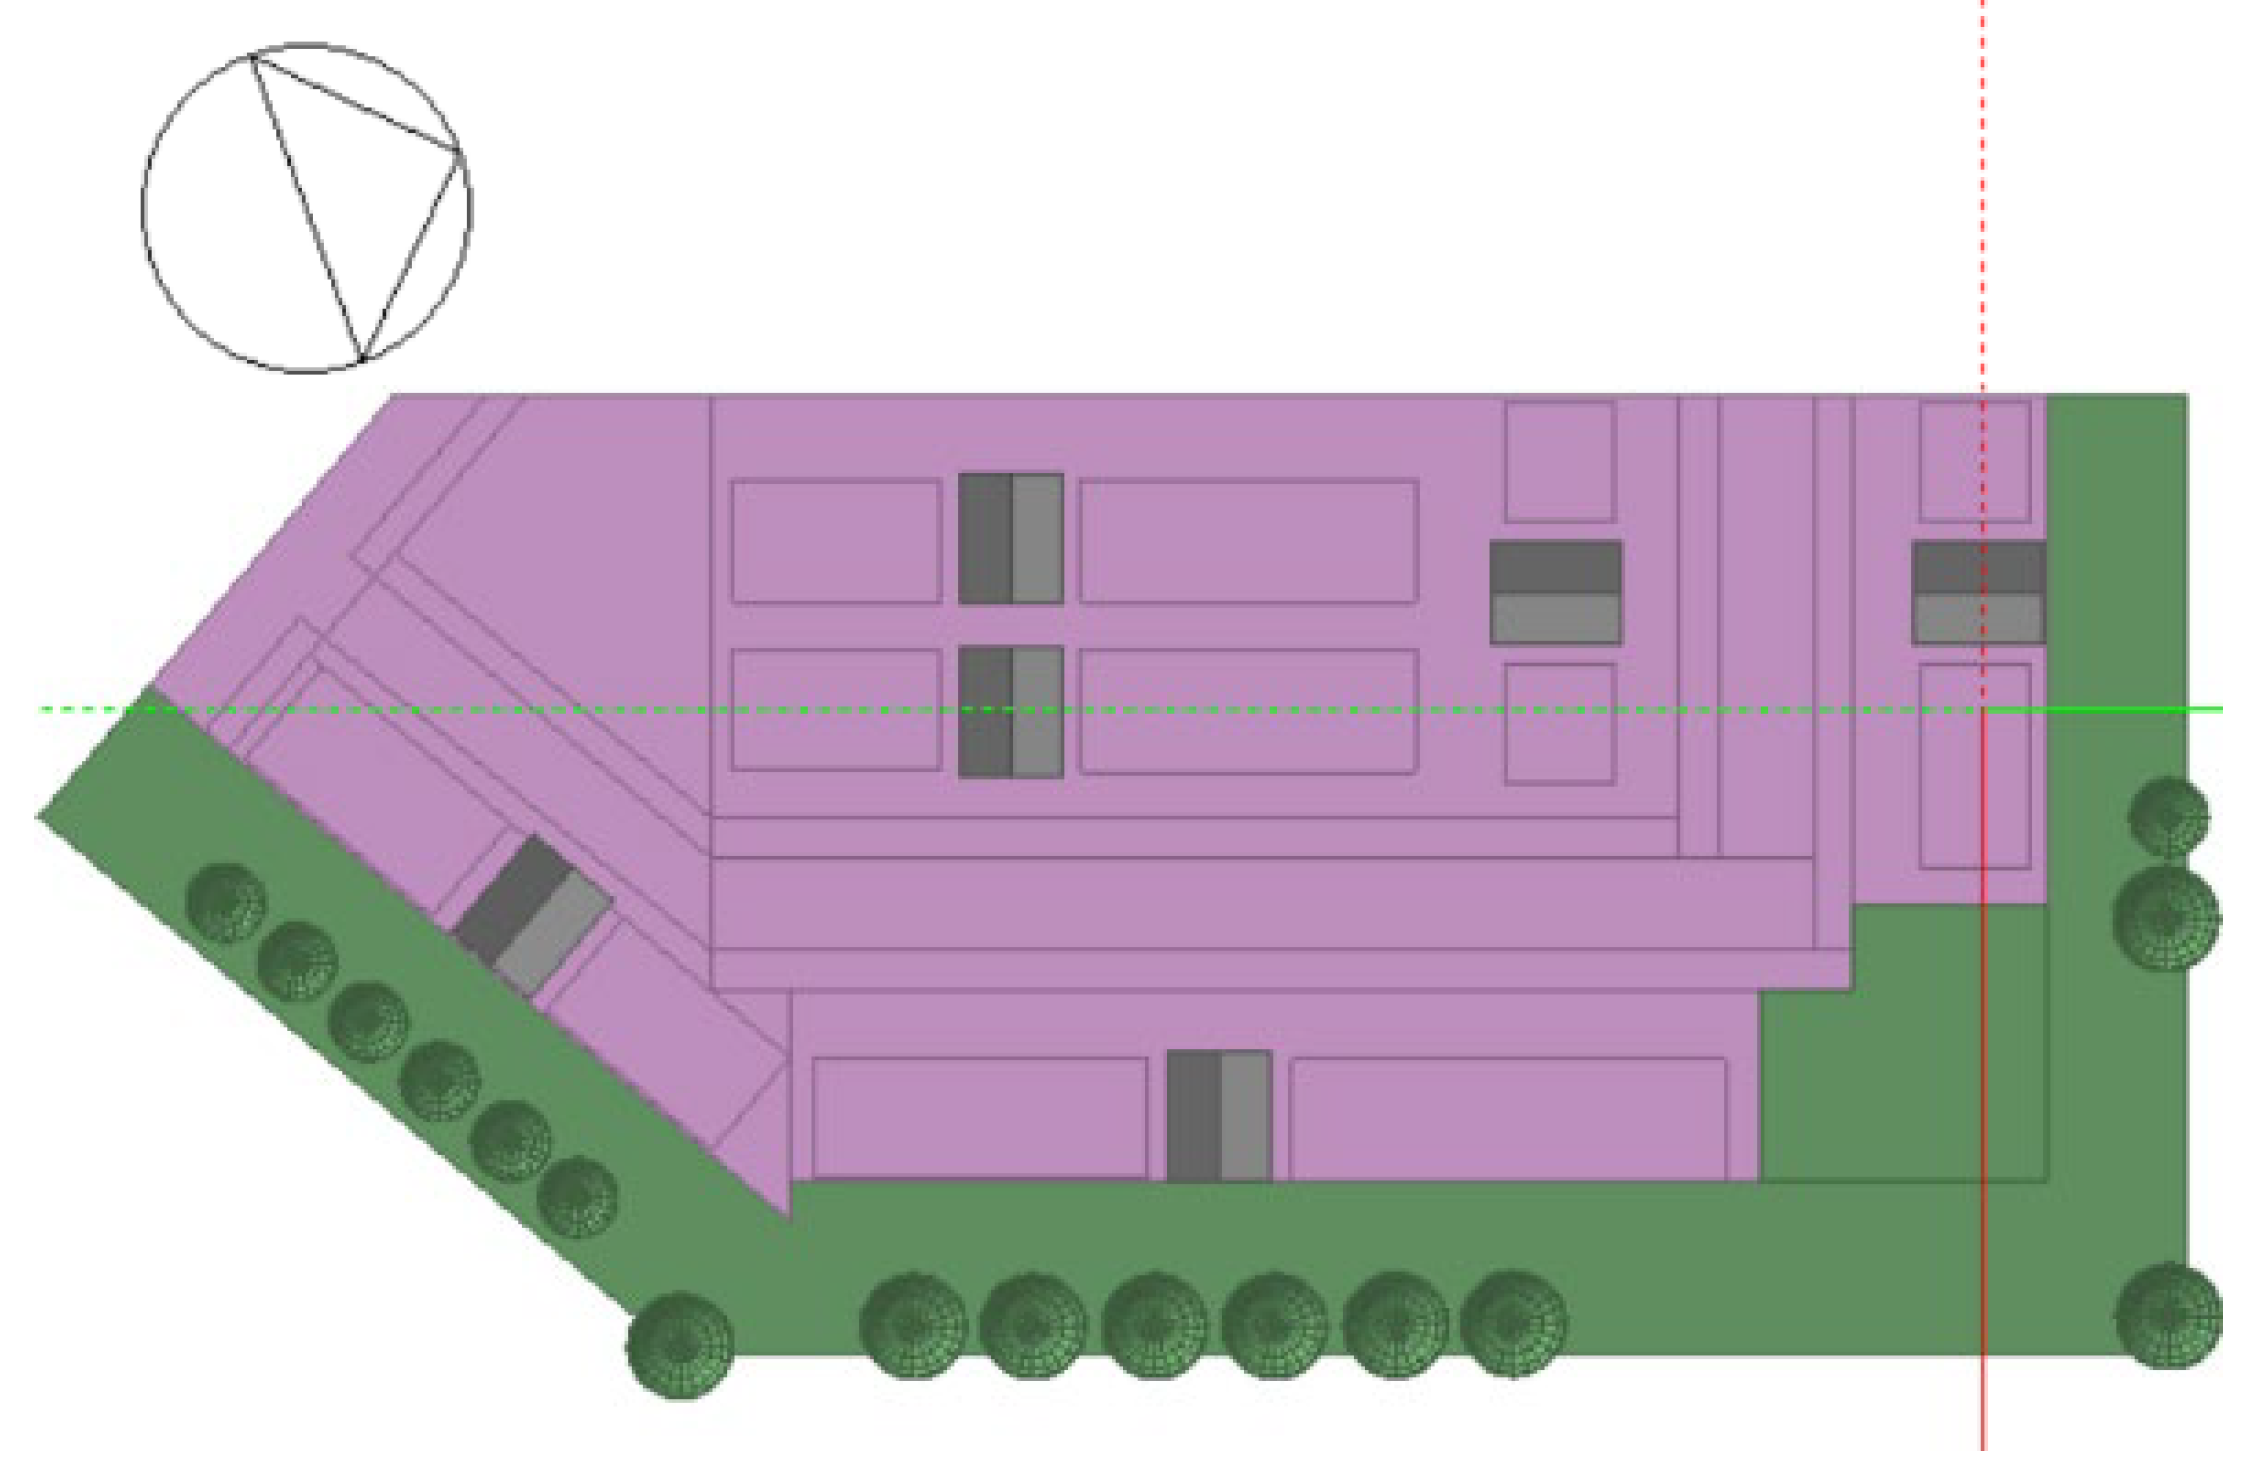
4.1. Building Modeling Approach
4.2. Coupling Retroffiting Categories with Building Systems
4.3. Multiobjective Optimization Approach
4.3.1. Sensitivity Analysis
4.3.2. Optimization Objectives and Methods
Optimization by Retrofit Categories
Optimization by Important Design Variables
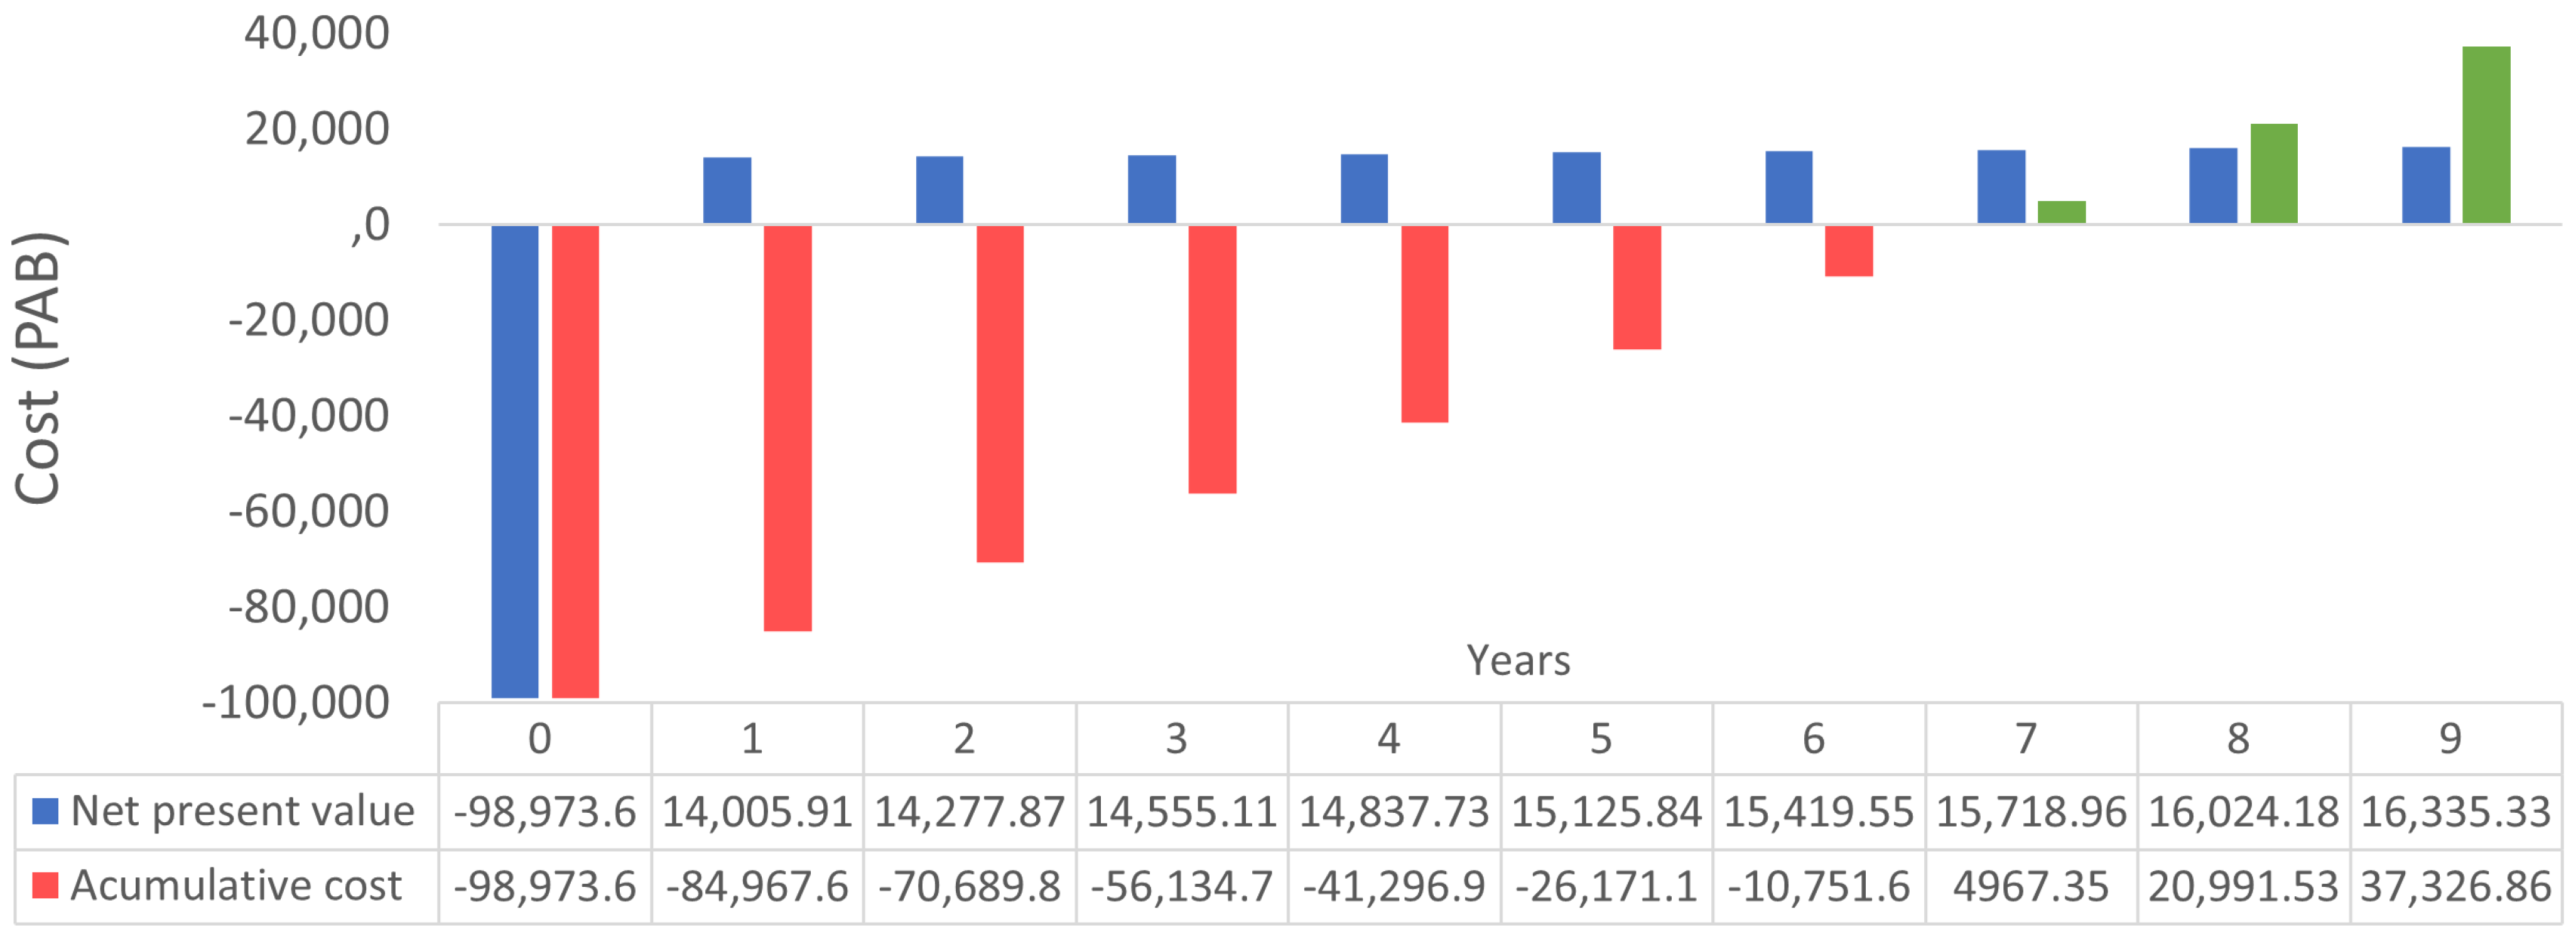
4.4. Design Solutions
5. Discussion
Comparison with Previous Studies
6. Conclusions
Author Contributions
Funding
Institutional Review Board Statement
Informed Consent Statement
Data Availability Statement
Acknowledgments
Conflicts of Interest
Appendix A

| Option | Electricity (kWh) | Elect. Consumption Reduction (kWh) (%) | Total Cost (PAB) | Elect. Cost Reduction (%) | Renovation Cost (PAB) | A/C (Electricity) (kWh) | Comfort ASHRAE 55 (hr) | Embedded CO2 (kg) | Set Point (°C) | Cooling Operation | Occupancy | Ext. Walls | Roof | Windows | Shading |
|---|---|---|---|---|---|---|---|---|---|---|---|---|---|---|---|
| CC 1 | 1253.410 | 0.00 | 375,416.39 | 0.00 | 187.39 | 0.00 | 375,229.00 | 54,434 | 24.000 | ACA | HCA | PCA | TCA | VCA | SCA |
| 1 | 437.175 | 65.121 | 93,638.50 | 64.68 | 66.19 | 93,572.30 | 452,849.58 | 131,683 | 27.90 | Aop2 | Hop1 | Pop2 | Top1 | Vop7 | Sop6 |
| 2 | 438.547 | 65.012 | 74,864.95 | 64.57 | 66.39 | 74,798.55 | 450,746.02 | 123,689 | 25.30 | Aop9 | Hop1 | Pop3 | Top1 | Vop7 | Sop6 |
| 3 | 439.416 | 64.942 | 87,070.13 | 64.50 | 66.52 | 87,003.61 | 441,290.22 | 131,683 | 23.70 | Aop1 | Hop1 | Pop2 | Top1 | Vop7 | SCA |
| 4 | 439.474 | 64.938 | 87,070.14 | 64.50 | 66.53 | 87,003.61 | 440,481.49 | 124,817 | 25.40 | Aop6 | Hop1 | Pop2 | Top2 | Vop7 | SCA |
| 5 | 440.088 | 64.889 | 86,968.51 | 64.45 | 66.62 | 86,901.89 | 440,434.01 | 129,932 | 25.40 | Aop1 | Hop1 | Pop2 | Top1 | Vop6 | Sop4 |
| 6 | 440.940 | 64.821 | 68,296.61 | 64.38 | 66.75 | 68,229.86 | 439,186.02 | 123,689 | 28.20 | ACA | Hop1 | Pop3 | Top1 | Vop7 | SCA |
| 7 | 441.613 | 64.767 | 68,194.99 | 64.33 | 66.85 | 68,128.14 | 438,330.45 | 121,939 | 28.10 | Aop4 | Hop1 | Pop3 | Top1 | Vop6 | Sop4 |
| 8 | 442.228 | 64.718 | 68,155.88 | 64.28 | 66.94 | 68,088.94 | 438,264.80 | 117,573 | 24.00 | Aop1 | Hop1 | Pop3 | Top1 | Vop6 | Sop3 |
| 9 | 442.615 | 64.687 | 67,074.22 | 64.25 | 67.00 | 67,007.22 | 436,359.91 | 117,573 | 25.40 | Aop5 | Hop1 | Pop3 | Top1 | Vop6 | Sop2 |
| 10 | 443.129 | 64.646 | 65,992.58 | 64.21 | 67.08 | 65,925.50 | 434,455.65 | 117,573 | 27.70 | Aop1 | Hop1 | Pop3 | Top1 | Vop6 | Sop1 |
| 11 | 443.289 | 64.633 | 64,910.89 | 64.19 | 67.10 | 64,843.79 | 432,550.14 | 121,939 | 28.20 | ACA | Hop1 | Pop3 | Top1 | Vop6 | SCA |
| 12 | 447.088 | 64.330 | 64,538.31 | 63.89 | 67.66 | 64,470.64 | 431,404.18 | 117,573 | 25.20 | Aop7 | Hop1 | Pop3 | Top1 | Vop3 | Sop2 |
| 13 | 447.605 | 64.289 | 75,322.29 | 63.85 | 67.74 | 75,254.55 | 429,599.36 | 130,801 | 24.70 | Aop1 | Hop1 | Pop1 | Top1 | Vop7 | SCA |
| 14 | 448.233 | 64.239 | 62,375.05 | 63.80 | 67.83 | 62,307.21 | 427,593.78 | 117,573 | 28.20 | ACA | Hop1 | Pop3 | Top1 | Vop3 | SCA |
| 15 | 449.605 | 64.129 | 62,445.21 | 63.69 | 68.04 | 62,377.18 | 426,261.74 | 113,323 | 24.10 | Aop3 | Hop1 | Pop3 | Top2 | Vop2 | Sop4 |
| 16 | 450.032 | 64.095 | 73,018.30 | 63.66 | 68.10 | 72,950.20 | 424,868.36 | 124,685 | 25.40 | Aop1 | Hop1 | Pop1 | Top1 | Vop6 | Sop1 |
| 17 | 450.204 | 64.082 | 71,936.61 | 63.65 | 68.13 | 71,868.48 | 422,963.47 | 129,051 | 25.40 | Aop1 | Hop1 | Pop1 | Top1 | Vop6 | SCA |
| 18 | 450.217 | 64.081 | 71,936.61 | 63.64 | 68.13 | 71,868.48 | 422,154.74 | 122,185 | 25.30 | Aop3 | Hop1 | Pop1 | Top2 | Vop6 | SCA |
| 19 | 452.381 | 63.908 | 59,161.28 | 63.47 | 68.45 | 59,092.83 | 421,290.16 | 115,823 | 28.20 | ACA | Hop1 | Pop3 | Top1 | Vop2 | SCA |
| 20 | 456.939 | 63.544 | 58,102.57 | 63.11 | 69.13 | 58,033.44 | 419,212.63 | 115,823 | 28.50 | Aop4 | Hop1 | Pop3 | Top1 | Vop1 | SCA |
| 21 | 458.684 | 63.405 | 68,517.06 | 62.97 | 69.39 | 68,447.68 | 416,044.12 | 122,866 | 25.50 | Aop8 | Hop1 | Pop1 | Top1 | Vop4 | Sop1 |
| 22 | 458.918 | 63.386 | 67,435.38 | 62.96 | 69.42 | 67,365.96 | 414,139.23 | 127,232 | 24.90 | Aop1 | Hop1 | Pop1 | Top1 | Vop4 | SCA |
| 23 | 460.342 | 63.273 | 67,268.87 | 62.84 | 69.63 | 67,199.24 | 413,608.39 | 122,934 | 25.50 | Aop1 | Hop1 | Pop1 | Top1 | Vop2 | Sop1 |
| 24 | 460.570 | 63.255 | 66,187.19 | 62.82 | 69.67 | 66,117.52 | 411,703.50 | 122,934 | 25.40 | Aop1 | Hop1 | Pop1 | Top1 | Vop2 | SCA |
| 25 | 460.582 | 63.254 | 66,187.19 | 62.82 | 69.67 | 66,117.52 | 410,894.77 | 116,069 | 25.40 | Aop2 | Hop1 | Pop1 | Top2 | Vop2 | SCA |
| 26 | 465.549 | 62.857 | 65,128.54 | 62.43 | 70.40 | 65,058.14 | 409,625.97 | 122,934 | 23.80 | Aop2 | Hop1 | Pop1 | Top1 | Vop1 | SCA |
| 27 | 472.405 | 62.310 | 57,242.20 | 61.89 | 71.42 | 57,170.77 | 408,481.24 | 119,350 | 24.80 | Aop1 | Hop1 | Pop1 | Top3 | Vop4 | SCA |
| 28 | 476.376 | 61.994 | 62,803.07 | 61.57 | 72.01 | 62,731.06 | 407,527.92 | 114,941 | 25.30 | Aop2 | Hop1 | PCA | Top1 | Vop1 | SCA |
| 29 | 480.477 | 61.666 | 38,736.86 | 61.25 | 72.62 | 38,664.23 | 384,583.02 | 66,671 | 24.10 | Aop11 | Hop1 | Pop2 | |||
| 30 | 482.092 | 61.538 | 19,963.34 | 61.12 | 72.86 | 19,890.48 | 382,553.48 | 58,677 | 24.50 | Aop10 | Hop1 | Pop3 | |||
| 31 | 489.174 | 60.973 | 48,428.31 | 60.56 | 73.91 | 48,354.39 | 406,572.71 | 106,990 | 26.40 | Aop2 | Hop1 | PCA | Top3 | VCA | Sop3 |
| 32 | 491.448 | 60.791 | 45,183.50 | 60.38 | 74.25 | 45,109.25 | 400,858.04 | 106,990 | 26.40 | Aop2 | Hop1 | PCA | Top3 | VCA | SCA |
| 33 | 492.561 | 60.702 | 26,989.59 | 60.29 | 74.42 | 26,915.18 | 373,155.40 | 65,789 | 26.40 | Aop10 | Hop1 | Pop1 | |||
| 34 | 504.182 | 59.775 | 24,664.24 | 59.37 | 76.14 | 24,588.10 | 371,130.03 | 57,796 | 26.70 | Aop9 | Hop1 | PCA | |||
| 35 | 530.036 | 57.712 | 79.98 | 57.32 | 79.98 | 0.00 | 375,228.65 | 54,434 | 23.80 | Aop9 | Hop1 | ||||
| 36 | 1094.691 | 12.663 | 163.83 | 12.58 | 163.83 | 0.00 | 375,228.65 | 54,434 | 24.70 | Aop5 | Hop2 | ||||
| 37 | 1205.767 | 3.801 | 59,650.22 | 3.775 | 180.320 | 59,469.90 | 485,835.18 | 81,610 | Pop2 | TCA | Vop6 | Sop6 | |||
| 38 | 1206.253 | 3.762 | 58,007.87 | 3.737 | 180.392 | 57,827.48 | 482,945.34 | 81,610 | Pop2 | TCA | Vop6 | Sop5 | |||
| 39 | 1206.843 | 3.715 | 56,366.03 | 3.690 | 180.479 | 56,185.55 | 480,055.50 | 81,610 | Pop2 | TCA | Vop6 | Sop4 | |||
| 40 | 1207.570 | 3.657 | 56,326.94 | 3.632 | 180.587 | 56,146.35 | 479,990.48 | 77,243 | Pop2 | TCA | Vop6 | Sop3 | |||
| 41 | 1208.390 | 3.592 | 37,592.51 | 3.567 | 180.709 | 37,411.80 | 478,039.70 | 73,616 | Pop3 | TCA | Vop6 | Sop4 | |||
| 42 | 1208.611 | 3.574 | 54,163.66 | 3.550 | 180.742 | 53,982.92 | 476,180.70 | 77,243 | Pop2 | TCA | Vop6 | Sop1 | |||
| 43 | 1208.754 | 3.563 | 53,081.97 | 3.539 | 180.763 | 52,901.20 | 474,275.81 | 81,610 | Pop2 | TCA | Vop6 | SCA | |||
| 44 | 1220.461 | 2.629 | 46,260.92 | 2.611 | 182.501 | 46,078.42 | 471,558.97 | 80,728 | Pop1 | TCA | Vop6 | Sop5 | |||
| 45 | 1221.280 | 2.563 | 44,619.12 | 2.546 | 182.623 | 44,436.49 | 468,669.13 | 80,728 | Pop1 | TCA | Vop6 | Sop4 | |||
| 46 | 1222.017 | 2.505 | 44,580.03 | 2.488 | 182.732 | 44,397.29 | 468,604.11 | 76,362 | Pop1 | TCA | Vop6 | Sop3 | |||
| 47 | 1222.647 | 2.454 | 43,498.40 | 2.438 | 182.826 | 43,315.58 | 466,699.22 | 76,362 | Pop1 | TCA | Vop6 | Sop2 | |||
| 48 | 1223.328 | 2.400 | 42,416.79 | 2.384 | 182.927 | 42,233.86 | 464,794.33 | 76,362 | Pop1 | TCA | Vop6 | Sop1 | |||
| 49 | 1223.525 | 2.384 | 41,335.10 | 2.368 | 182.956 | 41,152.15 | 462,889.45 | 76,362 | Pop1 | TCA | Vop6 | SCA | |||
| 50 | 1226.836 | 2.120 | 40,117.42 | 2.106 | 183.448 | 39,933.97 | 459,844.88 | 78,910 | Pop1 | TCA | Vop4 | Sop4 | |||
| 51 | 1236.059 | 1.384 | 35,623.82 | 1.375 | 184.818 | 35,439.00 | 454,239.98 | 70,916 | PCA | TCA | Vop5 | SCA |
References
- International Energy Agency and the United Nations Environment Programme. 2018 Global Status Report: Towards a Zero-Emission, Efficient and Resilient Buildings and Construction Sector; International Energy Agency and the United Nations Environment Programme: Paris, France, 2018. [Google Scholar]
- Secretaria Nacional de Energía. Plan Energético Nacional 2015–2050 Panamá El Futuro Que Queremos; Secretaria Nacional de Energía: Panama City, Panama, 2017. (In Spanish)
- Gaceta Oficial. Decreto Ejecutivo No. 398 Que Reglamentaa Ley 69 De 12 De Octubre De 2012, Que Establece Los Lineamientos Generales De La Política Nacional Para El Uso Racional Y Eficiente De La Energía En El Territorio Nacional (no. 27313-A); Gobierno de Panamá: Panama City, Panamá, 2013; Volume 3, pp. 1–101. (In Spanish)
- Gaceta Oficial. Ley 69 De 12 De Octubre 2012; Gobierno de Panamá: Panama City, Panama, 2012. (In Spanish)
- Torcellini, P.; Pless, S.; Deru, M.; Crawley, D. Zero Energy Buildings: A Critical Look at the Definition; National Renewable Energy Lab. (NREL): Golden, CO, USA, 2006; p. 13. [Google Scholar]
- Belussi, L.; Barozzi, B.; Bellazzi, A.; Danza, L.; Devitofrancesco, A.; Fanciulli, C.; Ghellere, M.; Guazzi, G.; Meroni, I.; Salamone, F.; et al. A review of performance of zero energy buildings and energy efficiency solutions. J. Build. Eng. 2019, 25, 100772. [Google Scholar] [CrossRef]
- Amaral, A.R.; Rodrigues, E.; Gaspar, A.R.; Gomes, Á. Review on performance aspects of nearly zero-energy districts. Sustain. Cities Soc. 2018, 43, 406–420. [Google Scholar] [CrossRef]
- Koutra, S.; Becue, V.; Gallas, M.-A.; Ioakimidis, C.S. Towards the development of a net-zero energy district evaluation approach: A review of sustainable approaches and assessment tools. Sustain. Cities Soc. 2018, 39, 784–800. [Google Scholar] [CrossRef]
- Feng, W.; Zhang, Q.; Ji, H.; Wang, R.; Zhou, N.; Ye, Q.; Hao, B.; Li, Y.; Luo, D.; Lau, S.S.Y. A review of net zero energy buildings in hot and humid climates: Experience learned from 34 case study buildings. Renew. Sustain. Energy Rev. 2019, 114, 109303. [Google Scholar] [CrossRef]
- The Energy Performance of Buildings Directive and the NZEB 2020 Target for New Buildings | Glen Dimplex Heating & Ventilation. Available online: https://www.gdhv.co.uk/energy-performance-buildings-directive-and-nzeb-2020-target-new-buildings (accessed on 28 January 2022).
- U.S. Department of Energy. Building Technologies Program Planning Summary; U.S. Department of Energy: Washington, WA, USA, 2013; p. 5.
- Hoque, S.; Iqbal, N. Building to Net Zero in the Developing World. Buildings 2015, 5, 56–68. [Google Scholar] [CrossRef] [Green Version]
- Mora, D.; Araúz, J.; Austin, M.C. Towards nearly zero energy buildings in Panama through low-consumption techniques: A numerical study. AIP Conf. Proc. 2019, 2191, 020114. [Google Scholar] [CrossRef]
- Cabeza, L.F.; Chàfer, M. Technological options and strategies towards zero energy buildings contributing to climate change mitigation: A systematic review. Energy Build. 2020, 219, 110009. [Google Scholar] [CrossRef]
- Ma, Z.; Cooper, P.; Daly, D.; Ledo, L. Existing building retrofits: Methodology and state-of-the-art. Energy Build. 2012, 55, 889–902. [Google Scholar] [CrossRef]
- Asdrubali, F.; Ballarini, I.; Corrado, V.; Evangelisti, L.; Grazieschi, G.; Guattari, C. Energy and environmental payback times for an NZEB retrofit. Build. Environ. 2019, 147, 461–472. [Google Scholar] [CrossRef]
- Nair, G.; Gustavsson, L.; Mahapatra, K. Factors influencing energy efficiency investments in existing Swedish residential buildings. Energy Policy 2010, 38, 2956–2963. [Google Scholar] [CrossRef]
- Salem, R.; Bahadori-Jahromi, A.; Mylona, A.; Godfrey, P.; Cook, D. Life-cycle cost analysis of retrofit scenarios for a UK residential dwelling. Proc. Inst. Civ. Eng.-Eng. Sustain. 2020, 173, 57–72. [Google Scholar] [CrossRef]
- Bahadır, Ü.; Thomollari, X.; Kalfa, S.M.; Toğan, V. Energy and economic performance analysis of different ventilated wall construction types in residential buildings. J. Constr. Eng. 2020, 3, 305–318. [Google Scholar] [CrossRef]
- Moran, P.; O’Connell, J.; Goggins, J. Sustainable energy efficiency retrofits as residenial buildings move towards nearly zero energy building (NZEB) standards. Energy Build. 2020, 211, 109816. [Google Scholar] [CrossRef]
- Purbantoro, F.; Siregar, M. Design of Net Zero Energy Building (NZEB) for Existing Building in Jakarta. IOP Conf. Ser. Earth Environ. Sci. 2019, 399, 20. [Google Scholar] [CrossRef]
- Sun, X.; Gou, Z.; Lau, S.S.-Y. Cost-effectiveness of active and passive design strategies for existing building retrofits in tropical climate: Case study of a zero energy building. J. Clean. Prod. 2018, 183, 35–45. [Google Scholar] [CrossRef]
- Mora, T.D.; Cappelletti, F.; Peron, F.; Romagnoni, P.; Bauman, F. Retrofit of an Historical Building toward NZEB. Energy Procedia 2015, 78, 1359–1364. [Google Scholar] [CrossRef] [Green Version]
- Alajmi, A.; Short, A.; Ferguson, J.; Poel, K.V.; Griffin, C. Detailed energy efficiency strategies for converting an existing office building to NZEB: A case study in the Pacific Northwest. Energy Effic. 2020, 13, 1089–1104. [Google Scholar] [CrossRef]
- Wilkinson, S.; Feitosa, R.C. Retrofitting Housing with Lightweight Green Roof Technology in Sydney, Australia, and Rio de Janeiro, Brazil. Sustainability 2015, 7, 1081–1098. [Google Scholar] [CrossRef] [Green Version]
- Burgett, J.M.; Chini, A.R.; Oppenheim, P. Specifying residential retrofit packages for 30 % reductions in energy consumption in hot–humid climate zones. Energy Effic. 2013, 6, 523–543. [Google Scholar] [CrossRef]
- Salem, R.; Bahadori-Jahromi, A.; Mylona, A.; Godfrey, P.; Cook, D. Energy performance and cost analysis for the nZEB retrofit of a typical UK hotel. J. Build. Eng. 2020, 31, 12. [Google Scholar] [CrossRef]
- Berardi, U.; Manca, M.; Casaldaliga, P.; Pich-Aguilera, F. From high-energy demands to nZEB: The retrofit of a school in Catalonia, Spain. Energy Procedia 2017, 140, 141–150. [Google Scholar] [CrossRef]
- Colclough, S.; Hegarty, R.O.; Murray, M.; Lennon, D.; Rieux, E.; Colclough, M.; Kinnane, O. Post occupancy evaluation of 12 retrofit nZEB dwellings: The impact of occupants and high in-use interior temperatures on the predictive accuracy of the nZEB energy standard. Energy Build. 2021, 254, 111563. [Google Scholar] [CrossRef]
- Sayadi, S.; Akander, J.; Hayati, A.; Cehlin, M. Analyzing the climate-driven energy demand and carbon emission for a prototype residential nZEB in central Sweden. Energy Build. 2022, 261, 111960. [Google Scholar] [CrossRef]
- André, M.; Kamimura, A.; Bavaresco, M.; Giaretta, R.F.; Fossati, M.; Lamberts, R. Achieving mid-rise NZEB offices in Brazilian urban centres: A control strategy with desk fans and extension of set point temperature. Energy Build. 2022, 259, 111911. [Google Scholar] [CrossRef]
- Object Management Group. SysML Open Source Project-What is SysML? Who created it? SysML.org. Available online: https://sysml.org/index.html (accessed on 30 September 2020).
- Friedenthal, S.; Moore, A.; Steiner, R. OMG Systems Modeling Language (OMG SysMLTM) Tutorial September 2009; INCOSE: San Diego, CA, USA; p. 132.
- O’Brien, W.; Bourdoukan, P.; Delisle, V.; Yip, S. Net ZEB design processes and tools. In Modeling, Design, and Optimization of Net-Zero Energy Buildings; Athienitis, A., O’Brien, W., Eds.; Wilhelm Ernst & Sohn: Berlin, Germany, 2015; pp. 107–174. [Google Scholar] [CrossRef]
- de Leon, L.; Cedeño, M.; Mora, D.; Austin, M.C. Towards A Definition for Zero Energy Districts in Panama: A Numerical Assessment of Passive and Active Strategies. In Proceedings of the 19th LACCEI International Multi-Conference for Engineering, Education, and Technology: “Prospective and trends in technology and skills for sustainable social development” “Leveraging emerging technologies to construct the future”, Boca Raton, FL, USA, 19–23 July 2021. [Google Scholar] [CrossRef]
- Ingenieros, S.A. Precio En Panamá De m2 De Base De Concreto. Generador De Precios De La Construcción. CYPE. Available online: http://www.panama.generadordeprecios.info/espacios_urbanos/Firmes_y_pavimentos_urbanos/Bases_y_subbases/De_concreto/Base_de_concreto.html (accessed on 21 January 2022).
- Tarifas-Naturgy Panamá-Hogar. Available online: https://www.naturgy.com.pa/pa/hogar/distribucion_electricidad/distribucion_de_electricidad/tarifas (accessed on 16 November 2021).


| Place | Climate | Type of Building | Retrofit Techniques Used | Type of Techniques Used | Methodology | Year/Ref. |
|---|---|---|---|---|---|---|
| Treviso, Italy | Humid subtropical | Residential |
| Active | Simulation and implementation | 2015 [23] |
| Portland, Oregon, United States | Mediterranean | Government office | Update of computer system to reduce the load on outlets
| Active | Simulation | 2020 [24] |
| Sydney, Australia | Humid subtropical | Small-scale models |
| Passive | Simulation and implementation | 2015 [25] |
| Río de Janeiro, Brazil | Tropical savanna | |||||
| Singapore | Tropical rainforest | Government offices and academic facilities |
| Passive and active | Simulation and implementation | 2018 [22] |
| Orlando, Florida, United States | Humid subtropical | Residential |
| Passive and active | Simulation | 2012 [26] |
| Miami, Florida, United States | Tropical savanna | |||||
| Berkshire, United Kingdom | Oceanic | Residential |
| Active | Simulation | 2020 [18] |
| Watford, United Kingdom | Oceanic | Commercial (Hotel) |
| Active | Simulation | 2020 [27] |
| Yakarta, Indonesia | Tropical monsoon | Office area |
| Active | Simulation | 2019 [21] |
| Ireland | Oceanic | Residential |
| Active | Simulation | 2020 [20] |
| Barcelona, Spain | Mediterranean hot summer | Academic facilities |
| Active | Simulation | 2017 [28] |
| Ireland | Oceanic | Residential |
| Active | Implementation | 2021 [29] |
| Sweden | Subarctic | Residential |
| Passive and active | Simulation | 2022 [30] |
| Brazil | Tropical | Office area |
| Active | Simulation | 2022 [31] |
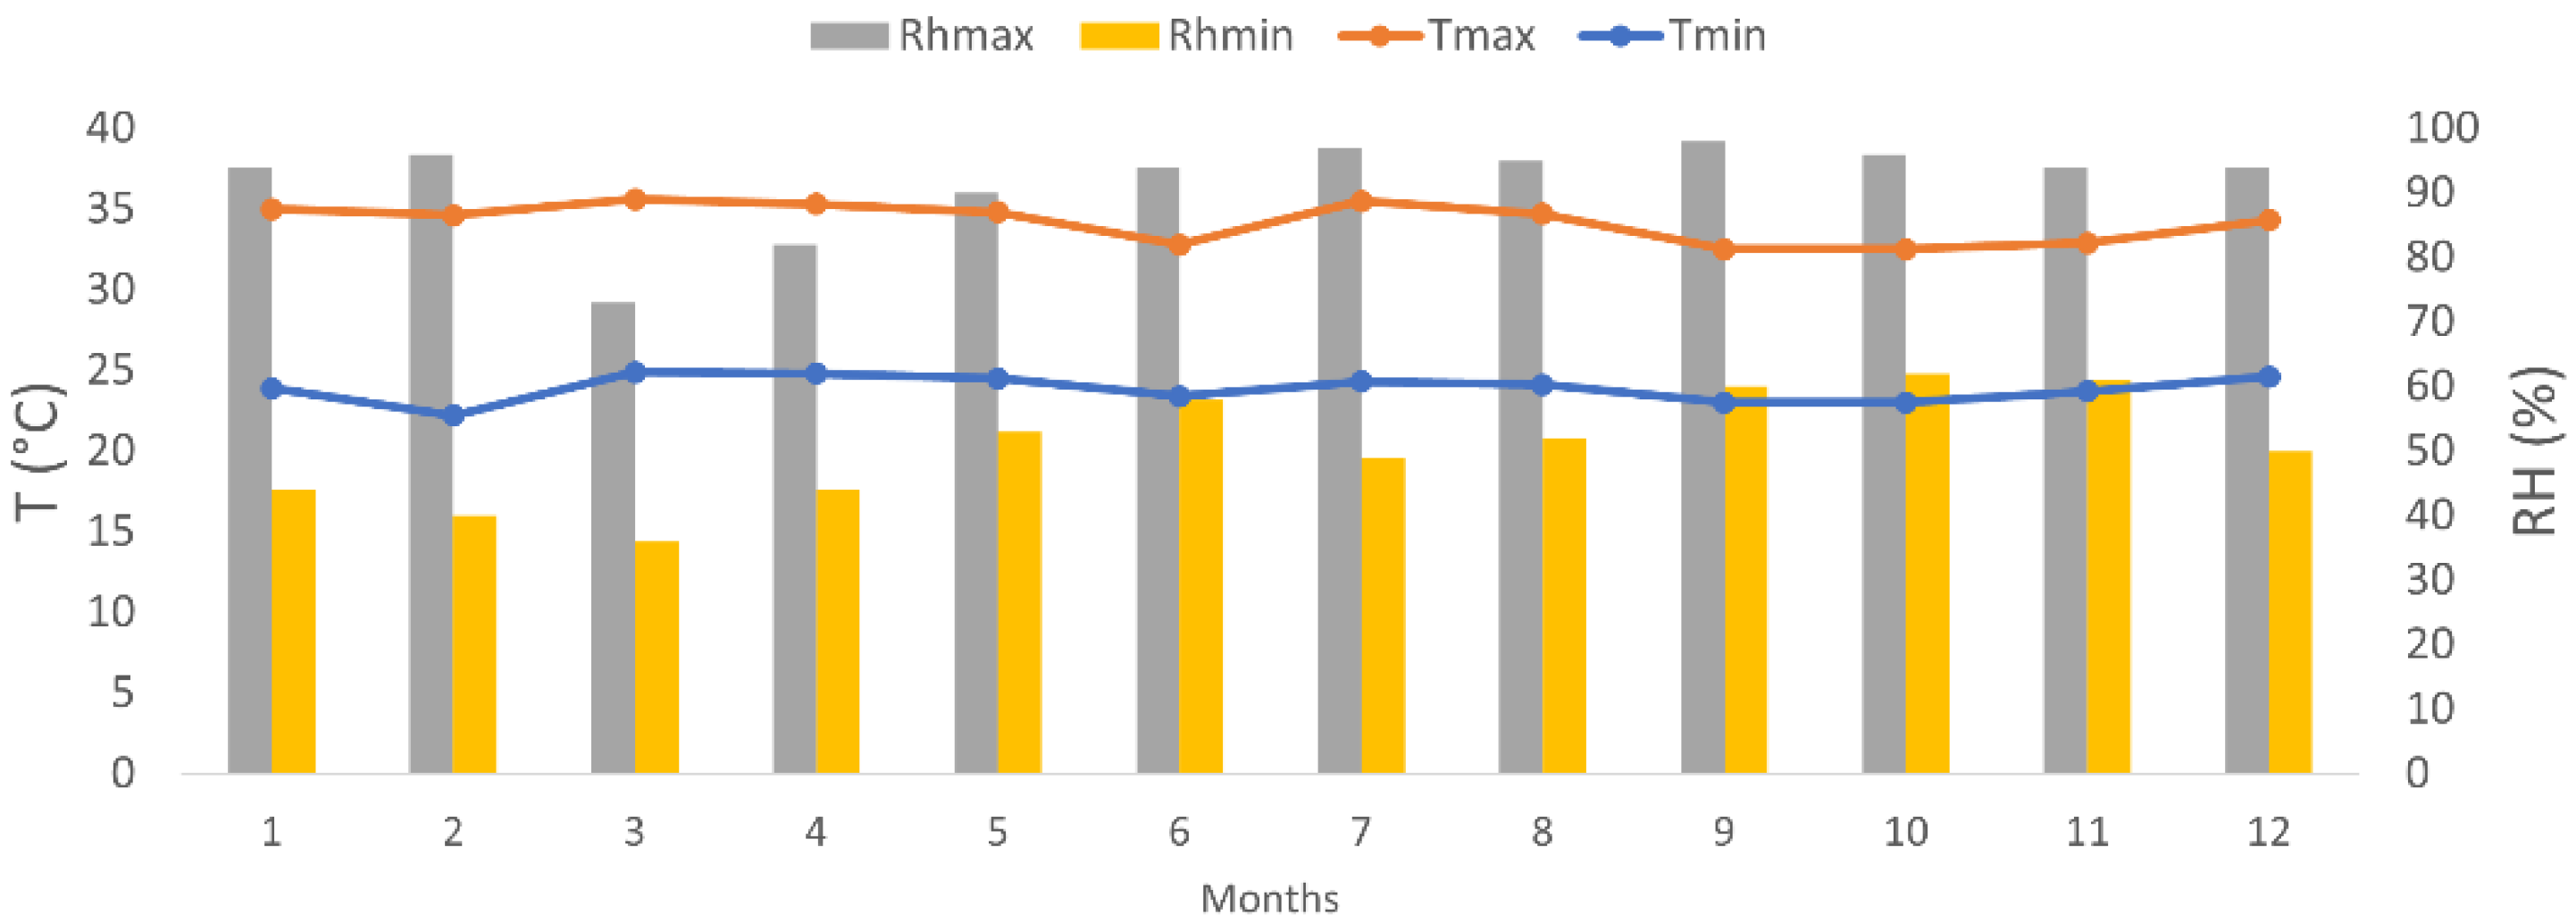
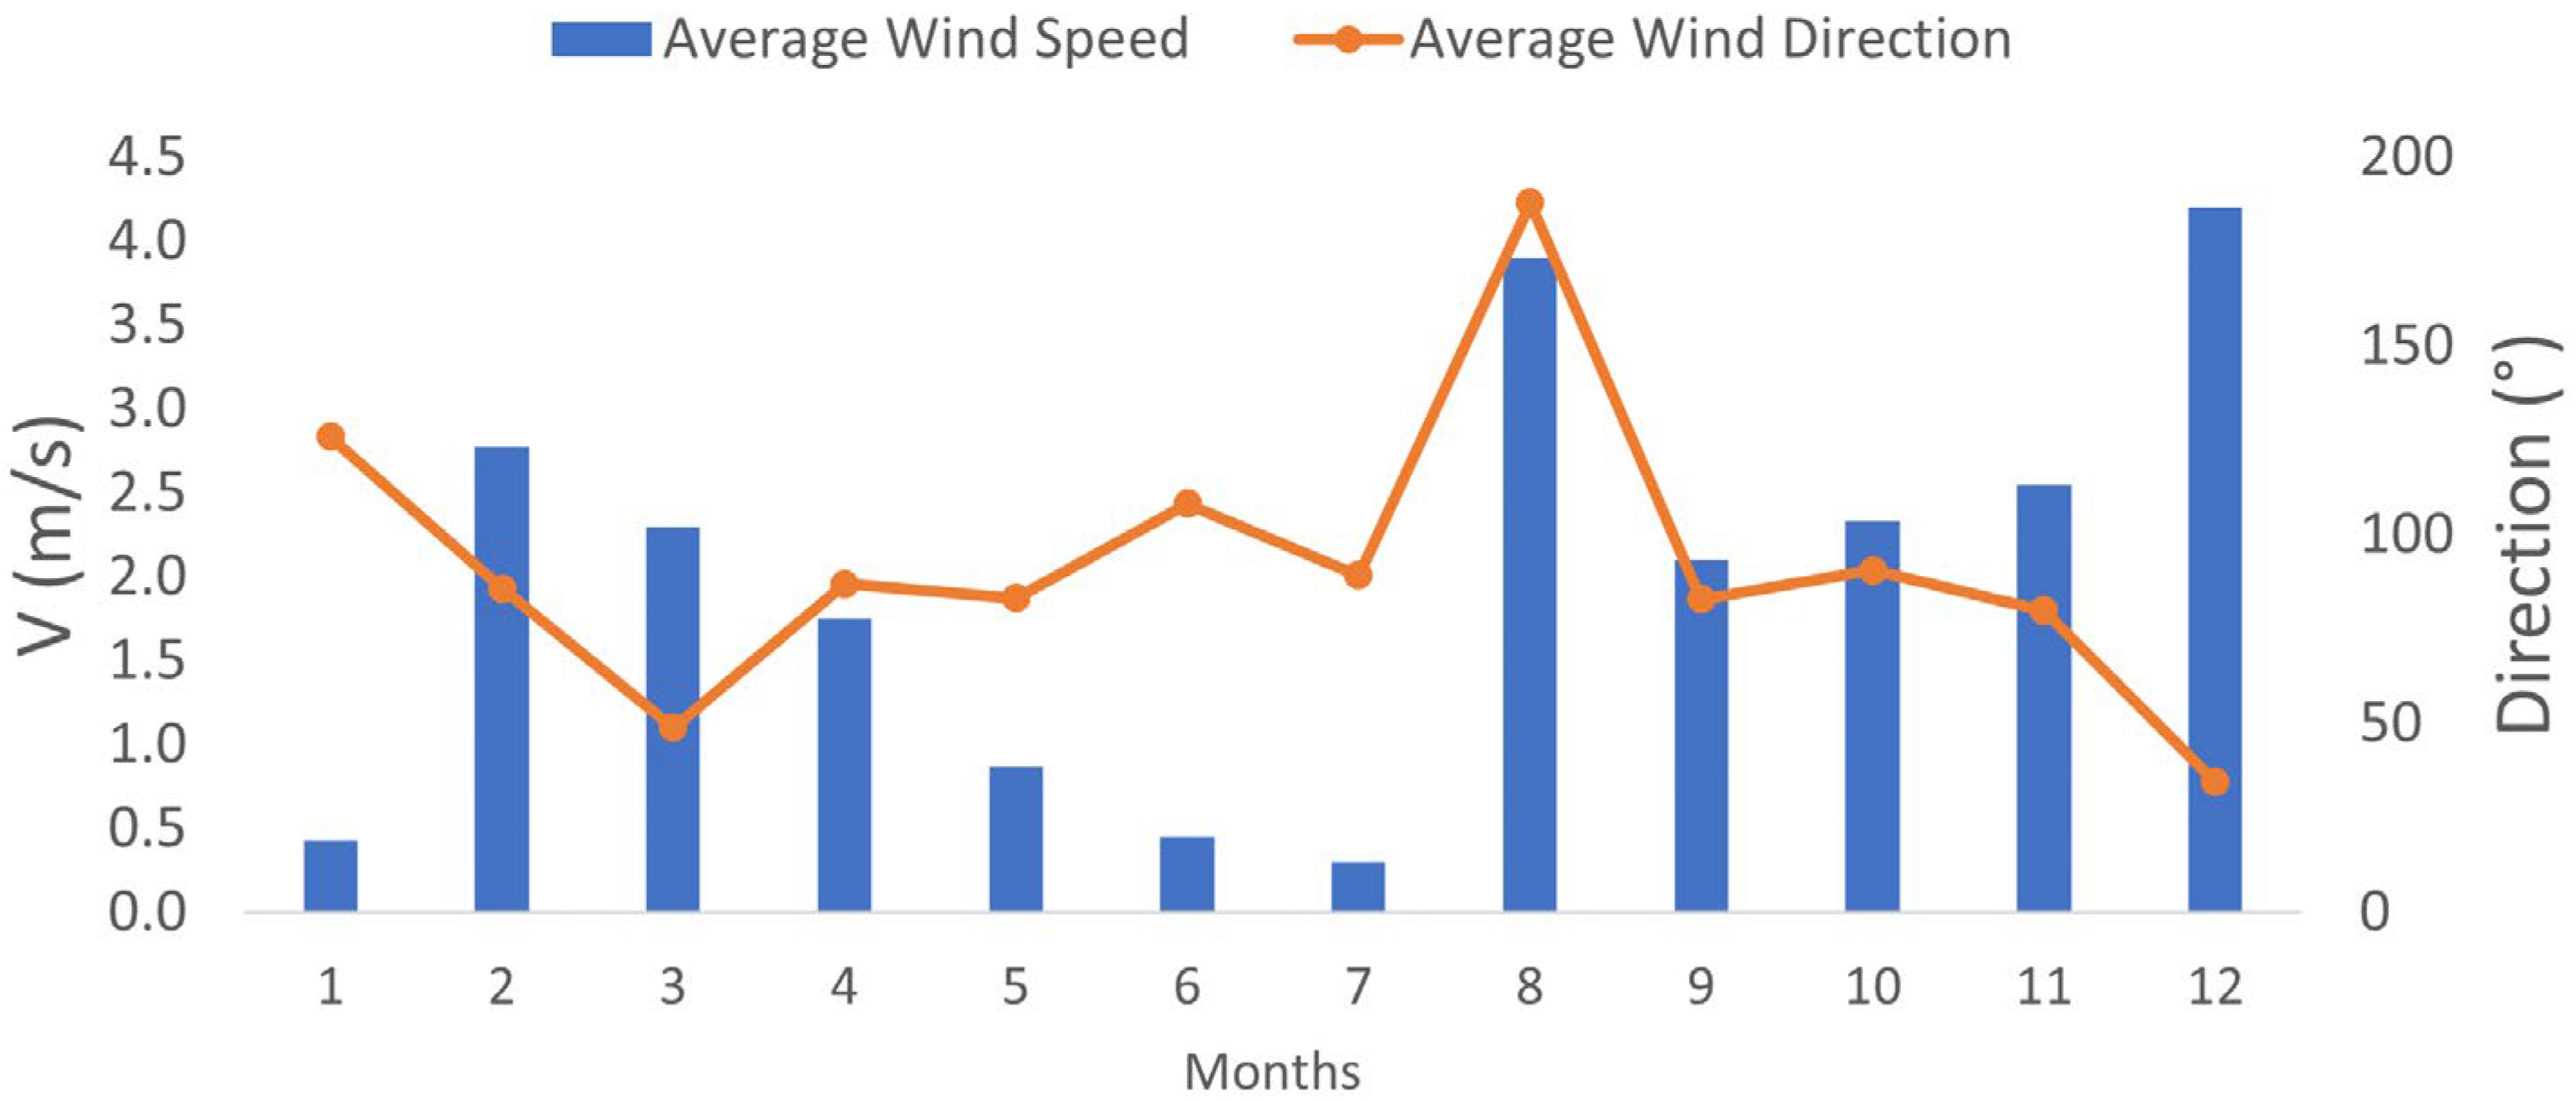
| Month | Tmax 1 (°C) (Hour) | Tmin 2 (°C) (Hour) | RHmax 3 (%) (Hour) | RHmin 4 (%) (Hour) | Average Wind Speed (m/s) | Average Wind Direction (°) |
|---|---|---|---|---|---|---|
| 3 January | 35 (15:00) | 23.9 (6:00) | 94 (5:00) | 44 (15:00) | 0.43 | 126 |
| 20 February | 34.6 (15:00) | 22.2 (6:00) | 93 (6:00) | 40 (15:00) | 2.77 | 85.77 |
| 17 March | 35.6 (15:00) | 24.9 (6:00) | 73 (6:00) | 36 (16:00) | 2.3 | 49 |
| 11 April | 35.3 (15:00) | 24.8 (6:00) | 82 (24:00) | 44 (16:00) | 1.75 | 87 |
| 20 May | 34.8 (15:00) | 24.5 (6:00) | 90 (6:00) | 53 (16:00) | 0.87 | 83.3 |
| 23 June | 32.8 (15:00) | 23.4 (6:00) | 94 (6:00) | 58 (15:00) | 0.45 | 108.25 |
| 21 July | 35.5 (16:00) | 24.3 (6:00) | 97 (4:00) | 49 (16:00) | 0.3 | 89.3 |
| 19 August | 34.7 (15:00) | 24.1 (6:00) | 95 (5:00) | 52 (15:00) | 3.9 | 188 |
| 1 September | 32.5 (15:00) | 23 (6:00) | 98 (24:00) | 60 (15:00) | 2.1 | 83 |
| 20 October | 32.5 (15:00) | 23 (6:00) | 96 (6:00) | 62 (14:00) | 2.33 | 90.67 |
| 11 November | 32.9 (15:00) | 23.7 (6:00) | 94 (5:00) | 61 (13:00) | 2.55 | 80 |
| 16 December | 34.3 (15:00) | 24.6 (6:00) | 94 (7:00) | 50 (16:00) | 4.2 | 34.5 |
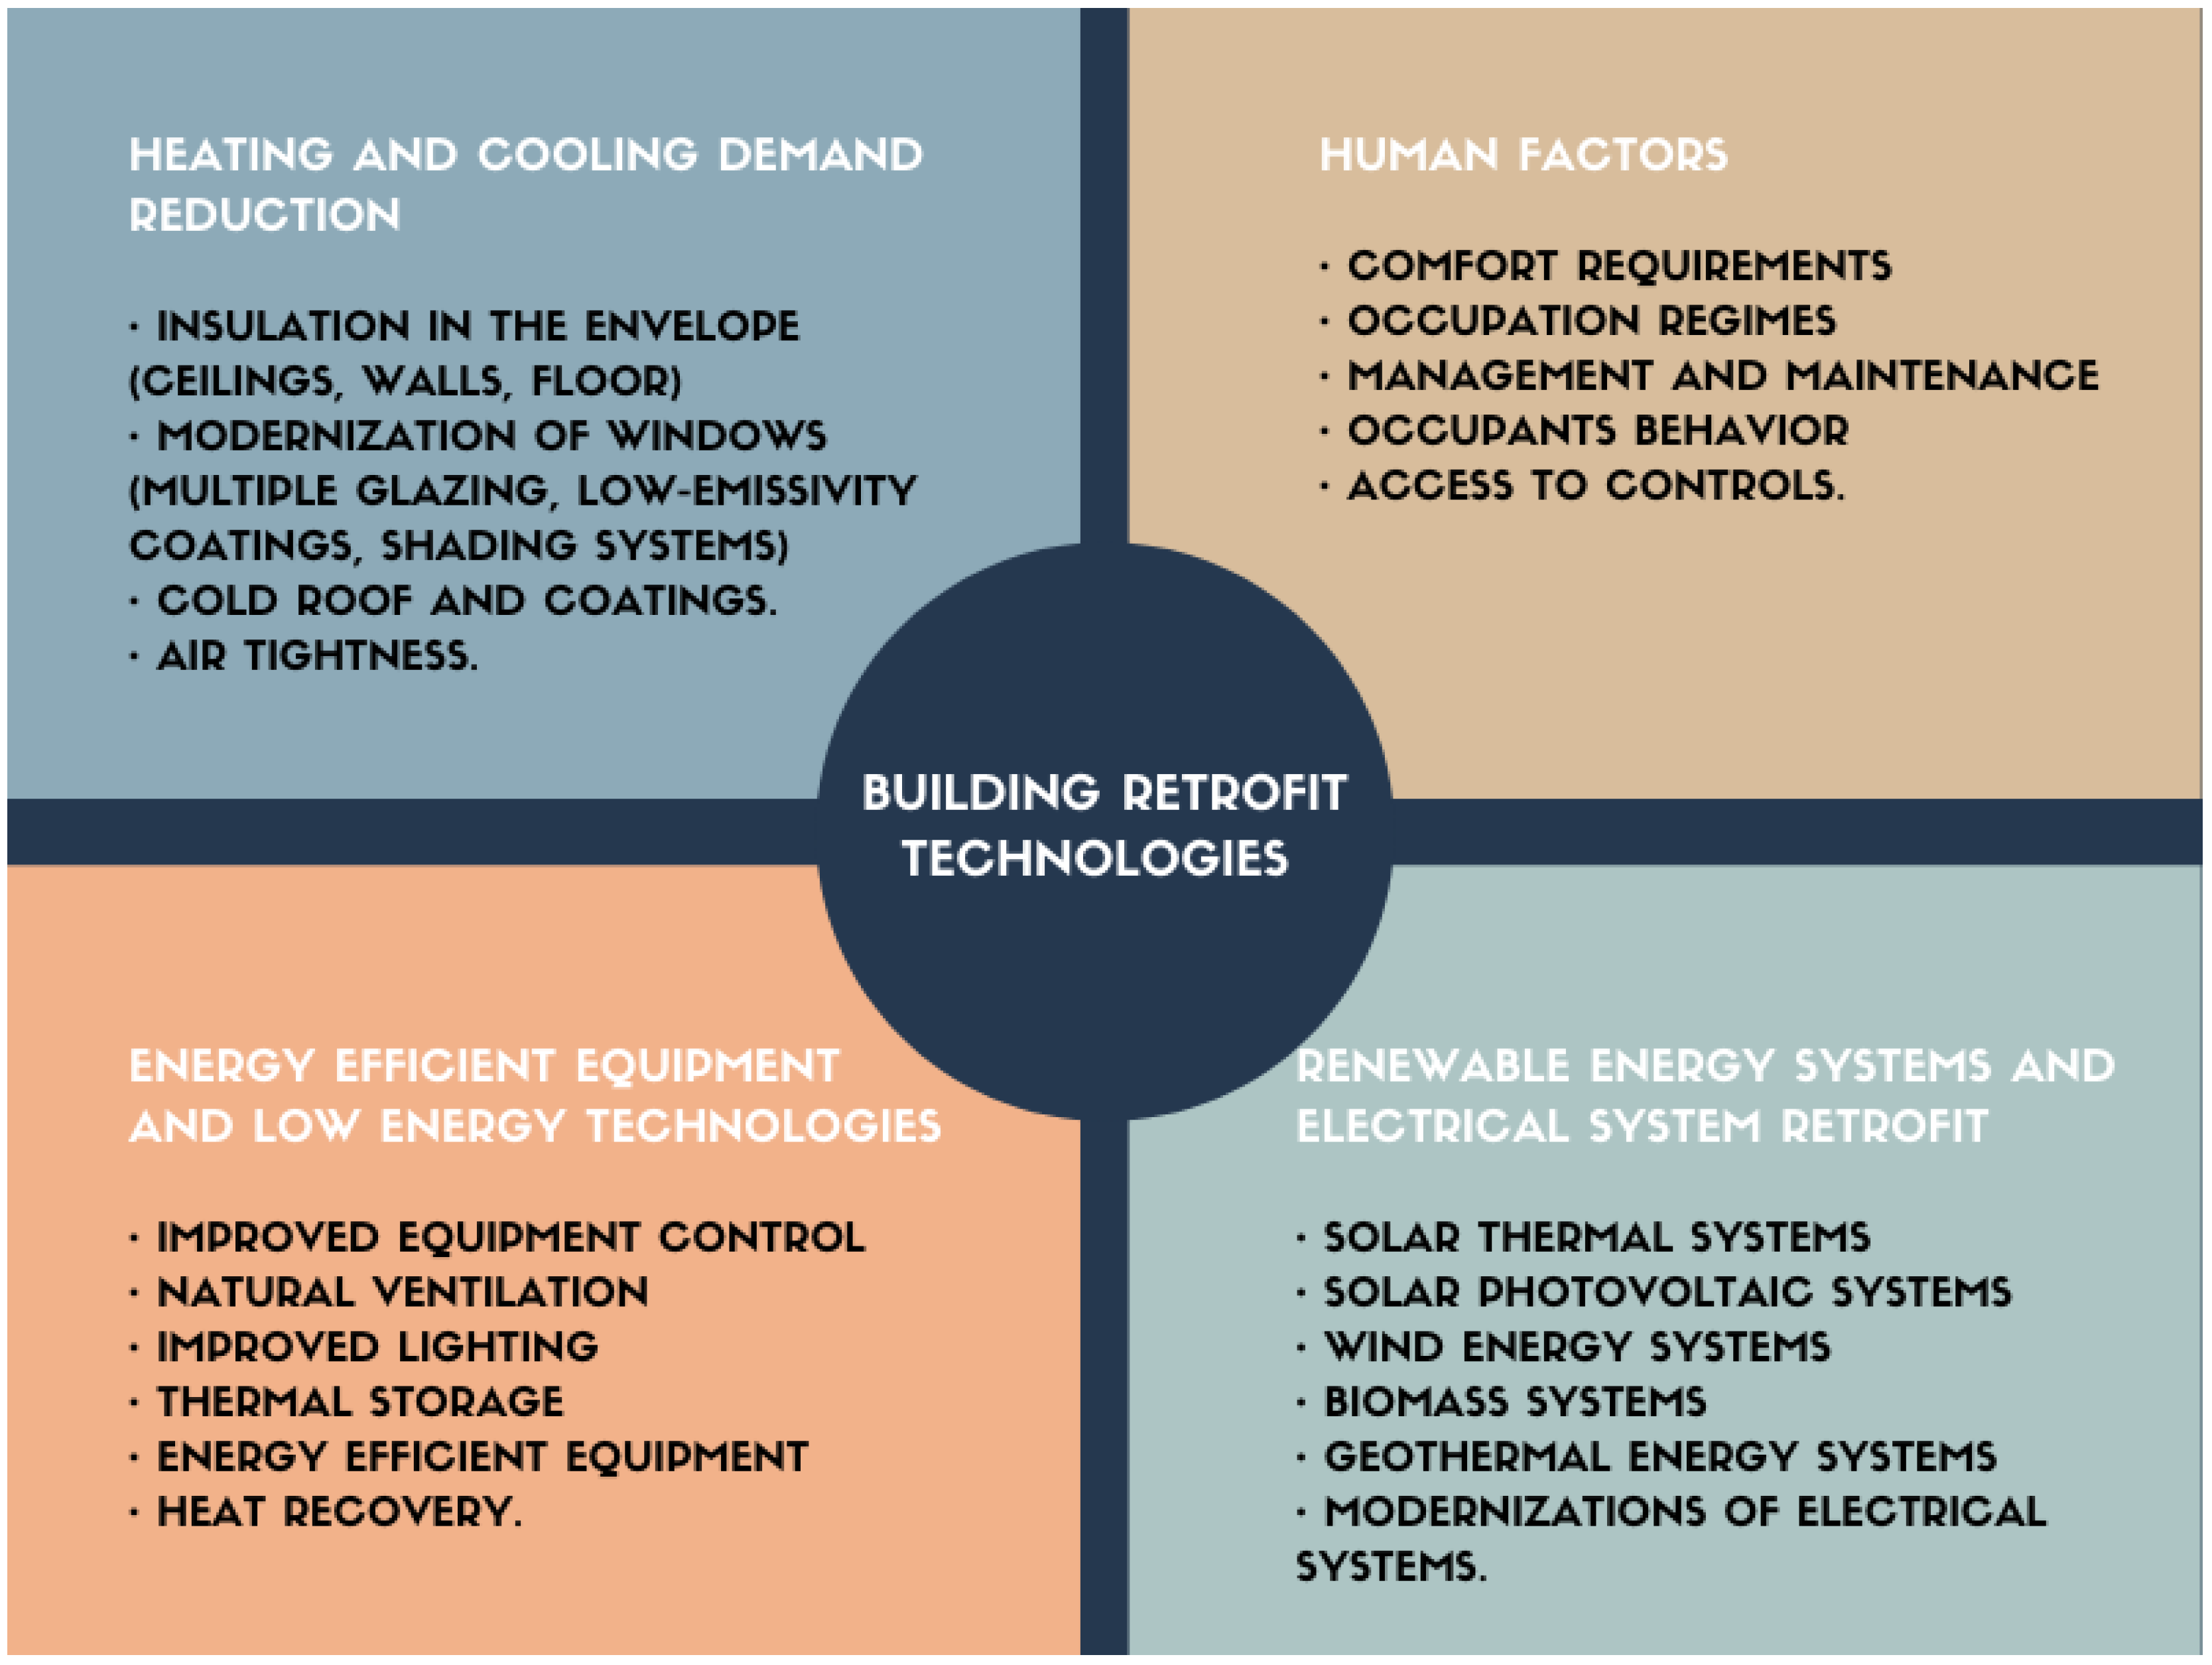
| Category | Retrofit Technique |
|---|---|
| Energy efficient systems and equipment | Highly efficient appliances and office equipment Hot water system Heat pump Gas boiler Air-conditioning system Variable volume of refrigerant with heat recovery Variable speed Biomass Floor heating distribution Single coil with double fan Compressor upgrade Air quality system Control system Presence detector Demand ventilation Illumination LED CFL Light ducts Demand ventilation Heat recovery system Natural ventilation Solar chimney |
| heating and cooling demand reduction | Insulation in walls and roof Windows Insulating glass units with chambers Window films Solar control film Shade devices such as curtains Green roof and walls Sealing of leaks in windows and doors |
| Generation system | Photovoltaic solar system Solar thermal system with solar collectors Micro hydroelectric plant Trigeneration system |
| Human factor | Access to programmable thermostats Management of requirements in air conditioning systems |
| Envelope Component | Description | U (W/m2-K) | Cost (PAB/m2) | Nomenclature 2 |
|---|---|---|---|---|
| Roof | 0.4 mm zinc | 7.143 | 9.78 | TCA |
| Mineral wool, 100 m concrete slab | 0.51 | 154.71 | Top1 | |
| Mineral wool, 100 m concrete slab, EPS 1 | 0.50 | 153.04 | Top2 | |
| 100 m concrete slab, EPS 1 | 1.30 | 133.66 | Top3 | |
| Walls | 150 mm concrete block | 2.48 | 73.54 | PCA |
| 160 mm double hole brick | 1.72 | 80.55 | Pop1 | |
| 160 mm double hole brick, polystyrene | 0.62 | 115.72 | Pop2 | |
| 150 mm concrete block, polystyrene | 0.69 | 108.75 | Pop3 | |
| Windows | Single glass clear | 5.788 | 139.15 | VCA |
| Single glass low emissivity | 3.437 | 149.67 | Vop1 | |
| Single glass with solar control | 3.192 | 171.02 | Vop2 | |
| Double glass with solar control | 1.635 | 235.97 | Vop3 | |
| Single glass reflective | 5.720 | 196.18 | Vop4 | |
| Double glass absorptive-reflective | 4.664 | 218.68 | Vop5 | |
| Double glass absorptive-reflective | 2.320 | 286.92 | Vop6 | |
| Triple glass absorptive-reflective | 1.589 | 355.16 | Vop7 | |
| Shading | No overhangs, no side fins | - | - | SCA |
| Overhangs 0.25 m | - | 21.81 | Sop1 | |
| Overhangs 0.50 m | - | 43.63 | Sop2 | |
| Overhangs 0.75 m | - | 65.44 | Sop3 | |
| Overhangs 0.50 m, side fins 0.50 m | - | 66.19 | Sop4 | |
| Overhangs 0.75 m, side fins 0.75 m | - | 99.28 | Sop5 | |
| Overhangs 1.00 m, late side fins 1.00 m | - | 132.38 | Sop6 |
| Design Parameter | Schedule | TIME PERIOD | Nomenclature |
|---|---|---|---|
| Occupancy | 00:00–24:00 | Every day, all year | HCA |
| Equipment | 00:00–24:00 | Every day, all year | |
| Lighting | 18:00–23:00 | Every day, all year | |
| Occupancy | 7:00–19:00 | Weekdays, all year | Hop1 |
| Equipment | 7:00–20:00 | Weekdays, all year | |
| Lighting | 7:00–19:00 | Weekdays, all year | |
| Occupancy | 6:00–22:00 | Every day, all year | Hop2 |
| Equipment | 7:00–21:00 | Every day, all year | |
| Lighting | 6:00–22:00 | Every day, all year | |
| Air conditioner | 00:00–24:00 | Every day, all year | ACA |
| 8:00–18:00 | Every day, October to December | Aop1 | |
| 19:00–07:00 | Every day, all year | Aop2 | |
| 00:00–8:00 | Every day, October to December | Aop3 | |
| 18:00–21:00 | Weekdays, all year | Aop4 | |
| 12:00–18:00 | Weekends and holidays, all year | ||
| 19:00–24:00 | Every day, all year | Aop5 | |
| 19:00–23:00 | Every day, all year | Aop6 | |
| 9:00–11:00 | Every day, all year | Aop7 | |
| 19:00–4:00 | Every day, all year | Aop8 | |
| 7:00–19:00, | Weekdays, all year | Aop9 | |
| 8:00–20:00 | Weekdays, all year | Aop10 |
| Optimization Method | Electricity Consumption (kWh) | Total Cost (PAB 1) | Comfort ASHRAE 55 (hr) | Embedded CO2 (kg) | Cooling Set-Point (°C) | Cooling Operation Hours | Occupancy | External Walls |
|---|---|---|---|---|---|---|---|---|
| Important design variables | 504.182 | 371,130.03 | 164.458 | 57,795.752 | 26.700 | 7:00–19:00, Weekdays | 7:00–19:00, Weekdays | 150 mm concrete block (U = 2.48 W/m2-K) |
| Categories: human factor | 530.036 | 375,228.65 | 165.875 | 54,434.091 | 23.800 | 7:00–19:00, Weekdays | 7:00–19:00, Weekdays | --- |
| Month | Electricity Consumption (kWh) | Total Electricity Cost (PAB 1) |
|---|---|---|
| January | 3117.22 | 464.15 |
| February | 2735.54 | 407.48 |
| March | 3181.47 | 473.69 |
| April | 3189.96 | 474.95 |
| May | 3350.53 | 498.80 |
| June | 3108.42 | 462.84 |
| July | 3295.69 | 490.65 |
| August | 3273.65 | 487.38 |
| September | 3126.15 | 465.48 |
| October | 3184.09 | 474.08 |
| November | 2933.26 | 436.83 |
| December | 3185.20 | 474.24 |
| Total | 37,681.17 | 5610.58 |
| Cooling Set-Point (°C) | Cooling Operation Hours | Occupancy | External Walls |
|---|---|---|---|
| 24.5 | 8:00–20:00, Weekdays 2:00–21:00, weekends | 7:00–19:00, weekdays | Concrete block 150 mm (U = 0.69 W/m2-K) |
| Electricity Consumption (kWh) | Total Cost (PAB 1) | Renovation Cost (PAB 1) | Comfort ASHRAE 55 (hr) | Embedded CO2 (kg) |
|---|---|---|---|---|
| 482.09 | 382,626.34 | 19,890.48 | 160.46 | 58,677.28 |
| Model | Design Variables | Optimal Solutions |
|---|---|---|
| MO1 | A/C set point (°C) | 28 |
| Shading | Overhangs 1.00 m, sidefins 1.00 m | |
| Roof | Insulated roof | |
| Windows | Double glass low emissivity, 6mm air | |
| Blinds | None | |
| MO2 | A/C set point (°C) | 24.5 |
| Cooling operation | 8:00–20:00, weekdays 2:00–21:00, weekends | |
| Occupancy | 7:00–19:00, weekdays | |
| External walls | 150 mm concrete block (U = 0.69 W/m2-K) |
| Month | Cooling Consumption (kWh) Occupancy | Percentage Difference (%) | |
|---|---|---|---|
| MO1 | MO2 | ||
| January | 2898 | 3165 | 8.44 |
| February | 2612 | 2821 | 7.41 |
| March | 2972 | 3273 | 9.18 |
| April | 3048 | 3268 | 6.73 |
| May | 3148 | 3368 | 6.54 |
| June | 2841 | 3006 | 5.50 |
| July | 3115 | 3280 | 5.02 |
| August | 3051 | 3220 | 5.25 |
| September | 2878 | 3001 | 4.09 |
| October | 2926 | 3089 | 5.27 |
| November | 2898 | 3165 | 8.44 |
| December | 2612 | 2821 | 7.41 |
| Total | 2972 | 3273 | - |
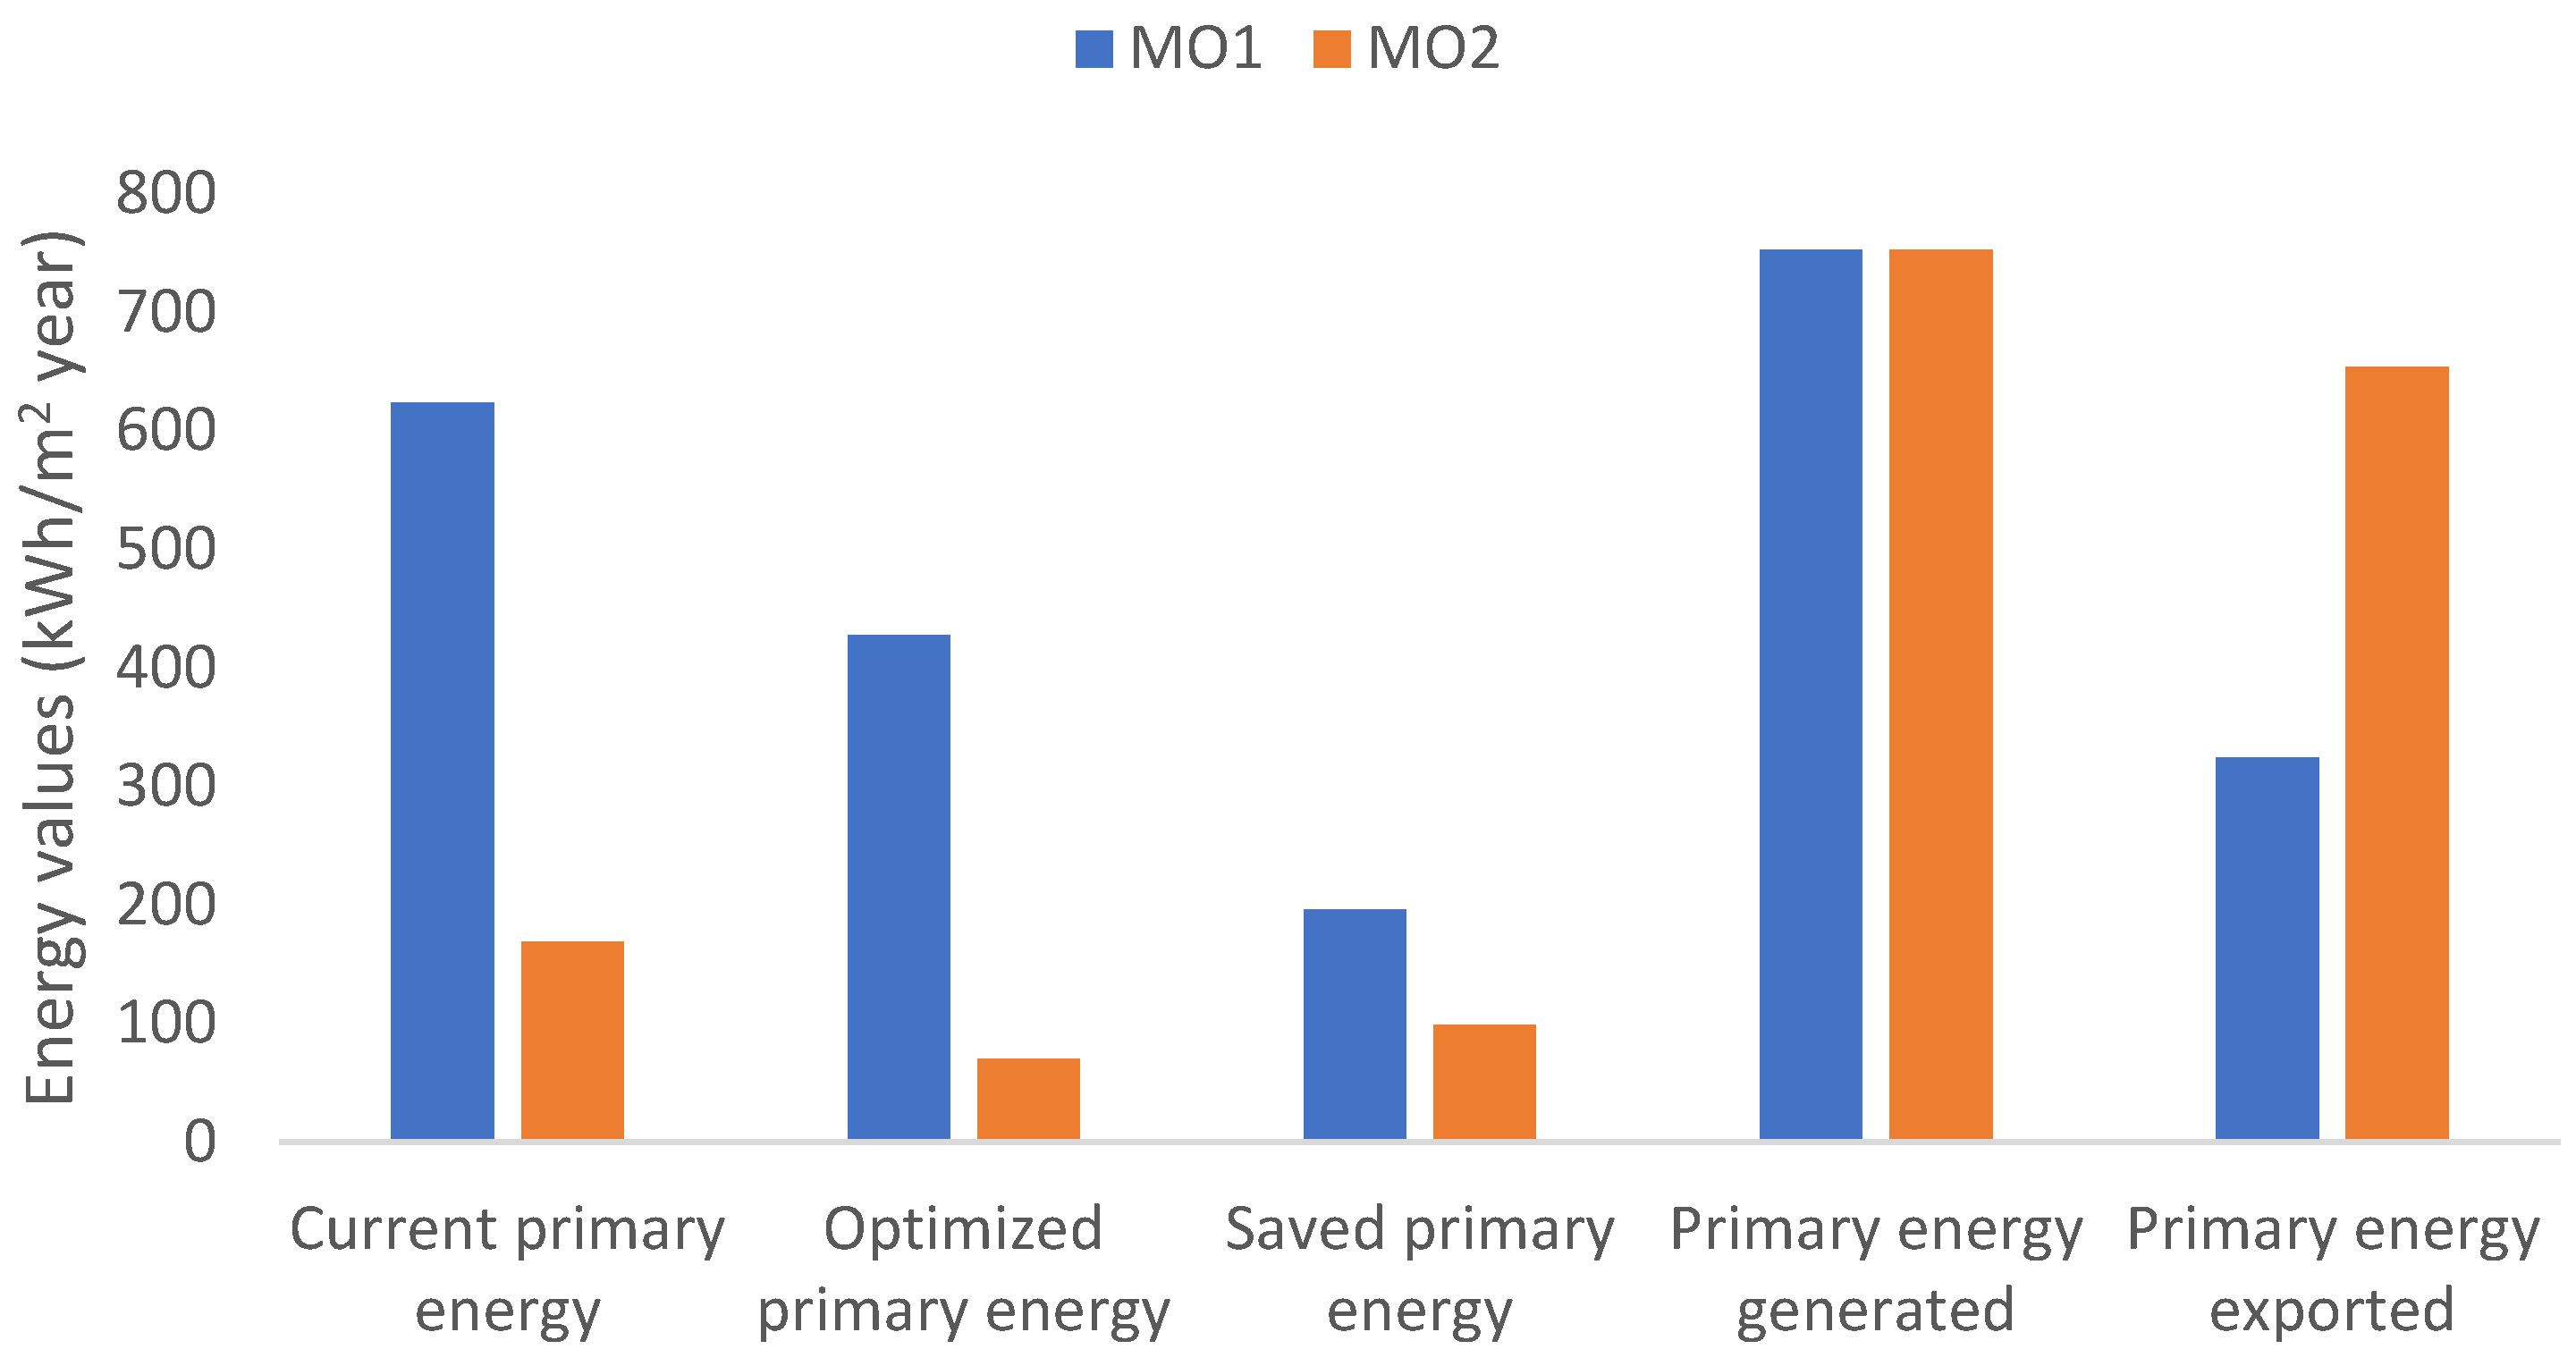
| Data | Energy Values | |
|---|---|---|
| MO1 | MO2 | |
| Current primary energy 1 | 624.27 | 169.45 |
| Optimized primary energy 1 | 428.2 | 70.53 |
| Saved primary energy | 196.07 | 98.92 |
| Primary energy generated 2 | 752.97 | 752.97 |
| Primary energy exported | 324.77 | 654.05 |
Publisher’s Note: MDPI stays neutral with regard to jurisdictional claims in published maps and institutional affiliations. |
© 2022 by the authors. Licensee MDPI, Basel, Switzerland. This article is an open access article distributed under the terms and conditions of the Creative Commons Attribution (CC BY) license (https://creativecommons.org/licenses/by/4.0/).
Share and Cite
Chacón, L.; Chen Austin, M.; Castaño, C. A Multiobjective Optimization Approach for Retrofitting Decision-Making towards Achieving Net-Zero Energy Districts: A Numerical Case Study in a Tropical Climate. Smart Cities 2022, 5, 405-432. https://doi.org/10.3390/smartcities5020023
Chacón L, Chen Austin M, Castaño C. A Multiobjective Optimization Approach for Retrofitting Decision-Making towards Achieving Net-Zero Energy Districts: A Numerical Case Study in a Tropical Climate. Smart Cities. 2022; 5(2):405-432. https://doi.org/10.3390/smartcities5020023
Chicago/Turabian StyleChacón, Lorena, Miguel Chen Austin, and Carmen Castaño. 2022. "A Multiobjective Optimization Approach for Retrofitting Decision-Making towards Achieving Net-Zero Energy Districts: A Numerical Case Study in a Tropical Climate" Smart Cities 5, no. 2: 405-432. https://doi.org/10.3390/smartcities5020023
APA StyleChacón, L., Chen Austin, M., & Castaño, C. (2022). A Multiobjective Optimization Approach for Retrofitting Decision-Making towards Achieving Net-Zero Energy Districts: A Numerical Case Study in a Tropical Climate. Smart Cities, 5(2), 405-432. https://doi.org/10.3390/smartcities5020023