
Finite Element–Boundary Element Acoustic Backscattering with Model Reduction of Surface Pressure Based on Coherent Clusters


1
Structural Engineering Department, University of California, San Diego, CA 92093, USA
2
Heat, Light, and Sound Research, Inc., 1130 Wall Street #518, La Jolla, CA 92037, USA
*
Author to whom correspondence should be addressed.
Acoustics 2023, 5(4), 1016-1035; https://doi.org/10.3390/acoustics5040058
Submission received: 1 October 2023
/
Revised: 18 October 2023
/
Accepted: 24 October 2023
/
Published: 31 October 2023
Abstract
:Computing backscattering of harmonic acoustic waves from underwater elastic targets of arbitrary shape is a problem of considerable practical significance. The finite element method is commonly applied to the discretization of the target; on the other hand, the boundary element method naturally incorporates the radiation boundary condition at infinity. The coupled model tends to be expensive, primarily due to the need to manipulate large, dense, and complex matrices and to repeatedly solve systems of complex linear algebraic equations of significant size for each frequency of interest. In this article, we develop a model reduction transformation based on the notion of coherence applied to the surface pressures, which considerably reduces the size of the systems to be solved. We found that the proposed model reduction approach delivers acceptably accurate results at a fraction of the cost of the full model. A typical speedup of an order of magnitude was realized in our numerical experiments. Our approach enables backscattering computations with considerably larger models than have been feasible to date.
1. Introduction
The determination of the interaction between a submerged elastic structure and the surrounding fluid is of considerable interest, particularly in underwater acoustics and aeronautics, where it is necessary to determine the acoustic field around an arbitrary three-dimensional (3D) structure [1,2]. The “standard” method for the solution of the vibrations of arbitrary elastic structures is the finite element method. The surrounding fluid is often considered infinite in extent; hence, the solution of the reduced wave equation in the surrounding medium is effectively handled by the boundary integral equation. Thus, the boundary integral method has the advantage of reducing the dimensionality of the problem by one. Finally, the radiation condition at infinity can be easily satisfied, while the finite element method must work hard to incorporate this condition [3].
The calculation of the scattered sound-pressure field is treated here with a coupled computational framework that includes both the finite element (FE) and boundary element (BE). In the established FE/BE coupled framework [4,5,6], the surface fluid pressures are calculated by coupling the finite element model of the structure with a discretized form of the Helmholtz surface integral equation for the exterior fluid (an alternative which eliminates pressure in favor of displacement is described in [6], though it is not clear whether it is a less expensive approach). As is well known, the resulting equations for the discrete acoustic pressures are complex, and the coefficient matrix is dense, non-symmetric, and quite expensive to compute. Moreover, the solution of the equations is very expensive for fine discretizations of the wet surface. Considering the scaling of the computational cost, the evaluation of the operators (single- and double-layer matrices) is of the order , where N is the number of collocation points; on the other hand, the solution of the resulting system of equations scales as (with LU or QR decomposition) [3,7]. Therefore, the solution of the resulting system of equations is the controlling factor as the size of the problem grows. This job may well become too expensive for current computing environments to handle in terms of both the computing time and the storage required to accommodate the large matrices.
It bears emphasizing that various schemes that take advantage of the special structure of the matrices to reduce the cost of storage and necessary matrix processing, such as the fast multipole methods [7,8,9], have been successfully applied in the past and are currently the subject of considerable ongoing research. Methods for addressing these problems based on a hierarchical representation of the problem, such as panel clustering methods [10], are promising (a note is in order here in that our references to clusters are only tangentially related to the hierarchical panel clustering methods).
Here, we adopt a coupled FE/BE framework, which by itself is rather standard, and reduce its computational cost by a novel model reduction overlay applied to the acoustic pressure. Specifically, we constructed a transformation from the space of the unknowns of the pressure field at the centroids of the triangles (panels) that discretize the surface of the target to a much smaller space (typically an order of magnitude smaller) of unknown generalized pressures, which are associated with spatially compact (coherent) clusters of triangles. The solution of the system of linear algebraic equations for the pressure then becomes much less expensive, having been reduced by the cubed ratio of the number of generalized pressures to the number of panels. Consequently, the wall clock time per frequency is considerably shortened for the reduced model. Compared to the full model, we typically achieve overall speedups of an order of magnitude.
The structure of this article is as follows. The method is developed in Section 2, where for completeness we briefly review the boundary model of the exterior acoustic problem and the finite element model of the motion of the solid scatterer. We address the coupling of the boundary element method used for the acoustic medium and the finite element method used for the elastic target, and introduce the suppression of spurious modes with the CHIEF method. Then, we elucidate the model reduction ideas, introducing the notion of the coherence of the pressure on the surface of the target, explain how to construct the model reduction matrix, discuss how to partition the surface into clusters, and propose model reduction strategies that incorporate the CHIEF method. The computational cost is discussed, especially relative to the scaling, as are possible extensions. In Section 3, we demonstrate that the proposed method can solve backscattering problems with sufficient accuracy and at a fraction of the cost of the full model. Finally, Section 4 lists the key conclusions from this work.
2. Methods
We begin with a brief synopsis of the necessary equations. This material is not new, as it has already been the subject of several articles and textbooks [6]. However, as we need to refer to numerous equations in the new material below, we think it advisable to provide the equations within context. Additionally, readers who may wish to implement the described techniques by themselves will benefit from an explicit recitation of the constituent parts.
2.1. Exterior Acoustic Problem
Consider an elastic solid scatterer embedded in an infinite extent of acoustic fluid (water). The space in occupied by the deformable structure is denoted as . The structure may have internal voids. Therefore, the bounding surface of the solid domain is not necessarily wholly in contact with the fluid. We call the interface between the solid and the surrounding acoustic fluid . We assume that this is a closed and simply connected manifold surface. The fluid domain is , and is the complement of the volume enclosed by S. The fluid is characterized by its mass density and sound speed . The harmonic acoustic excess pressure is described by the well-known Helmholtz equation. The interaction of the solid scatterer with the fluid along the boundary S is described by the following boundary condition:
where the symbol n denotes the outer normal to the volume of the scatterer (i.e., n points into the fluid). Further, quantities with a superimposed symbol represent complex harmonic amplitudes; in particular, is the complex harmonic displacement of the surface S.
For application of the boundary element technique, we employ an integral equation formulation of the exterior Helmholtz equation. For an acoustic wave incident on the structure , which results in a scattered acoustic wave , for the total acoustic wave , we can write the integral equations
The equation in (2) for a point on the surface is commonly referred to as the Surface Helmholtz Equation (SHE), while the bottom equation for a point within the interior of the scatterer is known as the Interior Helmholtz Relation (IHR). In this work, and we assume the free-space Green’s function.
The two unknown quantities in the resulting equation are the pressure and the surface normal displacement. The above can be expressed in terms of the surface velocity .
2.2. Equations of Motion of the Scatterer
The governing equations of the solid scatterer can now be immediately formulated for the steady state of harmonic vibration. We assume that body forces are absent and that the vibrating solid is free of displacement constraints, that is, the solid is free-floating in the acoustic medium.
The boundary condition on the wet surface of the solid S is
We employ the so-called “Voigt” vector notation. Here, is the operator that constructs a traction vector from the stress vector given the outer normal n. If there are voids within the solid scatterer, we assume traction-free boundary conditions on the bounding surfaces of such cavities.
The weak formulation of the governing equations leads to the classical Galerkin weighted residual equation:
2.3. Boundary Element Discretization
The governing equations of the fluid (2) and solid (4) are coupled, as can be recognized from the presence of the pressure and displacement in both equations. The numerical solution is sought by discretizing the fluid equations using the boundary element method and by discretizing the equations of the solid using the finite element method.
The finite element model implements nodally-integrated four-node tetrahedra with energy sampling stabilization, as introduced in [11]. As a consequence, the surface of the solid scatterer, that is the surface S and all the surfaces of the internal voids, are covered with triangular faces. We refer to these faces as panels.
Equation (2) for any point on the wet surface can be written as
In order to discretize the above equation with collocation, we form the expansions and using basis functions . These basis functions are piecewise constants over the covering of the surface of the scatterer with N triangular panels
Each of the triangular panels corresponds to a face of the tetrahedral element employed for the solid scatterer that is wetted by the acoustic medium. Substituting this in (5) results in
where
in which . The matrices A and B are commonly known as the double- and single-layer matrices. The vector collects the normal components of the velocity at the centroid of each panel; recall here that the basis functions are constant on each panel. Both integrands in (8) display integrable singularities for . This computational difficulty can be handled through a variety of methods [12].
It bears emphasis that computation of all the entries of the matrices A and B is embarrassingly parallel. Our code takes advantage of this by launching multiple threads to process sections of the matrices concurrently.
2.4. Finite Element Discretization
The finite element model described in [11] is based on nodally-integrated four-node tetrahedra with stabilization. Unphysical (spurious) vibration modes of the nodally integrated elements are removed through energy-sampling stabilization, effectively treating both the lower and higher ends of the frequency spectrum. This formulation is shown to be coercive and locking-free by numerical inf-sup tests, and as such is suitable for nearly-incompressible materials such as rubber or similar plastics. The two stabilization parameters introduced in [11] have been adjusted to and in order to increase the fixed-mesh accuracy. The aim of this modification is to take advantage of the nearly equilateral tetrahedral elements typical of the meshes used in acoustics simulations.
The finite element model discrete equations result from a variation of (4), as described in much detail in [11], yielding the matrix expression of the undamped harmonic forced vibration
where the mass matrix M and stiffness matrix K are obtained from the first two terms in (4) and the vector of the nodal loads expresses the effect of the acoustic pressure on the boundary S (the last term in (4)).
2.5. Coupling of the Boundary Element and Finite Element Models
The vector expresses the action of the total pressure on the surface of the scatterer. The distribution of the total pressure on the surface is described by (6), leading us to write
where the rectangular coupling matrix G of size in components is
where the notation indicates a map from node number K and coordinate direction j to a degree of freedom number , D is the total number of displacement degrees of freedom, m is the pressure degree of freedom in the boundary element method, is the surface panel m, N is the total number of pressure degrees of freedom (i.e., the number of triangle panels), and is the vector of the pressure values on the surface panels.
In a similar manner, the normal velocity of the panels, which is piecewise constant along each surface panel, can be obtained as the surface-weighted mean of the velocities at the nodes [13]:
where D is a diagonal matrix of the areas of the surface panel:
Therefore, using , we can express the normal velocity on the panels as
It follows that by combining (14) with the equation of motion of the scatterer (9), the definition of the pressure loads (10), and the BEM Equation (7), we arrive at
or
which may be solved for the panel values of the total pressure . It bears emphasizing that the matrices A and B, along with the vector , are functions of the angular frequency .
The matrix is known as the dynamic stiffness. Note that it depends on the frequency of excitation . In the applications considered here, i.e., the so-called “acoustic color” computation of the backscattered target strength as a function of aspect angle and frequency, the scattered pressures need to be calculated for many values of the frequency .
Compounding these difficulties, in order to resolve waves with wavelength , where c is the sound speed in the fluid, it is necessary to match the element size h in the finite element mesh, and hence the size of the boundary element panels, to the frequency of the excitation:
where is the number of element edges per wavelength (typically 10). The number of solid finite elements in the mesh is inversely proportional to ; consequently, the size of the dynamic stiffness matrix grows with . Therefore, when the wavenumber becomes large, i.e., (here, and a is a characteristic dimension of the solid scatterer), the simulations become progressively more and more expensive; a significant part of this cost is the solution of the system of linear algebraic equations implied by the notional inverse of the dynamic stiffness matrix.
In order to avoid the large cost of solving with the large dynamic stiffness matrix, a modal expansion may be employed [13]. Using the incomplete (rectangular) matrix of eigenvectors , where each column represents an eigenvector, we can write approximately
where the matrix subscript r implies that only r eigenvectors (columns) have been retained in the matrix . Therefore, (16) may be approximated with the computationally attractive formula
It needs to be emphasized that the solution of a free vibration (generalized eigenvalue) problem is needed to obtain . This demands significant effort, as the dimension of the matrix pencil is large and the number of required eigenvectors is typically large as well; the number of retained eigenvalues must be proportional to the frequency , and the largest computed eigenvalue must exceed by a significant margin (often taken as 50%).
An approach has been presented in [14] to approximate the set of vectors at a much lower cost using a novel and inexpensive a priori transformation built on the notion of coherent nodal clusters. The resulting modal decomposition is only approximate; the basis vectors satisfy the mass- and stiffness-orthogonality conditions relative to the original matrices of the system only approximately. Hence, a minor modification of (19) is required due to the lack of true orthogonality on the part of the modal basis, and Equation (19) must be rewritten as
where the reduced mass and stiffness matrices are , . This change does not have a large impact on the execution time; the most expensive parts of the computation are the calculation of the entries of the A and B matrices, and the solution of (20), where the coefficient matrix on the left hand side is a dense complex matrix with a dimension equal to the number of the surface panels N.
2.6. Suppression of Spurious Solutions
The integral equation approach has the obvious advantage that it reduces the infinite exterior domain to the finite domain of the surface of the structure. The surface-point equation in (2) is known as the Surface Helmholtz Equation (SHE), while the interior-point equation is known as the Interior Helmholtz Relation (IHR) [15]. Together, these equations relate the acoustic pressure on the surface of the structure to the normal surface velocity. They can be used to solve the acoustic radiation or scattering problems when either the surface pressure or velocity is known. Therefore, only surface values are calculated from which the field at any position of interest may be evaluated using the exterior-point equation (2). The radiation condition is automatically satisfied.
As with all classical formulations of the Helmholtz equation in the exterior region, whether through the use of single or double layer, virtual source distributions, or the use of Green’s theorem, the above formulation breaks down due to either the non-uniqueness or non-existence of the solutions at certain wavenumbers [15]. This failure is non-physical in nature, as it is due to the integral equation formulation, and is associated with the existence of eigensolutions of the Helmholtz equation in the interior of the wet surface. The SHE (viz., Equation (19) or (20)), as an integral equation of the second kind, is most suitable for numerical implementation; however, it produces non-unique solutions when the wavenumber k is an eigenvalue of the Dirichlet problem for the interior region . The IHR is shown to possess a unique solution if it is satisfied at all interior points; however, being an integral equation of the first kind, it suffers from numerical instability.
The Combined Helmholtz Integral Equation Formulation (CHIEF) from Schenck [13] uses the numerical stability of the SHE and the uniqueness property of the IHR to form an overdetermined set of linear equations. These equations, which are obtained from a numerical approximation of the SHE with a small number of additional equations derived from the IHR, can then be solved with a least squares solver. Schenck proved that at a critical wavenumber only the unique solution of the SHE will simultaneously satisfy the IHR under the condition that the IHR is not evaluated on the nodal surfaces of the interior eigenfunctions.
For the IHR matrices, we have expressions analogous to (8), assuming that there are M suitably chosen points in the interior of the complement of the fluid domain . In this work, we randomly choose a subset of the centroids of the tetrahedral elements that compose the solid domain.
Denoting the coefficient matrices of either Equation (19) or (20) as H, we can formulate the classical CHIEF equations as follows [13,16]:
This equation with a rectangular coefficient matrix is best solved as a classical least squares problem, perhaps with the QR decomposition.
Here, is a vector of Lagrange multipliers with values that have the meaning of the error in the pressures at the interior points. The symmetric formulation leads to a much faster solution, as only an LU decomposition is required. Unfortunately, there is evidence [16] that the symmetric formulation (22) is rather less successful at eliminating the irregular frequencies than the least-squares solution of (21).
2.7. Reduced Order Modeling
As outlined in the previous section, reduced-order modeling has already been applied in both Equations (19) and (20), first by employing a truncated modal expansion and second to derive the Ritz basis . Nevertheless, solving either of these two equations, or indeed their CHIEF equivalents ((21) or (22)), is very expensive. The coefficient matrix in those equations is full and complex, and in general is not symmetric either. The cost of the solution to a system of linear algebraic equations of this nature grows as its dimension cubed. The treatment proposed here to address the large and rapidly growing cost is to radically decrease the dimension of the coefficient matrix by applying the coherent node cluster model reduction technique [14,20].
The crux of the matter is how to reduce the space of the pressures. The technique to be applied to this problem is fairly obvious, by taking advantage of the coherence of the spatial distribution of the pressures. Considering Figure 1, the two top images show the real and imaginary parts of the pressure for a particular angle of incidence and a particular frequency. Clearly, the pressure distribution displays patterns roughly commensurate with the diameter of the cylinder. This pattern can be represented by values on the individual triangles (panels). On the other hand, if we consider only a small neighborhood for a given surface point, the variation of the pressure around that point may very well resemble a low-order polynomial. The bottom-most image in the figure shows such small neighborhoods, which we call clusters. The pressure on the panels within each cluster is represented by functions selected to take advantage of the coherence. Mathematically, we can construct a transformation
where the tall and narrow matrix expresses the pressures at the individual panels as a linear combination of the columns of this matrix. The vector consists of Q multipliers in this linear combination, which are equivalent to generalized pressures.
2.7.1. Panel Clusters
The idea of coherent clusters was developed in [14]. Because the context there was the finite element method, with its attendant focus on continuity of approximating functions, it is useful to revisit the basic ideas in the specific context of pressure acting on surfaces embedded in a three dimensional space.
Consider a cluster of a few triangles in a plane. For definiteness, let us say that there are twenty triangles in the cluster. The pressures at the centroids of those triangles can be described by the vector
where . We can approximate this vector by writing
where the vectors are the basis of a three-dimensional subspace in a twenty-dimensional space of pressures at the centroids of the panels of the cluster. We can profitably engage a linear polynomial in an arbitrary Cartesian coordinate system to write an example of such a basis as follows:
where is the tuple of coordinates of the centroid of the i-th panel. We can refer to the basis vectors as being generated from a set of basis functions: is generated by the constant, is generated by the function x, and is generated by the function y.
Equation (25) manages to reduce the space of pressures on the cluster from twenty distinct values to just three coefficients. The vectors are then good candidates for the columns of the transformation matrix . Of course, the columns of such a transformation matrix should be linearly independent, which can be managed when the cluster is not degenerate in some way (for instance, when all the centroids in the cluster do not lie on a straight line).
2.7.2. Cluster on a Curved Surface
A complicating factor is that, referring to Figure 2, the clusters of surface panels in our application are located on curved surfaces. However, provided that the cluster represents a relatively flat piece of the surface, we can set up a local Cartesian coordinate system in which to compute the equivalent of the basis vectors (26). One possibility is to consider each centroid as a massive particle of weight 1 and location , then compute the principal axes of the cloud of these massive particles. First, we compute the centroid of the cloud, then evaluate the tensor of the moments of inertia. Solving the eigenvalue problem of the principal values provides us with a coordinate system locally aligned with a “tangent plane” that represents the cluster as the two principal directions associated with the two smallest moments of inertia .
2.7.3. Construction of the Basis Vectors
The basis vectors in two coordinates (i.e., in a plane) can be generated from functions in the form of a tensor product of one-dimensional functions, which we call prototype 1D functions. For instance, it is possible to work with Legendre polynomial basis functions [21]. For convenience and numerical stability, the normalized coordinates are preferred to the physical coordinates
and similarly for the other coordinate direction. A set of prototype basis functions is formulated, where . In the examples considered here, these are the Legendre polynomials , sometimes called Legendre functions of the first kind. It is assumed that is a suitable number of basis functions to incorporate in the construction of the transformation matrix along each spatial direction. The choice of is addressed below.
Using the scaling of the coordinates for each cluster, the basis functions can be expressed on the bi-unit square and . Therefore, it is natural to think of the decomposition of the two-dimensional basis functions as products of one-dimensional basis functions on the bi-unit interval , cf. Table 1. Note that the total number of basis vectors per cluster
is determined by the number of the prototype one-dimensional functions .
2.7.4. Generation of Panel Clusters
In this work, we adopt the Metis mesh partitioning library [22,23] to divide the surface mesh into spatially coherent clusters. Specifically, we partition the dual connectivity matrix (node-to-element) using the k-way partitioning algorithm [22]. As shown in Figure 1, this algorithm creates reasonably compact clusters of surface panels.
2.7.5. Choosing the Number of Clusters and the Number of the Basis Functions
How many clusters should be used, and how many basis functions per cluster? While this question does not have a unique answer, a simple algorithm is presented here that provides an estimate based on the basic properties of the wave-carrying fluid and the frequency range of interest.
Consider the highest frequency carried by the fluid as , and, as above, the sound speed in the fluid as . An oft-adopted rule of thumb concerning how many surface elements are necessary to reasonably reproduce the fluid waves at the highest frequency is ten element edges per wave length. These ten element edges then correspond to one sine or cosine wave. A not unreasonable approximation of this function within a single wavelength could be a cubic polynomial (). The basis vectors would in that case be generated by the functions shown in Table 1. Now, visualize an ideal cluster in the form of a square, with T element edges per side. There would be triangular panels in such a cluster. If we take element edges per side, there will be 200 surface panels included in such a cluster. There are ten basis vectors generated by the functions in Table 1. Therefore, in this case we would expect the solution of the linear system of the reduced equations to run ≈ times faster than the solution for the unreduced system. As demonstrated in Section 3.1, the assumption that the pressure waves in the fluid could be sufficiently well approximated for one wavelength by a cubic polynomial is too optimistic. It is more realistic to adopt a quintic polynomial for the prototype 1D functions (), which then results in 21 basis functions (i.e., 21 generalized pressures per cluster). The speedup due to the pressure reduction would then be ≈.
While this heuristic guidance works well, as demonstrated in our examples, other choices are possible as well, which we show.
2.7.6. Reduced Equations: First Attempt
The pressure reduction approach can be summarized as follows:
- Partition the surface panels into clusters.
- For each cluster, generate a number of independent basis vectors based on the selection of the 1D prototype functions.
- Assemble these basis vectors into the transformation matrix .
2.7.7. Model Reduction of the Interior-Point Matrix
Introducing the above reduction of the pressures on the panels addresses only the top portion of Equations (21) and (22). If we do not pay attention to the interior points in the CHIEF method, the number of interior points after reduction of the panel pressures may reach or exceed the number of generalized pressures on the surface. This would significantly reduce the efficiency of the method. In other words, what is needed is an algebraic transformation to reduce the number of rows corresponding to the interior points. Thus, we are seeking the transformation
where the matrix on the right has considerably fewer rows. In order to accomplish a full reduction, we apply the same basic idea to the interior points as previously invoked for the surface pressures, that is, the interior points are partitioned randomly into clusters and each cluster is associated with a single basis vector consisting of all ones (i.e., the prototype 1D function is a constant). In this way, the probability that all of the interior points of the cluster lie on the nodal surfaces of the interior eigenfunctions is greatly reduced.
We remark here that an alternative strategy could involve choosing only a reduced number of interior points. However, the preceding approach is considerably more robust.
2.7.8. Reduced Equations
With the matrix at hand, we can reduce the second line of (29), again by a Galerkin projection, to
where the matrix on the left hand side has Q columns and rows, with Q the number of generalized pressures on the surface and the number of generalized Lagrange multipliers at the interior points. The overdetermined system of equations can be solved again in a least-squares fashion, perhaps with a QR factorization.
2.8. Computational Cost
The time needed to solve the problem with a particular number of degrees of freedom is often a critical limiting factor. In this section, we look at the problem scaling and discuss a few possible performance enhancements.
2.8.1. Problem Scaling
Consider the case in which the upper limit of the frequency range is fixed. This is a common situation when attempting to ascertain the effect of the discretization error. In this case, the number of generalized degrees of freedom Q is independent of the total number of surface panels N. We can then hope to execute the simulation for one particular frequency in number of operations.
The order in which the implied matrix multiplications are executed to obtain the transformed matrices in (29) is important. The goal is to obtain , where H is defined in either (19) or (20). For definiteness, we consider (20). The evaluation of the matrices A and B takes operations. The product can then be obtained by employing a few temporary matrices. First:
of ; then, we can compute
where is independent of the angular frequency and as such can be precomputed and stored. The size of is , where E is the number of eigenvectors in the expansion . Next, we compute
with . Again, of size is independent of the angular frequency , and can be precomputed and stored. A system of linear algebraic equations with the coefficient matrix of size and Q right-hand sides needs to be solved. The overall result follows as
The number of operations to arrive at this matrix is . Similar reasoning applies to the construction of the matrix of Equation (31). Thus, we may conclude that, provided that Q is independent of N, the entire computation of the left-hand side reduced matrix (31) takes operations.
On the other hand, we can consider the increase of the upper limit of the frequency range of interest. Clearly, the number of clusters or the number of basis vectors per cluster needs to increase. For definiteness, we consider the case of fixed number of basis vectors per cluster. If the upper limit of the frequency range increases by a factor of two, the number of clusters needs to increase by a factor of two squared, i.e., four. This is the same scaling expected of the panels themselves. In this sense, the pressure reduction has the same scaling of the degrees of freedom as the original method ().
2.8.2. GPU Execution
When the pressure reduction is applied to the problem in (31), the solution of the algebraic equations becomes a small fraction of the overall cost. In order to further reduce the runtimes of the models, the cost of the left-hand side matrix needs to be addressed, as the majority of the time is now spent computing the left hand side matrix. With 16 computing threads, the computation of the entries of the A and B matrices takes approximately 46% of the wall-clock time, whereas the various matrix multiplications (32)–(35) account for 53% of the time. The computation of the entries of the single- and double-layer matrices could be accommodated on GPUs, potentially with great time savings, however, the series of matrix multiplications would need to be speeded up; in this respect, one helpful property is that the pressure transformation is a blocked-diagonal matrix.
2.8.3. Blocked Transformation into the Reduced-Pressure Space
If the degrees of freedom in each of the surface clusters are numbered consecutively, then the matrix of Equation (29) is blocked, with no coupling between blocks. The same holds for the transformation matrix applied to the interior points. A sparse blocked matrix storage enables the much faster products necessary to effect the transformation (31).
As GPU execution and utilization of blocking have not been implemented yet, the results will be presented in future publications.
3. Results
The performance of the proposed pressure reduction algorithm is illustrated here on a number of acoustic backscattering examples: a solid steel sphere, a solid aluminum cylinder, and a hollow aluminum spherical shell.
The computational experiments described below were implemented in the Julia programming language [24,25] in the framework of the FinEtools.jl Julia package [26]. The eigenvalue problem solutions were obtained with the reduced eigenvalue solution procedure from [14].
The experiments were executed on a Windows 10 machine with 2× Intel (R) Xeon(R) E5-2670 at 2.6 GHz, each with eight cores, with a total of 256 GB memory, an L1 cache of KiB, an L2 cache of KiB, and an L3 cache of 20,480 KiB.
3.1. Steel Sphere Backscattering Amplitude
The 3D simulations considered here used ten element edges per wavelength at the maximum frequency. The mesh of the sphere consisted of four-node tetrahedra with a prescribed edge length of 0.015 m, i.e., the element size was approximately 1.5% of the diameter. The modal matrix of (19) consisted of 800 modes, which were computed to default accuracy through an Arnoldi iteration-based method [14]. The largest natural frequency was approximately 16 kHz. The surface mesh consisted of 28,306 triangles. The number of interior points was adopted as one tenth of the number of panels, i.e., 2831 points. The partitioning of the surface of the sphere into clusters of panels is illustrated in Figure 3.
The sweep in the frequency domain consisted of 101 frequencies, from 100 Hz to 10 kHz, using a step size of 100 Hz. The full model based on Equation (22) was run with 16 threads, and a solution for one single frequency took 1020 s. The solution of the equations consumed most of the time, at 870 s. In this case, the solution was an LU decomposition followed by backward and forward substitution; it is of interest to note that the solution of a single least-squares system of equations would have taken almost 1.5 h for this problem. The computation of the matrices H and clocked in at approximately 135 s. With a single thread, this computation would have taken 860 s, comparable to the time needed to solve the equations.
Figure 4 compares the approximate solution using (19) with the reference curve based on the partial wave solution [27]. The modal expansion extended up to almost 16 kHz, which complies with the rule of thumb that the highest frequency of interest should be exceeded by the largest frequency of the modal expansion by at least fifty percent. Note that in any case the focus here is on the comparison of the full model (Equations (19) and (22)) with the pressure-reduced model of (31), not on the comparison with the reference solution.
The pressure-reduced model of (31) was based on the following parameters: number of panels per cluster 200, number of terms in the one-dimensional prototype function (referred to as the 200/6 model) in the figures, and 142 surface clusters, for a total number of generalized pressure degrees of freedom of 2982. The number of clusters of the interior points was set at 128; thus, the total number of degrees of freedom in Equation (31) was . The ratio of the degrees of freedom for the full model relative to the reduced model was (28,306 .
The results for the reduced model are presented in Figure 5, and are in good agreement both with the reference solution [28] and the full-system solution in Figure 4. The reduced model was run with 32 threads. The total time per frequency was 112 s, of which the construction of the matrices took 105 s and the solution of the equations took approximately 8 s. Note that the method to solve the equations was not an LU decomposition; rather, it was a least squares solution of an overdetermined rectangular system.
The pressure-reduced model ran times faster than the full model. A note concerning the speed up may be in order here, as there is a limit on how much faster the reduced model can run relative to the full model. The solution times for the system of equations cannot be simply scaled with the factor of , as the constant in front of the cube term for the least squares solution is larger than that for the LU decomposition. Furthermore, the construction of the matrices H and represents a kind of fixed cost, which is present in some form in both the full model and the reduced model. Therefore, the largest speedup we can expect is (total time/time for the H and matrices). From the full model, we have . This is the maximum possible speedup, predicated on the ability of totally eliminating the solution cost. Hence, our speedup of 9.1 needs to be considered in this light.
As we mentioned above, the choice of the number of panels per cluster and the number of prototype 1D function terms is not set in stone. Figure 6 shows the results for the same number of triangles per cluster (200), while , i.e., up to and including cubic terms. The agreement for frequencies up to 8 kHz is good; however, it is apparent that for the rightmost portion of the frequency sweep the approximation of the surface pressures is not good enough. On the other hand, using relatively small clusters with 50 triangles per cluster (for a total of 566 clusters) and (complete quadratic functions, referred to as the 50/3 scheme) produces a successful approach (see Figure 7). For this scheme, the total time per frequency was 97 s, of which the construction of the matrices took 79 s and the solution of the equations took approximately 11 seconds. The total number of generalized degrees of freedom was , about 12% more than for scheme 200/6. On the other hand, the transformation matrices consisted of considerably smaller blocks, and consequently were much sparser as is reflected in the timings.
3.2. Acoustic Backscattering from Aluminum Cylinder
The second example involves the backscattering target strength of a free-floating aluminum cylinder. The Young’s modulus, Poisson’s ratio, and mass density were taken as 70,000 , , and , respectively. The radius of the cylinder was feet and its height was feet, while and the incident field was a plane wave. The source and the receiver moved in the plane of the generating section by steps of degrees from to . The solution was obtained for 100 Hz frequency steps within two frequency ranges. Each range was covered by a separate finite element model. The number of surface panels was selected to deliver a resolution of the surface mesh of ten elements per wavelength at the upper frequency limit of the range for each mesh.
The first model had an element size of 10 mm and was deemed accurate up to 15 kHz. The second model was used from 15 kHz to 30 kHz with an element size of 5 mm. In both models, clusters of 200 triangular panels were employed together with (quintic basis functions).
In order to cover the frequency range, the number of natural mode shapes computed with the rapid eigenvalue solution [14] to construct the transformation matrix of (20) was selected to extend to 1.5× the upper limit of the frequency range (15 and 30 kHz, respectively).
3.2.1. Model for the Frequency Range of 100 Hz to 15 kHz
For the first model, 500 natural frequencies and mode shapes needed to be calculated, where the highest frequency was approximately 28.4 kHz. The model had 17,148 surface panels. The surface panel degrees of freedom were reduced to 1806 generalized pressures on 86 clusters on the surface and 64 interior generalized degrees of freedom, yielding a total of generalized degrees of freedom, for a reduction factor in the degrees of freedom of .
3.2.2. Model for the Frequency Range of 15 kHz to 30 kHz
To cover the frequency range of the second model, i.e., from 15 kHz to 30 kHz, 1500 free-vibration modes were necessary. The highest computed natural frequency in the modal expansion was 46.4 kHz. The model had 65,210 surface panels. The surface panel degrees of freedom were reduced to 6846 generalized pressures on 326 clusters on the surface and 256 interior generalized degrees of freedom, yielding a total of generalized degrees of freedom, for a reduction factor in the degrees of freedom of ≈10.1.
3.2.3. Timings
With 16 threads, the second model ran the computation for a single frequency in 928 s, of which the computation of the matrices H and took 834 s and solving the system of the least-squares equations took 79 s.
For comparison, the solution of the pressure Equation (22), i.e., for the full model with 65,210 pressure degrees of freedom + 6521 interior Lagrange multipliers, took 10,764 s (2.99 h). The total time per frequency was 11,808 s (3.28 h) for the full model. Consequently, the pressure-reduced model ran faster. For this particular model and this particular hardware and software configuration, this is a difference of 20.5 days (full model) and 39 h (reduced model) of continuous computing when covering the entire frequency sweep.
3.2.4. Accuracy
Figure 8 shows the backscattering target strength as a function of the incidence angle and the frequency (colloquially called the “acoustic color”). The solution of the axisymmetric model [28] with an element size of 5 mm is shown on the left. The left-hand side of Figure 8 shows the solution obtained with the pressure-reduced model employing 200 triangles per cluster and a basis of , with different resolution models for the two frequency ranges, as described above. Rather good agreement is evident between the reduced-pressure solution and the high-quality image obtained with the axially symmetric model.
3.3. Acoustic Backscattering from Hollow Spherical Aluminum Shell
Finally, we present the backscattering amplitude from an empty aluminum spherical shell. The radius of the sphere was 0.5 m and the shell thickness was 0.05 m. The acoustic excitation was a plane wave. The response in the frequency range from 100 Hz to 10 kHz by 100 Hz was described using the the partial wave method in [27]. For the finest mesh (with a mean element size of 0.009 m) there were more than 16 elements per wavelength of the highest frequency in the water. Such a fineness was indicated by the need to resolve the bending behavior of the shell by the volume mesh.
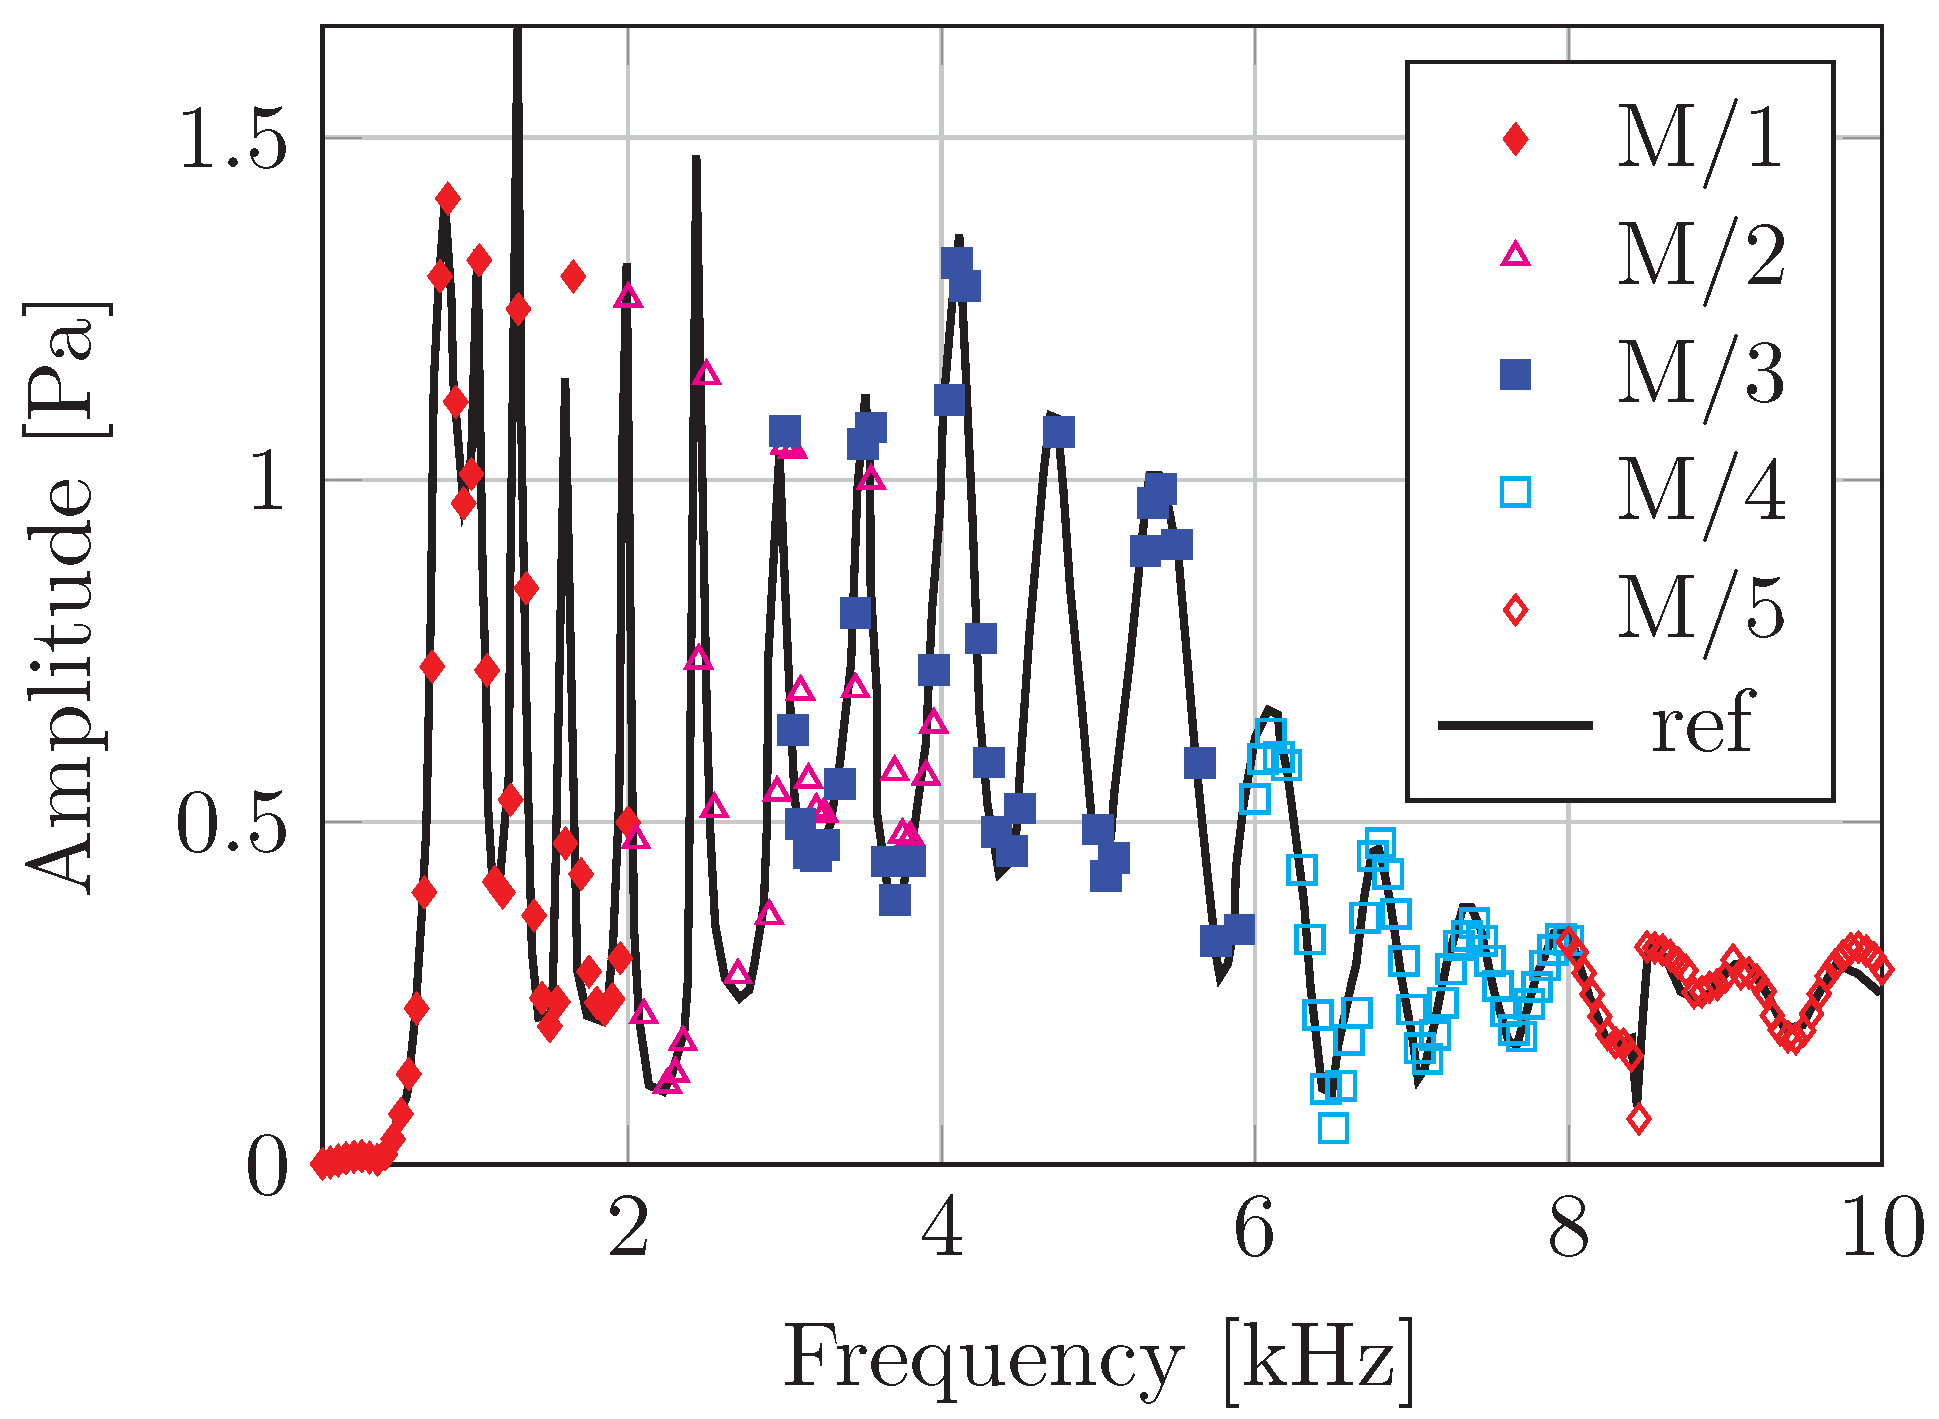
The mean element size required for sufficient accuracy at the highest frequency (10 kHz) resulted in a very large surface mesh (92,504 triangles); as such, the coefficient matrix of the full (unreduced) model resulted in a storage of 127.5 GB for each of the two square complex matrices of (7). This made it impossible to obtain the solution with the full model. The reduced models are summarized in Table 2. The analytical solution is compared in Figure 9 with our pressure-reduced model of (31) based on the following parameters: number of panels per cluster 200 and number of terms in the one-dimensional prototype function (referred to as the 200/6 model). The meshes reflected the frequency range, while the element size was chosen to yield at least ten elements per wavelength (in water). The number of vibration modes was selected to extend beyond the upper limit of the frequency range by 50%. Thus, the entire frequency range of interest was covered with five models, with an overlap between 3 and 4 kHz to illustrate the flexibility of the choice of the models; the same frequency range may be treated with models of different resolution and cost.
4. Conclusions
The coupled problem of the vibration of an elastic target excited by an incident sound field and the associated backscattering was addressed with a coupled pair of boundary element and finite element models. The coupled problem culminates for each frequency of the incident sound wave in a large system of complex linear algebraic equations for the acoustic pressures on the triangular panels that tile the surface of the scatterer. The two major costs are the construction of the left-hand matrix of this system and the solution of the equations. In this work, we have addressed the latter by developing an ad hoc model-reduction technique based on the idea that the sound pressures on adjacent triangular panels display coherence. This coherence was incorporated by subdividing the panels into spatially compact clusters, over which the variation of the pressure was then described by a collection of basis vectors and the associated multipliers (generalized pressures). The basis vectors were generated systematically from basis functions expressed in coordinate systems aligned with the cluster panels. The resulting algebraic transformation resulted in a coupled system of much smaller dimension than the number of original panels. Consequently, the time required to solve the system of equations for the acoustic pressures on the surface of the scatterer was reduced essentially to insignificance. The ability of the proposed approach to deliver solutions to backscattering problems with good accuracy and greatly reduced run-times (more than an order of magnitude) has been illustrated through a number of examples.
Author Contributions
All authors participated in the writing of the paper. P.K. coded the algorithms. All authors have read and agreed to the published version of the manuscript.
Funding
This work was partially supported by the Strategic Environmental Research and Development Program (SERDP) Contract No. W912HQ-14-C-0010 and ONR Contract No. N00014-00-D0115 in support of the Effects of Sound on the Marine Environment program.
Data Availability Statement
The data presented in this study are available in the article.
Conflicts of Interest
Author Ahmad T. Abawi was employed by the company Heat, Light, and Sound Research, Inc. The remaining author declares that the research was conducted in the absence of any commercial or financial relationships that could be constructed as a potential conflict of interest.
References
- Junger, M. Acoustic fluid-elastic structure interactions: Basic concepts. Comput. Struct. 1997, 65, 287–293. [Google Scholar] [CrossRef]
- Hackman, R.H. Acoustic Scattering from Elastic Solids. In Physical Acoustics; Pierce, A.D., Thurston, R., Eds.; Academic Press: Cambridge, MA, USA, 1993; Volume 22, pp. 1–194. [Google Scholar] [CrossRef]
- Kirkup, S. The Boundary Element Method in Acoustics: A Survey. Appl. Sci. 2019, 9, 1642. [Google Scholar] [CrossRef]
- Everstine, G.C.; Henderson, F.M. Coupled finite element/boundary element approach for fluid–structure interaction. J. Acoust. Soc. Am. 1990, 87, 1938–1947. [Google Scholar] [CrossRef]
- Fischer, M.; Gaul, L. Fast BEM–FEM mortar coupling for acoustic–structure interaction. Int. J. Numer. Methods Eng. 2005, 62, 1677–1690. [Google Scholar] [CrossRef]
- Atalla, N.; Sgard, F. Finite Element and Boundary Methods in Structural Acoustics and Vibration; Imprint CRC Press: Boca Raton, FL, USA, 2015. [Google Scholar]
- Rosen, E.M.; Canning, F.X.; Couchman, L.S. A sparse integral equation method for acoustic scattering. J. Acoust. Soc. Am. 1995, 98, 599–610. [Google Scholar] [CrossRef]
- Fischer, M.; Gauger, U.; Gaul, L. A multipole Galerkin boundary element method for acoustics. Eng. Anal. Bound. Elem. 2004, 28, 155–162. [Google Scholar] [CrossRef]
- Wilkes, D. The Development of a Fast Multipole Boundary Element Method for Coupled Acoustic and Elastic Problems. Ph.D. Thesis, Curtin University, Perth, Australia, 2014. [Google Scholar]
- Sauter, S.A.; Schwab, C. Boundary Element Methods; Springer: Berlin/Heidelberg, Germany, 2011; pp. 183–287. [Google Scholar] [CrossRef]
- Sivapuram, R.; Krysl, P. On the energy-sampling stabilization of Nodally Integrated Continuum Elements for dynamic analyses. Finite Elem. Anal. Des. 2019, 167, 103322. [Google Scholar] [CrossRef]
- Kirkup, S.M. The Boundary Element Method in Acoustics: A Development in Fortran; Integrated Sound Software: Hebden Bridge, UK, 1998. [Google Scholar]
- Benthien, G.W.; Schenck, H.A. Structural-Acoustic Coupling. In Boundary Element Methods in Acoustics; Ciskowski, R.D., Brebbia, C.A., Eds.; Springer: New York, NY, USA, 1977; pp. 109–128. [Google Scholar]
- Krysl, P.; Sivapuram, R.; Abawi, A.T. Rapid free-vibration analysis with model reduction based on coherent nodal clusters. Int. J. Numer. Methods Eng. 2020, 121, 3274–3299. [Google Scholar] [CrossRef]
- Wilton, D.T. Acoustic radiation and scattering from elastic structures. Int. J. Numer. Methods Eng. 1978, 13, 123–138. [Google Scholar] [CrossRef]
- Marburg, S.; Wu, T.W. Treating the Phenomenon of Irregular Frequencies. In Computational Acoustics of Noise Propagation in Fluids—Finite and Boundary Element Methods; Marburg, S., Nolte, B., Eds.; Springer: Berlin/Heidelberg, Germany, 2008; pp. 411–434. [Google Scholar] [CrossRef]
- Rezayat, M.; Shippy, D.; Rizzo, F. On time-harmonic elastic-wave analysis by the boundary element method for moderate to high frequencies. Comput. Methods Appl. Mech. Eng. 1986, 55, 349–367. [Google Scholar] [CrossRef]
- Seybert, A.F.; Rengarajan, T.K. The use of CHIEF to obtain unique solutions for acoustic radiation using boundary integral equations. J. Acoust. Soc. Am. 1987, 81, 1299–1306. [Google Scholar] [CrossRef]
- Amini, S.; Harris, P.J.; Wilton, D.T. Coupled Boundary and Finite Element Methods for the Solution of the Dynamic Fluid-Structure Interaction Problem; Springer: Berlin/Heidelberg, Germany, 1992. [Google Scholar]
- Krysl, P.; Sivapuram, R. Harmonic vibration analysis with coherent-nodal-cluster two-stage model reduction. Int. J. Numer. Methods Eng. 2022, 123, 1410–1431. [Google Scholar] [CrossRef]
- Abramowitz, M.; Stegun, I. Handbook of Mathematical Functions: With Formulas, Graphs, and Mathematical Tables; Applied Mathematics Series; Dover Publications: Mineola, NY, USA, 1965. [Google Scholar]
- Karypis, G.; Kumar, V. Metis. A Software Package for Partitioning Unstructured Graphs, Partitioning Meshes, and Computing Fill-Reducing Orderings of Sparse Matrices; Technical Report Version 4.0; University of Minnesota: Minneapolis, MN, USA, 1998. [Google Scholar]
- Metis.jl Development Team. Julia Interface to Metis Graph Partitioning Metis.jl. Available online: https://github.com/JuliaSparse/Metis.jl (accessed on 11 April 2021).
- The Julia Project. The Julia Programming Language. Available online: https://julialang.org/ (accessed on 13 March 2021).
- Bezanson, J.; Edelman, A.; Karpinski, S.; Shah, V.B. Julia: A fresh approach to numerical computing. SIAM Rev. 2017, 59, 65–98. [Google Scholar] [CrossRef]
- Petr Krysl. FinEtools: Finite Element Tools in Julia. Available online: https://github.com/PetrKryslUCSD/FinEtools.jl (accessed on 13 March 2023).
- Goodman, R.R.; Stern, R. Reflection and Transmission of Sound by Elastic Spherical Shells. J. Acoust. Soc. Am. 1962, 34, 338–344. [Google Scholar] [CrossRef]
- Abawi, A.T.; Krysl, P. Coupled finite element/boundary element formulation for scattering from axially-symmetric objects in three dimensions. J. Acoust. Soc. Am. 2017, 142, 3637. [Google Scholar] [CrossRef] [PubMed]
Figure 1.
Aluminum cylinder of diameter. Mesh with element size of 20 mm. From top to bottom: acoustic pressure computed with the below partitioning of the panels, showing the real and imaginary parts for an incidence angle of 60°, frequency 2550 Hz. Partitioning of the surface panels into 80 clusters of approximately 50 surface panels per cluster. Cluster basis functions of up to quadratic degree.
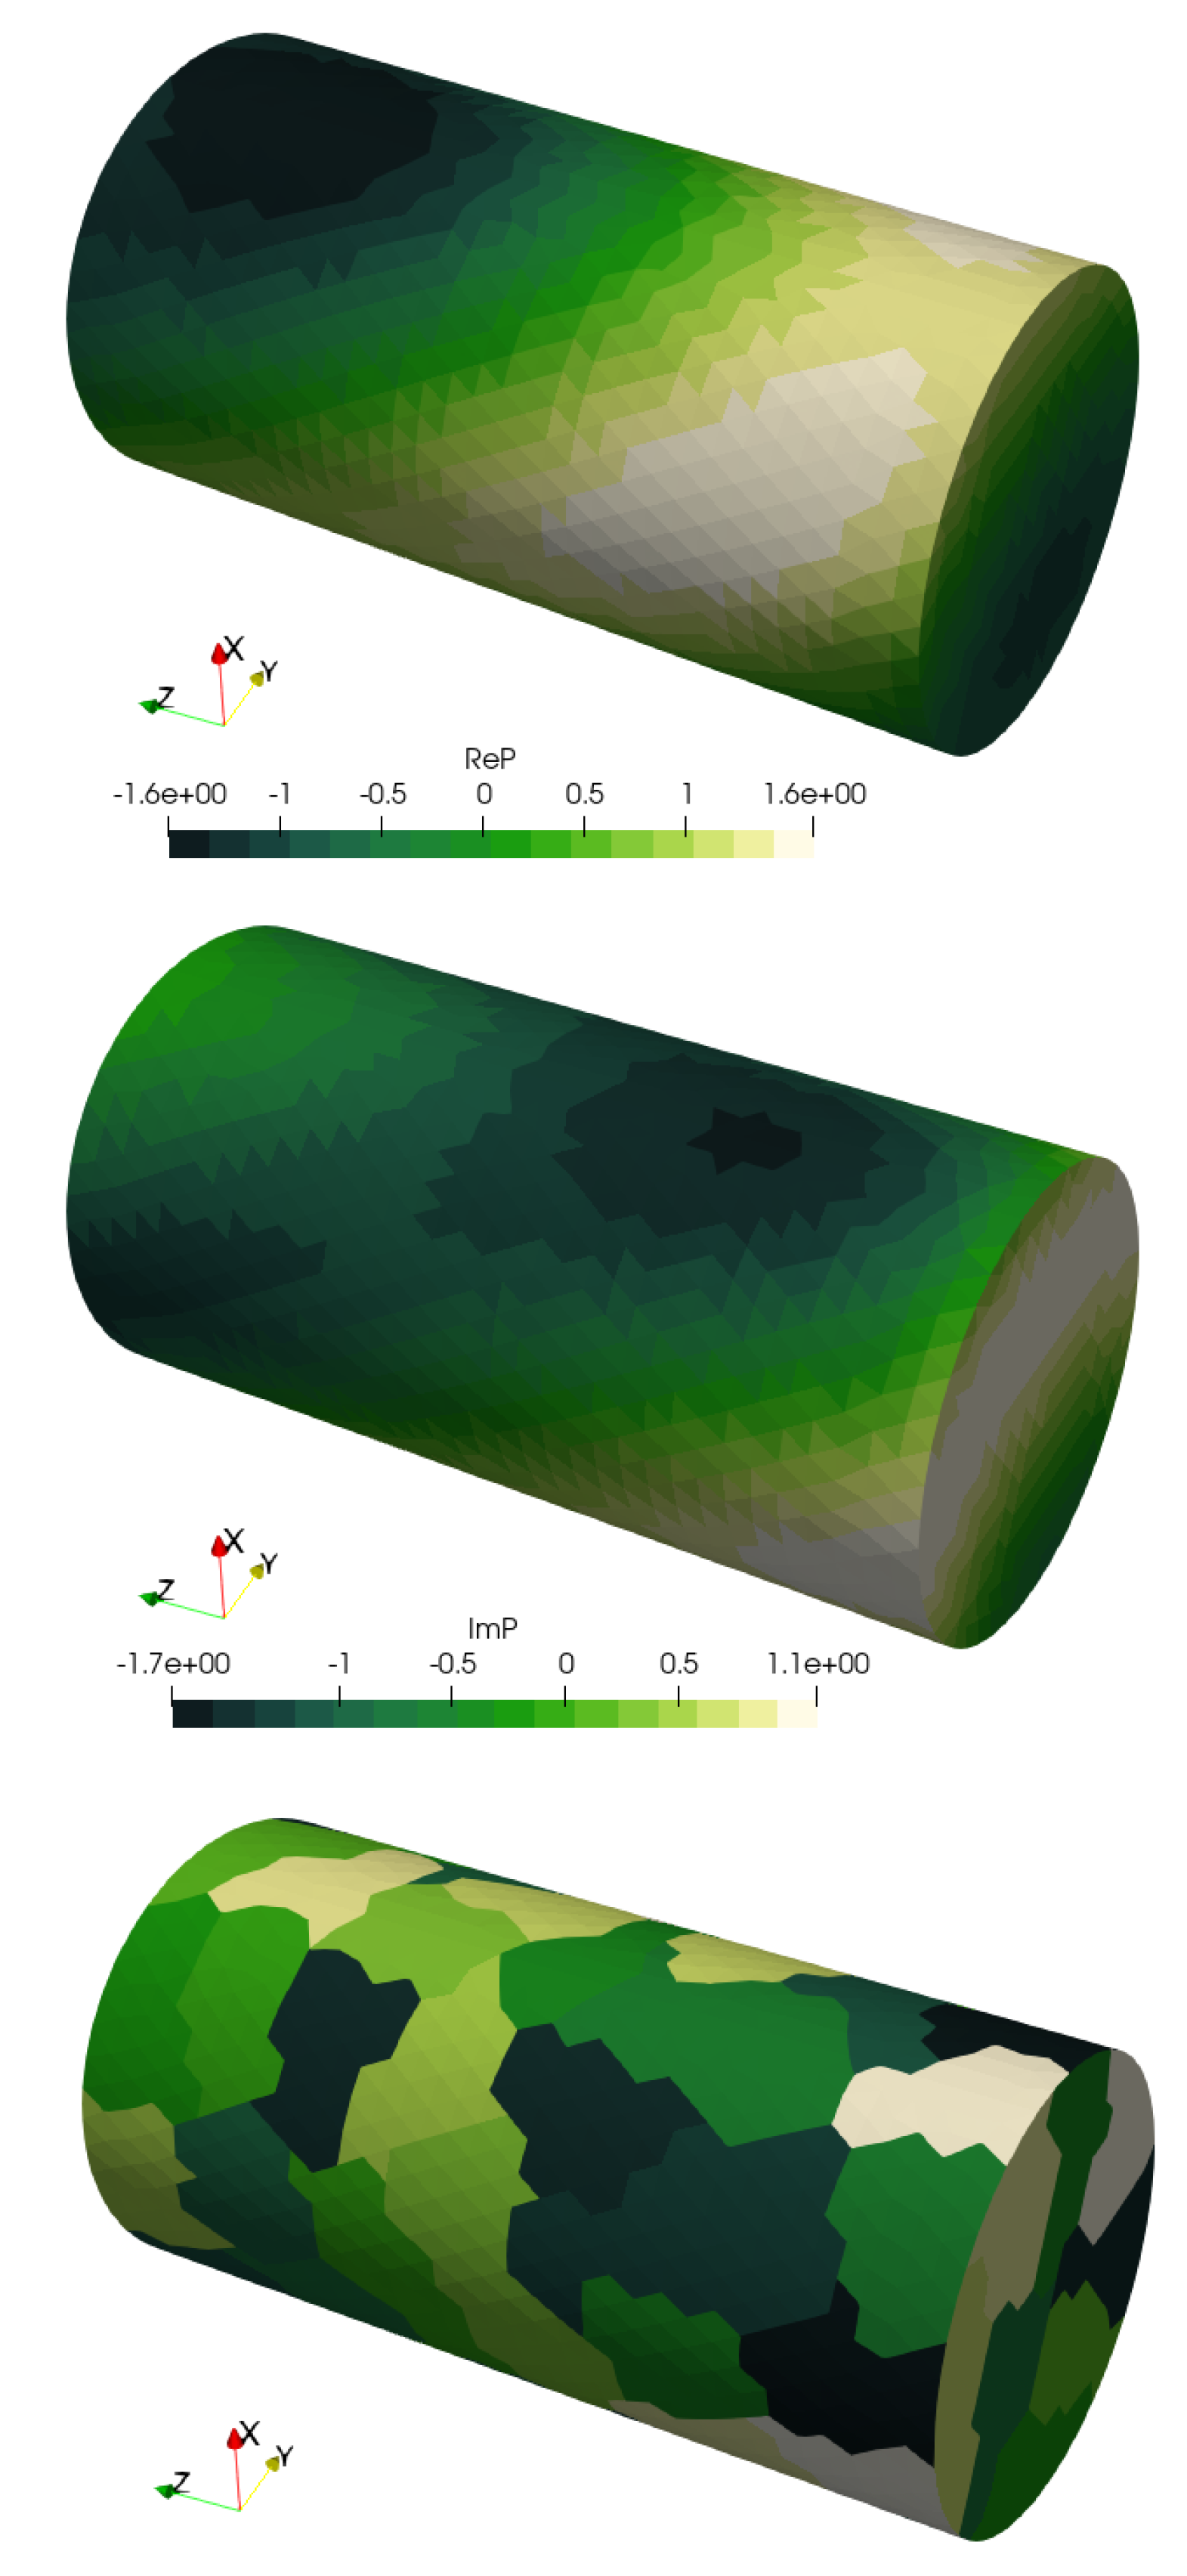
Figure 2.
Cluster of surface panels on a cylinder.
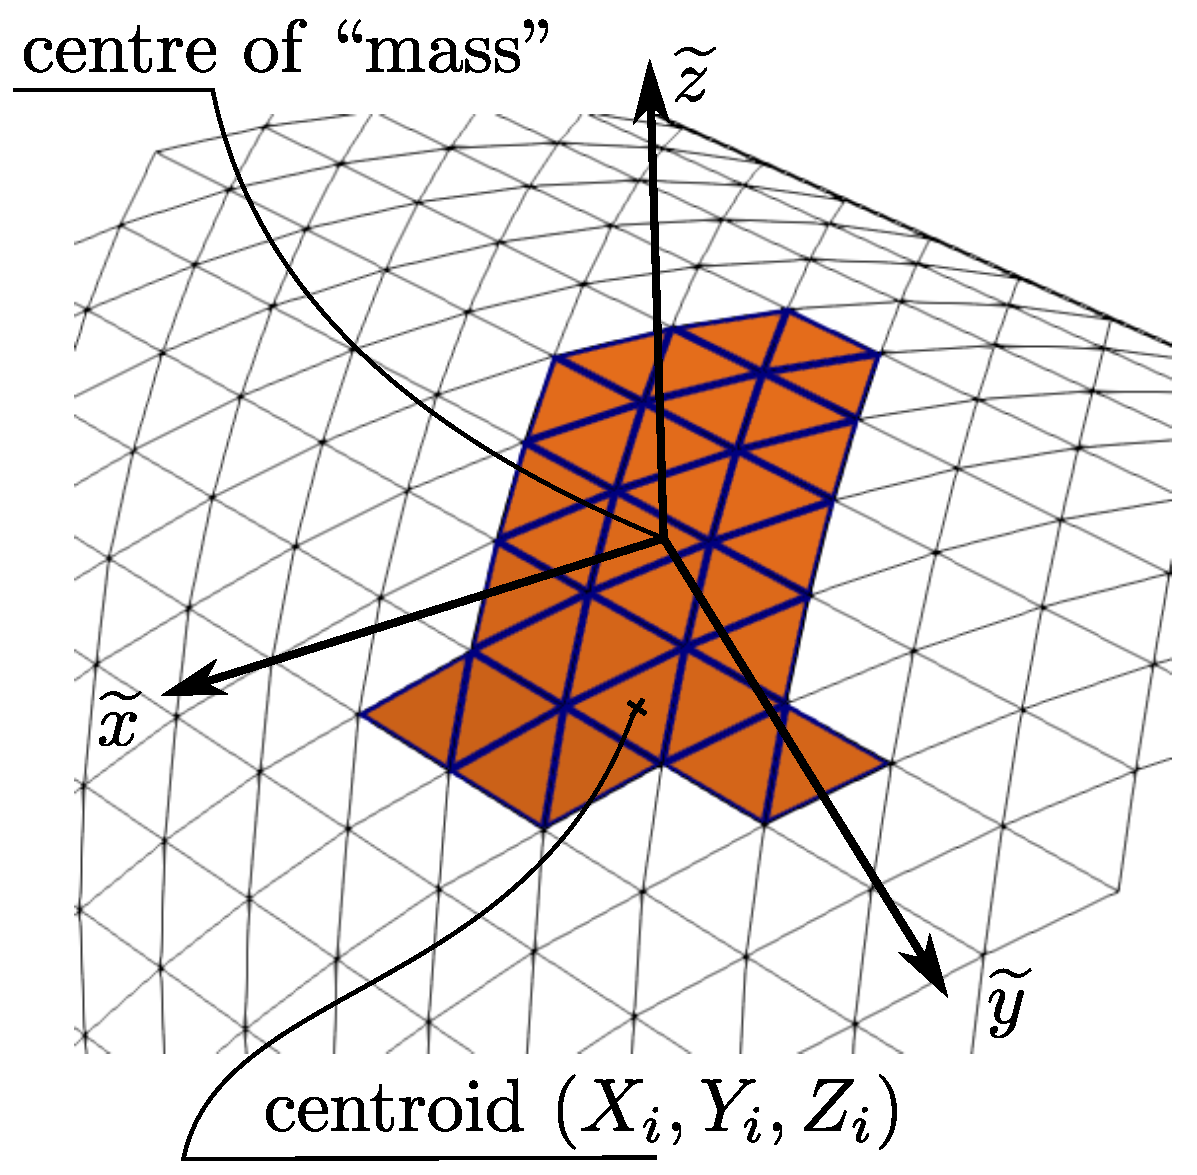
Figure 3.
Mesh of a solid steel sphere of radius 0.5 m, showing partitioning into clusters of panels. (Left): clusters of 200 triangles each. (Right): clusters of 50 triangles each.
Figure 3.
Mesh of a solid steel sphere of radius 0.5 m, showing partitioning into clusters of panels. (Left): clusters of 200 triangles each. (Right): clusters of 50 triangles each.
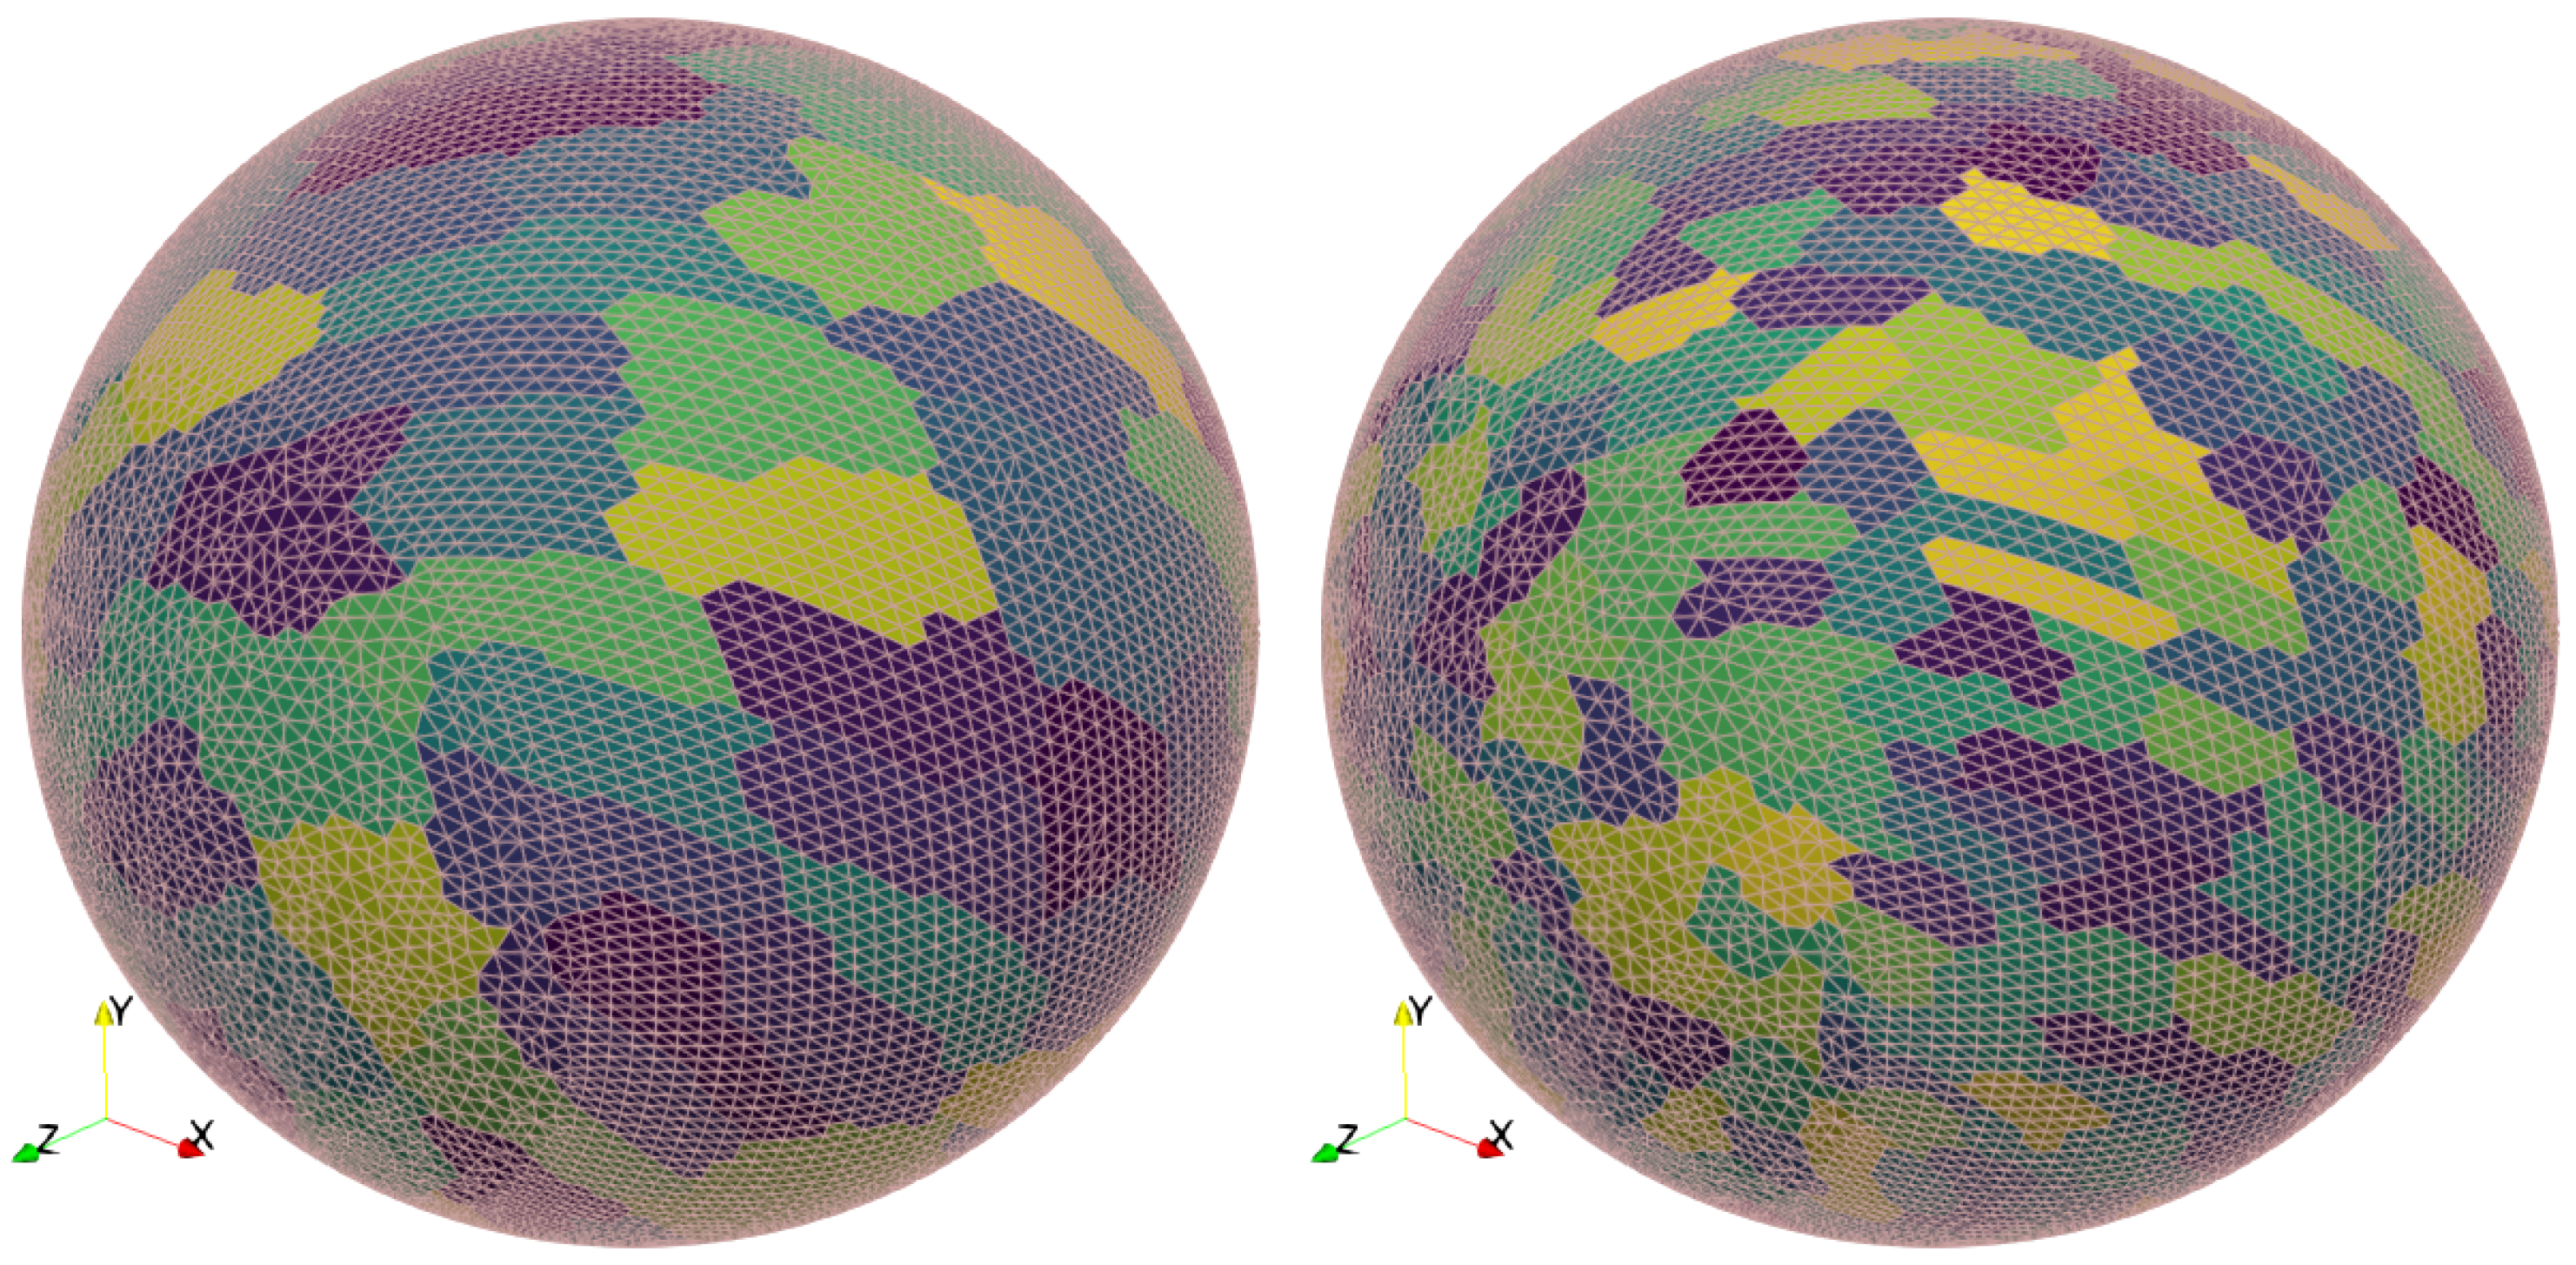
Figure 4.
The backscattering amplitude as a function of frequency for a solid steel sphere of radius 0.5 m. The solid black line represents the partial wave solution [27] and the markers represents the coupled finite- and boundary-element solution. The frequency step is 100 Hz. This is the original formulation based on Equation (19) using 800 modes.

Figure 5.
The backscattering amplitude as a function of frequency for a solid steel sphere of radius 0.5 m. The solid black line represents the partial wave solution [27], while the markers represents the coupled finite- and boundary-element solution. The frequency step was 50 Hz and modal reduction used 800 modes. The pressure reduction formulation was applied to both the boundary pressures and the interior multipliers (31). Clusters of 200 triangles, .
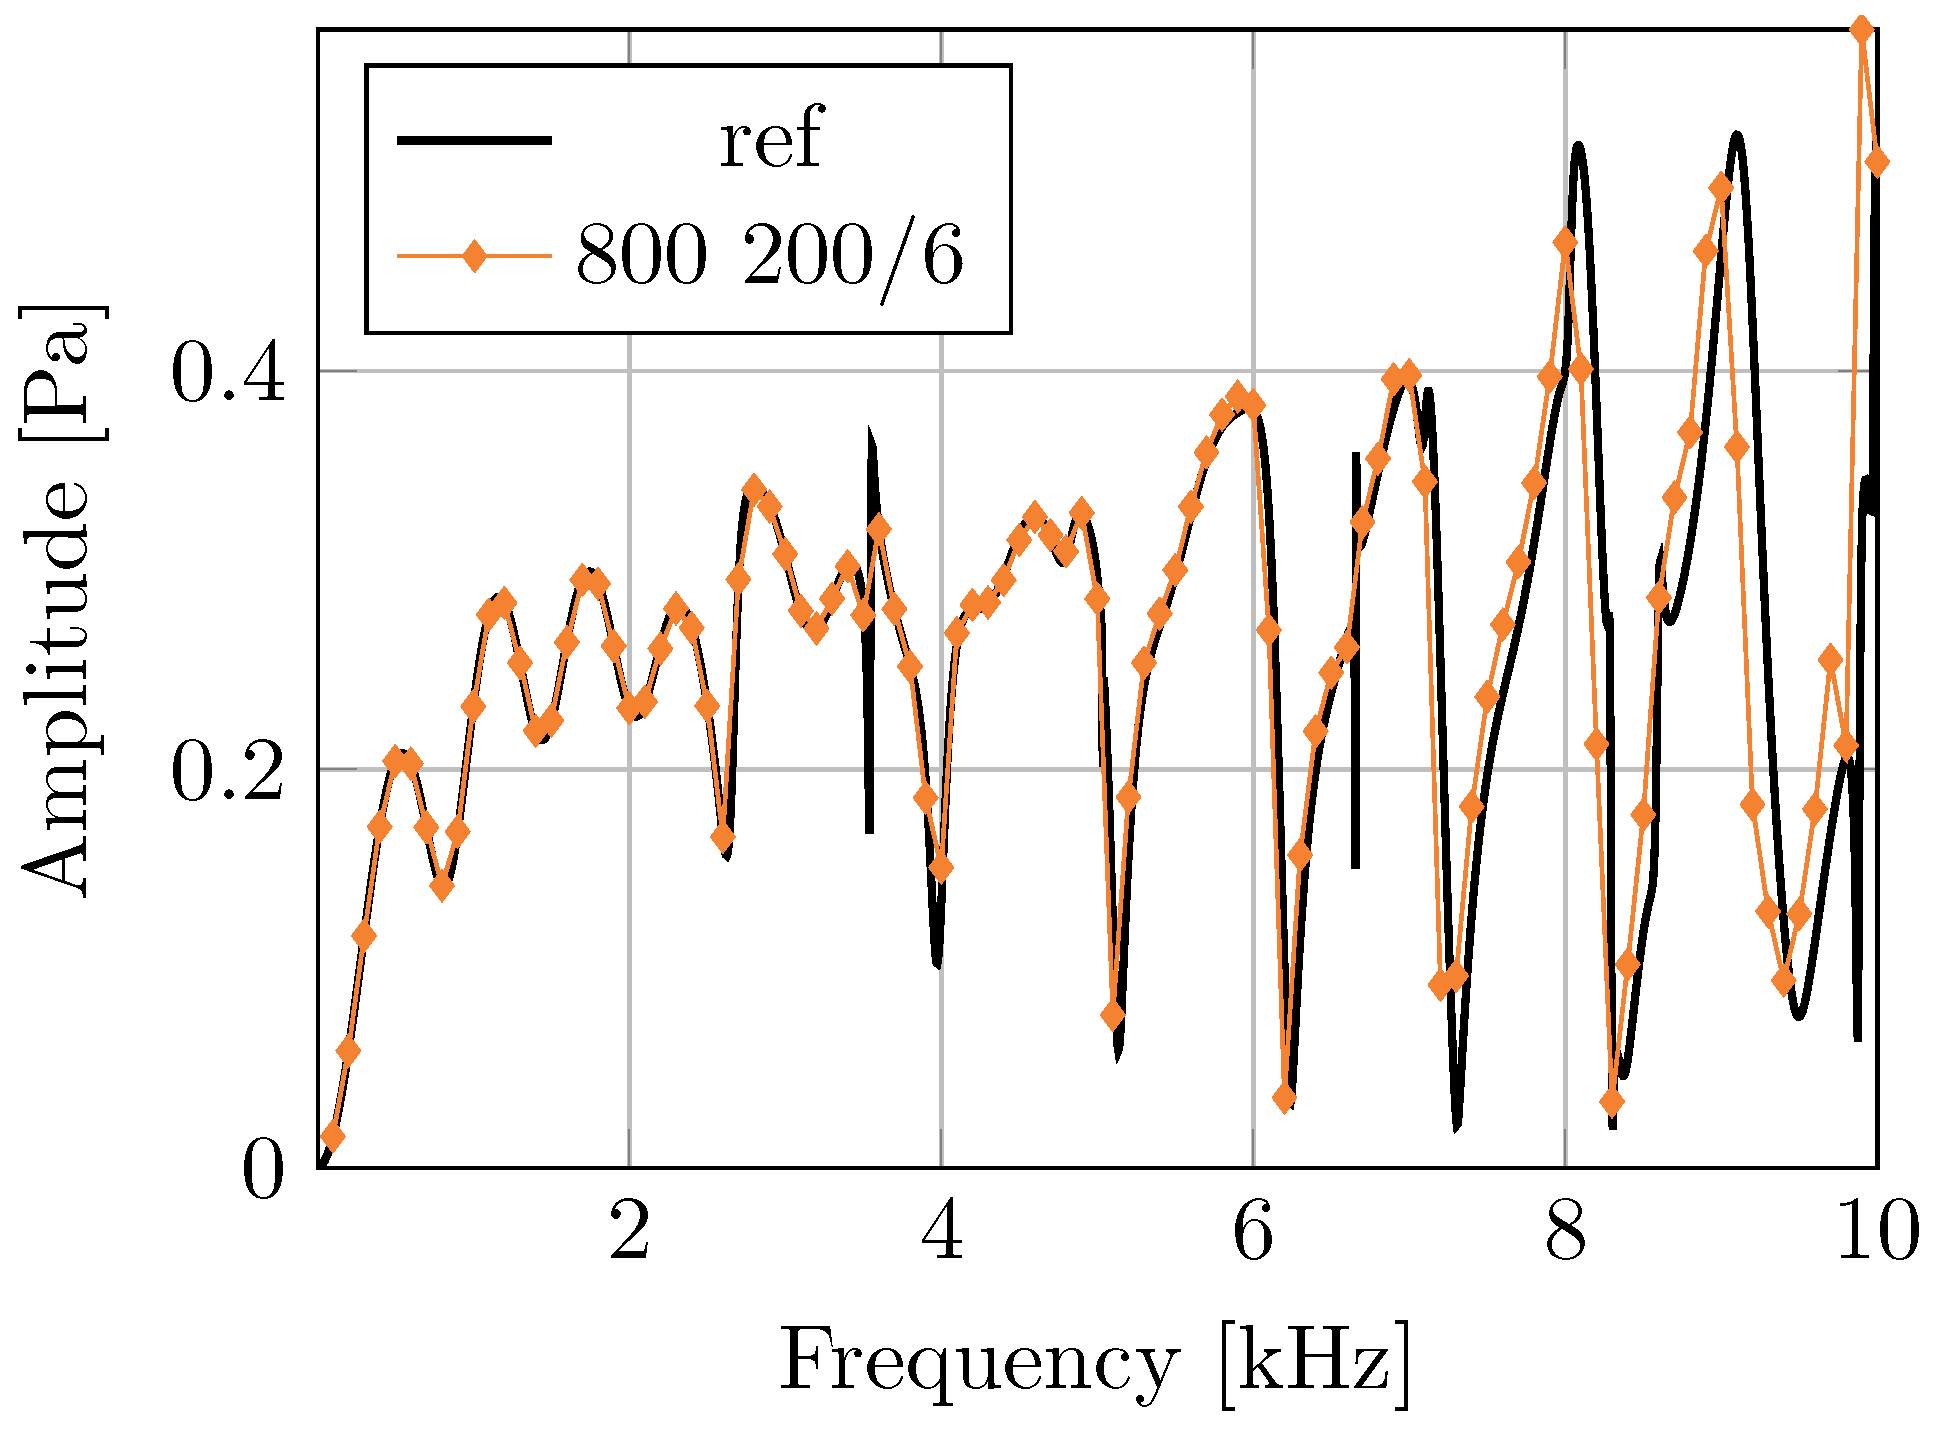
Figure 6.
The backscattering amplitude as a function of the frequency for a solid steel sphere of radius 0.5 m. The solid black line represents the partial wave solution [27], while the markers represent the coupled finite- and boundary-element solution. The frequency step was 100 Hz and modal reduction used 800 modes. The pressure reduction formulation was applied to both the boundary pressures and the interior multipliers (31). Clusters of 200 triangles, .

Figure 7.
The backscattering amplitude as a function of the frequency for a solid steel sphere of radius 0.5 m. The solid black line represents the partial wave solution [27], while the markers represent the coupled finite- and boundary-element solution. The frequency step was 100 Hz and modal reduction used 800 modes. The pressure reduction formulation was applied to both the boundary pressures and the interior multipliers (31). Clusters of 50 triangles, .

Figure 8.
The backscattering target strength in dB for a 1 foot × 2 feet aluminum cylinder in water as a function of aspect angle and frequency. Incidence angles of degrees and degrees correspond to backscattering from broadside and end-fire, respectively. The reference acoustic color obtained with an axially symmetric model is shown on the (left) and the present reduced model on the (right).
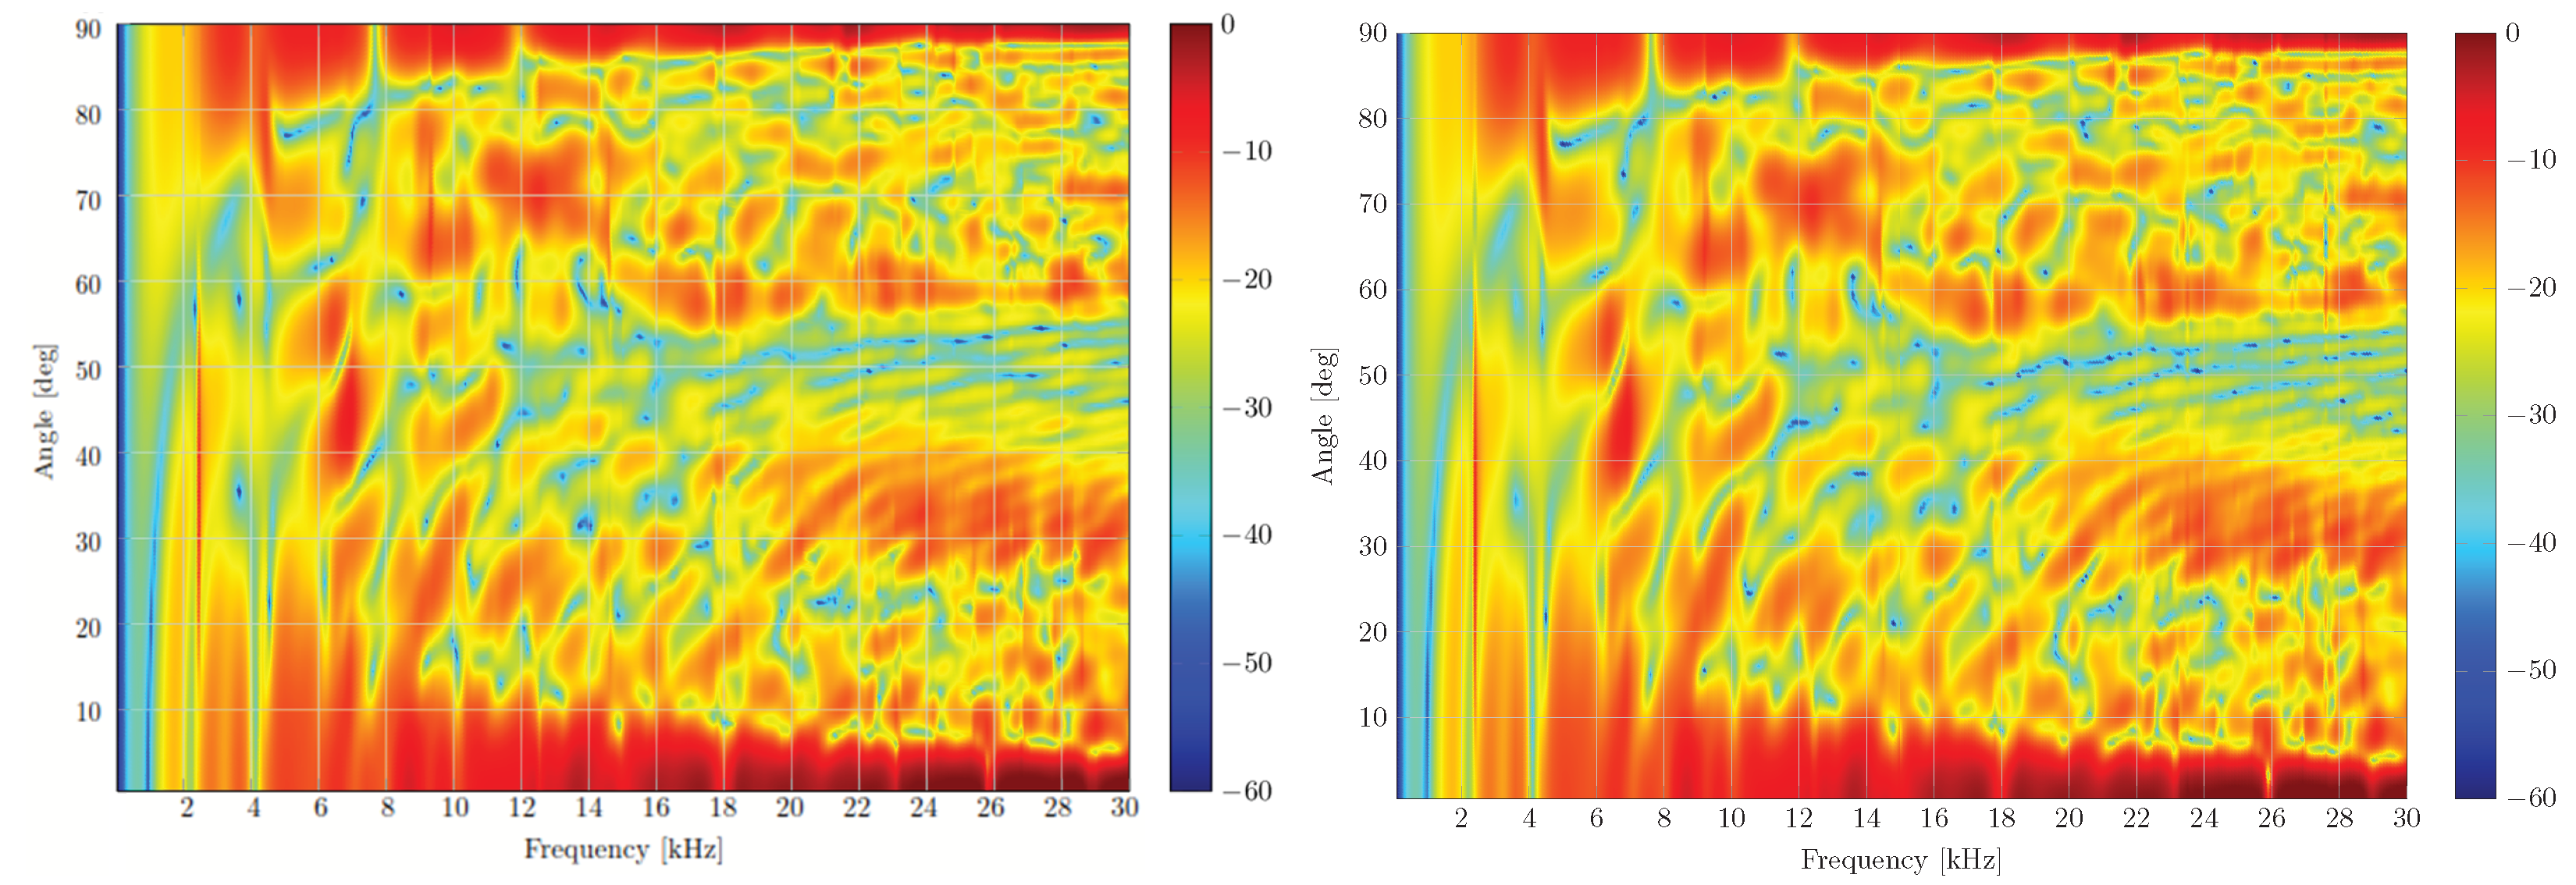
Figure 9.
The backscattering target strength in dB for a hollow spherical aluminum shell in water as a function of he frequency. The designation M/n stands for Model n.
Figure 9.
The backscattering target strength in dB for a hollow spherical aluminum shell in water as a function of he frequency. The designation M/n stands for Model n.

Table 1.
Construction of two-dimensional basis functions from the prototype 1D basis functions . In this particular case, is chosen; hence, there are basis functions . For instance, we could define , , , …, , or .
Table 1.
Construction of two-dimensional basis functions from the prototype 1D basis functions . In this particular case, is chosen; hence, there are basis functions . For instance, we could define , , , …, , or .
Table 2.
Acoustic backscattering from hollow spherical aluminum shell. The frequency range is expressed in Hz, where 1k means 1000 Hz, etc. The mean element size is in meters.
Table 2.
Acoustic backscattering from hollow spherical aluminum shell. The frequency range is expressed in Hz, where 1k means 1000 Hz, etc. The mean element size is in meters.
| Model | 1 | 2 | 3 | 4 | 5 |
|---|---|---|---|---|---|
| Frequency range | 50–2k | 2k–4k | 3k–6k | 6k–8k | 8k–10k |
| Mean elem. size | 0.02 | 0.015 | 0.01 | 0.01 | 0.009 |
| # modes | 200 | 500 | 600 | 700 | 800 |
| # panels | 19,068 | 33,542 | 75,458 | 75,458 | 92,504 |
| # clusters | 95 | 168 | 377 | 377 | 463 |
| # gen. surf. dofs | 1995 | 3528 | 7917 | 7917 | 9723 |
| # gen. int. dofs | 70 | 123 | 278 | 278 | 342 |
Disclaimer/Publisher’s Note: The statements, opinions and data contained in all publications are solely those of the individual author(s) and contributor(s) and not of MDPI and/or the editor(s). MDPI and/or the editor(s) disclaim responsibility for any injury to people or property resulting from any ideas, methods, instructions or products referred to in the content. |
© 2023 by the authors. Licensee MDPI, Basel, Switzerland. This article is an open access article distributed under the terms and conditions of the Creative Commons Attribution (CC BY) license (https://creativecommons.org/licenses/by/4.0/).
Share and Cite
MDPI and ACS Style
Krysl, P.; Abawi, A.T. Finite Element–Boundary Element Acoustic Backscattering with Model Reduction of Surface Pressure Based on Coherent Clusters. Acoustics 2023, 5, 1016-1035. https://doi.org/10.3390/acoustics5040058
AMA Style
Krysl P, Abawi AT. Finite Element–Boundary Element Acoustic Backscattering with Model Reduction of Surface Pressure Based on Coherent Clusters. Acoustics. 2023; 5(4):1016-1035. https://doi.org/10.3390/acoustics5040058
Chicago/Turabian StyleKrysl, Petr, and Ahmad T. Abawi. 2023. "Finite Element–Boundary Element Acoustic Backscattering with Model Reduction of Surface Pressure Based on Coherent Clusters" Acoustics 5, no. 4: 1016-1035. https://doi.org/10.3390/acoustics5040058