
A Novel Algorithm for Directional Scattering in Acoustic Ray Tracers

1
Division of Engineering Acoustics, Lund University, P.O. Box 118, 221 00 Lund, Sweden
2
E. Nilsson Akustik, Flygelvägen 275, 224 72 Lund, Sweden
*
Author to whom correspondence should be addressed.
Acoustics 2023, 5(4), 928-947; https://doi.org/10.3390/acoustics5040054
Submission received: 11 September 2023
/
Revised: 15 October 2023
/
Accepted: 19 October 2023
/
Published: 24 October 2023
Abstract
:It is vital to consider acoustic scattering when using geometrical acoustic simulation techniques, such as ray tracing. However, there are few methods for modelling scattering, and most rely on strong assumptions of uniformity on the distribution of scattered energy. In this paper, a model for directional scattering in ray tracers is presented. The model is based on an idealized model of a 1D scatterer, which is then used to extend the most commonly used scattering algorithm in ray tracers today. The developed algorithm is implemented in a ray tracer and tested to evaluate its performance compared to existing methods. It is found that the directional scattering algorithm can be used to replicate measured effects on room acoustic parameters caused by changes in the orientation of 1D scatterers.
1. Introduction
Geometrical acoustics is a class of commonly used methods for acoustic simulation [1,2,3,4] where a simplified model of sound propagation is used. One of the most popular models in geometrical acoustics is ray tracing, as it is fairly computationally efficient, accurate at high frequencies and relatively intuitive to implement and use. An important element of acoustic ray tracing is the incorporation of scattering, which has been shown to improve the accuracy of simulation software [5]. In this paper, a novel ray-tracing scattering algorithm is developed. It extends the most commonly used algorithm to account for directional variations in the scattering pattern.
Although there are several application of acoustic ray tracing, the ray tracer used in this project is developed specifically for room acoustic modelling. The desired accuracy of room acoustic modelling is limited by the limits of human perception. The ray tracer used in this project was developed in-house and models the sound field as energetic particles that travel along straight paths between the surfaces of an enclosure. The phase of the particles is not recorded, and their energy is assumed to be affected only by air attenuation and surface absorption at the reflections.
There are several possible definitions of acoustic scattering. In this project, the definition suggested by Morse and Ingaard [6] is used. Scattering is thus defined as the difference between the true reflection and the idealized plane wave reflection on an ideal surface. In the context of ray tracing, the ideal plane wave reflection is the mirror reflection of the acoustic ray [7]. The distribution of the scattered energy is most commonly modelled as diffuse, even in cases where the real distribution is expected to have significant directional components [3,8].
Models for surface scattering and in particular scattering due to diffraction represent a major research field within acoustics [9,10,11,12]. Several models for the scattering of acoustic energy have recently been presented for use in many different models [13,14,15,16,17]. In particular, methods to include scattering from diffraction have been introduced in multiple tools for geometric modelling [1,18,19]. The approach to scattering suggested in this paper is not limited to diffraction, and it is aimed at providing an approximate method comparable to the methods for uniform surface scattering that are frequently implemented in ray tracers today.
Structural elements that scatter acoustic energy predominantly in one direction may occur incidentally from construction elements such as battened ceilings or stairs but may also be installed with acoustic intent to redirect acoustic energy or create a more diffuse sound field [3,20]. These types of structures are referred to as 1D scatterers in this paper, and some examples are shown in Figure 1. In spaces with very localized absorption, for example, public spaces with ceiling absorbers, it has been shown that the orientation of 1D scatterers can have a significant impact on the acoustic environment [21,22]. This indicates that there is a need to model the directional variations of such structures.
In acoustic ray tracing, there are two traditional options to model 1D scatterers. Either they are modelled geometrically, preserving the directional variations, or they are modelled as flat surfaces with scattering coefficients. The flat-surface model with scattering coefficients is easy to adapt to different frequency ranges, but all directional variations are lost with the standard scattering algorithms. Using the geometric modelling strategy works well at high frequencies and can accurately replicate the directional variations but risks overestimating the scattering effects of the structure at low frequencies.
Sound waves interact with structural variations in different ways, depending on the relative size of the structural variations to the acoustic wavelength. When the wavelength of an impeding acoustic wave is much larger than the structural variations on a surface, acoustic energy is reflected with very little scattering. When the wavelengths are of approximately the same size as the surface structures, the reflected acoustic energy is affected by diffraction and temporal dispersion and thus scattered in a complicated pattern. For wavelengths much smaller than the surface variations, acoustic rays react more locally and are reflected in the surface segment they hit [23]. In room acoustic simulation, the modelled wavelength varies between about 3.5 m and 4 cm, and an appropriate spatial resolution for the geometric model accordingly varies between about 1 m and 1 cm. Generally, however, only one model of the geometry is developed and used for all wavelengths. If the model is detailed and the resolution high, it works well at high frequencies but may overestimate the scattering effects at low frequencies. If the model has low spatial resolution, it works better at low frequencies, and higher scattering parameters can be assigned to surfaces with structural variations smaller than the model resolution to compensate for the reduced resolution. Typically, only uniform scattering is modelled using the scattering parameters. In order to preserve possible directional variations in the simplified surfaces, a directional scattering algorithm would be useful.
It has been shown that the direction of scattering can affect room acoustic parameters in some cases [20,21,22]. In these papers, the orientation of 1D scatterers was found to have a perceivable effect on several room acoustic parameters. This indicates the need for an algorithm that can account for directional variations in acoustic scattering and does not rely on a high spatial resolution that may adversely affect the simulation performance at low frequencies or in terms of computational speed.
The algorithm introduced in this paper extends the commonly used uniform model of ray scattering by introducing a directional variation in the distribution of the scattered energy. It is capable of emulating the effects on room acoustic parameters caused by changes in the orientation of 1D scatterers and can easily be adjusted across the full frequency range.
2. A Directional Scattering Algorithm
In this section, a novel directional scattering algorithm for acoustic ray tracers is developed. An initial model is developed based on an idealized 1D scatterer and used to extend the most common scattering algorithm used in ray tracers today. Its implementation is described, and some comments are made regarding parameter selection.
2.1. Model for an Ideal 1D Scatterer
In order to determine a suitable scattering model for a 1D scatterer, an idealized version is considered. Consider a surface such as the one illustrated in Figure 2. A local orthonormal coordinate system is defined, such that the x-axis coincides with the surface normal and the y-axis falls along the direction of maximum scattering. For the scatterer shown in Figure 2, the y-axis is thus perpendicular to the periodic surface elements and the z-axis parallel to them. In the idealized case, the acoustic energy reflected from the surface is diffusely distributed along the y-axis, while the directional information is preserved along the z-axis. A sample from the resulting distribution of possible reflections for a single ray is shown in Figure 3 and Figure 4. The reflected energy is distributed in a semicircle, proportional to the cosine of the angle to the semicircle’s centre. All energy is reflected specularly in the z-dimension, thus preserving the directionality of the sound field in this dimension.
This model can be further understood by considering which information is preserved and which is destroyed in the reflection. The direction of a reflected ray is completely defined by two coordinates, for example, its azimuth and elevation on the unit sphere around the point of reflection. When the ray is reflected specularly, the two coordinates are completely determined by the direction of incidence and the normal. When the ray is reflected in a random direction, both coordinates are sampled from some random distribution. In the model defined above, one random number is generated to ensure that the energy is diffusely distributed on the semicircle, whereas the remaining coordinate is determined based on the direction of the incident ray. In this way, the ray can be said to be partially scattered.
The model formulated above can be used to define a method for ray reflection in an ideal 1D scatterer, but further development is necessary if the algorithm is to be useful for more realistic problems. In such cases, some acoustic energy may be reflected altogether specularly or scattered in all dimensions. For such surfaces, an extension of the most common scattering algorithm is suggested. The most common method for random scattering used in ray tracers today is an algorithm where there are two possible outcomes when a ray is reflected by a surface [3,7,23]. Either the ray is reflected specularly, in the mirror direction, or the ray is scattered and reflected in a random direction sampled from an ideally diffuse energy distribution. To account for directional scattering, a third option is introduced wherein the ray is reflected as in the case of an ideal 1D scatterer.
2.2. Implementation
In the case of uniform surface scattering, the scattering properties of the surface are described by a single frequency-dependent scattering coefficient, s. This value is used to randomly determine, for each incident ray, whether it is scattered or reflected specularly, and the coefficient corresponds to the ratio of incident energy that is reflected away from the specular direction [5,24].
In the proposed directional scattering algorithm, the surface is described by two scattering coefficients, , and a vector, , defining the direction of maximum scattering. In the idealized scatterer shown in Figure 2, corresponds to basis vector . The directional scattering coefficients define the ratio of acoustic energy that is reflected according to different distributions. defines the ratio of acoustic energy that is scattered. According to the definition used in this paper, this is all acoustic energy that is not reflected specularly. defines the ratio of acoustic energy that is reflected diffusely, or uniformly. If , there are no directional variations in reflected energy; all scattered energy is assumed to be diffusely distributed; and the directional scattering model coincides with the most common uniform scattering model. When , some energy that is not diffusely reflected is scattered. In the directional scattering model, this energy is assumed to be distributed according to the model presented for the ideal 1D scatterer above.
These coefficients are used similarly to the single scattering coefficient in the uniform scattering algorithm to determine the type of reflection each ray undergoes. Pseudo code is presented in Listing 1, where a local coordinate system is used, consistent with what was used in Section 2.1. This is performed without loss of generality.
| Listing 1. Pseudo code for the directional reflection algorithm. |
| // Generate a random value to determine if the ray is scattered float rnd=rand(0,1); if (rnd < s_d) { // Ray is diffusely reflected new_direction=generate_lambert(); } else if (rnd > s_s) { // Ray is not scattered new_direction=reflect(incident, surface_normal); } else { // Ray is partially scattered // Generate a random direction on a semi-circle new_direction=generate_cosine_circle(); // Determine the desired angle between the xy-plane // and the reflected ray float z_angle=rotation_angle(xy_plane, incident_local); // Calculate the new direction by rotation around the // y-axis new_direction=rotate(new_direction, z_angle, y_axis); } |
In the directional scattering algorithm, a random value is firstly generated from a uniform distribution. This is used to determine the fate of the ray. If , the ray is fully scattered, and the reflection direction is randomly sampled from a Lambertian 2D distribution. An example of ray directions generated from the Lambertian distribution is shown in Figure 5b.
If random value , the ray is specularly reflected in the surface normal. An example is shown in Figure 5a.
If the ray is neither diffusely nor specularly reflected, it is partially scattered according to the model presented above. The reflection direction is generated in two steps, one random step and one deterministic step. A direction on the semicircle is randomly sampled from a cosine distribution. An example of possible directions in this step is shown in Figure 3a. The direction generated in this way is then rotated about the y-axis to ensure that the directional information in the z-dimension is preserved (see Figure 4b). The angle of rotation is determined as the angle between the incident ray and the xy-plane, and the final direction is generated using Givens rotation [25].
Some samples of possible ray reflections are shown in Figure 5. The incident ray directions are sampled from a subset of a diffuse distribution. This should indicate how the directional characteristics of the incident and reflected sound fields depend on the scattering algorithm used. In Figure 5a, there is no scattering, and the rays are specularly reflected. In Figure 5b, a fully diffused reflection model is used, and all directional characteristics of the sound field are lost. In Figure 5c, standard uniform scattering is used, and the reflected rays are either mirror reflections or fully random diffuse reflections as determined by the scattering parameter (s). In the last three plots (Figure 5d–f), the directional scattering algorithm is used. It can be seen that the acoustic energy is more dispersed in the direction of scattering. In Figure 5e, it can be seen that most rays continue to travel in the negative z-direction, thus maintaining a flow of acoustic energy in that direction.
2.3. Directional Scattering Coefficients
A central aspect of implementing the directional scattering algorithm is to determine appropriate scattering coefficients , which in turn requires some more discussion on ray-tracing algorithms in general. According to the ray-tracing model, the ray after reflection is a sample from some more complex underlying distribution of acoustic energy after reflection. The sampling method and the model for the energy distribution are closely linked. Thus, the directional scattering algorithm developed in this paper defines a model for the distribution of acoustic energy after reflection. According to this model, the reflected energy consists of a superposition of a diffuse cloud, a disc or semicircle (as shown in Figure 3 and Figure 4) and the mirror reflection. Scattering parameters define the ratio of energy in each of these energy clouds. Before it can be determined which coefficients are realistic, it should be examined whether the overall model for the distribution of reflected energy is appropriate. This can be performed, for example, using numerical simulations of the wave equation or measurements of the full polar response from real 1D scatterers.
However, due to the similarity between the developed model and the widely used model for uniform scattering, it is possible to use experience with the latter to estimate which may be reasonable values for the scattering parameters. In the classical model, there is a single scattering parameter s. This scattering parameter s is similar to in the directional model in that it defines the ratio of energy that is diffusely reflected. It is also similar to in the directional model, as it defines the ratio of energy that is not reflected in the mirror direction, corresponding to the random-incidence scattering coefficient as described in the international standards [5,24]. While there are some table values for s, it is frequently estimated based on the surface properties and the size of surface irregularities [18,26].
For the purpose of simulation, it is suggested that scattering parameters are estimated similarly to how s would be estimated, based on the geometry of the surface. should be estimated by finding the direction of scattering (that is, the direction along which most acoustic energy is scattered) and then estimated along this direction based on the geometric variations found in that direction. should be estimated using the same rationale but along the direction perpendicular to the direction of scattering.
3. Materials and Methods
The directional scattering algorithm developed in this study was evaluated through comparison with measurements and commonly used simulation strategies.
3.1. Measurements
Measurements were taken from an earlier study, presented and analysed in [20,21,22,27]. For a comprehensive analysis of the measured impulse responses, the reader is referred to those papers. In this study, a subset of the measurements was used and is briefly introduced in this paper.
Impulse response measurements were carried out using the DIRAC system (DIRAC type 7841, v.6.0). The sound source used was a dodecahedral loudspeaker positioned 1.55 m from the floor emitting an exponential sweep. The receiver was placed 1.2 m from the floor. A total of two source positions and six listener positions were measured, as indicated in Figure 6a. During the measurements used in this project, an absorbent ceiling was mounted 2.7 m from the floor, and there was no furniture.
Measurements were performed using 1D scatterers mounted on two walls, oriented to scatter acoustic energy horizontally (as shown in Figure 6b) or vertically (as shown in Figure 6c). Measurements were carried out using 0, 4, 8, 12, 16, 20 or 24 scatterers, either all oriented horizontally or all oriented vertically. When 8 and 12 scatterers were used, two different placement patterns were used but no significant differences between the two patterns could be observed.
Room acoustic parameters were extracted from the impulse response measurements using MATLAB. The chosen parameters were reverberation time (), early decay time () and speech clarity (). While all tested room acoustic parameters were impacted by the orientation of the scatterers, the reverberation time () was used to evaluate the simulation results in most cases, spatially averaged in accordance with ISO standard 3382 [28].
3.2. Modelling the Scatterers in the Ray Tracer
A digital model of the measurement space was constructed and used for simulations. The base geometric model is shown in Figure 7a. The scatterers were modelled either using a geometric model (as shown in Figure 7b) or as flat surfaces with appropriate scattering and absorption coefficients.
Five sets of simulations were performed, with each modelling the scatterers in different ways. The different configurations are referred to as Geo, Absorption only, Uniform scattering, Directional scattering A and Directional scattering B. All configurations are more thoroughly described and motivated below. For each set of simulations, each measurement situation (in terms of scatterer position and orientation, and source and receiver positions) was simulated.
The Geo model is based on a geometric model for the scatterers, as shown in Figure 7b. This model is considered one of the baseline methods for modelling 1D scatterers, and the results from this model should be compared to the directional scattering model. The absorption coefficients for the scatterers were obtained from measurements, and the scattering coefficients (using the standard uniform scattering model) were estimated by what yielded accurate simulation results.
In the Absorption only model, the scatterers are modelled as flat surfaces with absorption coefficients based on measurements. Scattering coefficients are identical to those of the surrounding walls. This model is used to isolate the absorption effects introduced by the scatterers, so that the effects of scattering can be better identified and analysed.
The Uniform scattering configuration models the scatterers as flat surfaces with uniform scattering. The absorption coefficients are based on measurements, and the scattering coefficients are estimated based on rough measurements, as described below. This model is considered a second baseline method for modelling 1D scatterers, and the results should be thoroughly compared to measurements and the results from the directional scattering algorithm.
Directional scattering A and Directional scattering B implement the directional scattering algorithm presented in Section 2.2. The scatterers are modelled as flat surfaces with absorption coefficients based on measurements, a vector defining the direction of scattering and two separate scattering coefficients. The vector is vertical for the vertically oriented scatterers and horizontal for the horizontally oriented scatterers. The difference between configurations A and B lies in the scattering coefficients, which, in A, are estimated from measurements and, in B, are refined based on the results of simulations. A range of possible values should be examined to help determine an appropriate range of scattering coefficients for the directional algorithm.
3.3. Surface Absorption and Scattering Parameter Selection
Surface absorption and scattering parameters were obtained from table values, from measurements and by using an optimization algorithm. The floors and doors were found to have a low relative absorption area and to have a limited impact on the simulation result, and table values were used. The absorption properties of the scatterers were available from measurements [20], and the scattering parameters (in the Geo model) were estimated based on shape of the scatterers. The absorption and scattering parameters for the remaining surfaces, absorptive ceiling and walls, were estimated using an optimization procedure.
An iterative optimization method was used to simultaneously estimate the scattering and absorption parameters of the ceiling and the walls. A geometric strategy (Geo) was used to model the scatterers in this step. In order to ensure that the estimated parameters would work for different scatterer configurations, measurement setups using 0, 12 or 24 scatterers mounted horizontally or vertically were used. A least squares cost function was set up to calculate the error of the simulated reverberation time () compared to the measurements. An initial range of possible absorption and scattering values were estimated from table values and adjusted so that the configuration with minimal absorption resulted in an overestimation of the reverberation time and the maximal absorption resulted in an underestimation. The upper and lower bounds were used to define a grid in the parameter space over which the different scatterer configurations were simulated. After an initial set of simulations, the optimal setup was used as a basis for an additional step with a more refined grid. The resulting parameters are seen in Table 1 and Table 2, and some results of the optimization are shown in Section 4.2.
Finally, the scattering parameters used in the directional scattering models were determined. As the algorithm is new, there is no precedent on how the parameters should be estimated. In this paper, an approach is suggested where scattering parameter is assumed to be related to the scattering effects in the direction of most scattering, and is related to the amount of scattering in the direction perpendicular to this. With this interpretation, for the scatterers used in this project can be estimated by measuring the scattering effects on the horizontal plane about a horizontally oriented scatterer, and , from measurements on the vertical plane around the same scatterer.
Using this model, an initial guess was estimated from single-dimensional measurements of the diffusion characteristics of the scatterers. The measurements are shown in Figure 8. They were performed on a single scatterer with a surface area of cm2, and edge effects were expected to have a significant effect on the measurements.
Estimates of scattering parameters were obtained from the measured diffusion characteristics. The diffusion characteristics as shown in Figure 8 were estimated by measuring the reflected power in 5-degree intervals on the azimuth plane around the scatterers for both orientations. In addition, a flat board of the same dimensions was measured in the same way. A single-dimensional scattering coefficient was estimated from the measurements, based on the model presented in the standards [5,24]. The coefficients obtained this way overestimate the true scattering effects of the scatterers, as they also account for the edge effects. An attempt to correct for this was made by using the differences in the estimated coefficients. It was assumed that the flat board could accurately be modelled using the scattering coefficients used for the walls. The difference in the scattering coefficient between flat board and horizontally oriented scatterer was assumed to match the difference in scattering parameter between a flat wall and the scattering coefficient in the direction of scattering, . Scattering parameter , related to the direction parallel to the ridge of the scatterer, was estimated in the same way but using measurements from the vertical scatterer. The scattering parameters obtained in this way were used for the Directional scattering A simulation model. In addition, the average between and was used to approximate the scattering parameters in the Uniform model.
As previously noted, there is no precedent for the estimation method or interpretation of the scattering parameters used in the directional scattering model. Initial simulations indicated that the differences between and needed to be quite large to cause a noticeable effect due to the orientation of the scatterers, significantly larger than what was found for Directional scattering A. In the Directional scattering B model, the scattering parameters were determined by what yielded a reasonable simulation result.
4. Results
4.1. Measurements
The measurements used in this study, as described in Section 3.1, are a subset of a larger set of measurements described in detail in [20,21,22,27]. Only the subset used in this study is shown here and only briefly discussed.
The plotted results, in Figure 9, indicate that the number of scatterers and their orientation had a significant impact on the reverberation time (). In Figure 9a, the average measured reverberation time using no scatterers, and 24 horizontal and 24 vertical scatterers is shown. In Figure 9b, the reverberation time at 1000 Hz is shown for an increasing number of scatterers. It is clear that the introduction of scatterers led to a reduced reverberation time (which is consistent with previous research [7,29,30]) and that the reverberation time was further decreased when more scatterers were added.
In this project, the orientation of scatterers is of particular interest. Based on the results in Figure 9a, the orientation had a measurable impact on the reverberation time at high frequencies but not at 500 Hz or below. Below 500 Hz, the wavelengths were large (about 70 cm and above), and the scatterers were not large enough to be expected to have a significant scattering effect on the sound field. The reverberation time reduction was instead due to the resonance absorption of the scatterers, which does not depend on their orientation. At 1000 Hz and above, there was very little absorption by the scatterers, but the acoustic energy was expected to be redirected by the scatterers to a high degree. The difference observed between horizontally and vertically oriented scatterers was because the vertically oriented scatterers redirected the acoustic energy towards the ceiling absorbers more efficiently.
4.2. Optimization Results
As mentioned in Section 3.3, an optimization method was used to obtain simulation parameters that produced simulation results in accordance with measurements. Although this is a good method to find parameter values that produce accurate simulation results, it is possible that the found parameter values are not accurate in relation to the actual surface properties. In this section, the results of the optimization procedure are briefly discussed, focusing on possible errors and how these may later affect the simulation results.
Some results of the optimization step are shown in Figure 10. As indicated in the graphs, the average simulated reverberation time is close to the measurements and mostly within 1 JND across all frequency bands, indicating that the determined parameters adequately simulate the average late decay in the space across all scatterer configurations.
At low frequencies, there are typically some resonance effects in rectangular spaces such as the one studied in this project. This can lead to spatial variations in the sound field that cannot be modelled using ray tracers, as they typically do not model phase effects. In this case, the least squares cost function used for optimization is likely to push the simulation results in each position towards the measured spatial average. Although this may be appropriate due to the limitations of ray tracers, it may also lead to a more homogeneous sound field in the simulation. In terms of parameter values, it is then likely that the estimated absorption parameters vary less in space and scattering parameters are overestimated. If such errors are made, it is likely that the simulations underestimate the effects of the orientation of the scatterers. Since this issue occurs primarily at low frequencies, where no effects could be measured due to the orientation of the scatterers, it is not expected to lead to any major problems.
Revising the estimated absorption parameters (see Table 1) shows that the ceiling absorption parameter is much smaller than what is typically reported as table values for this type of ceiling. This is not necessarily an optimization error. Table values for absorption parameters are typically measured at random incidence. In a rectangular space with an absorptive ceiling, acoustic energy does not follow a random-incidence distribution towards the ceiling over time. Over time, mostly sound energy flowing in a direction parallel or approximately parallel to the ceiling remains [31]. Due to the direction of propagation of this acoustic energy, it impacts the ceiling at a large angle and is absorbed at a lesser degree than what is measured at random incidence. This leads to a practical absorption coefficient that is significantly smaller than table values. When scatterers are included, the apparent absorption of the ceiling is higher. It is, therefore, important that such cases are included in the optimization step.
4.3. Simulation Results
The measurements were compared to the simulation results from the five scattering models described in Section 3.2. In Figure 11, the averaged reverberation time for simulations and measurements using 12 horizontally (Figure 11a) and 12 vertically (Figure 11b) oriented scatterers are shown. As expected, the different simulation setups performed differently. In particular, the Geo model matches the simulation results better than the others. This was expected, since it was used for parameter optimization.
At the frequencies of 125 Hz and 250 Hz, there were no significant differences among the simulation methods for either of the configurations. This supports the earlier conclusion that absorption is dominant at these frequencies, particularly since the Absorption only strategy performed on par with the other models. At higher frequencies, there were some differences among the simulation strategies. The Absorption only model overestimated the reverberation time for both vertical and horizontal scatterers, due to the lack of scattering.
In Table 3, estimates of the average error in , and are shown for each of the simulation procedures across all positions, frequency bands and scatterer configurations. The error is estimated as the square root of the average squared error, for all positions, scatterer configurations and frequency bands. The differences between the different simulation strategies are small in and and should not be used to make definitive statements.
In general, the Geo simulation strategy worked best. This was to be expected, as it was used for parameter optimization. For reverberation time and , the directional scattering models are better than the uniform models. In particular, Directional scattering B with the adjusted scattering parameters performed well in reverberation time. While the parameter adjustments are expected to lead to a better adherence between simulation and measurements, the fact that the directional scattering algorithm can be used to achieve significant improvement compared with the uniform scattering algorithm is very promising. It may also indicate that larger scattering parameters should be used to achieve good modelling performance when the directional scattering algorithm is used.
does not follow the same pattern as the reverberation time or speech clarity. In this case, the models with the lowest practical scattering seemed to work best, namely, the Absorption only model and the Directional scattering A model. is closely related to early reflections, and in real spaces, early reflections can be quite well defined and can often be well modelled using image source methods, without any scattering at all. The results found in this work may indicate that early reflections and the very early parts of the impulse response are better modelled without scattering. However, the variations depending on the method are very small, and no significant conclusions should be drawn from this result.
The results presented graphically were all spatially averaged, which is useful for giving a good overview of the overall tendencies in the results. In this project, the spatial variations were found to be independent of the modelling strategy used for the scatterers, and these results are consequently not explicitly presented. They are, however, included in the error estimates presented in Table 3.
Finally, the differences in reverberation time caused by the orientation of the scatterers are examined in more detail. In Figure 12, the reverberation time with 24 horizontally or vertically oriented scatterers is shown for each simulation method and compared to measurements (shaded). In these results, it is clear that the differences that can be noted in measurements are not present in the non-directional algorithms. The Absorption only model clearly overestimated the reverberation time compared with measurements due to its lack of scattering. The Uniform scattering algorithm estimated the results with horizontally oriented scatterers fairly well but had too little scattering in the case with vertically oriented scatterers.
For the three configurations that can emulate the directionality of the scatterers, the effects of scatterer orientation could be seen in all cases. The Geo configuration performed well but slightly overestimated the reverberation time for the horizontally oriented scatterers. It is possible that this occurred due to edge effects from the mounting of the scatterers affecting the measurements. When the scatterers are mounted to redirect acoustic energy horizontally, the top and bottom edges (as seen in Figure 6b) are visible and may cause increased scattering in the vertical direction. When they are instead mounted vertically, those edges are mostly covered by other scatterers and do not contribute to scattering. This could lead to a difference in which scattering parameters are suitable for the scatterers depending on their orientation. Such an adjustment was not performed in this case, and it is possible that the scattering parameter was underestimated for horizontally oriented scatterers, leading to an overestimation of the reverberation time.
In the Directional scattering A strategy (Figure 12d), there was too little scattering overall. This is consistent with results presented earlier. It indicates that the method used for estimating the scattering parameters was not appropriate for the directional scattering algorithm. Directional scattering B (Figure 12e) showed similar problems but was overall much closer to the measured results. It is likely that further refinement or the use of an optimization strategy would further improve the adherence between simulation and measurements. However, this should be undertaken with care, as the quality of the scattering parameters is very difficult to evaluate without more research.
In Figure 12f, the differences between the vertical and horizontal scatterer orientation are presented and compared to the JND of measurements. It is expected that differences exceeding 1 JND correspond to an audible change in the sound environment of the space. The Geometric modelling method overestimated the differences between the vertical and horizontal orientations above 500 Hz. At higher frequencies, this might be explained by an underestimation of the scattering effects due to the horizontally oriented scatterers as discussed above. At 500 Hz, it is possible that this is explained by the resolution of the model leading to a larger impact of the scatterer orientation (see discussion in Section 1). However, such issues are not seen at lower frequencies, where the errors are expected to be more influential.
The scattering coefficients based on measurements did provide some difference between the two orientations, but it was comparatively small and not convincingly above 1 JND until 4000 Hz. Configuration B, where the scattering coefficients were adjusted, performed significantly better. In terms of algorithm performance, the differences that can be achieved using the directional algorithm are comparable to the differences seen using a geometric modelling procedure. This indicates that the algorithm can be useful as an alternative where geometric modelling is impractical or impossible due to exceedingly complex surfaces or issues in finding an appropriate spatial resolution.
5. Discussion
In this study, a directional scattering algorithm for use in acoustic ray tracers is developed. The underlying model is presented, and the implementation is discussed. The algorithm is then used to simulate measurements where the effects of directional scattering are present. It was indicated that the developed algorithm was capable of replicating the measured differences for different orientations of 1D scatterers.
The scatterers used for measurements were found to have significant absorption at low frequencies. As such, the amount of energy reflected from the scatterers in this frequency range is small, and its distribution has a limited impact on the sound field. Since the effects of the distribution of reflected energy cannot be properly measured, it is not possible to evaluate the accuracy of the directional scattering algorithm in this case. Since it is theorized that the directional scattering algorithm may be preferable to geometric modelling of scatterers at low frequencies, further research using scatterers with less low-frequency absorption is needed.
As previously indicated, further investigation is needed to determine appropriate parameter ranges for the directional scattering algorithm. It is possible that experience with the scattering coefficient defined in the international standard could serve as an indication, but the results in this paper indicate that larger values may be appropriate for the directional scattering algorithm. The standard scattering coefficient can be interpreted as a measure of how much directional information is lost in reflection. In the directional scattering algorithm, this is not a valid interpretation of the scattering parameters. The larger scattering parameter, , defines the amount of energy that is partially scattered, but some directional information is preserved for this energy. It is thus possible that it should be higher than the standard scattering coefficient to achieve the same amount of disorder after reflection. Similarly, the parameter does not account for all lost information in the reflection. It is thus possible that it should be smaller than the standard scattering coefficient.
In the future, the reflection and scattering patterns as produced by the directional scattering algorithm should be revised further and compared to measurements or full numerical simulations. This is expected to offer insight into deficiencies and advantages of the model and be useful in terms of determining which scattering parameters may be appropriate.
6. Conclusions
The suggested algorithm for directional scattering in acoustic ray tracers is capable of replicating measured variations in RA parameters, as caused by changes in the orientation of 1D scatterers in a room with absorbent ceiling. This could be used for modelling such structures in the future. Further research is needed to evaluate how the method compares to geometric modelling at low frequencies and to determine suitable scattering parameters.
Author Contributions
Conceptualization, H.A. and E.N.; methodology, H.A.; software, H.A.; validation, H.A.; formal analysis, H.A.; investigation, H.A.; writing—original draft preparation, H.A.; writing—review and editing, E.N.; supervision, E.N. All authors have read and agreed to the published version of the manuscript.
Funding
This research was funded by the Swedish Research Council, grant number 2016-01784. The APC was funded in part by Lund University.
Data Availability Statement
Restrictions apply to the availability of these data. Simulation results and code are available from the authors. Measurement data have been published elsewhere (see references) and may be requested from the authors of those publications.
Acknowledgments
Susanne Heyden for supervision and support Emma Arvidsson for measurements.
Conflicts of Interest
The authors declare no conflict of interest. The funders had no role in the design of the study; in the collection, analyses, or interpretation of data; in the writing of the manuscript; or in the decision to publish the results.
References
- Savioja, L.; Svensson, P. Overview of geometrical room acoustic modeling techniques. J. Acoust. Soc. Am. 2015, 138, 708–730. [Google Scholar] [CrossRef] [PubMed]
- Vorländer, M. Auralization. Fundamentals of Acoustics, Modelling, Simulation, Algorithms and Acoustic Virtual Reality; Springer: Berlin/Heidelberg, Germany, 2008; pp. 1–335. [Google Scholar] [CrossRef]
- Cox, T.J.; D’Antonio, P. Acoustic Absorbers and Diffusers, 3rd ed.; Taylor & Francis Group: Boca Raton, FL, USA, 2017. [Google Scholar]
- Kuttruff, H. Room Acoustics, 5th ed.; CRC Press: Boca Raton, FL, USA, 2009. [Google Scholar]
- Cox, T.J.; Dalenback, B.I.; D’Antonio, P.; Embrechts, J.J.; Jeon, J.Y.; Mommertz, E.; Vorländer, M. A tutorial on scattering and diffusion coefficients for room acoustic surfaces. Acta Acust. United Acust. 2006, 92, 1–15. [Google Scholar]
- Morse, P.M.; Ingard, K.U. Theoretical Acoustics; McGraw-Hill Book Company: New York, NY, USA, 1968. [Google Scholar]
- Autio, H.; Vardaxis, N.G.; Bard Hagberg, D. The Influence of Different Scattering Algorithms on Room Acoustic Simulations in Rectangular Rooms. Buildings 2021, 11, 414. [Google Scholar] [CrossRef]
- Dalenbäck, B.I. Modeling 1D-Diffusers—The Missing Link. 2011. Available online: http://www.catt.se/Lambert-1D-CATT.pdf (accessed on 18 October 2023).
- Svensson, U.P.; Fred, R.I.; Vanderkooy, J. An analytic secondary source model of edge diffraction impulse responses. J. Acoust. Soc. Am. 1999, 106, 2331–2344. [Google Scholar] [CrossRef]
- Lu, B.; Darmon, M.; Potel, C.; Zernov, V. Models Comparison for the scattering of an acoustic wave on immersed targets. J. Phys. Conf. Ser. 2012, 353, 012009. [Google Scholar] [CrossRef]
- Lü, B.; Darmon, M.; Fradkin, L.; Potel, C. Numerical comparison of acoustic wedge models, with application to ultrasonic telemetry. Ultrasonics 2016, 65, 5–9. [Google Scholar] [CrossRef] [PubMed]
- Chehade, S.; Kamta Djakou, A.; Darmon, M.; Lebeau, G. The spectral functions method for acoustic wave diffraction by a stress-free wedge: Theory and validation. J. Comput. Phys. 2019, 377, 200–218. [Google Scholar] [CrossRef]
- Chen, L.; Zhang, Y.; Lian, H.; Atroshchenko, E.; Ding, C.; Bordas, S. Seamless integration of computer-aided geometric modeling and acoustic simulation: Isogeometric boundary element methods based on Catmull-Clark subdivision surfaces. Adv. Eng. Softw. 2020, 149, 102879. [Google Scholar] [CrossRef]
- Cheng, S.; Wang, F.; Li, P.W.; Qu, W. Singular boundary method for 2D and 3D acoustic design sensitivity analysisImage 1. Comput. Math. Appl. 2022, 119, 371–386. [Google Scholar] [CrossRef]
- Li, J.; Fu, Z.; Gu, Y.; Zhang, L. Rapid calculation of large-scale acoustic scattering from complex targets by a dual-level fast direct solver. Comput. Math. Appl. 2023, 130, 1–9. [Google Scholar] [CrossRef]
- Shaaban, A.M.; Anitescu, C.; Atroshchenko, E.; Rabczuk, T. 3D isogeometric boundary element analysis and structural shape optimization for Helmholtz acoustic scattering problems. Comput. Methods Appl. Mech. Eng. 2021, 384, 113950. [Google Scholar] [CrossRef]
- Wang, F.; Gu, Y.; Qu, W.; Zhang, C. Localized boundary knot method and its application to large-scale acoustic problems. Comput. Methods Appl. Mech. Eng. 2020, 361, 112729. [Google Scholar] [CrossRef]
- Odeon A/S. ODEON Room Acoustics Software—User’s Manual. 2020. Available online: https://odeon.dk/download/Version17/OdeonManual.pdf (accessed on 23 October 2023).
- Dalenbäck, B.I. CATT-Acoustic v9.1 Powered by TUCT v2. 2022. Available online: https://www.catt.se/ (accessed on 18 October 2023).
- Arvidsson, E.; Nilsson, E.; Hagberg, D.B.; Karlsson, O.J.I. The Effect on Room Acoustical Parameters Using a Combination of Absorbers and Diffusers—An Experimental Study in a Classroom. Acoustics 2020, 2, 505–523. [Google Scholar] [CrossRef]
- Arvidsson, E.; Nilsson, E.; Bard-Hagberg, D.; Karlsson, O.J.I. Subjective Experience of Speech Depending on the Acoustic Treatment in an Ordinary Room. Int. J. Environ. Res. Public Health 2021, 18, 12274. [Google Scholar] [CrossRef] [PubMed]
- Arvidsson, E.; Nilsson, E.; Bard Hagberg, D.; Karlsson, O.J.I. The Difference in Subjective Experience Related to Acoustic Treatments in an Ordinary Public Room: A Case Study. Acoustics 2021, 3, 442–461. [Google Scholar] [CrossRef]
- Kuttruff, H. Room Acoustics, 6th ed.; CRC Press: Boca Raton, FL, USA, 2017. [Google Scholar]
- ISO 17497-1:2004; Acoustics—Sound-Scattering Properties of Surfaces—Part 1: Measurement of the Random-Incidence Scattering Coefficient in a Reverberation Room. ISO: Geneva, Switzerland, 2004.
- Givens, W. Computation of plain unitary rotations transforming a general matrix to triangular form. J. Soc. Ind. Appl. Math. 1958, 6, 26–50. [Google Scholar] [CrossRef]
- Postma, B.N.J.; Katz, B.F.G. Creation and calibration method of acoustical models for historic virtual reality auralizations. Virtual Real. 2015, 19, 161–180. [Google Scholar] [CrossRef]
- Arvidsson, E.; Nilsson, E.; Bard Hagberg, D.; Karlsson, O.J.I. Quantification of the Absorption and Scattering Effects of Diffusers in a Room with Absorbent Ceiling. Buildings 2021, 11, 612. [Google Scholar] [CrossRef]
- ISO 3382-1:2009; Acoustics—Measurement of Room Acoustic Parameters—Part 1: Performance Spaces. ISO: Geneva, Switzerland, 2009.
- Schröder, D. Physically Based Real-Time Auralization of Interactive Virtual Environments. Ph.D. Thesis, Institute of Technical Acousitcs, Aachen, Germany, 2011. [Google Scholar]
- Zhu, X.; Kang, J.; Ma, H. The impact of surface scattering on reverberation time in differently shaped spaces. Appl. Sci. 2020, 10, 4880. [Google Scholar] [CrossRef]
- Nilsson, E.; Arvidsson, E. An Energy Model for the Calculation of Room Acoustic Parameters in Rectangular Rooms with Absorbent Ceilings. Appl. Sci. 2021, 11, 6607. [Google Scholar] [CrossRef]
Figure 1.
Examples of 1D scatterers. (a) One-dimensional acoustic diffuser. (Source: Musikproducer, CC BY-SA 4.0 https://creativecommons.org/licenses/by-sa/4.0 (accessed on 18 October 2023), via Wikimedia Commons). (b) Truss on church ceiling. (Source: Storye book, CC BY 4.0 https://creativecommons.org/licenses/by/4.0 (accessed on 18 October 2023), via Wikimedia Commons).
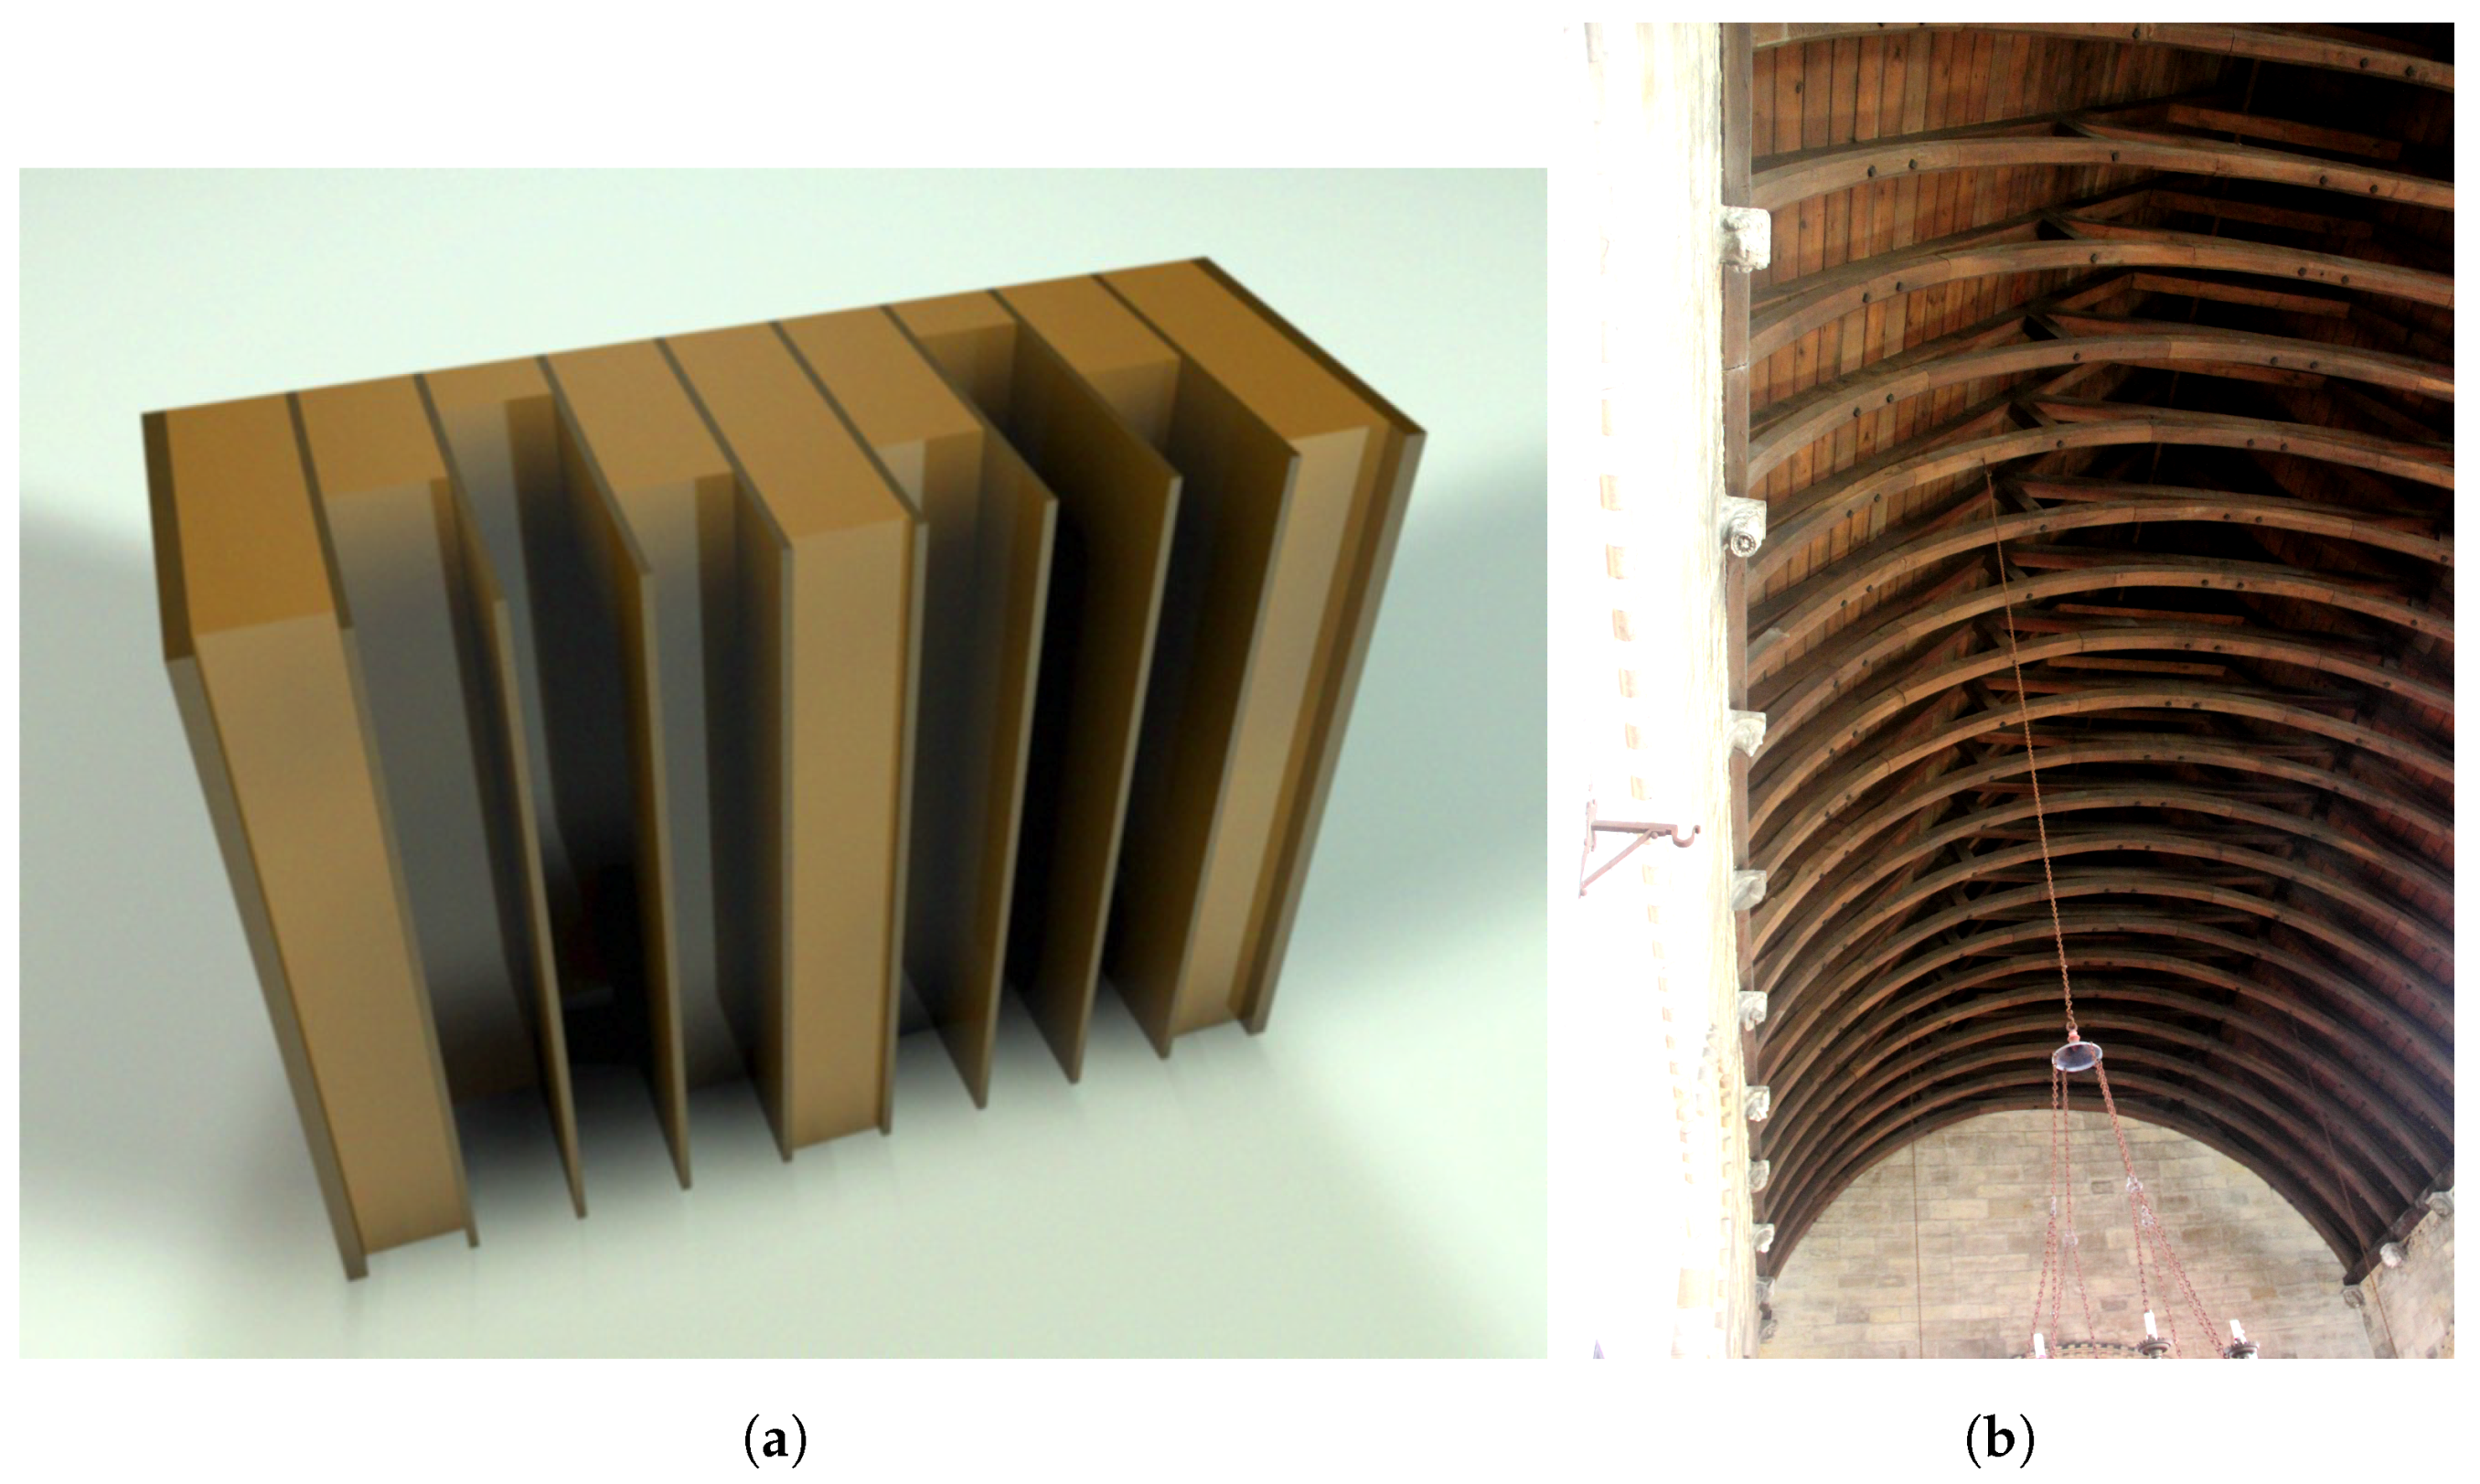
Figure 2.
Simplified illustration of a 1D scatterer. Acoustic energy is dispersed in the y-direction, but directional information is retained along the z-axis.
Figure 2.
Simplified illustration of a 1D scatterer. Acoustic energy is dispersed in the y-direction, but directional information is retained along the z-axis.
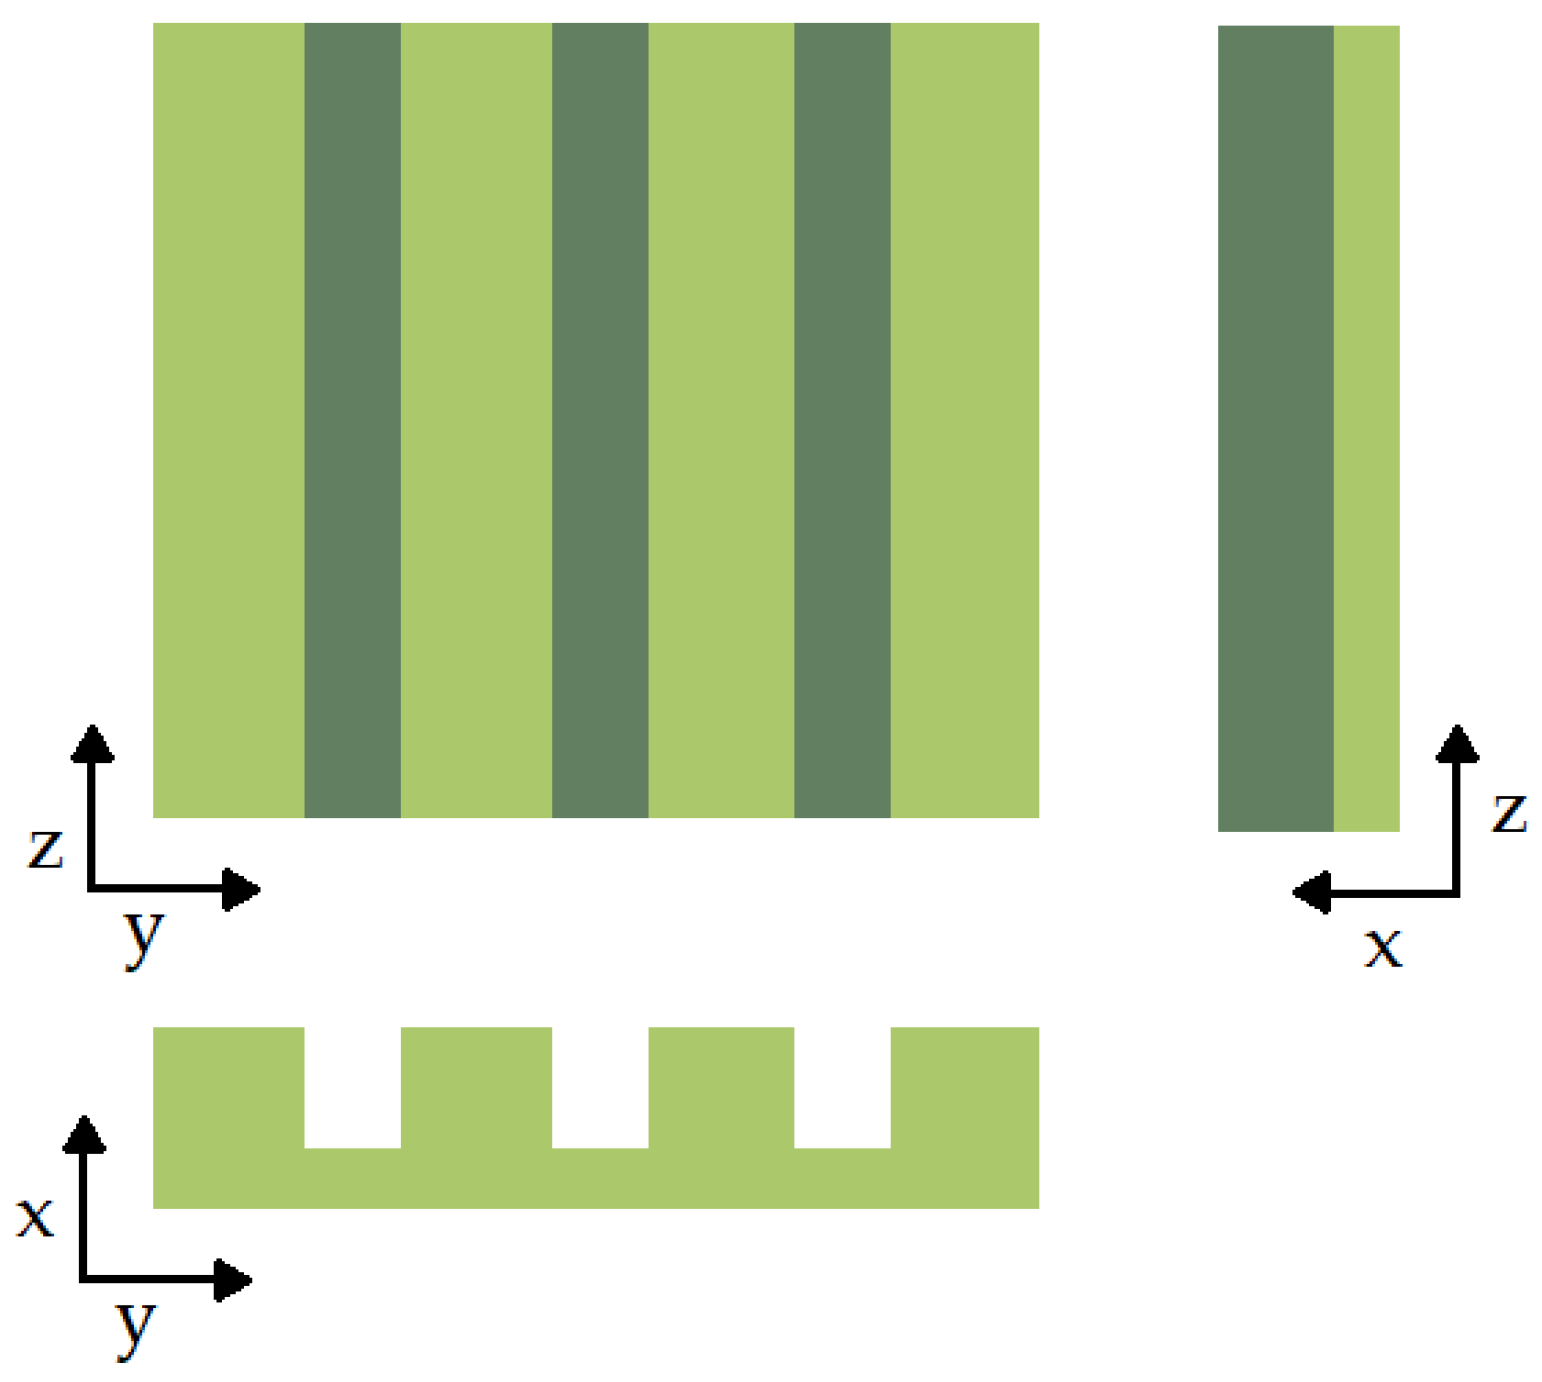
Figure 3.
Illustration of possible reflection directions for an idealized 1D scatterer for incident rays parallel (a) and perpendicular (b) to the direction of scattering. Insets illustrate the orientation of the scatterer.
Figure 3.
Illustration of possible reflection directions for an idealized 1D scatterer for incident rays parallel (a) and perpendicular (b) to the direction of scattering. Insets illustrate the orientation of the scatterer.
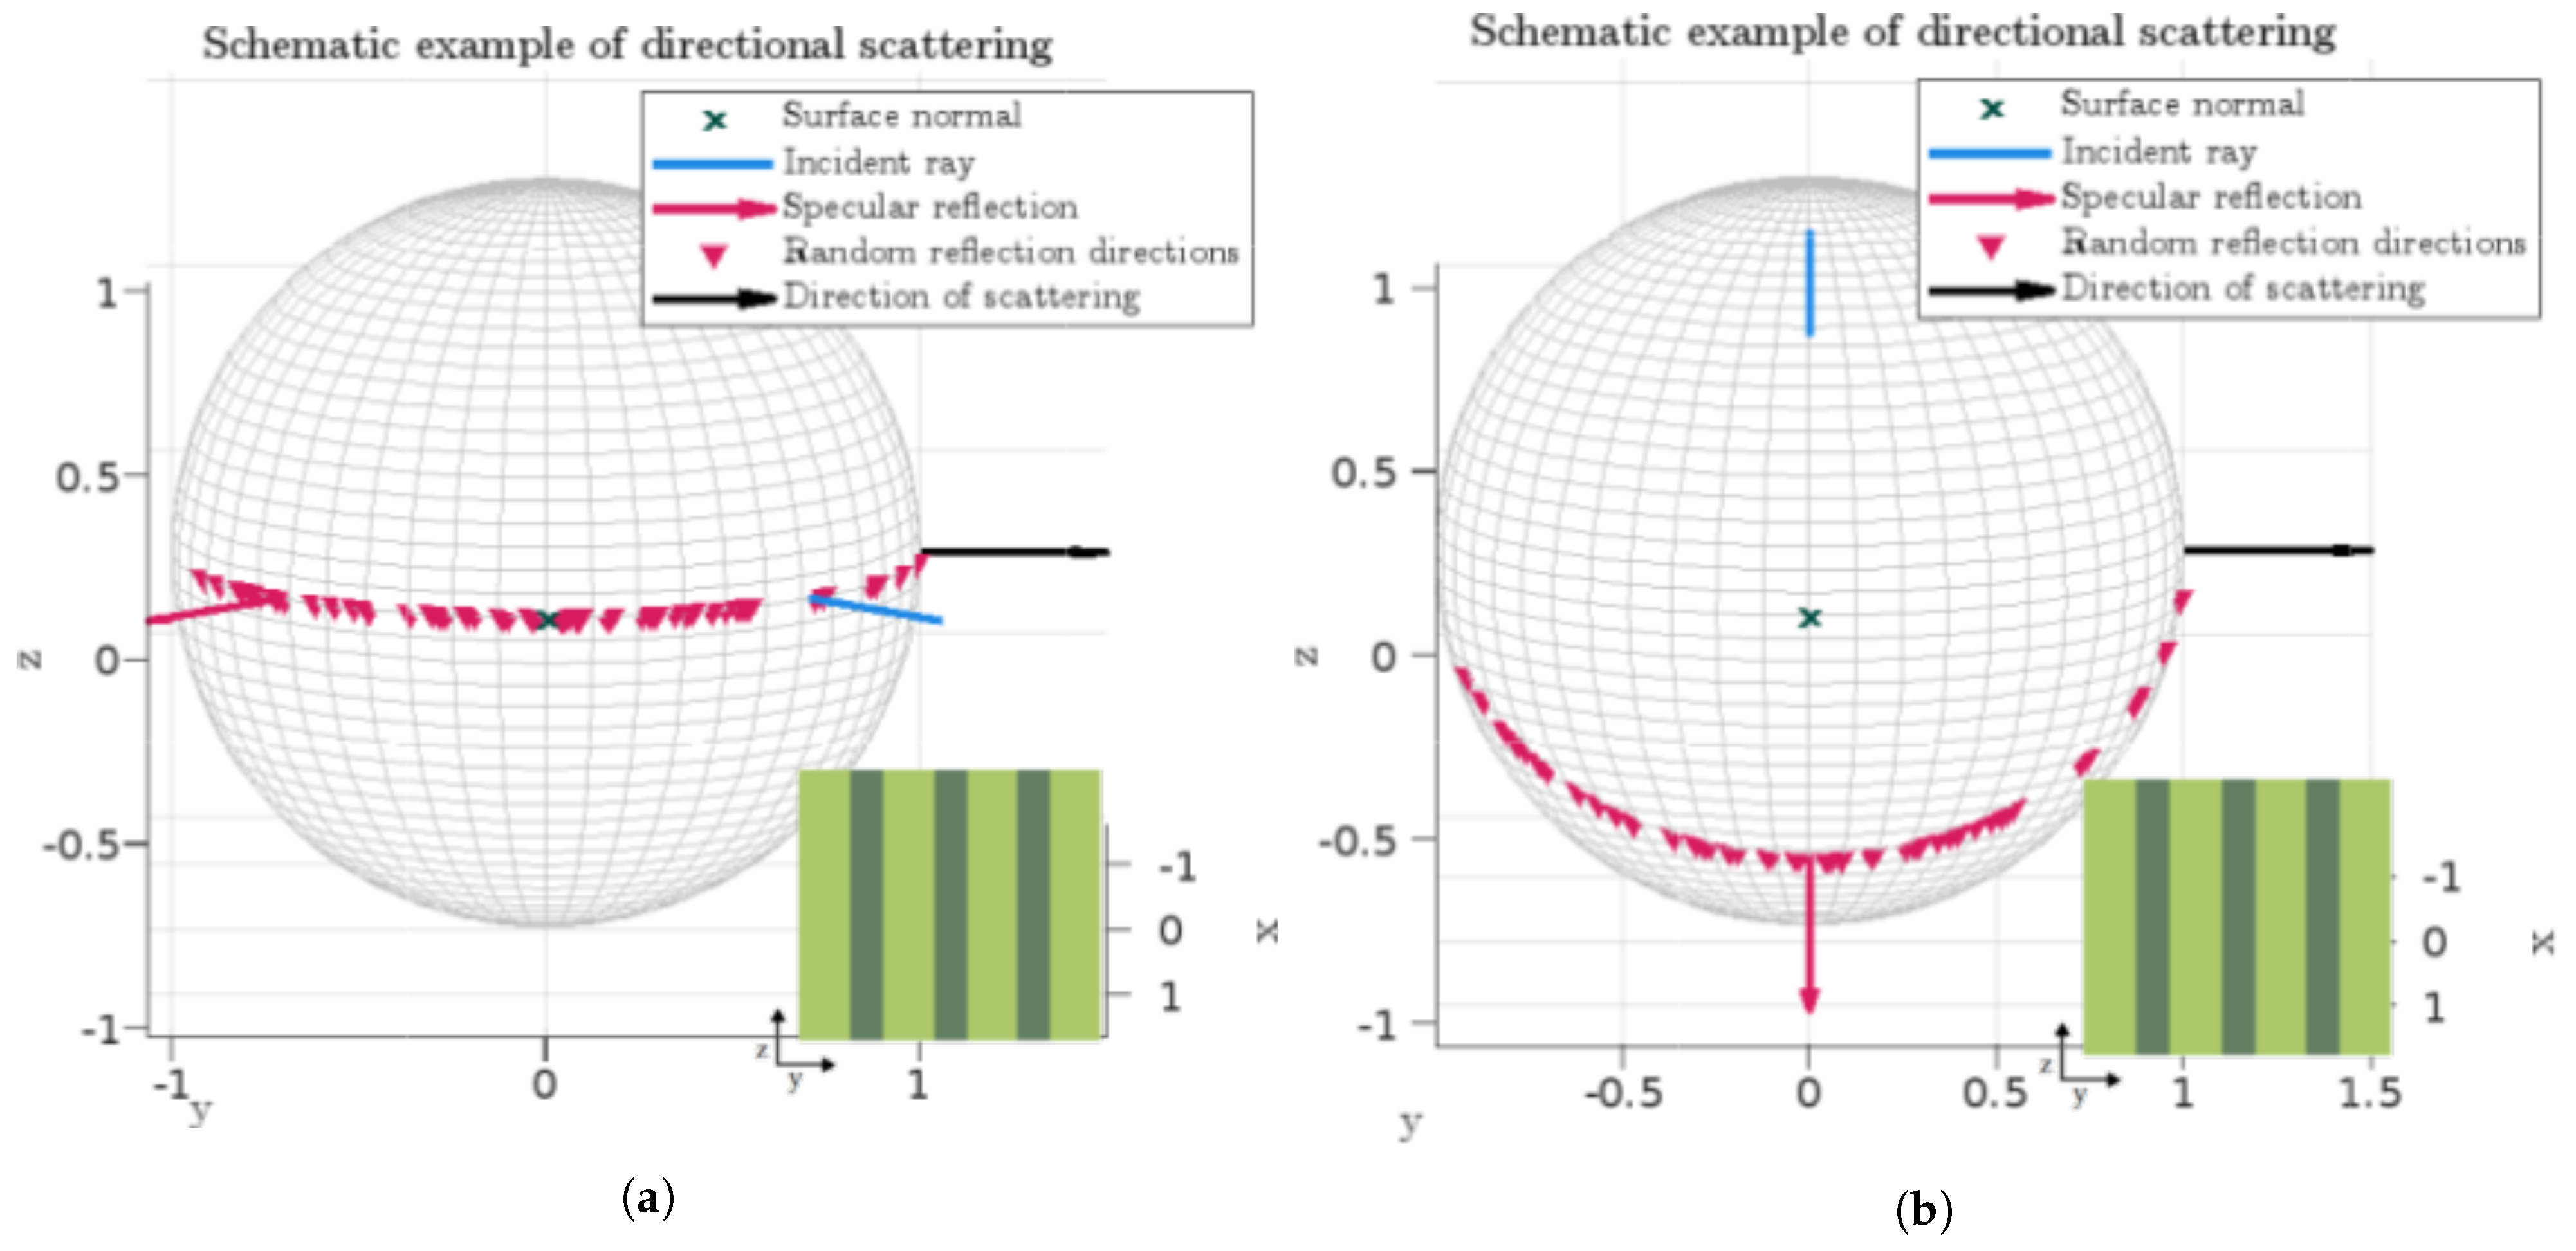
Figure 4.
Illustrations of possible reflection directions from the idealized 1D scatterer. (a) gives an overview. In (b), it is shown that the ray is reflected specularly along the z-axis, and in (c), the diffuse nature of reflection along the y-axis is illustrated. Insets illustrate the orientation of the scatterer.

Figure 5.
Illustration of some possible reflection patterns using the directional scattering algorithm. In (a), there is no scattering (), and all rays are specularly reflected. In (b), fully diffused reflections are shown (). In (c), the two scattering coefficients are equal to 0.2. This coincides with the standard uniform scattering algorithm with . In (d–f), examples of directional scattering are shown for changing direction of incidence. Here, , and .
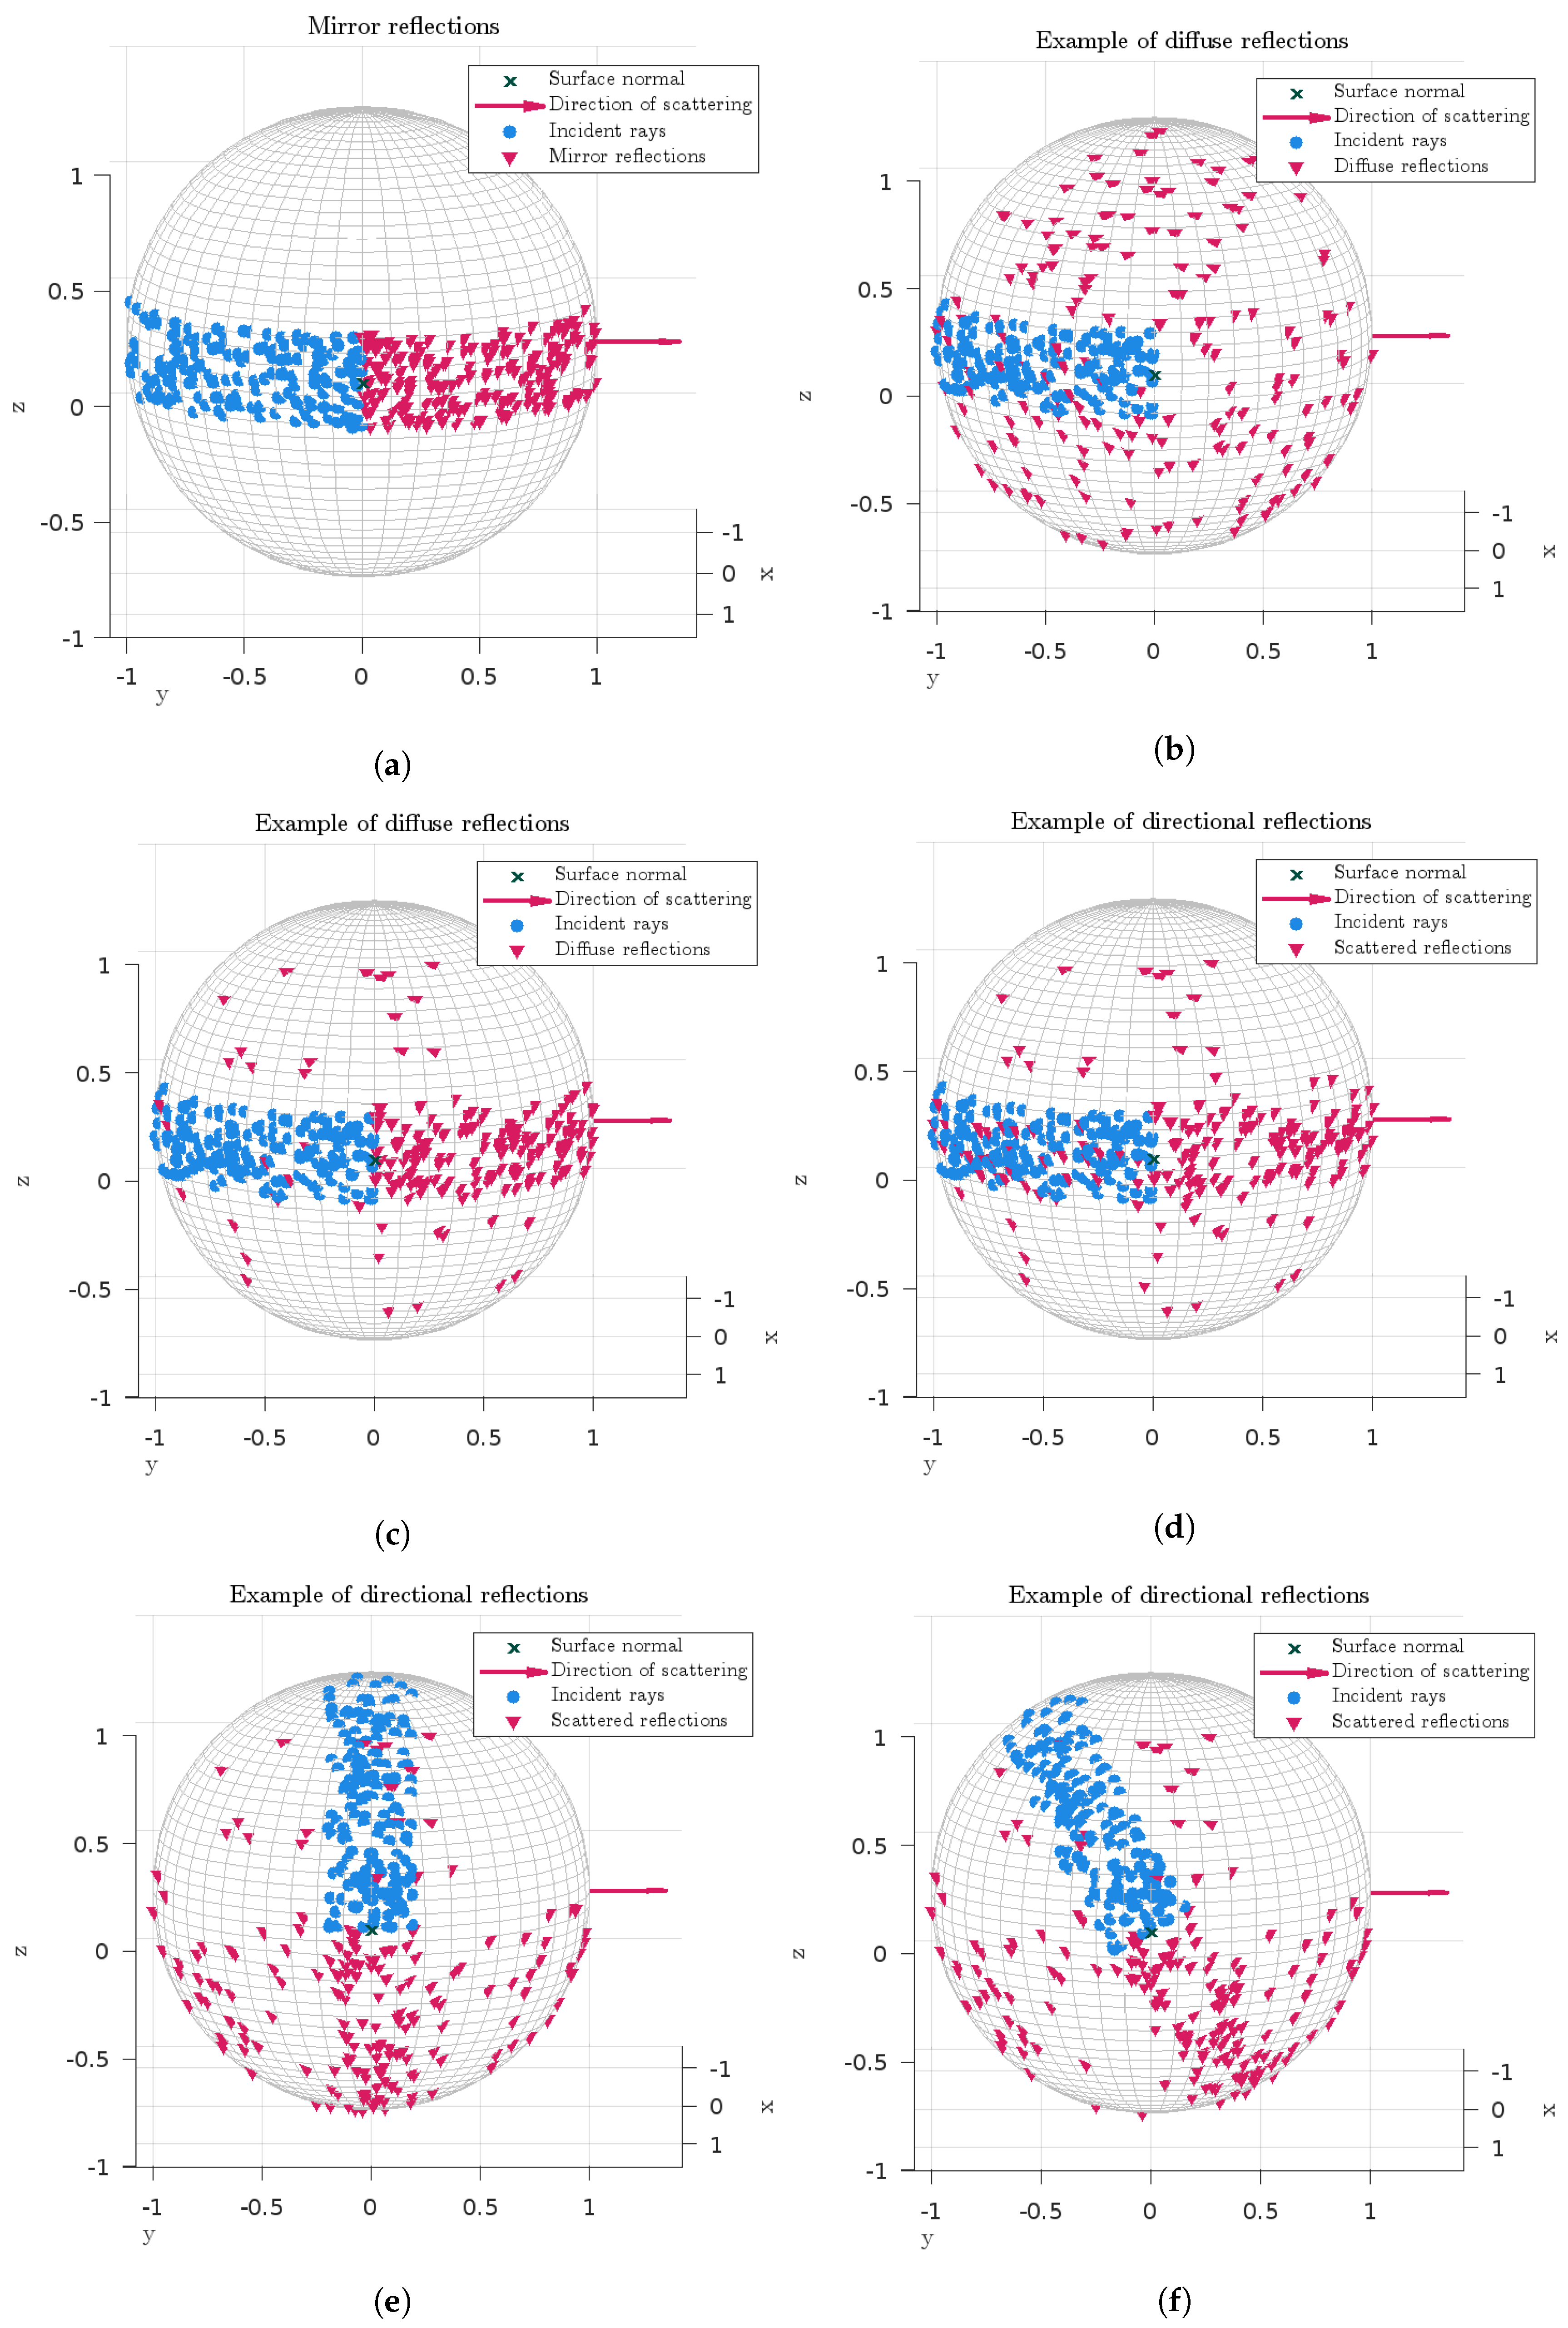
Figure 6.
Figure (a) shows a sketch of the measurement space, and (b,c) show the scatterers used, oriented to scatter sound horizontally (in (b)) or vertically (as in (c)). The scatterers were mounted along the walls shown top and left in (a). An absorbent ceiling was mounted 2.7 m above the floor [20].
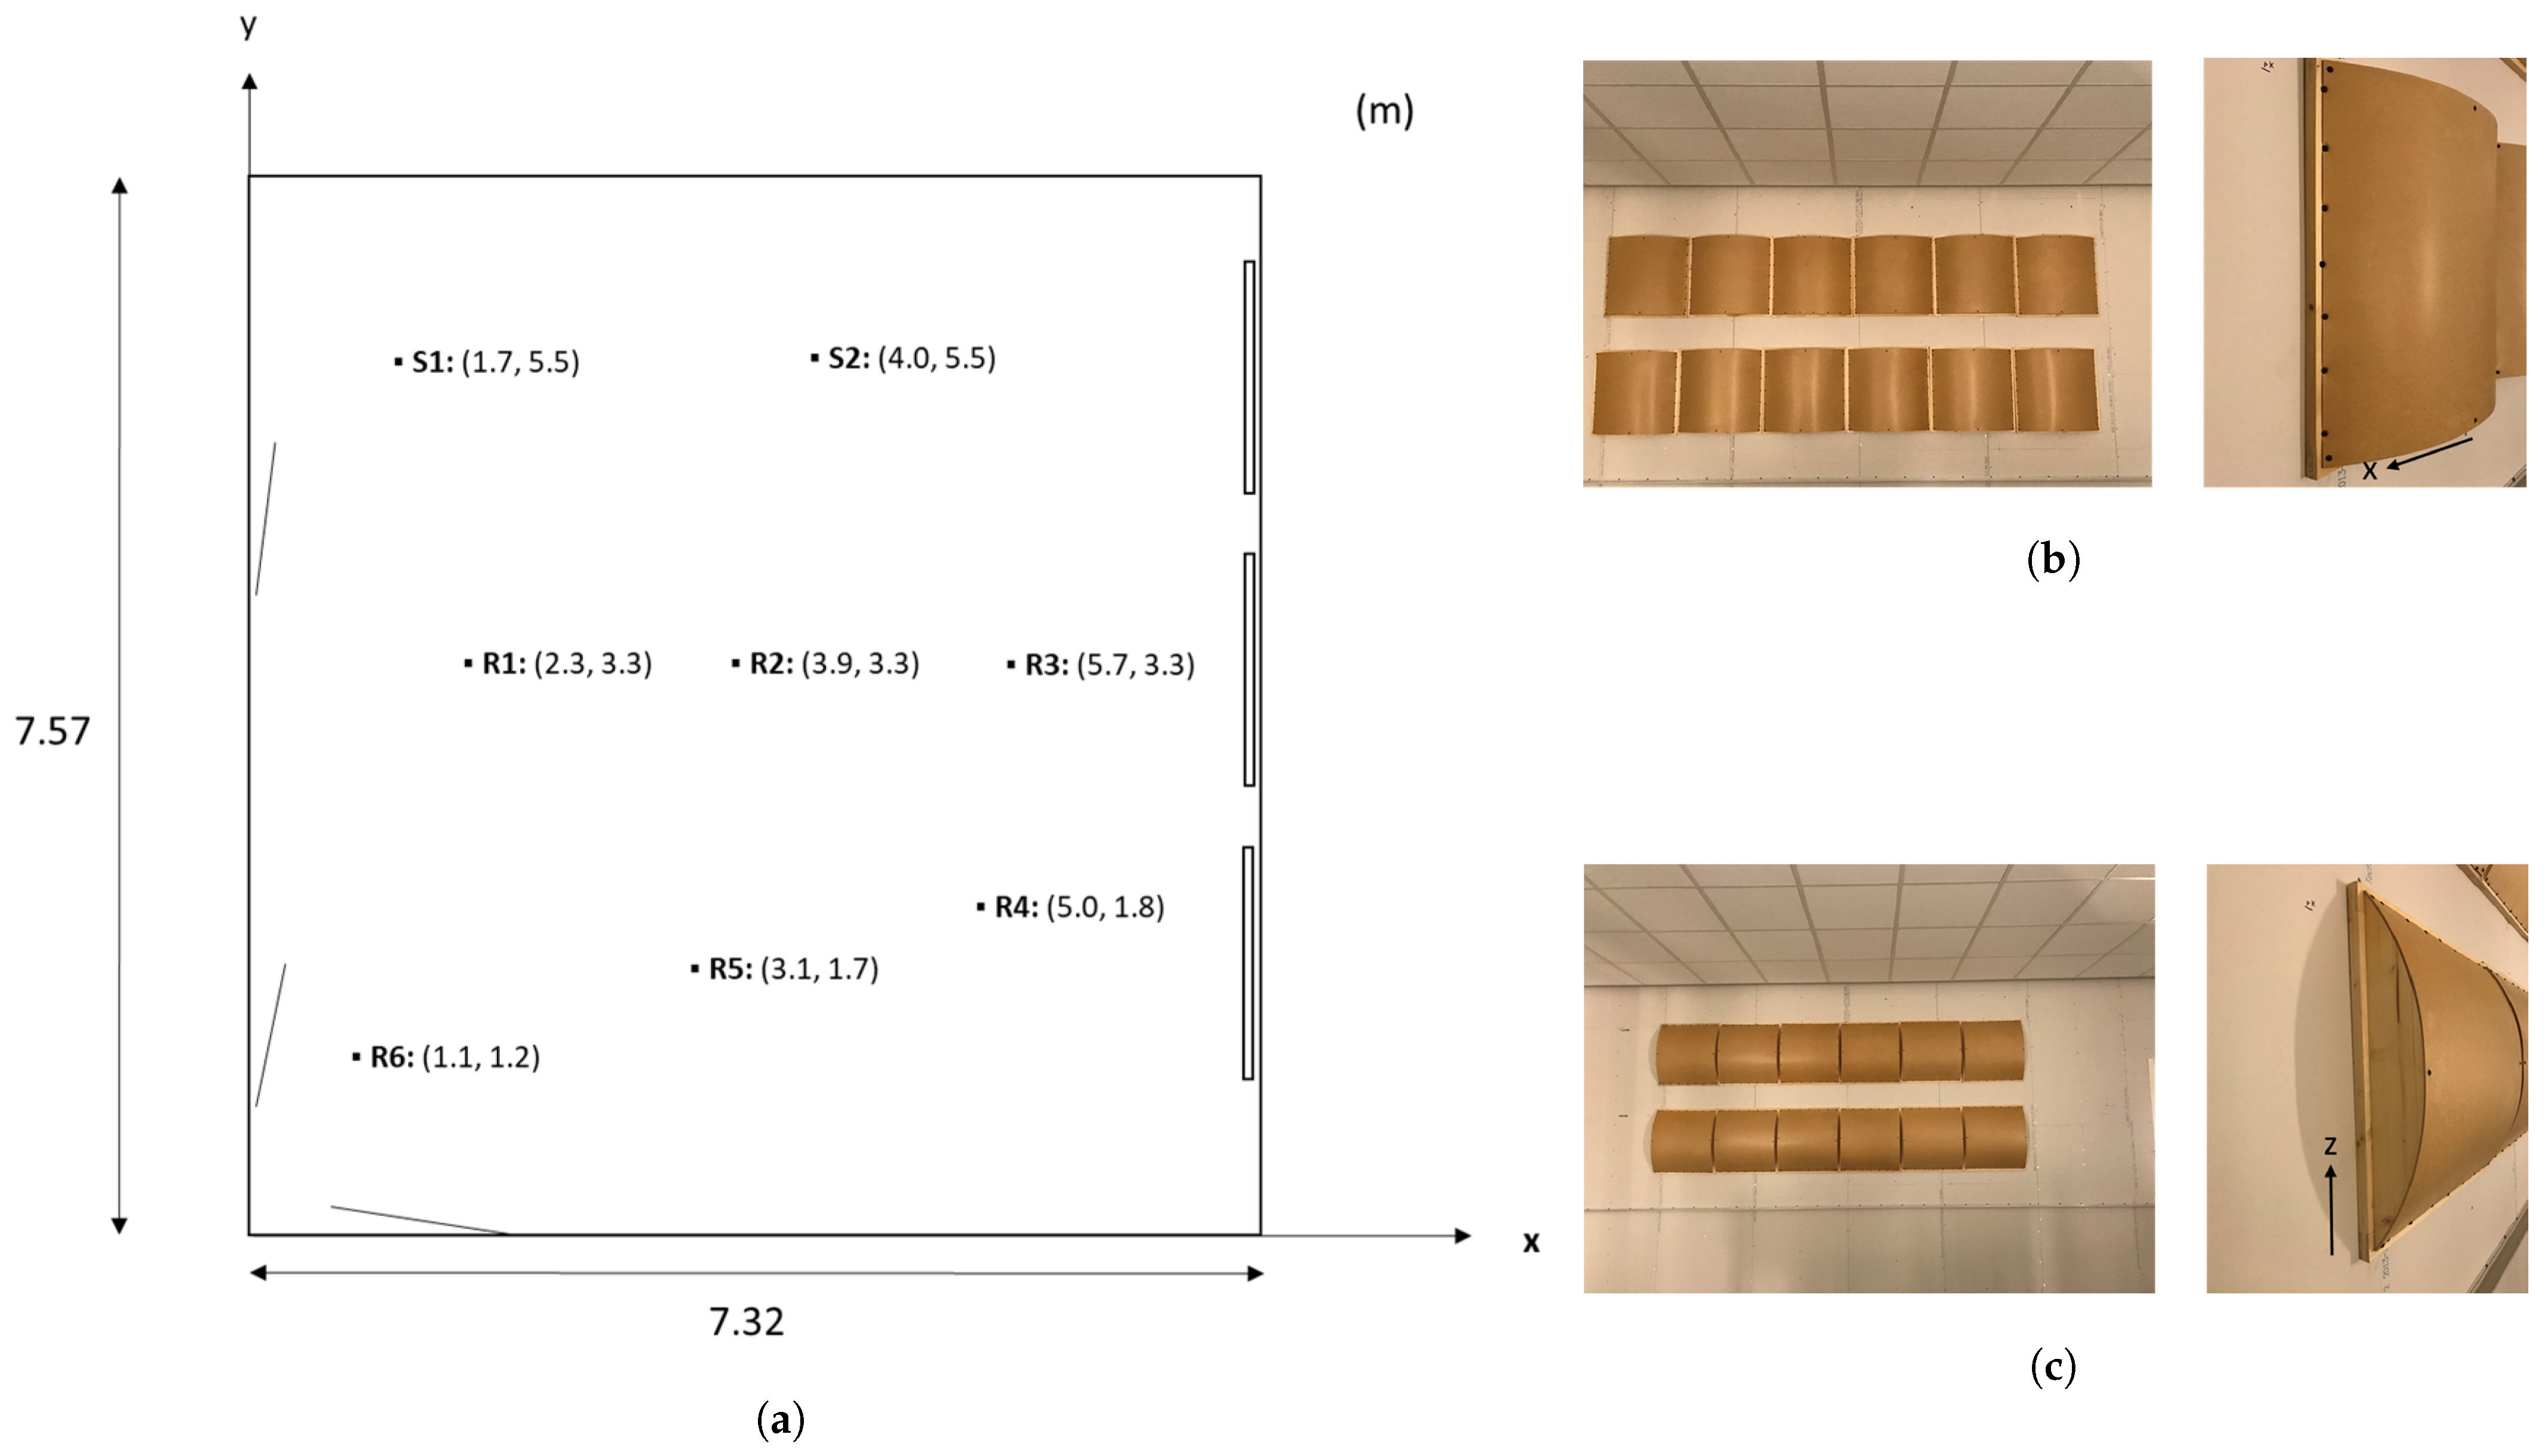
Figure 7.
The digital model used for simulation of the measurement space. Compare to Figure 6. In (a), the model for the whole space is shown with the possible positions of scatterers marked, and in (b), the geometric model of the scatterers is shown.
Figure 7.
The digital model used for simulation of the measurement space. Compare to Figure 6. In (a), the model for the whole space is shown with the possible positions of scatterers marked, and in (b), the geometric model of the scatterers is shown.
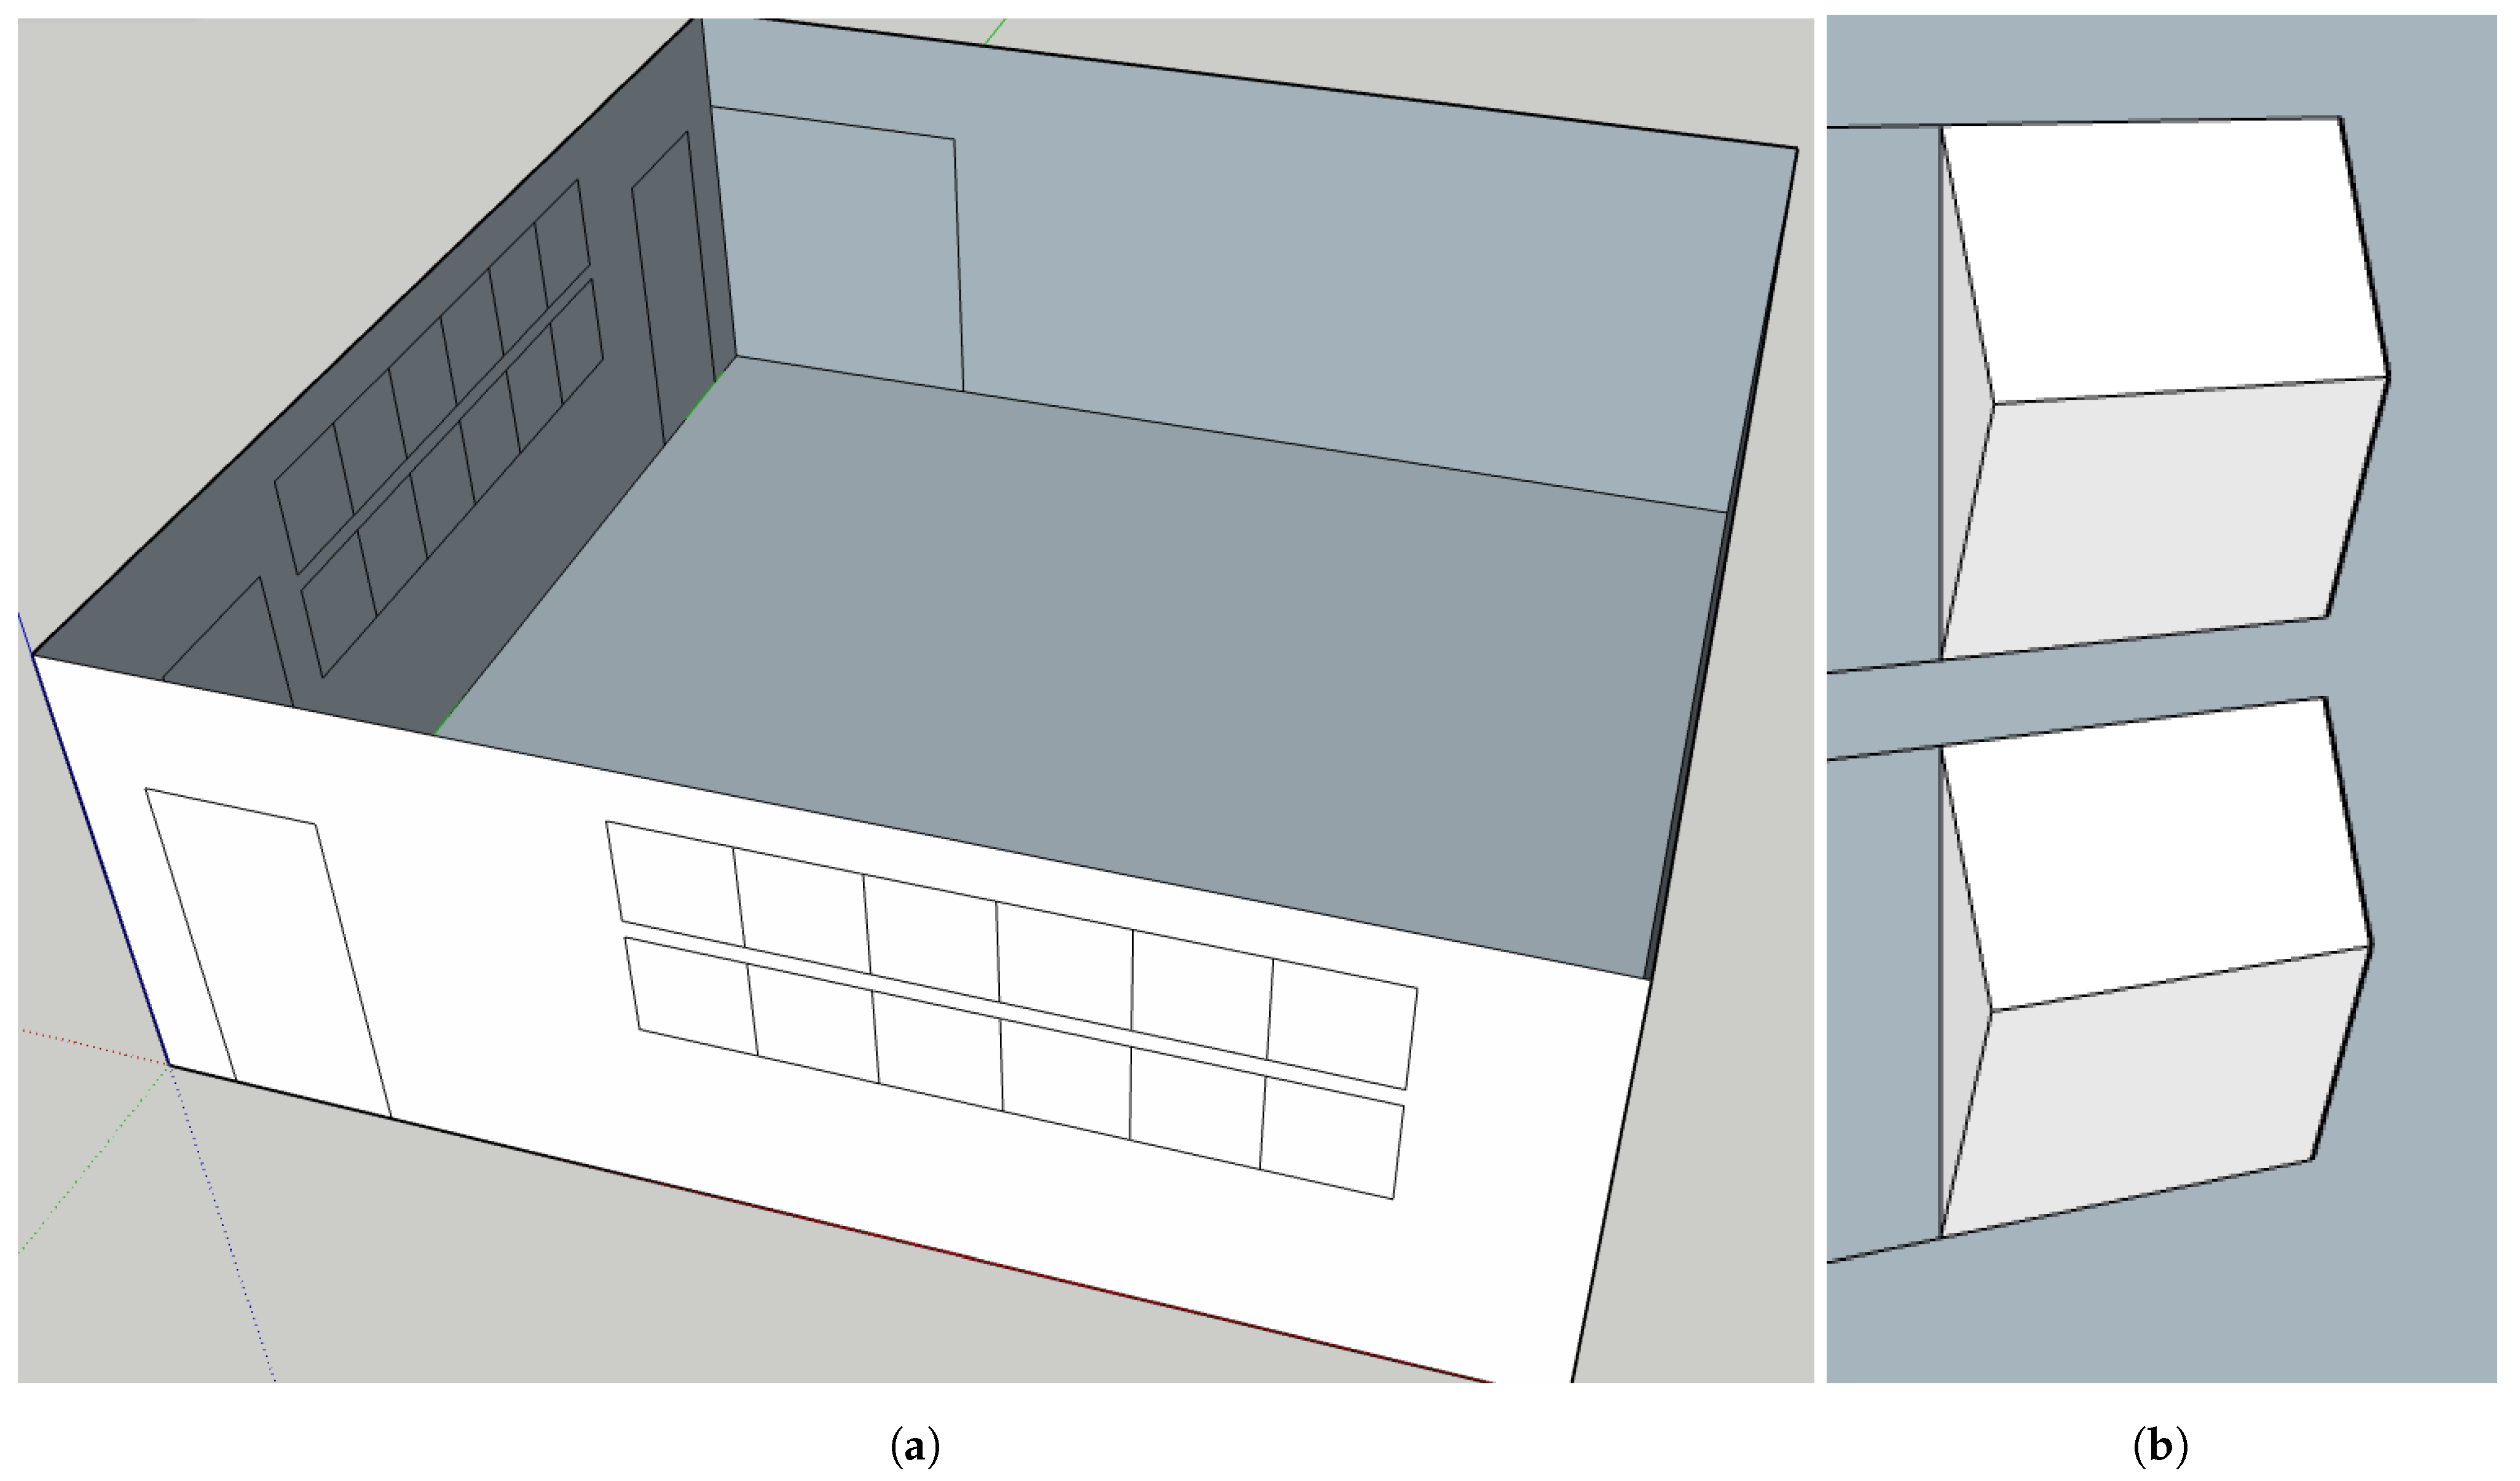
Figure 8.
Measured diffusion characteristics of the scatterers used in this project. Picture obtained from [22] with permission. In (a), the orientation of the scatterers are shown the different measurements. The diffusion characteristics are shown for each orientation in (b–d) for frequencies 500 Hz, 2000 Hz and 4000 Hz respectively.
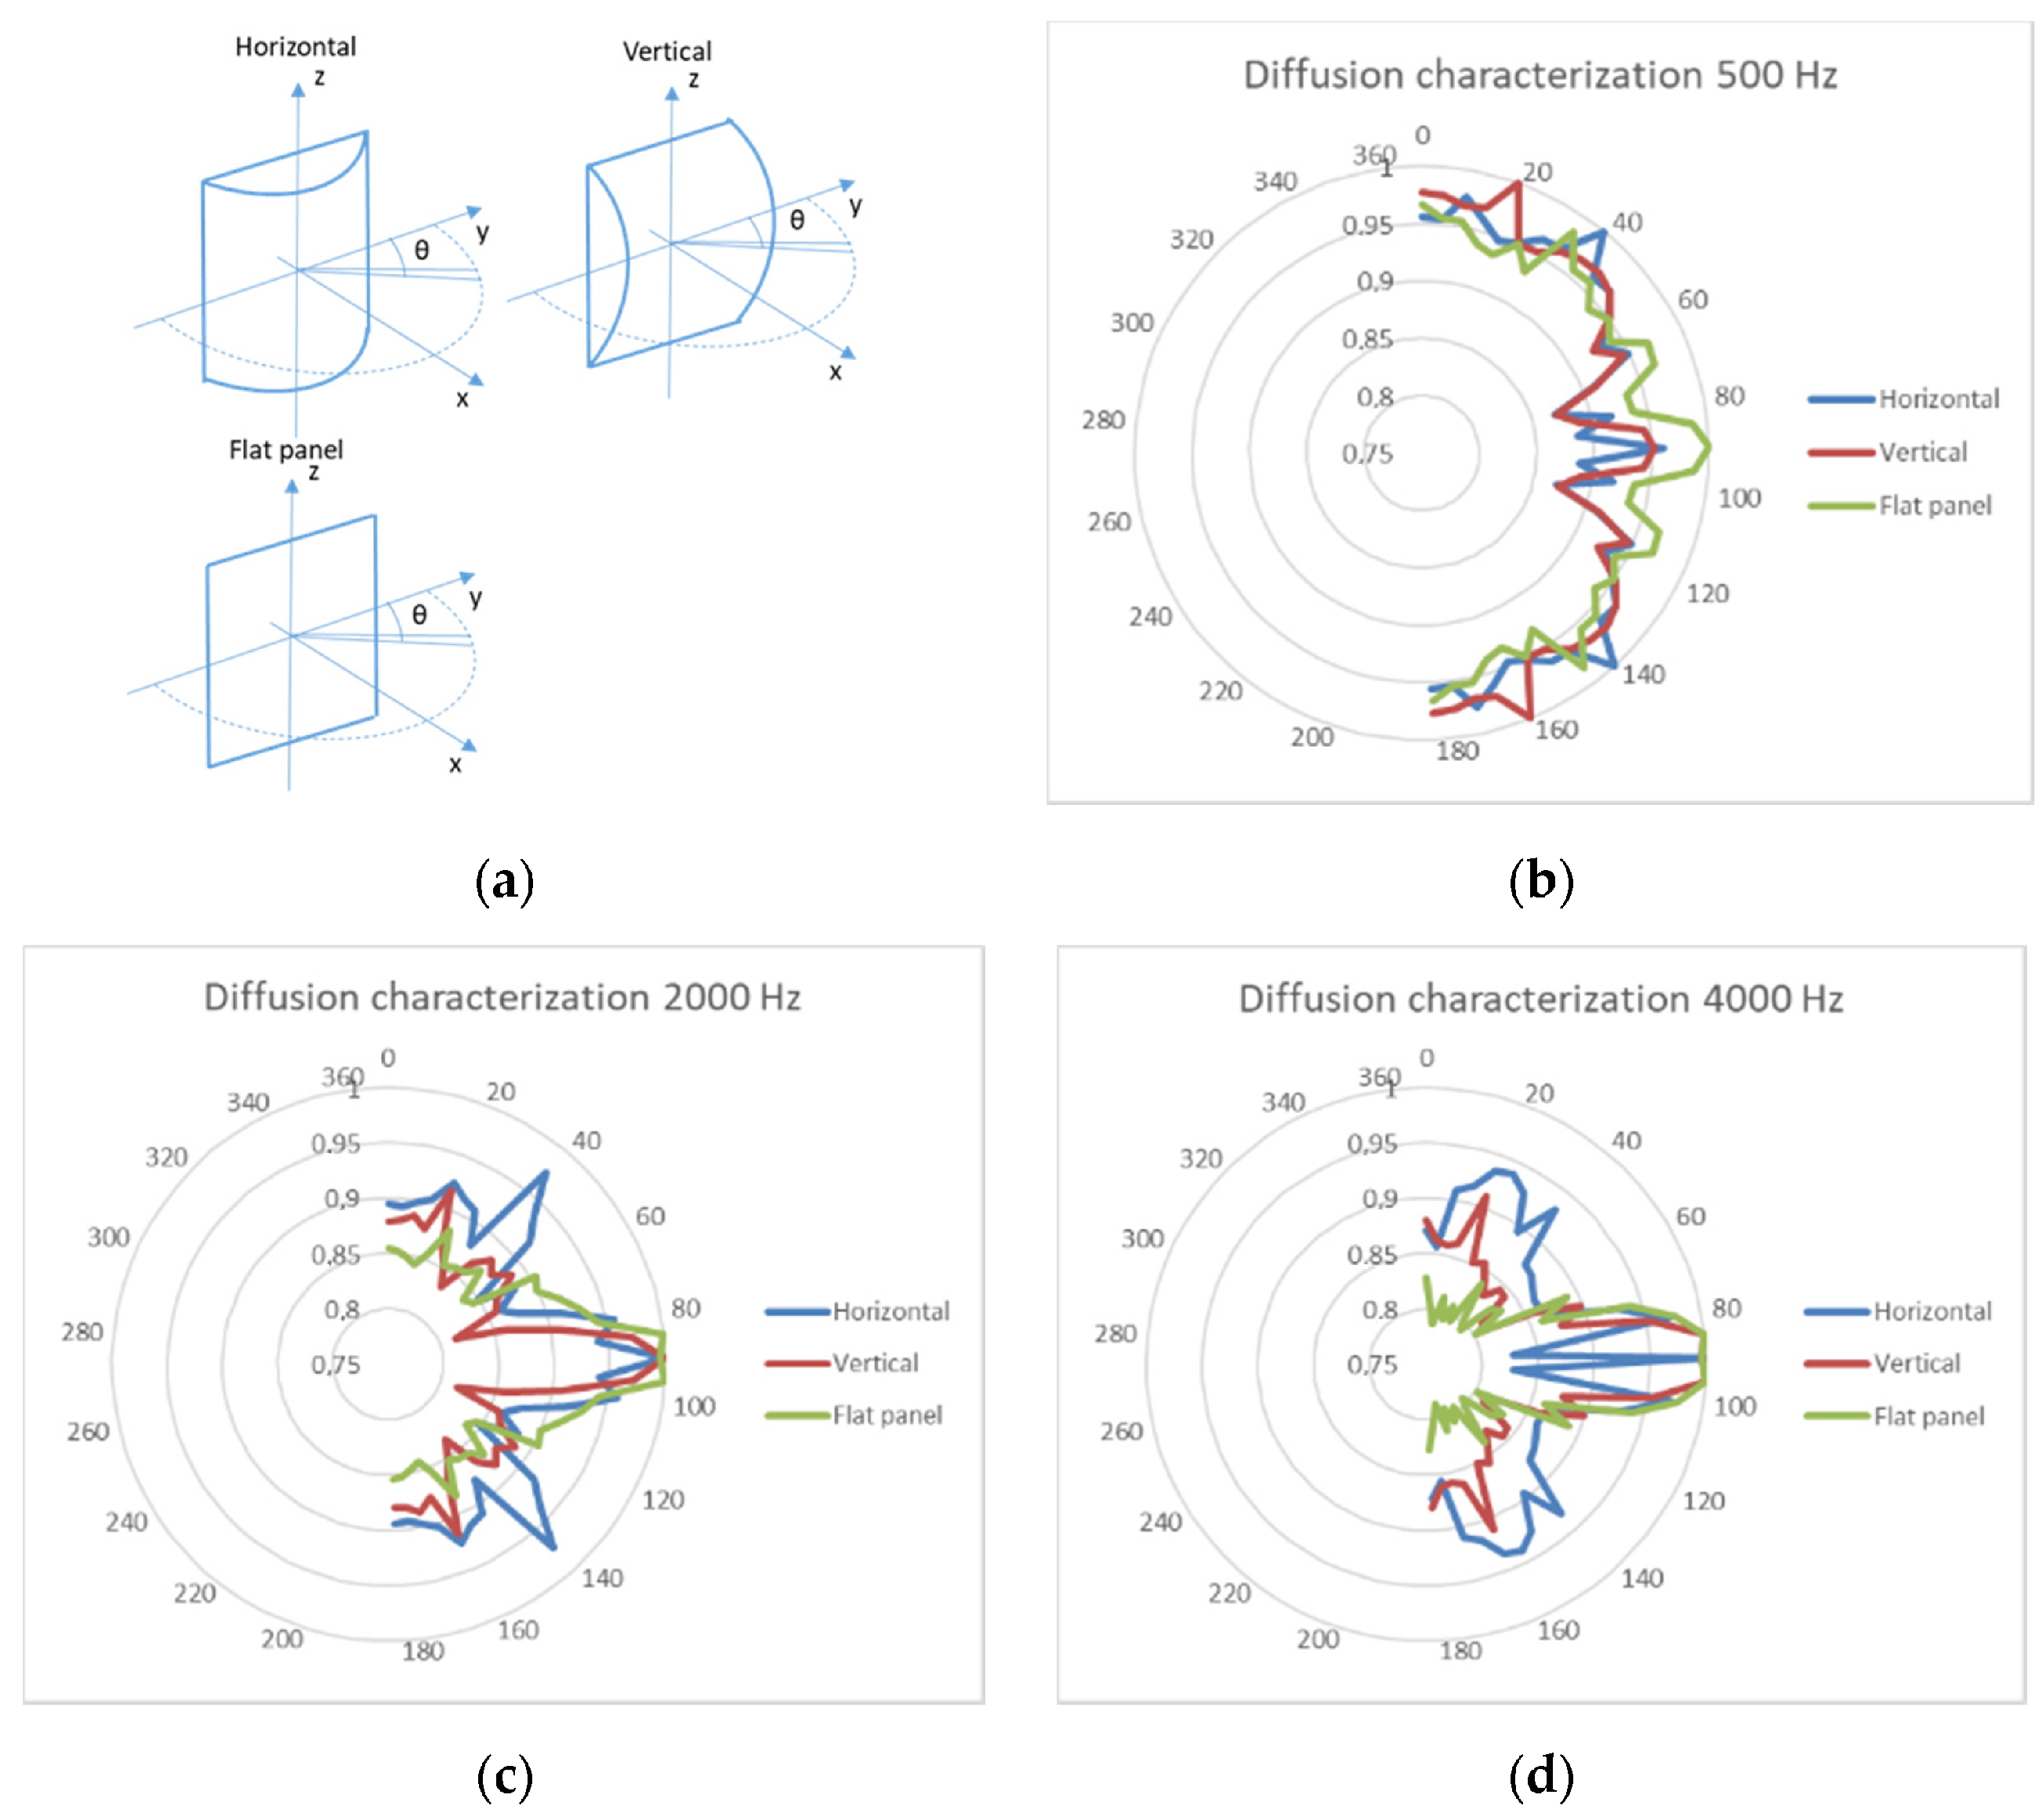
Figure 9.
A brief overview of the measured reverberation time. In (a), the measured reverberation time is shown in the space with no scatterers, 24 vertically oriented scatterers and 24 horizontally oriented scatterers. In (b), the effects of increasing the number of scatterers is shown for 1000 Hz. In both graphs, it is evident that scatterers decrease the reverberation irrespective of orientation. However, vertically oriented scatterers reduce reverberation more at higher frequencies.
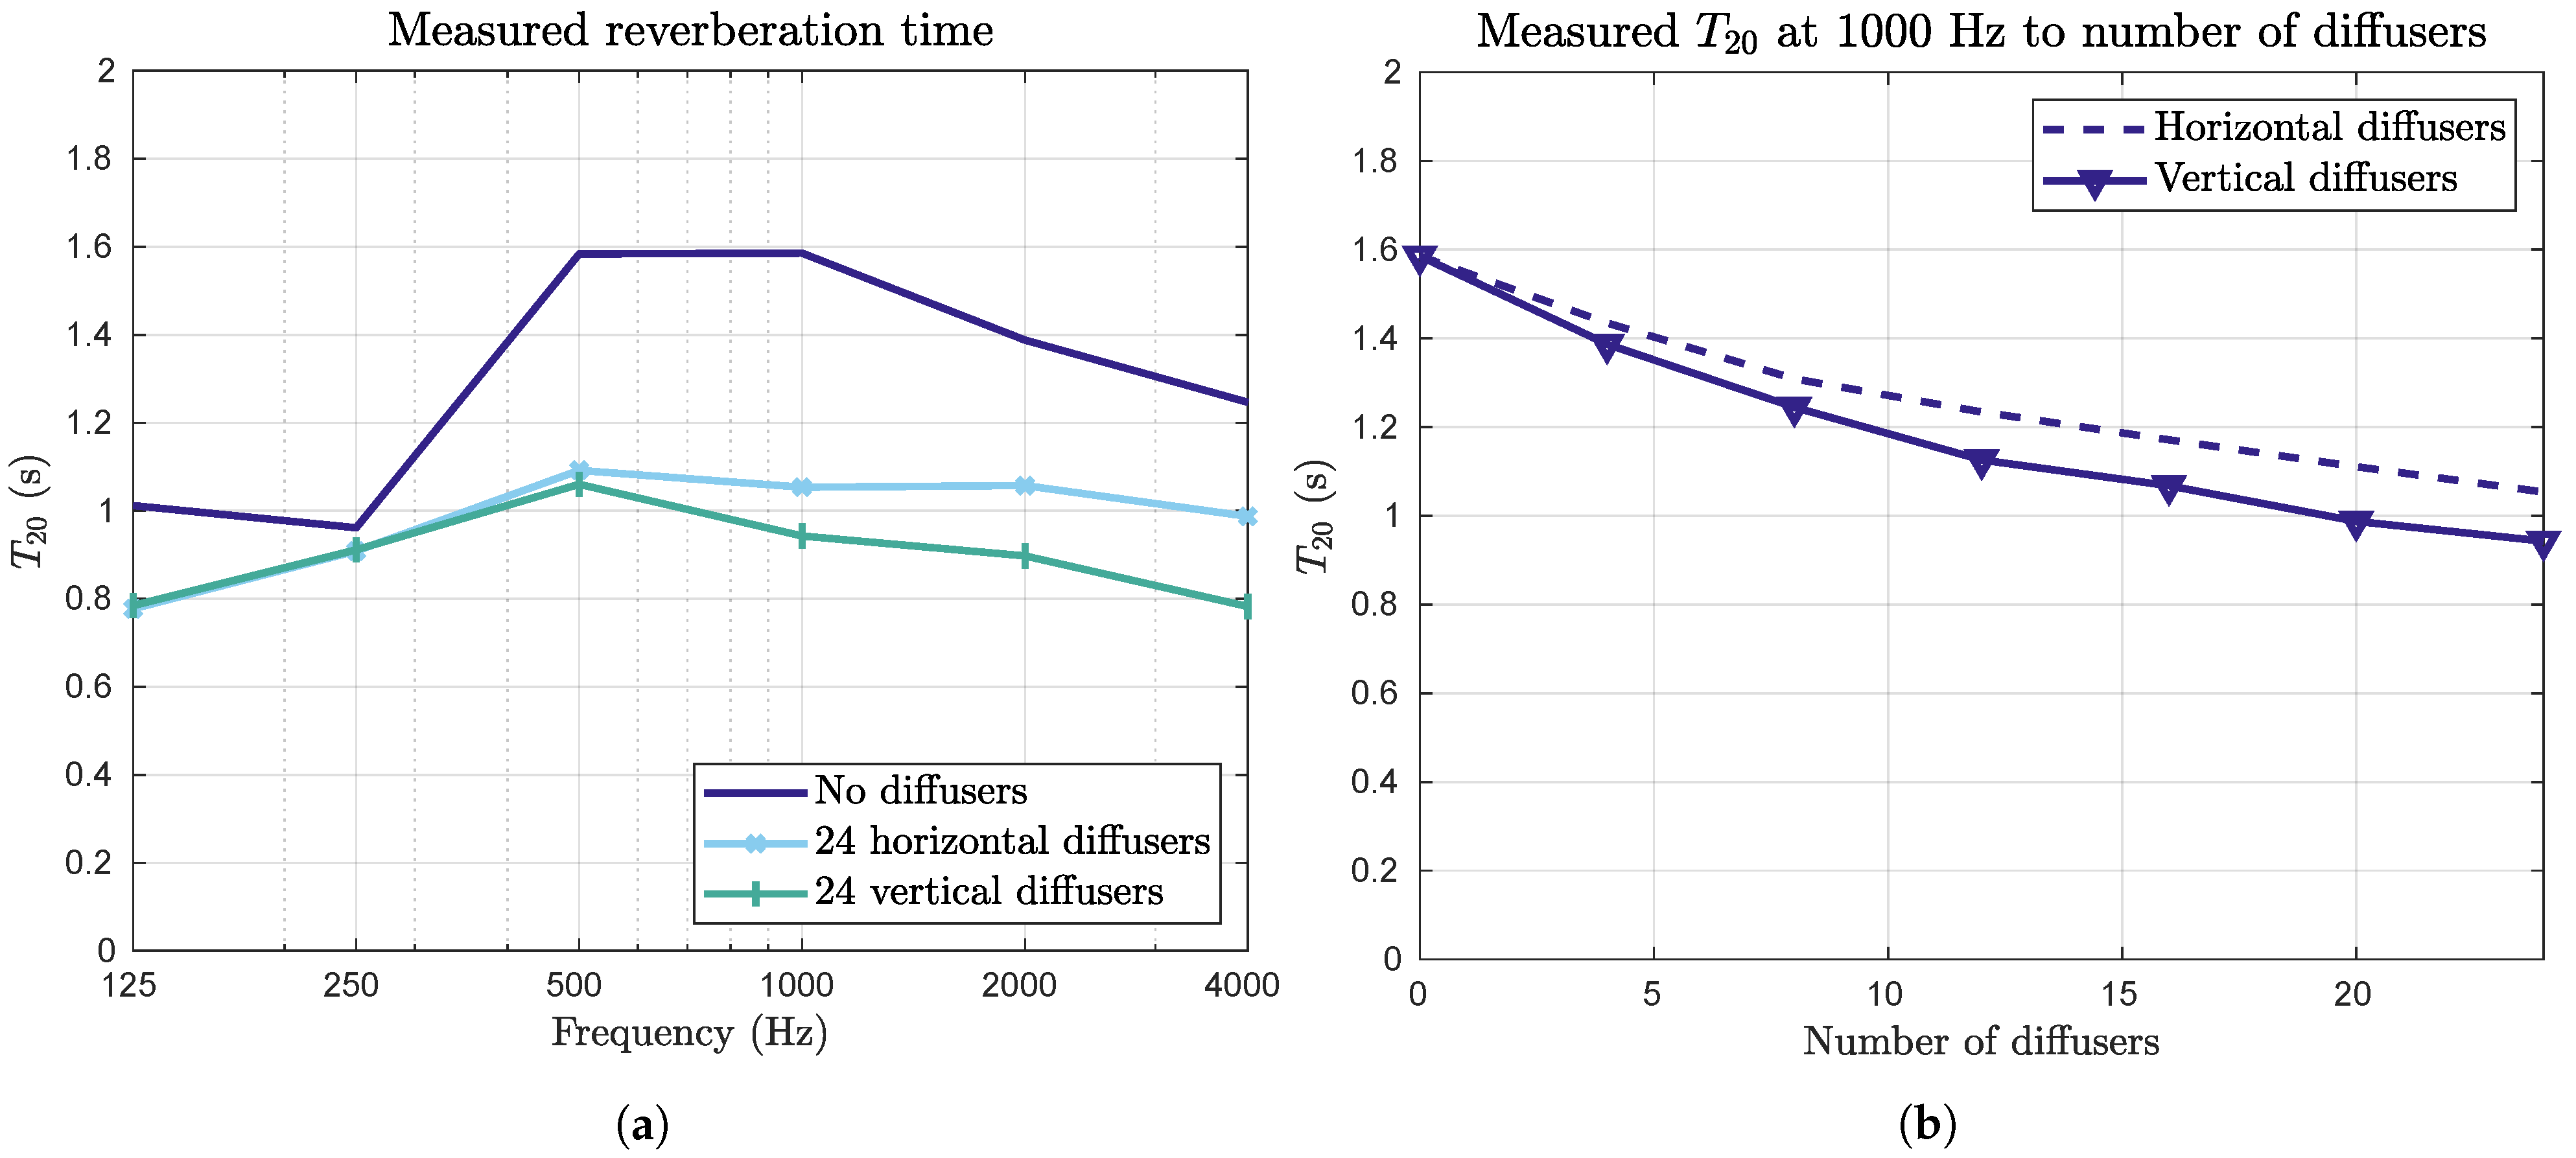
Figure 10.
Some results from the optimization step, for no scatters (a), 24 horizontal scatterers (b) and 24 vertical scatterers (c). It is shown that the optimized simulations (green) are within about 1 JND of the measurements in most cases.
Figure 10.
Some results from the optimization step, for no scatters (a), 24 horizontal scatterers (b) and 24 vertical scatterers (c). It is shown that the optimized simulations (green) are within about 1 JND of the measurements in most cases.
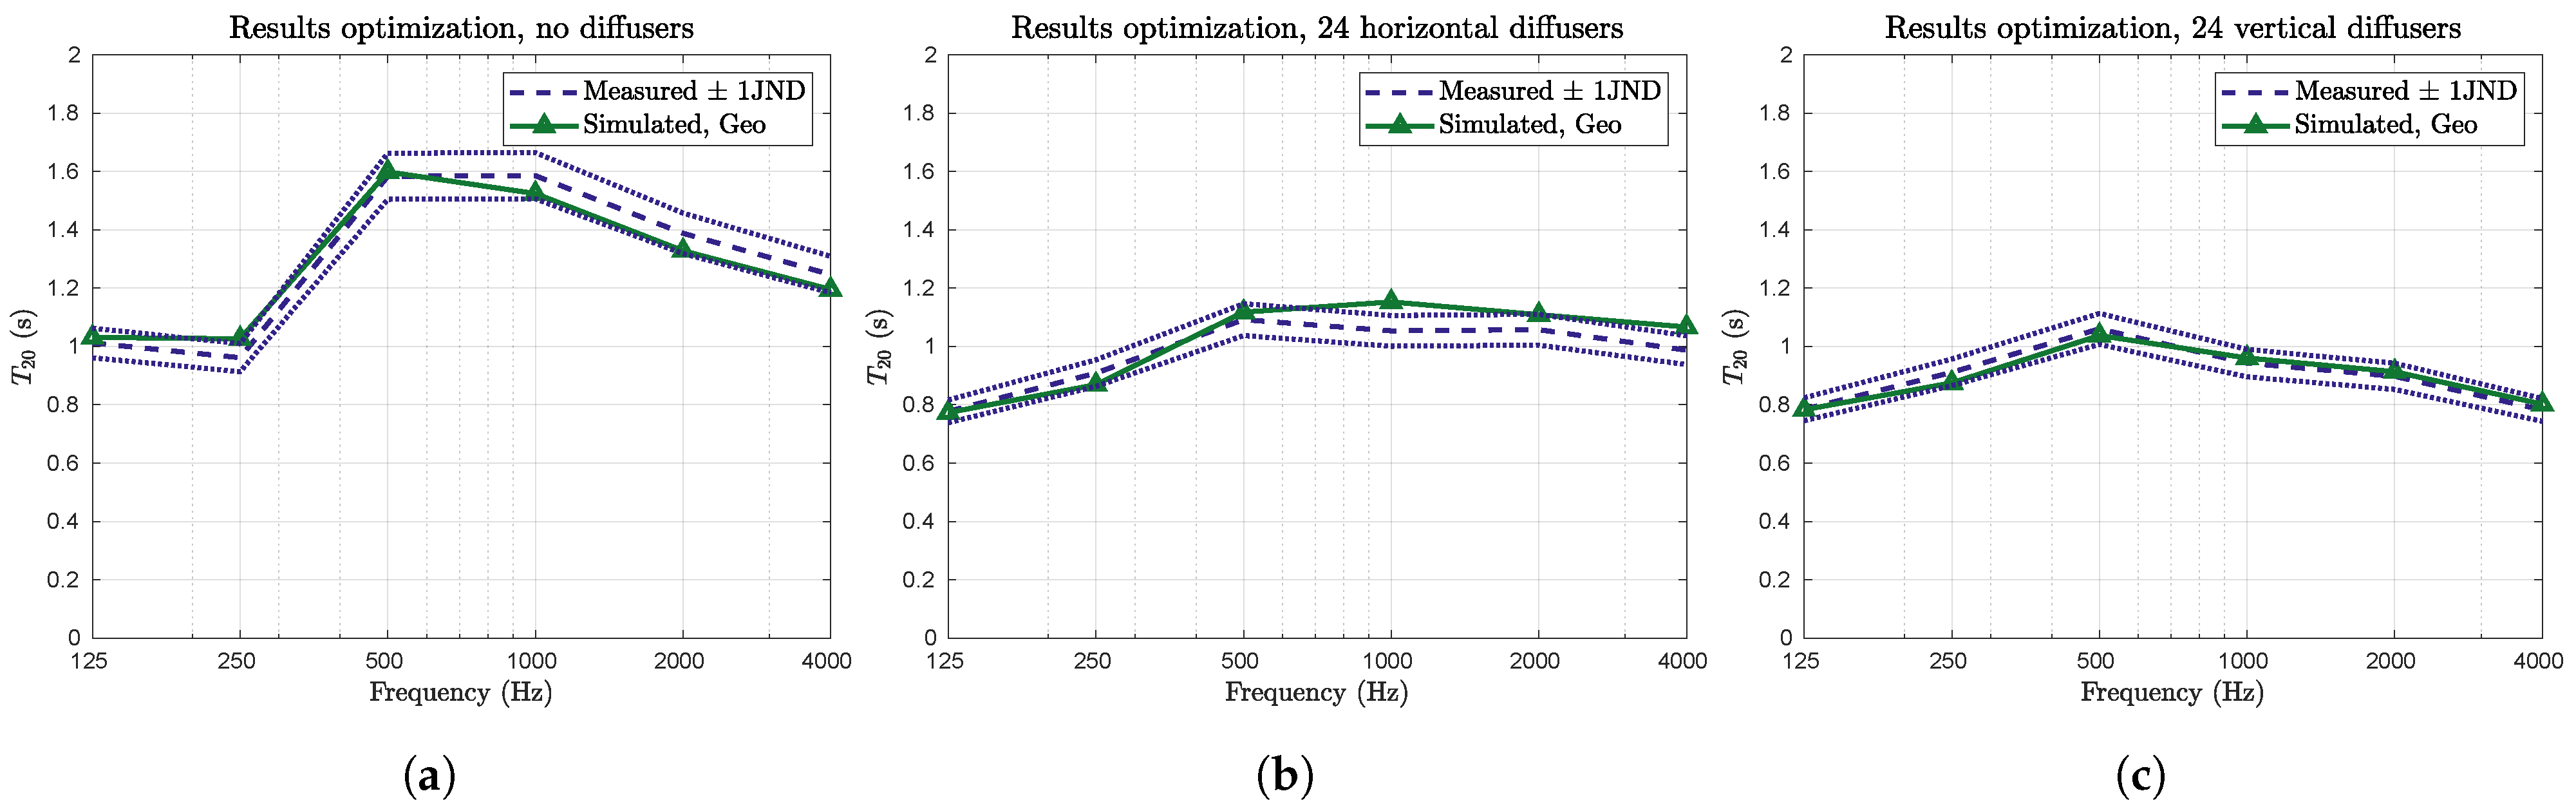
Figure 11.
Graphs showing the measured and simulated reverberation time in the space with 12 horizontally (a) and vertically (b) oriented scatterers, respectively. In (b), the measured reverberation time is shorter as the scatterers, are vertically oriented. Not all simulated data sets are able to replicate this behaviour.
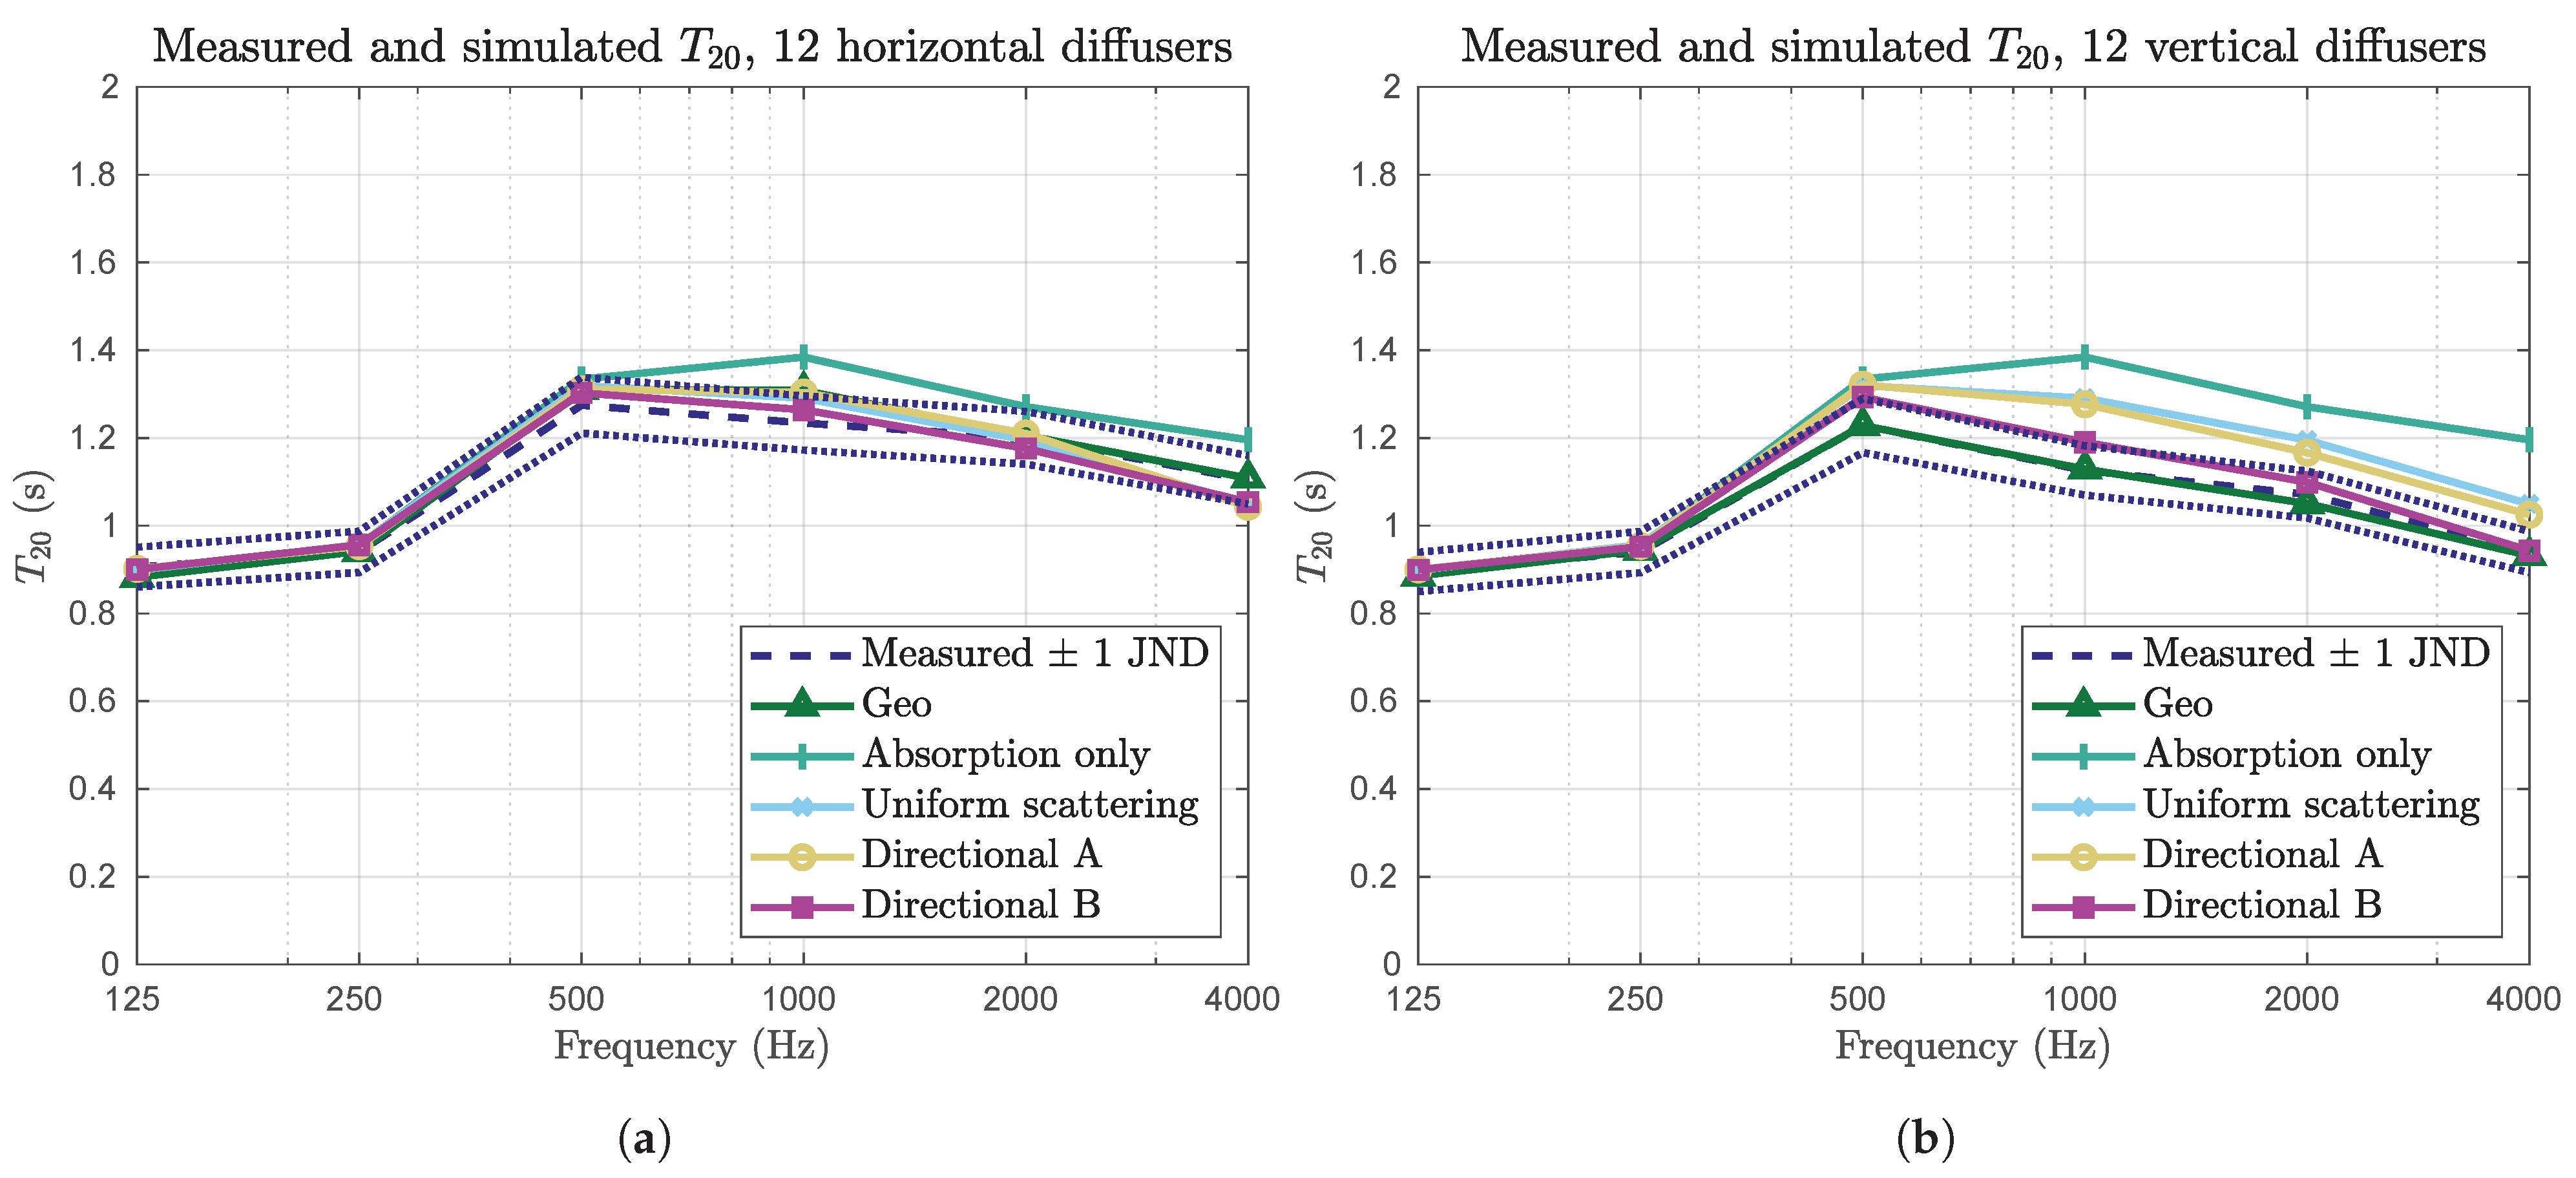
Figure 12.
In (a–e), the simulated results for 24 vertical and horizontal scatterers, respectively, are shown using the simulation setups described above. The measurements are shown as shaded graphs (see also Figure 9a). There is no difference between horizontal and vertical orientations for the Uniform and Absorption only setups. The simulated difference for Directional A is quite small. In (f), the difference between horizontal and vertical configurations is shown, compared with 1 JND of measurements.


Table 1.
Absorption parameters used for simulations.
| f (Hz) | Floor | Doors | Scatterers | Walls | Absorptive Ceiling |
|---|---|---|---|---|---|
| 125 | 0.01 | 0.2 | 0.72 | 0.13 | 0.21 |
| 250 | 0.01 | 0.2 | 0.48 | 0.15 | 0.17 |
| 500 | 0.01 | 0.04 | 0.49 | 0.07 | 0.28 |
| 1000 | 0.01 | 0.02 | 0.32 | 0.04 | 0.60 |
| 2000 | 0.01 | 0.02 | 0.18 | 0.07 | 0.50 |
| 4000 | 0.01 | 0.02 | 0.02 | 0.06 | 0.80 |
Table 2.
Scattering parameters used in simulations. Except where otherwise noted, the parameter used is the single parameter used in the common uniform scattering model.
Table 2.
Scattering parameters used in simulations. Except where otherwise noted, the parameter used is the single parameter used in the common uniform scattering model.
| f (Hz) | Floor | Doors | Scatterers | Walls | Absorptive Ceiling | |||||
|---|---|---|---|---|---|---|---|---|---|---|
| Geo | Uniform | Dir A, | Dir B, | Dir A, | Dir B, | |||||
| 125 | 0.05 | 0.1 | 0.1 | 0.12 | 0.12 | 0.1 | 0.12 | 0.1 | 0.13 | 0.13 |
| 250 | 0.05 | 0.1 | 0.1 | 0.15 | 0.15 | 0.1 | 0.15 | 0.1 | 0.15 | 0.15 |
| 500 | 0.05 | 0.1 | 0.15 | 0.23 | 0.23 | 0.35 | 0.23 | 0.5 | 0.05 | 0.05 |
| 1000 | 0.05 | 0.1 | 0.15 | 0.32 | 0.27 | 0.45 | 0.36 | 0.75 | 0.07 | 0.07 |
| 2000 | 0.05 | 0.15 | 0.25 | 0.37 | 0.31 | 0.45 | 0.42 | 0.8 | 0.05 | 0.05 |
| 4000 | 0.05 | 0.15 | 0.25 | 0.46 | 0.36 | 0.45 | 0.56 | 0.9 | 0.05 | 0.05 |
Table 3.
Estimated error between simulations and measurements for different simulation methods and configurations. The variations in error for early decay time and speech clarity are small.
Table 3.
Estimated error between simulations and measurements for different simulation methods and configurations. The variations in error for early decay time and speech clarity are small.
| Average Error, Measurements vs. Simulations | (s) | (s) | (dB) |
|---|---|---|---|
| Geometric | 0.074 | 0.178 | 2.025 |
| Absorption only | 0.153 | 0.175 | 2.076 |
| Uniform scattering | 0.100 | 0.178 | 2.069 |
| Directional scattering A | 0.097 | 0.175 | 2.058 |
| Directional scattering B | 0.078 | 0.178 | 2.049 |
Disclaimer/Publisher’s Note: The statements, opinions and data contained in all publications are solely those of the individual author(s) and contributor(s) and not of MDPI and/or the editor(s). MDPI and/or the editor(s) disclaim responsibility for any injury to people or property resulting from any ideas, methods, instructions or products referred to in the content. |
© 2023 by the authors. Licensee MDPI, Basel, Switzerland. This article is an open access article distributed under the terms and conditions of the Creative Commons Attribution (CC BY) license (https://creativecommons.org/licenses/by/4.0/).
Share and Cite
MDPI and ACS Style
Autio, H.; Nilsson, E. A Novel Algorithm for Directional Scattering in Acoustic Ray Tracers. Acoustics 2023, 5, 928-947. https://doi.org/10.3390/acoustics5040054
AMA Style
Autio H, Nilsson E. A Novel Algorithm for Directional Scattering in Acoustic Ray Tracers. Acoustics. 2023; 5(4):928-947. https://doi.org/10.3390/acoustics5040054
Chicago/Turabian StyleAutio, Hanna, and Erling Nilsson. 2023. "A Novel Algorithm for Directional Scattering in Acoustic Ray Tracers" Acoustics 5, no. 4: 928-947. https://doi.org/10.3390/acoustics5040054