
The Effect of the Frequency and Energetic Content of Broadband Noise on the Lombard Effect and Speech Intelligibility

Department of Speech and Hearing Science, University of Illinois, Urbana-Champaign, Champaign, IL 61820, USA
*
Author to whom correspondence should be addressed.
Acoustics 2023, 5(4), 898-908; https://doi.org/10.3390/acoustics5040052
Submission received: 18 September 2023
/
Revised: 3 October 2023
/
Accepted: 6 October 2023
/
Published: 10 October 2023
(This article belongs to the Special Issue Developments in Acoustic Phonetic Research)
Abstract
:The Lombard effect is an unconscious reflex of speakers to increase vocal effort when disturbed by noise, aiming to enhance speech intelligibility. This study aims to evaluate the effect of noise with different energetic content and levels at various frequencies on the Lombard effect, communication disturbance, vocal comfort, and speech intelligibility. Twenty university students participated in the study, reading a six-sentence excerpt and performing an intelligibility test under 12 randomized noise conditions. These conditions included noises at low (20–500 Hz), medium (500–4000 Hz), and high frequencies (4000–20,000 Hz), at four levels (45 dB, 55 dB, 65 dB, 75 dB). After each condition, participants rated their perceived communication disturbance and vocal discomfort. The results indicated that noise with energetic content at medium frequencies produced the highest Lombard effect, produced the most detrimental effect on communication disturbance and vocal comfort, and caused the strongest decrease in speech intelligibility, whereas it was minimally affected by low- and high-frequency noise. In conclusion, this study highlights that medium-frequency noise has the greatest impact on vocal effort, communication disturbance, and vocal comfort, while low- and high-frequency noise has minimal effect on speech intelligibility.
1. Introduction
In everyday communication, individuals adapt their speech patterns in response to varying environmental noise levels, utilizing auditory feedback to ensure the effective self-monitoring of their speech production [1]. This vocal adjustment, termed the Lombard effect [2], is an automatic reflex triggered when speakers encounter disruptive background noise that compromises effective communication [3,4,5]. This phenomenon, often resulting in what is known as Lombard speech, manifests as an increase in voice sound levels, fundamental frequency alterations [6,7,8], changes in formant frequency, articulation shifts, vowel duration elongation [9,10], and heightened vowel intensity [11,12]. Importantly, these vocal modifications have been shown to enhance the intelligibility of Lombard speech compared to speech produced in noise-free conditions [8]. However, striving to repair communication hindered by noise can lead to increased vocal effort. One commonly used metric for assessing vocal effort is the equivalent continuous A-weighted sound pressure level (SPL) of speech measured at a distance of 1 m from the speaker’s mouth under anechoic conditions [13]. Typically, conversational speech registers around 60 dBA at 1 m, but this level escalates in response to environmental noise. Up to a noise level of approximately 30–40 dB(A), speech is minimally affected, with a modest increase of 0.24 dB(A)/dB(A) [5,14,15]. Beyond this threshold, as noise levels exceed approximately 43 dB(A), the average power of speech undergoes a more significant increment of about 0.65 dB(A) per 1 dB increase in noise level [16], reaching saturation at high noise levels due to physiological limitations (“ceiling effect”) [17]. This rate of increase in speech level per noise level is referred to as the Lombard slope. Additionally, it is worth highlighting that an individual’s quality of life (QoL) is closely intertwined with their communication abilities, with particularly notable improvements observed in individuals possessing higher communication skills, as underscored in Maniaci’s et al. study (2021) [18].
Given that the Lombard effect results in heightened vocal effort in response to challenging acoustic environments, it is reasonable to anticipate that increased noise levels will lead to heightened vocal discomfort and communication disruption. Bottalico et al. (2017) [16] identified that at the point at which the Lombard effect is triggered, the threshold of perceived disturbance and the threshold of discomfort do not align. Specifically, communication disruption is perceived at a lower noise level than the one associated with the activation of the Lombard effect (37.4 dB(A) and 43.3 dB(A), respectively), while discomfort is perceived at a higher level (49.5 dB(A)).
Despite extensive exploration of the Lombard effect under various conditions [19], it is still not known how noises with different frequency characteristics influence this phenomenon. The human auditory system registers frequencies ranging from 20 to 20,000 Hz, yet the most critical frequencies for speech intelligibility fall within the 500 to 4000 Hz range [20]. Notably, human auditory sensitivity varies with frequency, with the highest sensitivity found in the speech critical frequency range of 1000 to 4000 Hz and reduced sensitivity both above and below this range [21,22].
Since speech self-monitoring depends on auditory perception filtered through the auditory system, and the auditory system’s sensitivity varies by frequency, it is logical to surmise that the energy content of noises would exert different effects on the Lombard effect’s vocal response, as well as the disturbance and discomfort elicited by noise at different frequencies. Existing evidence suggests that the vocal response in the Lombard effect is sensitive to frequency content, especially frequencies critical for speech [19,23]. Likewise, the varying energy content of noise may also impact speech intelligibility differently. Noise with an acoustic spectrum resembling that of speech is expected to result in more degraded speech perception. Therefore, this study aims to investigate whether distinct Lombard slopes (defined as the Voice level vs. Noise level) emerge when broadband noise is characterized by low (LF) (20–500 Hz), medium (MF) (500–4000 Hz), and high frequency (HF) (4000–20,000 Hz) energy content. This study also aims to explore the relationship between these Lombard slopes and perceived communication disturbance, vocal comfort, as well as speech intelligibility. The research questions guiding this investigation are as follows:
- Is there a difference in the Lombard slope when the noise energy resides mostly at low, medium, and high frequencies?
- Is there a difference in the slope of the perceived communication disturbance from noise when the noise energy resides mostly at low, medium, and high frequencies?
- Is there a difference in the slope on the perceived comfort associated with noise levels when the noise energy resides mostly at low, medium, and high frequencies?
- Is there a difference in the slope on the intelligibility associated with noise levels when the noise energy resides mostly at low, medium, and high frequencies?
We hypothesize that the medium frequency range, where hearing sensitivity is highest and most of the critical information for human speech is contained, exerts the most significant detrimental effects on vocal effort, disturbance, discomfort, and speech intelligibility.
2. Materials and Methods
2.1. Participants
The study included 20 participants aged between 18 and 32 years, with an average age of 22.4 (SD = 3.9). The participants consisted of an equal number of males (10) and females (10). Among them, 17 were native speakers of American English, while three were advanced speakers of American English. Three participants had undergone speech therapy during their childhood, and none reported a history of hearing impairment. All participants provided informed consent to participate in the experiment, which was approved by the Institutional Review Board of the University of Illinois Urbana-Champaign under Protocol No. 18179.
2.2. Room Acoustics and Procedure
The experiment took place in a single-wall soundproof booth. Participants were seated facing a human listener positioned 2.5 m away, simulating a real communication setting. Two directional loudspeakers (KRK Systems studio monitor model Rokit5 G3) were placed 2.5 m from the participants, directed at a 45° angle from the mouth axes. These speakers emitted broadband noises at different frequencies: low frequencies (LF) (20–500 Hz), medium frequencies (MF) (500–4000 Hz), and high frequencies (HF) (4000–20,000 Hz). The spectra of the three types of noise are shown in Figure 1.
A total of twelve conditions were randomly presented and recorded for each participant. Each condition was formed by a unique combination of one of three different frequency ranges and four levels with 10 dB steps (45 dB(A), 55 dB(A), 65 dB(A), and 75 dB(A)). The noise levels were measured using the ears of a Head and Torso Simulator with a Mouth Simulator (HATS, 45BC KEMAR, GRAS, Holte, Denmark) located in the participant’s seat in the booth. The measurements were analyzed using the NTI XL2 Audio and Acoustic Analyzer.
In each condition, participants were asked to read a six-sentence excerpt from the Rainbow passage [24] displayed on a vertical screen in front of them. Following that, the participants’ speech intelligibility was evaluated by having them listen and repeat the sentences of the QuickSin test [25] emitted by a HATS with a normal vocal effort of 60 dB(A) at a distance of 1 m (ISO 9921). The order of the intelligibility test lists and the order of the noise conditions were randomized for each participant. Participants were instructed to speak as if they were talking to the person seated in front of them. The speech was recorded using a measurement microphone placed 15 cm from the speaker’s mouth.
After each noise condition, participants were asked to rate the amount of communication disturbance and vocal comfort they had experienced. They marked their responses on a visual analog scale ranging from “Not at All” to “Extremely,” corresponding numerically to a range of 0 to 100. The following questions were asked:
- Disturbance: How disturbed was your communication by the noise in this condition? (The extremes of the lines were “extremely disturbed” to the left and “not at all disturbed” to the right.)
- Comfort: How comfortable was it to speak in this condition? (The extremes of the lines were “extremely” to the left and “not at all” to the right.)
2.3. Analysis
Speech signal analysis was conducted using MATLAB (R2022a). For each noise condition, the equivalent Sound Pressure Level (SPL) was measured, and the mean SPL value was calculated for each subject. To evaluate the variation in vocal behavior across different noise conditions compared to each subject’s typical vocal behavior (mean SPL value per subject), within-subject centering was performed. This involved subtracting the average SPL among all conditions from each mean SPL value, resulting in a variable termed ΔSPL.
To assess the Voice-to-Noise Ratio (VNR) in the recordings, the distributions of the voice and noise sources were analyzed using Expectation–Maximization (EM) algorithms for Gaussian mixtures [26,27]. The EM algorithms for Gaussian mixtures are iterative statistical techniques used in unsupervised machine learning to estimate the parameters of a mixture model comprising multiple Gaussian distributions. In our case, the distribution of sound levels encompassed a mixture of voice and noise levels. The algorithm estimated the mean values of the two distributions, and the difference between these mean levels provided an estimation of the VNR. The analysis was performed on a time history of the SPL with a time step of 0.05 s, considering the subset of the dataset for each noise condition.
An example of the application of the EM algorithms is shown in Figure 2. In the Figure, a histogram of the SPLs acquired by the microphone with a time step of 0.05 s is shown together with the overall density curve. The EM algorithms estimated the Gaussian mixtures (the green and the red lines) that best fit the overall density curve (black line). In our case, the green Gaussian curve represents the speech levels, while the red Gaussian curve represents the noise levels.
Statistical analysis was carried out using R3.6.0 software and the lme4 package (version 1.1–10) [28]. Linear mixed-effects models were fitted to the response variables ΔSPL, self-reported disturbance, self-reported vocal discomfort, and intelligibility scores (IS), with predictors including the noise level (Ln) (dBA), the type of noise (LF, MF, and HF), and their interaction. The listener ID was treated as a random factor. Participants reported their level of communication disturbance and discomfort by marking a visual analog scale. The score was obtained by measuring the distance between the left end of the line and the mark and then converting it to a percentage ranging from 0 (no disturbance or discomfort) to 100 (maximum disturbance or discomfort). Intelligibility scores were measured as the percentage of words correctly identified from the QuickSin test for each acoustic condition. The models’ output included estimates of the fixed effects coefficients, the associated standard error, the test statistic (t), and the p-value.
3. Results
A total of 20 participants (10 males and 10 females) were tested by reading the Rainbow passage and repeating sentences pronounced by the HATS in 12 different noise conditions (comprising three frequency ranges and four levels). Initially, the Voice-to-Noise Ratio (VNR) in the recordings was evaluated. The average VNR across the various noise conditions was found to be 11.4 dB, with a standard deviation of 3.6 dB. This result indicates that the impact of noise on the equivalent level was negligible.
The model results for ΔSPL and Ln are presented in Table 1, while the relationship between ΔSPL, grouped by noise frequency content, is depicted in Figure 3. The model demonstrated a statistically significant association between ΔSPL and Ln, with ΔSPL increasing as Ln increased across all frequency ranges. Regarding the effect of noise type, there was a significant difference between the intercepts of the models for MF and LF, although the difference between the slopes was not significant. The intercepts of the regression models for MF and HF were not significantly different, while the difference between the slopes approached statistical significance, with the slope for MF noise being 0.05 dB/dB higher.
The model results for self-reported disturbance in communication and Ln are presented in Table 2, and the relationship between disturbance and Ln, grouped by noise frequency content, is illustrated in Figure 4. The model revealed a statistically significant relationship between disturbance and Ln, with disturbance increasing as Ln increased across all frequency ranges. Regarding the effect of noise type, there was no significant difference between the intercepts of the models for MF and LF, but the difference between the slopes approached statistical significance, with the slope for MF noise being 0.48 dB/dB higher. The regression models for MF and HF noise were significantly different in both intercepts and slopes. Specifically, the model for HF had a higher intercept and a smaller slope compared to the model for MF.
The model results for self-reported comfort in communication and Ln are shown in Table 3, and the relationship between comfort and Ln, grouped by noise frequency content, is presented in Figure 5. The model indicated a statistically significant relationship between comfort and Ln, with comfort decreasing as Ln increased across all frequency ranges. Concerning the effect of the noise type, there was a statistically significant difference between the intercepts and slopes of both the models for MF and LF, as well as MF and HF. In particular, the model for MF had a slope of 1.06 dB/dB higher compared to the model for LF and 1.20 dB/dB higher compared to the model for MF.
The model results for Intelligibility Scores (IS) and Ln are provided in Table 4, and the relationship between IS, grouped by noise frequency content, is depicted in Figure 6. The model demonstrated a statistically significant relationship between IS and Ln, with IS decreasing as Ln increased across all frequency ranges. Concerning the effect of noise type, there was a statistically significant difference between the intercepts and slopes of the models for MF and LF, as well as MF and HF. Specifically, the model for MF had a slope of 2.17%/dB higher compared to the model for LF, and 2.35%/dB higher compared to the model for MF.
4. Discussion and Conclusions
This study aimed to examine the impact of broadband noise at different frequency ranges and levels on the Lombard effect, perceived communication disturbance and vocal comfort, and speech intelligibility. The findings support the hypothesis that as background noise increases, vocal level and communication disturbance increases, while comfort and intelligibility decreases. Specifically, the study hypothesized that medium-frequency noise would have the greatest effect on vocal effort, disturbance discomfort, and speech intelligibility.
The results confirmed that medium-frequency noise led to the highest increase in vocal level, perceived disturbance, and discomfort, as well as the most significant decrease in speech intelligibility. Although the rate of vocal increase was comparable between low-frequency and medium-frequency noise, low-frequency noise generated lower sound pressure levels (SPL), indicating lower vocal effort. This suggests that participants increased their vocal level to a similar extent with increasing noise, but the level used in response to medium-frequency noise was higher. High-frequency noise required a vocal effort similar to that of medium frequencies at low noise levels but with a less steep slope compared to medium-frequency conditions. This can be attributed to the fact that the medium-frequency range is where hearing sensitivity is highest and where the speech signal is most intense.
In terms of disturbance caused by increasing noise levels, this study found the greatest increase in communication disturbance with medium-frequency noise. While medium frequencies showed similar perceived disturbance to high-frequency noise at the lowest level (45 dB), the disturbance increased significantly faster with medium-frequency noise as the level increased. The growth rate of disturbance for low and medium frequencies approached statistical significance, with medium frequencies exhibiting a slightly higher rate. However, the communication disturbance generated by medium-frequency noise was on average 30% higher across all levels considered (45–75 dBA).
Regarding comfort, low- and high-frequency noises had minimal effects on vocal comfort, showing a weak slope compared to medium-frequency noise. In contrast, medium-frequency noise resulted in a steep negative slope. When the noise level was lowest, the perceived comfort in speaking in that environment was high, but it decreased significantly (by about 60%) as the noise level increased. The disturbance and discomfort results can be attributed to the fact that when the frequency range essential for speech perception is masked, listeners perceive greater disturbance in listening to speech and lower comfort in producing speech.
Regarding speech intelligibility, the findings confirmed the sensitivity range of human hearing [21]. The range of 500–4000 Hz, which contains most of the information in human speech, overlaps with the energetic content of the medium-frequency noise used in the study. In conditions with medium-frequency noise, speech intelligibility decreased dramatically with increasing noise levels, dropping from approximately 80% of speech correctly understood at a 45 dB noise level to about 5% at the highest level. On the other hand, low- and high-frequency noises had minimal impact on speech intelligibility, with nearly flat slopes. Both types of noise maintained high intelligibility even at the highest noise level. Notably, speech intelligibility in the presence of high-frequency noise was hardly affected by increasing noise levels. This suggests that 45 dBA of high-frequency noise is sufficient to mask the high-frequency content of the speech spectrum when participants maintained a normal vocal effort of 60 dBA at a one-meter distance in an anechoic condition.
In conclusion, the findings revealed distinct patterns for each frequency range.
In terms of the Lombard effect, the medium-frequency noise exhibited the highest increase in sound pressure level (SPL) as the background noise level increased. Participants displayed a lower SPL response, indicating lower vocal effort, with low-frequency noise. Moreover, the rate of vocal increase was smaller for low-frequency noise compared to the other types of noise. High-frequency noise led to a similar vocal effort as medium frequencies at low noise levels but with a less steep slope as the noise level increased.
Regarding speech intelligibility, this study demonstrated that increasing noise with medium-frequency content had the most significant and rapid negative impact on intelligibility. In contrast, low-frequency and high-frequency noise had minimal effects on speech intelligibility, with only minor changes observed as the noise level increased.
These results highlight the frequency-specific nature of the Lombard effect, communication disturbance, vocal comfort, and speech intelligibility. Medium-frequency noise had the most pronounced influence on vocal responses and communication outcomes, while low- and high-frequency noise had relatively minor effects. These findings contribute to our understanding of how different frequency ranges impact speech-related behaviors in the presence of background noise.
Author Contributions
Conceptualization, P.B.; methodology, P.B.; validation, P.B. and S.M.; formal analysis, P.B. and S.M.; investigation, P.B. and S.M.; writing—original draft preparation, P.B. and S.M.; writing—review and editing, P.B. and S.M.; visualization, P.B. and S.M.; supervision, P.B. and S.M.; project administration, P.B. and S.M. All authors have read and agreed to the published version of the manuscript.
Funding
This research received no external funding.
Data Availability Statement
The data presented in this study are available on request from the corresponding author. The data are not publicly available due to privacy.
Acknowledgments
The authors would like to thank Corrie Penrod and Anna Latham for their valuable help in collecting the data and all the participants for their kind cooperation and interest in the study.
Conflicts of Interest
The authors declare no conflict of interest.
References
- Ludlow, C.L.; Cikoja, D.B. Is there a self-monitoring speech perception system? J. Commun. Disord. 1998, 31, 505–510. [Google Scholar] [CrossRef] [PubMed]
- Lombard, E. Le signe de l’elevation de la voix. Ann. Maladies Orielle Larynx Nez Pharynx 1911, 37, 101–119. [Google Scholar]
- Lane, H.; Tranel, B. The Lombard Sign and the Role of Hearing in Speech. J. Speech Lang. Heart Res. 1971, 14, 677–709. [Google Scholar] [CrossRef]
- Lazarus, H. Prediction of Verbal Communication is Noise—A review: Part 1. Appl. Acoust. 1986, 19, 439–464. [Google Scholar] [CrossRef]
- Lazarus, H. New methods for describing and assessing direct speech communication under disturbing conditions. Environ. Int. 1990, 16, 373–392. [Google Scholar] [CrossRef]
- Kryter, K.D. Effects of Ear Protective Devices on the Intelligibility of Speech in Noise. J. Acoust. Soc. Am. 1946, 18, 413–417. [Google Scholar] [CrossRef]
- Egan, J.J. Psychoacoustics of the Lombard voice response. J. Aud. Res. 1972, 12, 318–324. [Google Scholar]
- Van Summers, W.; Pisoni, D.B.; Bernacki, R.H.; Pedlow, R.I.; Stokes, M.A. Effects of noise on speech production: Acoustic and perceptual analyses. J. Acoust. Soc. Am. 1988, 84, 917–928. [Google Scholar] [CrossRef]
- Junqua, J.-C. The influence of acoustics on speech production: A noise-induced stress phenomenon known as the Lombard reflex. Speech Commun. 1996, 20, 13–22. [Google Scholar] [CrossRef]
- Södersten, M.; Ternström, S.; Bohman, M. Loud Speech in Realistic Environmental Noise: Phonetogram Data, Perceptual Voice Quality, Subjective Ratings, and Gender Differences in Healthy Speakers. J. Voice 2005, 19, 29–46. [Google Scholar] [CrossRef]
- Ternström, S.; Bohman, M.; Södersten, M. Loud speech over noise: Some spectral attributes, with gender differences. J. Acoust. Soc. Am. 2006, 119, 1648–1665. [Google Scholar] [CrossRef]
- Garnier, M.; Henrich, N. Speaking in noise: How does the Lombard effect improve acoustic contrasts between speech and ambient noise? Comput. Speech Lang. 2014, 28, 580–597. [Google Scholar] [CrossRef]
- ISO Standard No. 9921:2003; Ergonomics—Assessment of Speech Communication. International Organization for Standardization: Geneva, Switzerland, 2003. Available online: https://www.iso.org/standard/33589.html (accessed on 3 September 2022).
- Korn, T.S. Effect of Psychological Feedback on Conversational Noise Reduction in Rooms. J. Acoust. Soc. Am. 1954, 26, 793–794. [Google Scholar] [CrossRef]
- Gardner, M.B. Effect of Noise, System Gain, and Assigned Task on Talking Levels in Loudspeaker Communication. J. Acoust. Soc. Am. 1966, 40, 955–965. [Google Scholar] [CrossRef]
- Bottalico, P.; Passione, I.I.; Graetzer, S.; Hunter, E. Evaluation of the Starting Point of the Lombard Effect. Acta Acust. United Acust. 2017, 103, 169–172. [Google Scholar] [CrossRef] [PubMed]
- Lane, H.; Tranel, B.; Sisson, C. Regulation of Voice Communication by Sensory Dynamics. J. Acoust. Soc. Am. 1970, 47, 618–624. [Google Scholar] [CrossRef]
- Maniaci, A.; Lechien, J.R.; Caruso, S.; Nocera, F.; Ferlito, S.; Iannella, G.; Grillo, C.M.; Magliulo, G.; Pace, A.; Vicini, C.; et al. Voice-Related Quality of Life After Total Laryngectomy: Systematic Review and Meta-Analysis. J. Voice 2021. [Google Scholar] [CrossRef]
- Garnier, M.; Henrich, N.; Dubois, D. Influence of Sound Immersion and Communicative Interaction on the Lombard Effect. J. Speech, Lang. Heart Res. 2010, 53, 588–608. [Google Scholar] [CrossRef]
- French, N.R.; Steinberg, J.C. Factors Governing the Intelligibility of Speech Sounds. J. Acoust. Soc. Am. 1947, 19, 90–119. [Google Scholar] [CrossRef]
- Fletcher, H.; Munson, W.A. Loudness, Its Definition, Measurement and Calculation. Bell Syst. Tech. J. 1933, 12, 377–430. [Google Scholar] [CrossRef]
- Purves, D.; Augustine, G.J.; Fitzpatrick, D.; Hall, W.; LaMantia, A.S.; White, L. Neurosciences, 6th ed.; De Boeck Supérieur: Paris, France, 2019. [Google Scholar]
- Stowe, L.M.; Golob, E.J. Evidence that the Lombard effect is frequency-specific in humans. J. Acoust. Soc. Am. 2013, 134, 640–647. [Google Scholar] [CrossRef]
- Fairbanks, G. Voice and Articulation Drillbook, 2nd ed.; Harper & Row: New York, NY, USA, 1960; pp. 124–139. [Google Scholar]
- Killion, M.C.; Niquette, P.A.; Gudmundsen, G.I.; Revit, L.J.; Banerjee, S. Development of a quick speech-in-noise test for measuring signal-to-noise ratio loss in normal-hearing and hearing-impaired listeners. J. Acoust. Soc. Am. 2004, 116, 2395–2405. [Google Scholar] [CrossRef] [PubMed]
- D’orazio, D.; De Salvio, D.; Anderlucci, L.; Garai, M. Measuring the speech level and the student activity in lecture halls: Visual- vs blind-segmentation methods. Appl. Acoust. 2020, 169, 107448. [Google Scholar] [CrossRef]
- De Salvio, D.; D’Orazio, D.; Garai, M. Unsupervised analysis of background noise sources in active offices. J. Acoust. Soc. Am. 2021, 149, 4049–4060. [Google Scholar] [CrossRef] [PubMed]
- Bates, D.; Mächler, M.; Bolker, B.; Walker, S. Fitting Linear Mixed-Effects Models Using lme4. J. Stat. Softw. 2015, 67, 48. [Google Scholar] [CrossRef]
Figure 1.
Spectra of the three types of noise with low, medium, and high energetic content.
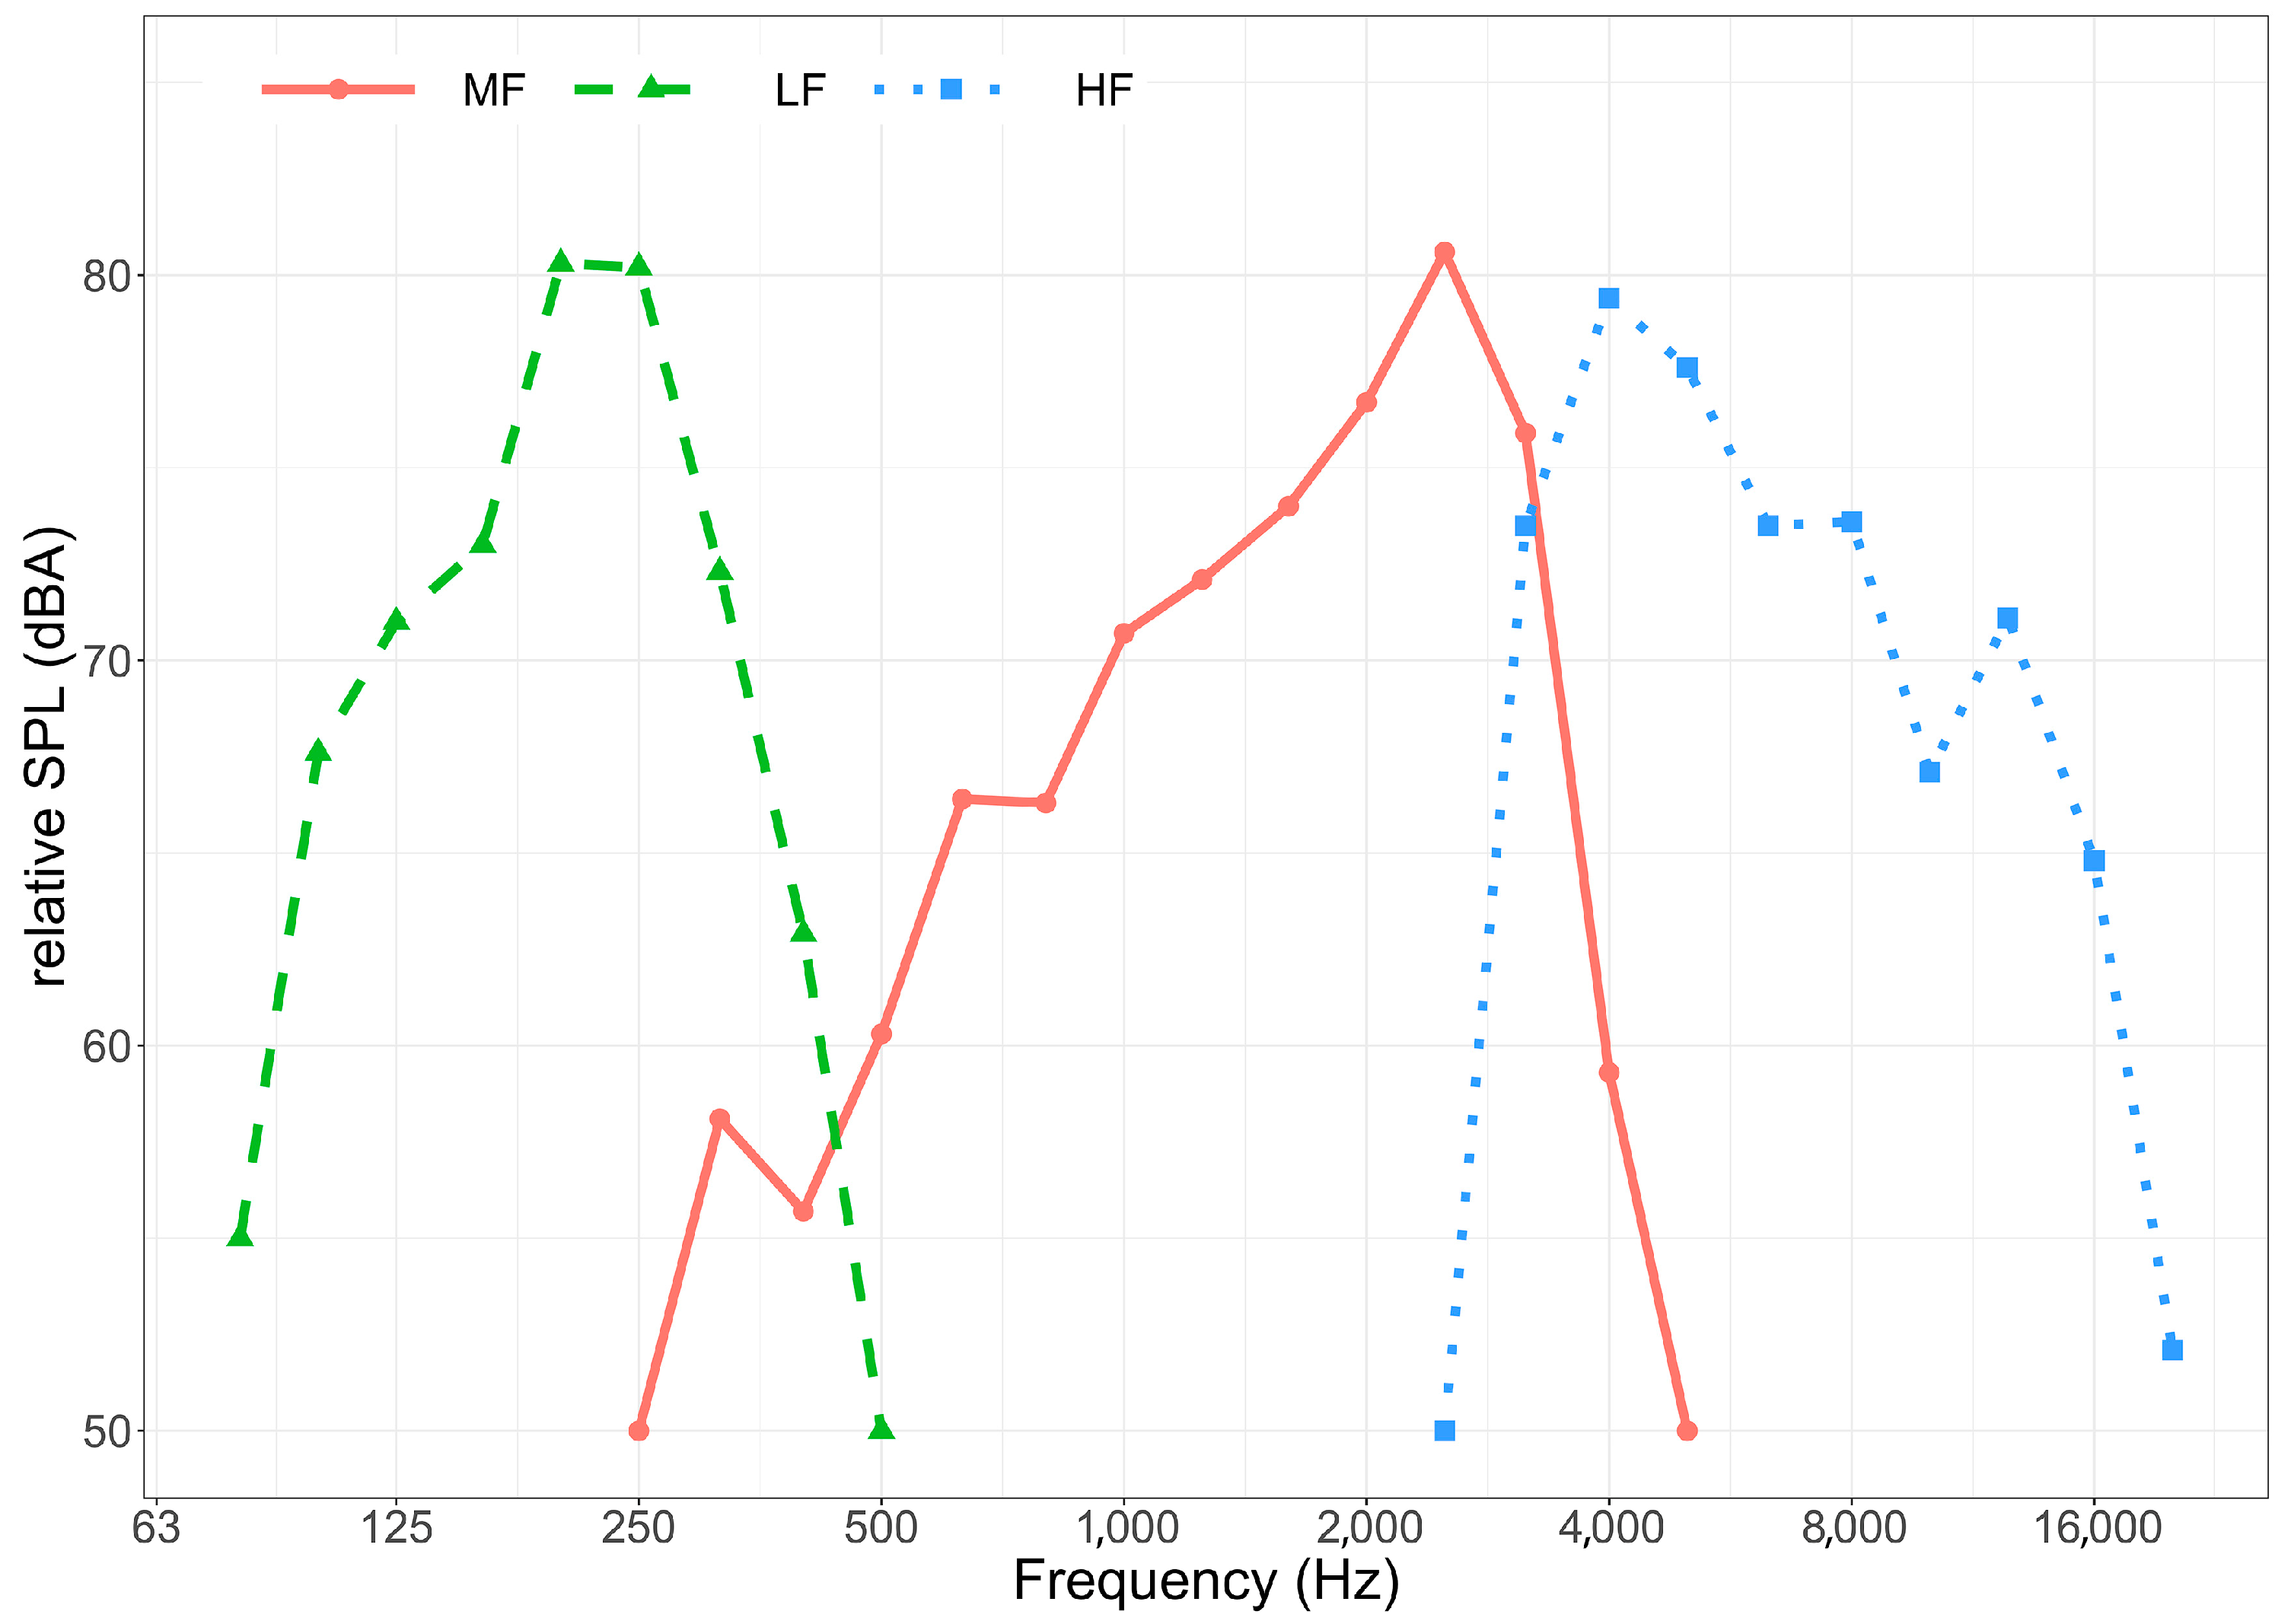
Figure 2.
Example of the EM algorithms for Gaussian mixtures. The green curve represents the gaussian distribution of the speech levels, while the red curve represents the gaussian distribution of the noise levels.
Figure 2.
Example of the EM algorithms for Gaussian mixtures. The green curve represents the gaussian distribution of the speech levels, while the red curve represents the gaussian distribution of the noise levels.

Figure 3.
Regression lines from the model between Ln and ΔSPL. The results are grouped by frequency energetic contents, and the shaded regions indicate ± confidence interval.
Figure 3.
Regression lines from the model between Ln and ΔSPL. The results are grouped by frequency energetic contents, and the shaded regions indicate ± confidence interval.
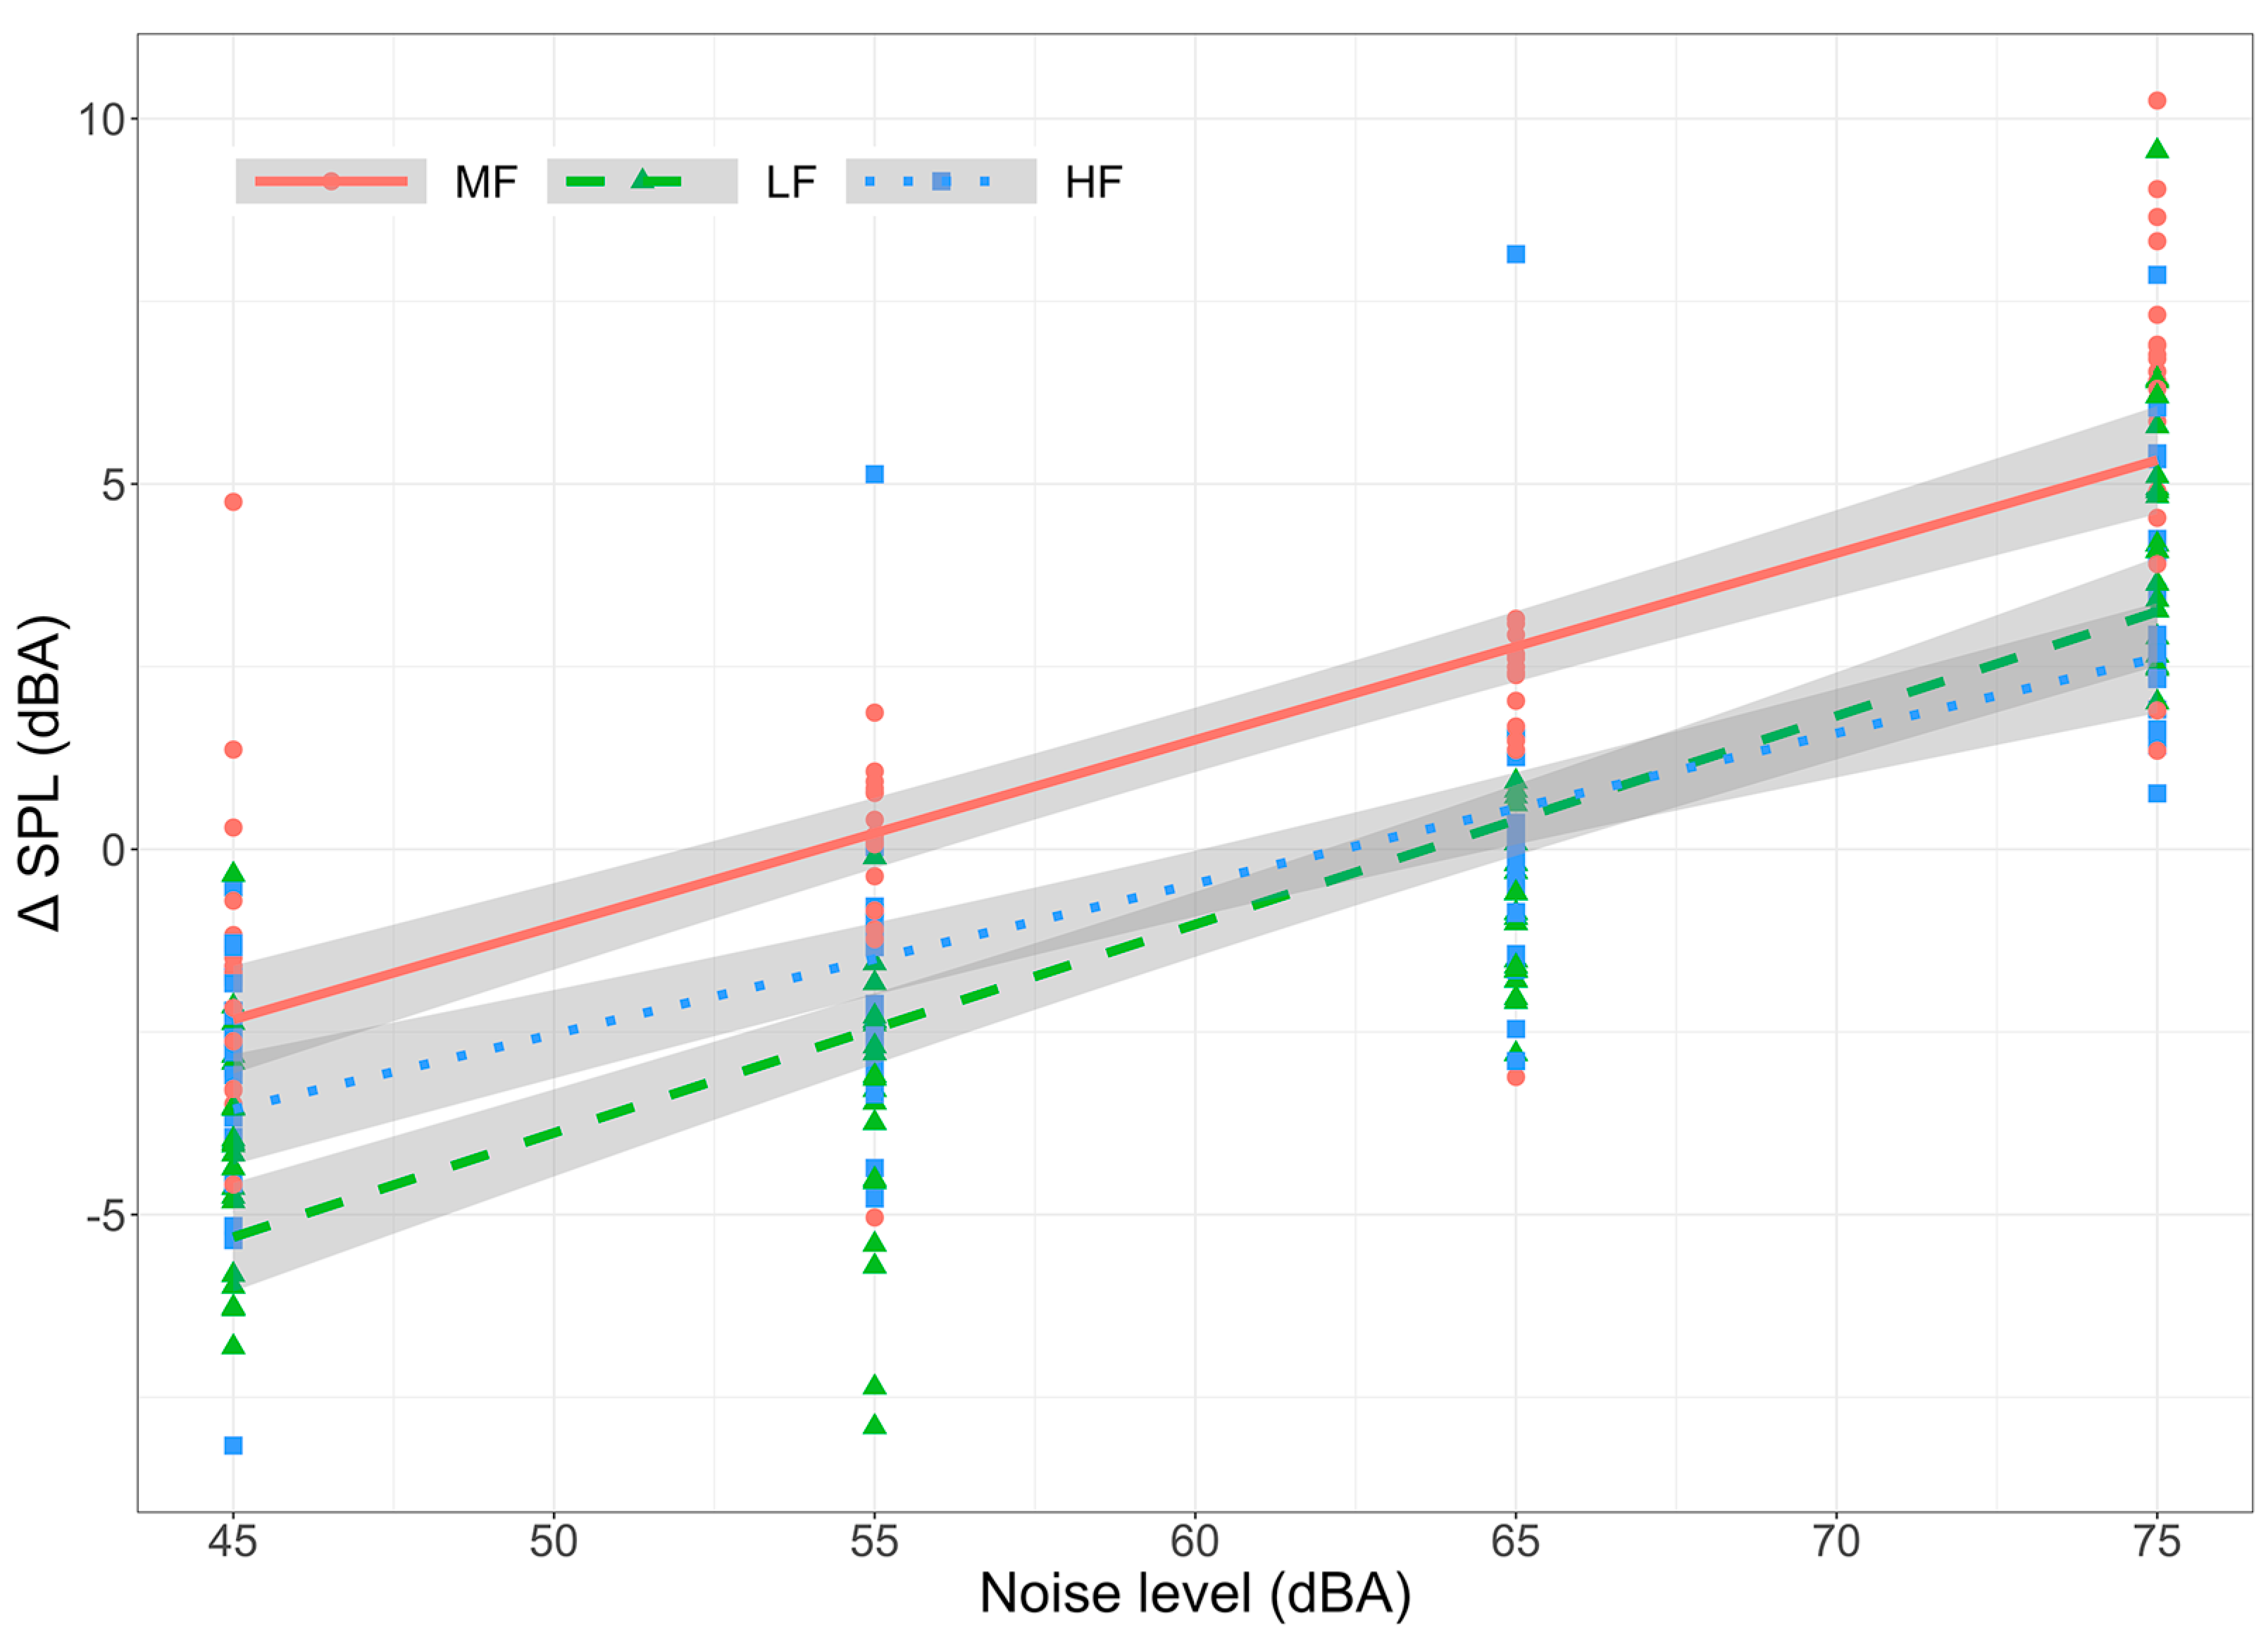
Figure 4.
Regression lines from the model between Ln and intelligibility. The results are grouped by frequency energetic contents, and the shaded regions indicate ± confidence interval.
Figure 4.
Regression lines from the model between Ln and intelligibility. The results are grouped by frequency energetic contents, and the shaded regions indicate ± confidence interval.
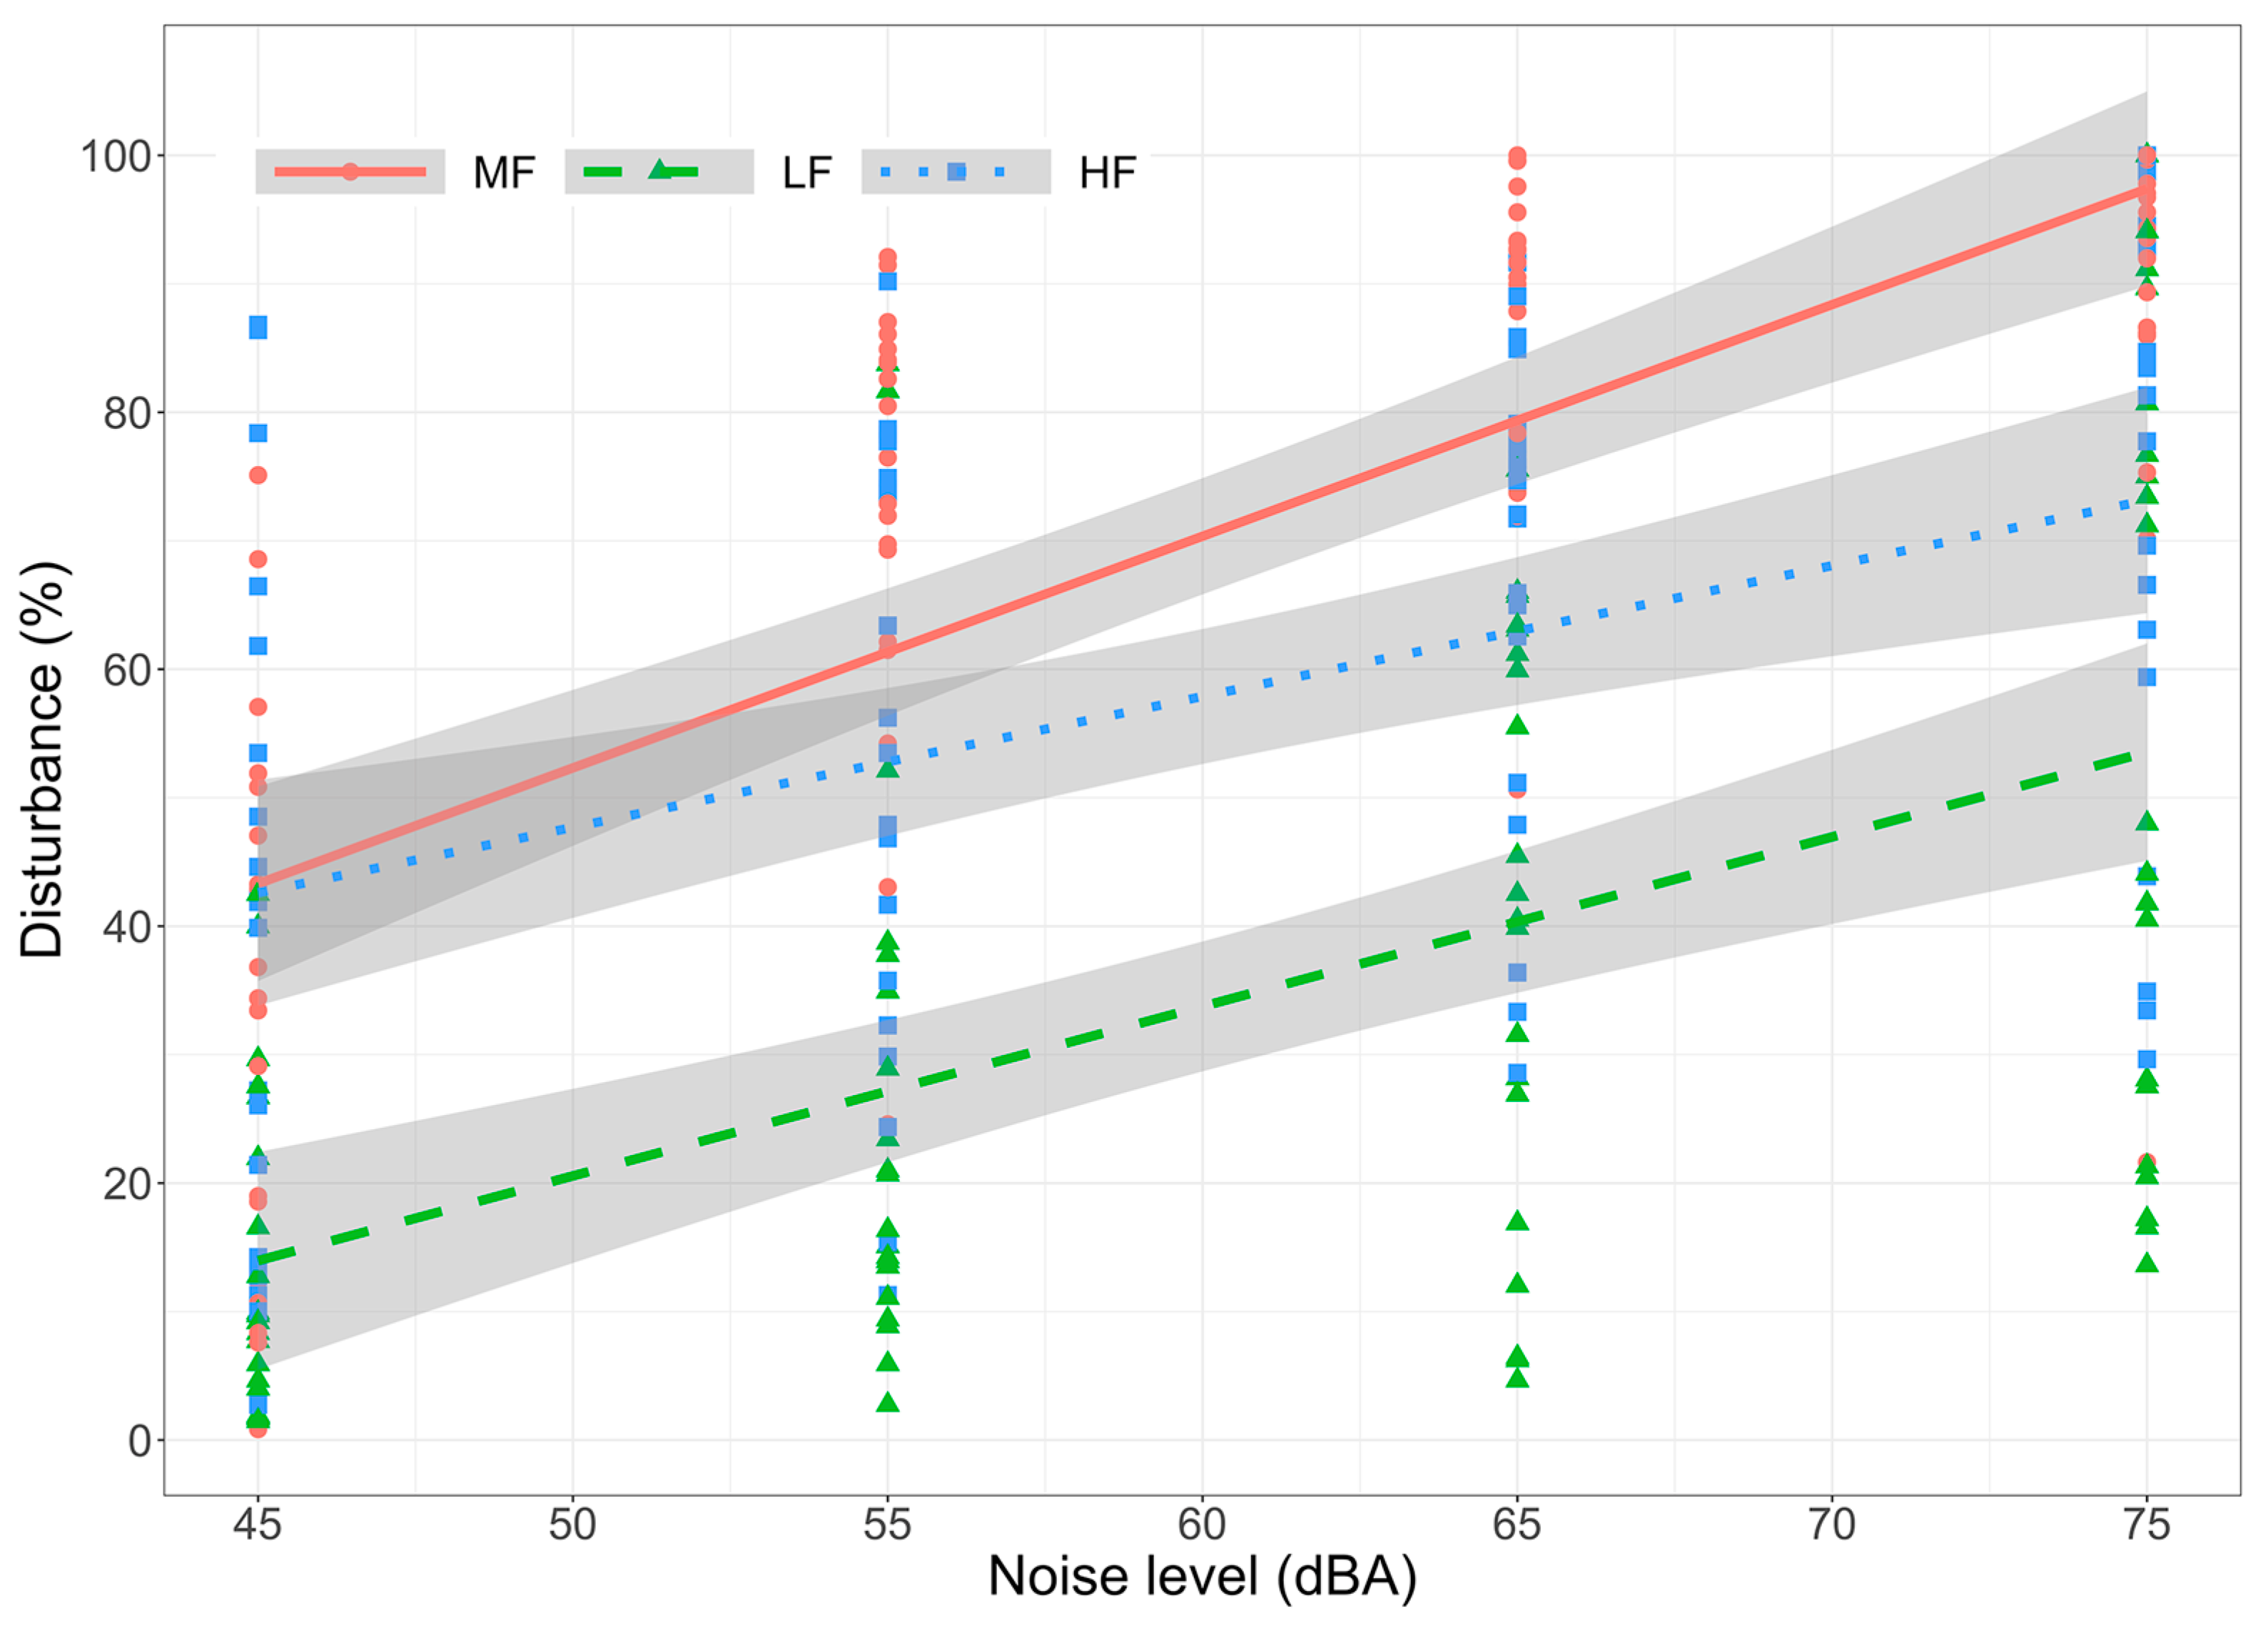
Figure 5.
Regression lines from the model between Ln and disturbance. The results are grouped by frequency energetic contents, and the shaded regions indicate ± confidence interval.
Figure 5.
Regression lines from the model between Ln and disturbance. The results are grouped by frequency energetic contents, and the shaded regions indicate ± confidence interval.
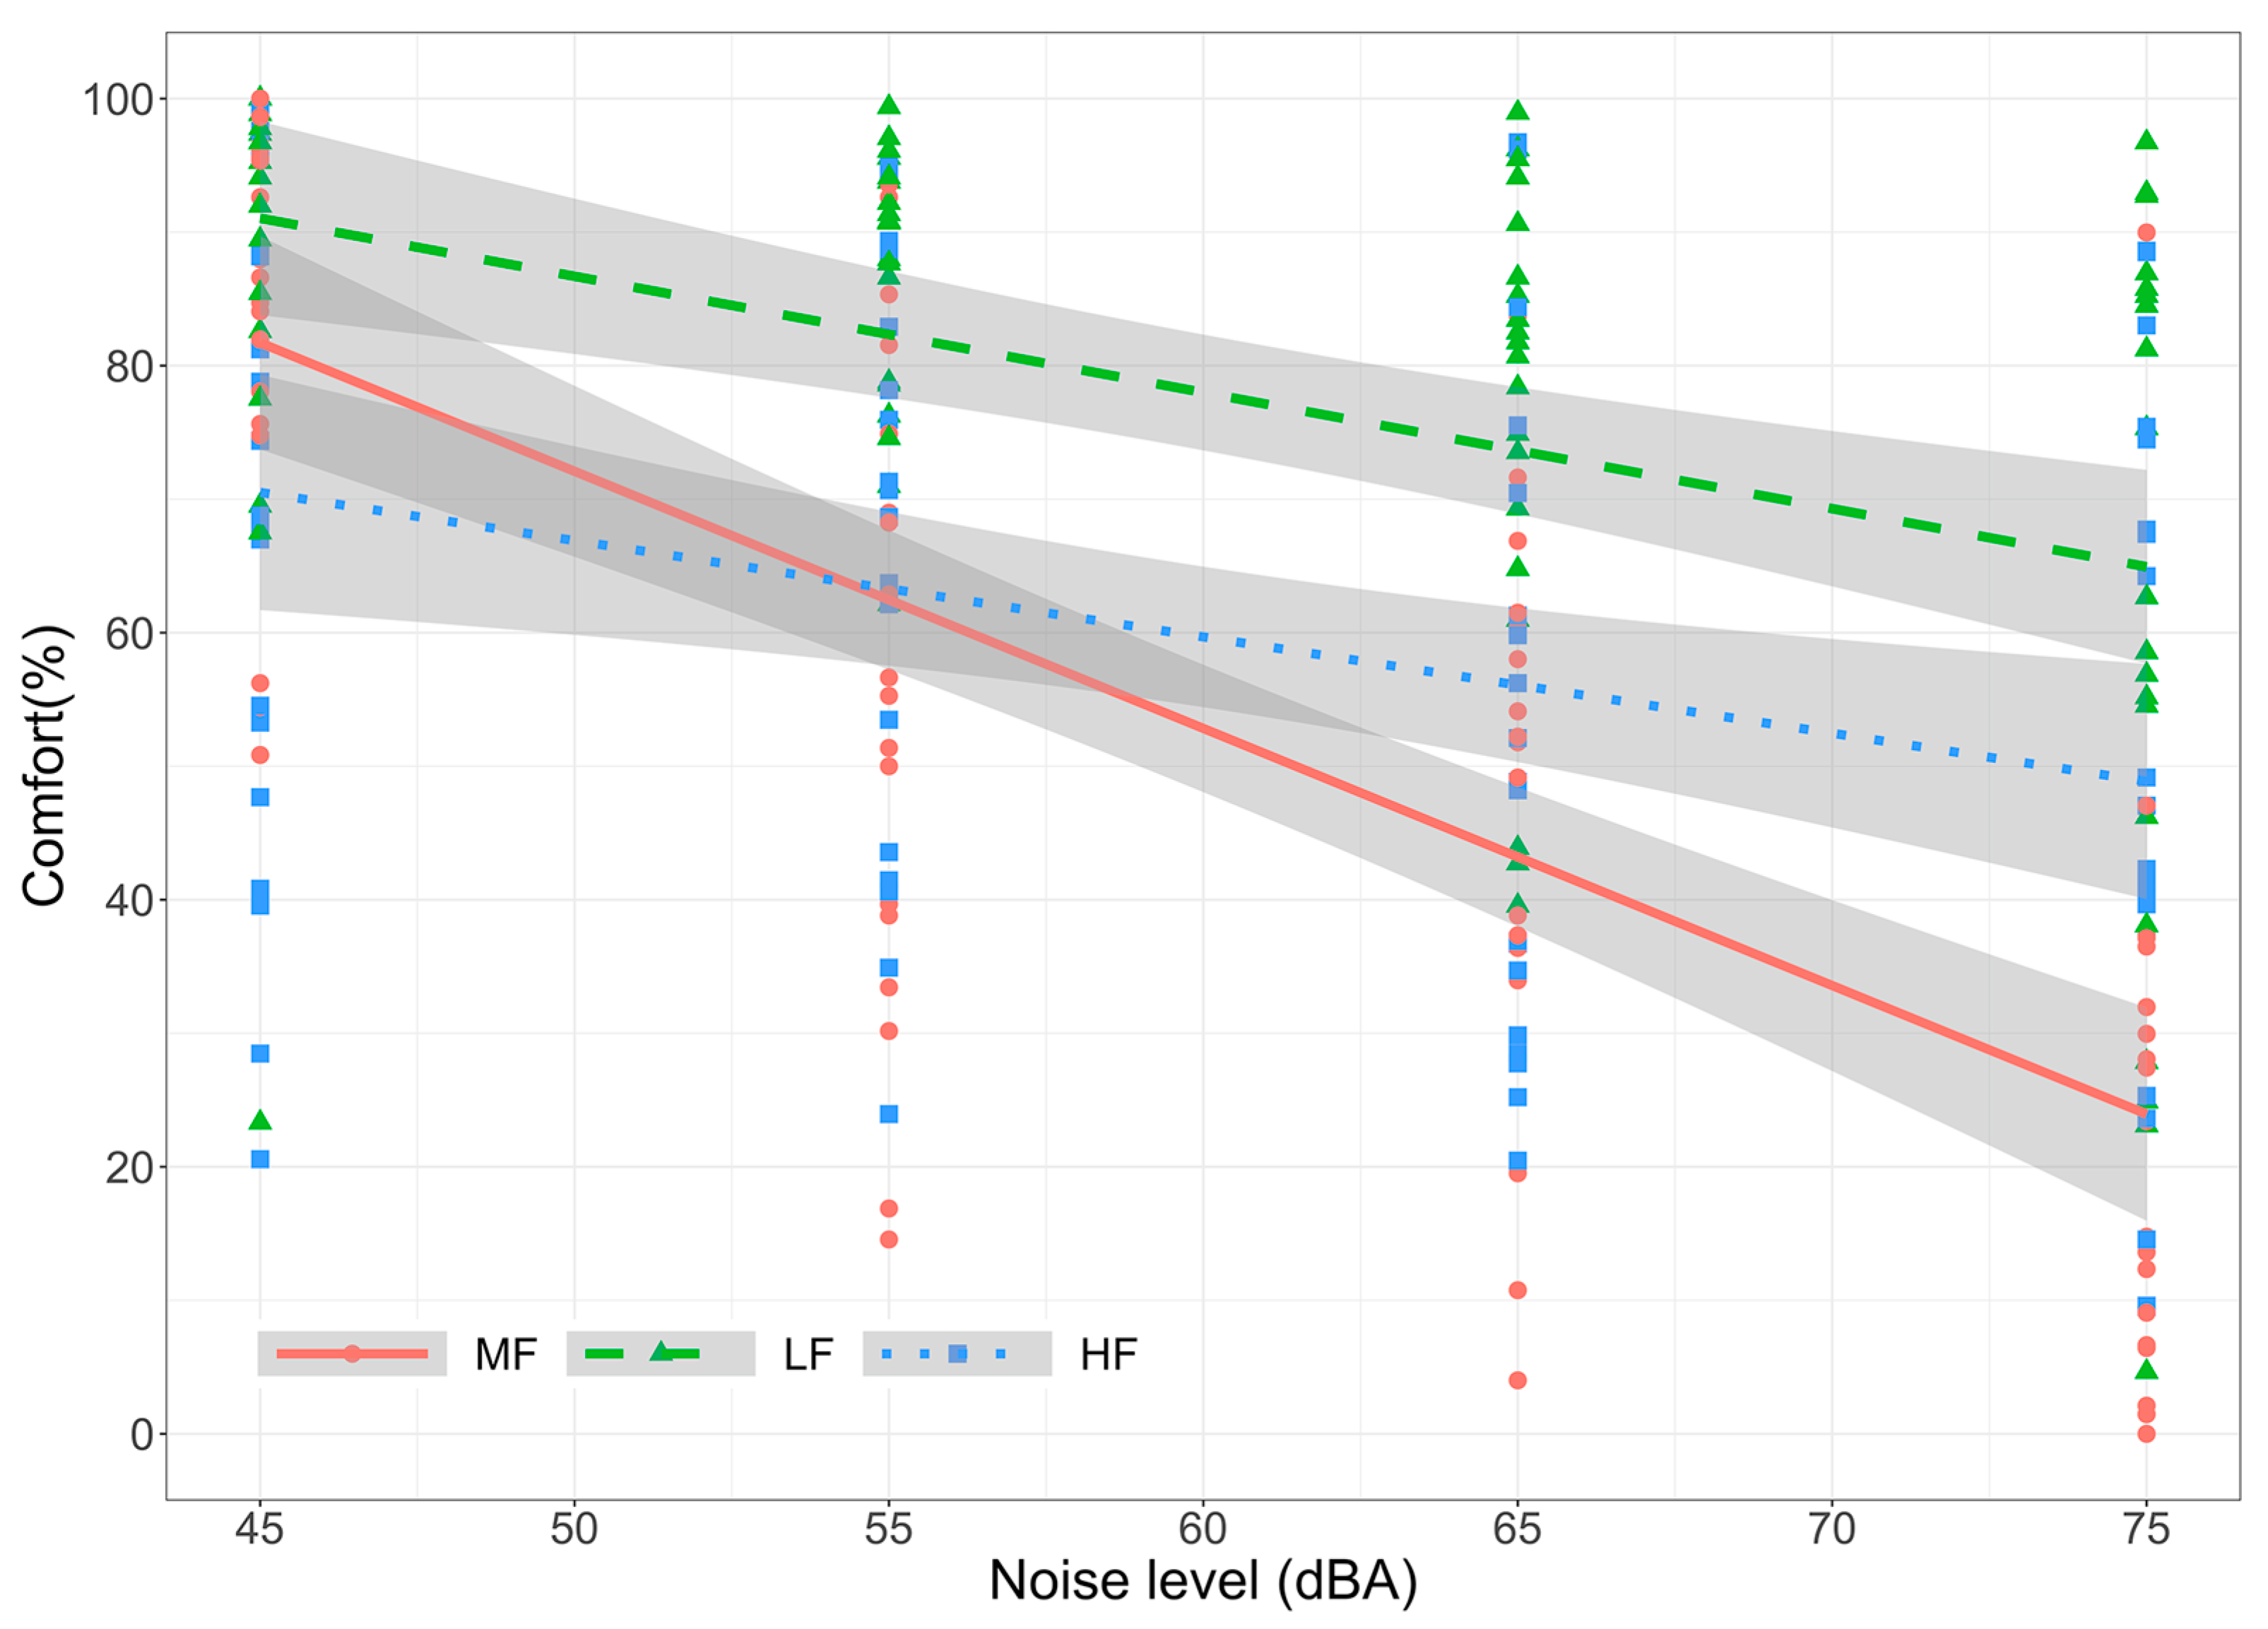
Figure 6.
Regression lines from the model between Ln and comfort. The results are grouped by frequency energetic contents, and the shaded regions indicate ± confidence interval.
Figure 6.
Regression lines from the model between Ln and comfort. The results are grouped by frequency energetic contents, and the shaded regions indicate ± confidence interval.


Table 1.
Linear mixed effect model for response variable ΔSPL. The interaction between Ln and Frequency range was considered a fixed factor. Significance codes for the p-values: *** < 0.001, * < 0.05.
Table 1.
Linear mixed effect model for response variable ΔSPL. The interaction between Ln and Frequency range was considered a fixed factor. Significance codes for the p-values: *** < 0.001, * < 0.05.
| ΔSPL (dBA) | Estimate | Std. Error | t Value | p-Value | |
|---|---|---|---|---|---|
| (Intercept) | −13.82 | 1.22 | −11.30 | <0.001 | *** |
| Ln_dBA | 0.26 | 0.02 | 12.74 | <0.001 | *** |
| Frequency_rangeLF | −4.33 | 1.73 | −2.51 | 0.013 | * |
| Frequency_rangeHF | 0.99 | 1.73 | 0.57 | 0.567 | |
| Ln_dBA: Frequency_rangeLF | 0.03 | 0.03 | 1.06 | 0.289 | |
| Ln_dBA: Frequency_rangeHF | −0.05 | 0.03 | −1.74 | 0.083 | |
Table 2.
Linear mixed effect model for response variable disturbance. The interaction between Ln and Frequency range was considered a fixed factor. Significance codes for the p-values: *** < 0.001, ** < 0.01, * < 0.05.
Table 2.
Linear mixed effect model for response variable disturbance. The interaction between Ln and Frequency range was considered a fixed factor. Significance codes for the p-values: *** < 0.001, ** < 0.01, * < 0.05.
| Disturbance (%) | Estimate | Std. Error | t Value | p-Value | |
|---|---|---|---|---|---|
| (Intercept) | −37.83 | 11.78 | −3.21 | 0.002 | ** |
| Ln_dBA | 1.80 | 0.19 | 9.60 | <0.001 | *** |
| Frequency_rangeLF | −7.58 | 16.21 | −0.47 | 0.641 | |
| Frequency_rangeHF | 34.60 | 16.21 | 2.13 | 0.034 | * |
| Ln_dBA: Frequency_rangeLF | −0.48 | 0.27 | −1.82 | 0.070 | |
| Ln_dBA: Frequency_rangeHF | −0.78 | 0.27 | −2.95 | 0.003 | ** |
Table 3.
Linear mixed effect model for response variable Comfort. The interaction between Ln and Frequency range was considered a fixed factor. Significance codes for the p-values: *** < 0.001, * < 0.05.
Table 3.
Linear mixed effect model for response variable Comfort. The interaction between Ln and Frequency range was considered a fixed factor. Significance codes for the p-values: *** < 0.001, * < 0.05.
| Comfort (%) | Estimate | Std. Error | t Value | p-Value | |
|---|---|---|---|---|---|
| (Intercept) | 168.37 | 11.65 | 14.46 | <0.001 | *** |
| Ln_dBA | −1.93 | 0.19 | −10.32 | <0.001 | *** |
| Frequency_rangeLF | −38.18 | 16.10 | −2.37 | 0.0186 | * |
| Frequency_rangeHF | −65.40 | 16.10 | −4.06 | <0.001 | *** |
| Ln_dBA: Frequency_rangeLF | 1.06 | 0.26 | 4.00 | <0.001 | *** |
| Ln_dBA: Frequency_rangeHF | 1.20 | 0.26 | 4.57 | <0.001 | *** |
Table 4.
Linear mixed effect model (binomial family) for response variables IS. The interaction between Ln and Frequency range was considered a fixed factor. Listener ID was considered a random factor. Significance codes for the p-values: *** < 0.001.
Table 4.
Linear mixed effect model (binomial family) for response variables IS. The interaction between Ln and Frequency range was considered a fixed factor. Listener ID was considered a random factor. Significance codes for the p-values: *** < 0.001.
| Intelligibility (%) | Estimate | Std. Error | t Value | p-Value | |
|---|---|---|---|---|---|
| (Intercept) | 206.13 | 7.50 | 27.49 | <0.001 | *** |
| Ln_dBA | −2.66 | 0.11 | −23.21 | <0.001 | *** |
| Frequency_rangeLF | −85.03 | 9.90 | −8.58 | <0.001 | *** |
| Frequency_rangeHF | −107.30 | 9.90 | −10.83 | <0.001 | *** |
| Ln_dBA: Frequency_rangeLF | 2.17 | 0.16 | 13.34 | <0.001 | *** |
| Ln_dBA: Frequency_rangeHF | 2.35 | 0.16 | 14.46 | <0.001 | *** |
Disclaimer/Publisher’s Note: The statements, opinions and data contained in all publications are solely those of the individual author(s) and contributor(s) and not of MDPI and/or the editor(s). MDPI and/or the editor(s) disclaim responsibility for any injury to people or property resulting from any ideas, methods, instructions or products referred to in the content. |
© 2023 by the authors. Licensee MDPI, Basel, Switzerland. This article is an open access article distributed under the terms and conditions of the Creative Commons Attribution (CC BY) license (https://creativecommons.org/licenses/by/4.0/).
Share and Cite
MDPI and ACS Style
Bottalico, P.; Murgia, S. The Effect of the Frequency and Energetic Content of Broadband Noise on the Lombard Effect and Speech Intelligibility. Acoustics 2023, 5, 898-908. https://doi.org/10.3390/acoustics5040052
AMA Style
Bottalico P, Murgia S. The Effect of the Frequency and Energetic Content of Broadband Noise on the Lombard Effect and Speech Intelligibility. Acoustics. 2023; 5(4):898-908. https://doi.org/10.3390/acoustics5040052
Chicago/Turabian StyleBottalico, Pasquale, and Silvia Murgia. 2023. "The Effect of the Frequency and Energetic Content of Broadband Noise on the Lombard Effect and Speech Intelligibility" Acoustics 5, no. 4: 898-908. https://doi.org/10.3390/acoustics5040052