Inferring Drumhead Damping and Tuning from Sound Using Finite Difference Time Domain (FDTD) Models


1
Department of Music Technology and Acoustics, Hellenic Mediterranean University, 74133 Rethymno, Greece
2
Department of Electrical and Computer Engineering, University of Peloponnese, 26334 Patras, Greece
3
Institute of Systematic Musicology, University of Hamburg, 20354 Hamburg, Germany
*
Author to whom correspondence should be addressed.
Acoustics 2023, 5(3), 798-816; https://doi.org/10.3390/acoustics5030047
Submission received: 29 June 2023
/
Revised: 3 August 2023
/
Accepted: 15 August 2023
/
Published: 23 August 2023
Abstract
:Percussionists use a multitude of objects and materials, mounted on their instruments, to achieve a satisfying sound texture. This is a tedious process as there are no guidelines suggesting how to manipulate a percussion instrument to adjust its perceptual characteristics in the desired direction. To this end, the article presents a methodology for computationally identifying how to damp and tune a drumhead by adjusting its mass distribution, e.g., by applying malleable paste on its surface. A dataset of 11,114 sounds has been synthesized using a FDTD solution of the wave equation representing the vibration of a membrane, which is being transmuted through the application of paste. These sounds are investigated to derive conclusions concerning their spectral characteristics and data reduction techniques are used to investigate the feasibility of computationally inferring damping parameters for a given sound. Furthermore, these sounds are used to train a Convolutional Neural Network to infer mass distribution from sound. Results show that computational approaches can provide valuable information to percussionists striving to adjust their personal sound. Although this study has been performed with synthesized sounds, the research methodology presents some inspiring ideas for future investigations with prerecorded sounds.
1. Introduction
Recent years have witnessed a revival of research interest in inverse acoustic problems, specifically those estimating causal factors that determine the sound generated by diverse objects, materials, sceneries, and environments. This revival can be attributed to the proliferation of high-performance computing facilities and the remarkable performance of deep learning methodologies. Illustrative instances of this trend are provided across various domains of industrial product development, encompassing areas such as urban planning [1], architectural acoustics [2], mechanical acoustics [3], underwater acoustics [4], and, more pertinent to this study, musical acoustics. In the process of designing and manufacturing musical instruments, a prominent concern relates to identifying geometries and materials capable of producing a desired sound texture. This is extremely challenging for musical sounds, as the perception of musical timbre is profoundly influenced by intricate geometrical and material characteristics of the sound-producing object. Moreover, deliberate motor–sensory interactions between performers and their instruments have a significant impact on the perceived sound quality.
The investigation of musical instrument timbre through machine learning methodologies is a well-established research approach. For example, musical instrument classification and recognition in single or multiple instrument performance recordings is a well-known algorithmic task in Music Information Retrieval [5]. However, the use of machine learning for the analysis of the vibroacoustic behavior of musical instruments is only found in more recent endeavors. Commonly, the research approach in vibroacoustic studies uses a combination of experimental measurements and computational simulations. Experimental setups are highly complex and hence difficult to replicate the natural performance of a musical instrument without interfering with the way an instrument is performed and perceived. Simulations, especially those relying on Finite Element Methods (FEM), are computationally expensive and therefore extremely time-consuming for producing the amounts of data required for training machine learning models. Furthermore, perceptual aspects of timbral qualities are rather contextual and therefore not observable in isolated vibrational patterns, such as the ones measured or simulated in laboratory environments. An alternative approach is provided by deep learning techniques. In relevant research initiatives, Neural Networks (NNs) are used to predict the eigenfrequencies of musical instrument components [6], to infer the parameters of digital synthesis algorithms for delivering a target timbral texture [7] and to derive correlations of high-level semantic descriptions of timbre to low-level audio features [8,9,10].
The present article focuses on drumheads and aims at suggesting tuning and damping methods to achieve a desired sound texture. Percussionists frequently employ damping objects and materials to precisely adjust and manipulate their sound, which is a challenge that is marked by a significant level of unpredictability, typically addressed through a combination of trial-and-error methods as well as the utilization of commercial or do-it-yourself (DIY) products. The methodology presented in this article focuses on synthesizing a sound dataset simulating the vibration of a membrane having predefined geometrical characteristics and damped in numerous ways, by increasing the mass of the membrane in different areas of its surface according to six patterns. FDTD implementation is used to synthesize the sounds. A computational investigation of these sounds reveals that each surface pattern produces sounds of highly similar spectral envelopes that produce individual clusters. These sounds are used to train a Convolutional Neural Network (CNN) to infer the surface pattern and the amount of mass used to derive an input sound. As convolutional layers may be considered equivalent to filtering, this study demonstrates that the remarkable performance of the CNN in classifying patterns of uneven mass distribution may be attributed to the similarity of the resulting spectral envelopes.
The rest of this article is structured as follows: the next section presents the theoretical motivation driving our investigations. It presents the vibrational model of the membrane, the methods that are commonly adopted for drum tuning and damping control, and how they transform the resulting sound. Then, Section 3 describes the methodology for generating the sound dataset, for investigating the sound textures produced by different damping strategies and for implementing and training the CNN. Section 4 presents the results of CNN inference. Finally, Section 5 summarizes the findings of the presented research approach and further discusses ideas for mitigating existing limitations in follow-up advancements.
2. Theoretical Motivation
This section provides a concise overview of the use of drumheads in percussion instruments, the fundamentals of the vibration of homogeneous membranes, and the methods employed by percussionists to achieve a desired sound texture as well as by researchers to understand the behavior of non-homogeneous membranes.
2.1. Drumheads
The term drumhead refers to circular elastic membranes under tension that can support transverse vibrations. Drums consist of at least one drumhead stretched over a shell and struck with sticks, mallets, or performers’ hands. The simplest percussion instrument using drumheads is the frame drum. Frame drums are single membrane drums that are known as the most ancient musical instruments. They comprise a single membrane, often made of leather, stretched on a round wooden frame which is called a shell. In most frame drums, the diameter of the membrane is larger than the depth of the shell. They reproduce unpitched tones, which are deeper if they are hit towards the center of the membrane and higher in pitch if they are hit close to the rim. There are different variations of frame drums, using different membrane materials, which include plastic, synthetic (i.e., mylar, kevlar), and more recently acoustic metamaterials [11]. Figure 1 shows some examples of frame drum instruments.
To adjust the sound of their instruments, percussionists may alter the tension or the mass of the membrane. Depending on the instrument, tension may be adjusted using tuning pegs, or a rope system supporting the membrane, or by heating the membrane in the absence of any such mechanism. Mass distribution may be altered by applying commercial or custom-made products such as rings or adhesive pads and tapes on the top and sometimes at the bottom of the membrane surface, as discussed in Section 2.3.
2.2. Μembrane Vibration
The vibration of an ideal thin circular membrane of uniform mass density, follows the wave equation provided in Equation (1):
The function u(x, y, t) represents the instant displacement of point (x, y), which is perpendicular to the surface of the membrane, T is the tension of the membrane, μ = m/A denotes the area density, i.e., mass m over membrane surface A, and D is a damping constant. It is well known [12] that the eigenfrequencies for the vibration of a circular membrane are described by Equation (2),
in which r is the radius of the membrane, and Jm (x) represents the Bessel function of order m, and n represents the n-th root of that function, namely:
In Equation (2), fmn is the modal frequency of the vibrational mode that consists of n radial nodes and m nodal diameters. Figure 2 presents the shape and the ratio of the frequency of each mode to the fundamental frequency, for the first twelve modes of an ideal circular membrane. The actual frequencies of the normal modes of the membrane may be calculated by multiplying these ratios by the factor represented by Equation (4):
The frequency ratios of Figure 2 confirm the inharmonicity of the spectrum of an ideal circular membrane. Realistic drumheads exhibit an overtone spectrum that has many deviations to that of Figure 2. This is commonly attributed to the vibration of the shell, the air cavity within the shell, and maybe more importantly to the fact that mass and tension are not uniformly distributed throughout the membrane surface.
The vibrational characteristics of a membrane, and consequently the sound it generates, are contingent upon its geometric properties, its material composition, and the specifics of its excitation, namely, the striking mechanism and the initial displacement. According to Equation (2), changing its mass, radius, and tension affects the value of the fundamental frequency, i.e., the one corresponding to mode (0, 1) of Figure 2, but the overtone structure remains unchanged in terms of frequency and amplitude relationships of the different partials. In contrast, non-uniform distribution of tension T(x, y) or mass density μ(x, y) affects the spectrum in terms of the frequency and amplitude relationships of overtones and furthermore the decay rate of different modes that appears to be frequency dependent, especially when accounting for the viscoelastic properties of the material.
Concerning the excitation, it affects certain vibrational modes depending on the impact point. Specifically, when the impact point coincides with an antinode of some vibrational mode, then that mode is intensified. The higher the initial displacement, the higher is the amplitude of the intensified mode. In contrast, hitting on a nodal point of some modes will prevent the excitation of the corresponding modes. Hence, the excitation will not change the frequency relationships of the overtone spectra, but only their amplitudes. However, as demonstrated in Section 3.2, varying the distribution of either tension or mass density leads to more complex phenomena that do not have analytical solutions deciphering mode shapes and the position of nodal lines.
2.3. Tuning Methods and Damping Control
Adjusting pitch, i.e., the fundamental frequency, is achieved by a respective adjustment of the ratio of tension to mass distribution, according to Equation (2). Leather drumheads are commonly heated to increase membrane tension and as a result their fundamental frequency. Tuning pegs have a similar role for increasing membrane tension. Most importantly, non-uniform tension distribution appears to play a central role in mode shapes and frequencies. As confirmed by relevant Electronic Speckle Pattern Interferometry (ESPI) measurements and FEM models, non-uniform tension distribution causes frequency splitting by introducing degenerate modes, i.e., modes with similar frequency values, which appear rotated to one another on the surface of the membrane, in response to perturbations in the applied tension [13].
As an alternative to adjusting tension, altering mass distribution by applying commercial or custom-made products on the drumhead, appears to not only control the fundamental frequency, i.e., of mode (0, 1), but also affects the entire spectrum in terms of the frequency and amplitude relationships of partials, namely, the entire spectral envelope. Drummers refer to this process as damping, as their aim is to damp specific resonant frequencies. It appears that as circular membranes do not have a harmonic spectrum, they often produce an undesirable ringing effect, caused by the fact that certain modal frequencies have a longer decay than those contributing to a desired perceivable pitch [14]. Therefore, drummers aim at damping these frequencies. In contrast, in traditional music instruments such as the Indian tabla [15] or the Myanmar pat wain [16], percussionists apply paste on the membrane surface to not only adjust the fundamental frequency but also to achieve a harmonic relationship of the spectral overtones, a process which is referred to as tuning.
In a more general context, damping of musical instruments is caused by external energy loss due to radiation, as well as by internal energy loss within the vibrating structure. The modes having circular nodal lines (higher n) radiate more efficiently due to non-zero air volume displacement, and therefore have a higher contribution to external damping. The modes having more nodal diameters (m) have zero net-volume displacement and a stronger correlation to internal damping [14]. Internal damping may be attributed to energy losses caused by different factors, including thermal losses, but maybe more importantly to the viscoelastic nature of the material, which contributes to frequency-dependent damping, often revealed as beatings, non-exponential decays, spectral sidebands, and mode coupling [17].
As shown in Figure 3, there are several types of drum dampeners available in the market, including damping pads covering the entire area of the membrane, drum clips, adhesive gels, gaffer tapes, and muffle rings to name a few. The choice of which ones to use and how to position them on the instrument is entirely up to the performer. The general ideal is that a dampener will reduce the energy and the duration of the modes that have antinodes at the mounting area of the dampener. So circular dampeners aim at damping angular modes, small circular or rectangular pads aim at damping diametric modes, while damping pads covering the entire membrane area cause reduction of sound volume, without changing the sound texture. Nevertheless, as demonstrated in Section 3.2, the heterogeneity of mass distribution cause perturbations that lead to complex phenomena affecting the entire spectrum.
The work presented in the following is inspired by a special type of custom-made dampeners used for the Myanmar pat wain instrument. Pat wain is a drum circle consisting of 20 or 21 pitched drums, which are tuned by applying a paste called pa sa. Pa sa is a mixture of rice and ashes. When cooked, the rice varieties of Southeast and East Asia become particularly sticky, the so-called sticky rice, which means that they have a high amount of viscoelasticity. To tune the pat wain drums, paste is applied at the center of the instrument. This decreases the frequency of the fundamental mode, as it applies additional mass without any adjustment to tension. Then, the tuner redistributes the amount of paste to control the spectrum with the aim of achieving harmonic relationships for certain overtones, while at the same time checking timbre and comparing it with the other drums of the instrument [16].
3. Research Methodology
This section presents the methodology that was followed to address the inverse acoustic problem of inferring the damping strategy that corresponds to an input sound. This methodology involves generating a dataset of 11,114 sounds representing the vibration of a circular membrane damped by applying varied amounts of paste on its surface according to six patterns that were inspired by handcrafted and commercial drum dampeners commonly used by percussionists (Section 3.1). Furthermore, these sounds were computationally analyzed to investigate whether different paste distribution patterns yield similarities in the spectral overtones of the corresponding sounds (Section 3.2). Finally, a multi-output CNN was trained to infer paste distribution pattern and the amount of paste applied on the membrane that results in each given sound (Section 3.3).
3.1. Generation of the Sound Dataset
To generate the sound dataset, an FDTD implementation was used. As the FDTD method provides a grid-based numerical solution, in this case a solution of Equation (1), it was possible to account for paste distribution by increasing the mass of the membrane at specific grid cells that were determined by each distribution pattern.
3.1.1. FDTD Model
FDTD models provide an efficient numerical method for physical modelling sound synthesis and have been previously used for complete geometries of a guitar, a violin, and several other instruments [18]. In this study, FDTD is implemented for Equation (1), in which the circular membrane is modeled as a finite number of grid cells and time is modeled as a finite number of time instants as depicted in Figure 4. The fundamental time step is defined as Δt, and the fundamental length of a cell is defined as Δx = Δy. To maintain stability, constants Δt and Δx are chosen such that no artificial energy is introduced (Courant–Friedrichs–Levy condition) [18,19] as shown in Equation (5).
The membrane assumes boundary conditions u(xb, yb, t) = 0 for all points xb, yb around the circumference of the membrane and initial conditions u(x, y, 0) = 0 for all points except for the striking point of the membrane for which u(xp, yp, 0) = 1.
To compute u(x, y, t) at every cell, the Newton–Störmer–Verlet also known as leapfrog algorithm is applied [20]. Specifically, let denote the acceleration defined as:
The second order partial derivatives are approximated as the following discrete form:
For each cell and time instant, the leapfrog algorithm follows simple formulas of kinematics and proceeds according to the following steps:
- a according to Equations (6) and (7);
- vnew = vold + a Δt;
- vnew = D vnew;
- unew = uold + unew Δt.
Following these steps, the displacement of every cell on the grid for every time instant is computed. Finally, a sound signal is computed assuming a microphone at distance d above the center of the membrane. This computation integrates the displacements at microphone position with a time delay and an attenuation determined by the virtual microphone position above the drumhead. Thereby, the attenuation d/r(x,y), with r(x,y) being the distances between the respective points on the membrane and the microphone and a delay r(x,y)/c, is used, where c is the speed of sound in the air.
3.1.2. Distribution of Paste
To account for the pattern and amount of paste applied on the drumhead, Equation (1) was reformulated as:
The synthesized sounds correspond to a reference membrane of predefined geometrical characteristics, i.e., radius r = 0.25 m, thickness 3 mm, volume density 300 kg/m3, and a constant uniformly distributed tension of T = 800 Nt. These values correspond to a membrane having a total mass m = 177.24 g. A uniform, square grid of 105 × 105 = 11,025 nodal points was used for the FDTD model. In this grid, only 8685 cells correspond to the area of the membrane (please refer to Figure 5). Therefore Δx = Δy = 4.76 mm and the mass of each cell was Δm = 0.0204 g.
The damping parameter was kept constant at D = 0.9999 throughout the sound computation. Real drums are damped stronger than in the present simulation. To better simulate real frame drums, the model should account for viscoelastic damping as presented by [17]. Viscoelasticity does not change the relationships of spectral overtones. Instead, it introduces frequency-dependent damping, resulting in time-varying sound spectra, which do not preserve the fine structure of different partials throughout the duration of the sound signals. There are two reason for not including viscoelasticity in the FDTD model. Firstly, because different damping materials have different viscoelastic properties, and secondly because, due to the fact that different overtones have different durations, it would be more difficult to draw conclusions on how the damping material affects the overtone spectra.
Paste was applied according to six patterns shown in Figure 5. These patterns were inspired by common tuning practices used by percussionists (Section 2.3), i.e., circular disks, ring dampeners, gaffer tapes, and adhesive pads. Besides the patterns 1-diameter, 2-radius, 3-cross, 4-disc, 5-ring, 6-point, the 0-pattern was included to represent the case of no added paste. The 0-pattern represents the bare membrane (i.e., without any paste applied) and is not shown on Figure 5.
Depending on the pattern, different parameters were varied to produce different sounds, as shown in Table 1. Certain parameter combinations were used to generate three sounds corresponding to striking the membrane on three different impact points. As shown in Figure 6, the (x, y) coordinates of the impact points were (18, 20), (25, 30), and (35, 45). This corresponds to one point close to the rim, one of medium distance between the rim and the center, and one close to the center. The center of the membrane was not used as an impact point as this would damp all normal modes having a node at the center (please refer to Figure 2). The reason for considering three impact points was to account for the variation introduced by the same membrane owing to its excitation, regardless of the use of damping material.
For example, for the 0-pattern, different sounds were generated by varying the thickness of the membrane. Precisely, 529 thickness values were chosen in the range of 0.003–0.0067 mm. For each thickness value, three sounds were generated by shifting the impact point of membrane excitation to three pre-defined positions of Figure 6. This yields a total number of 1587 sounds. As another example, for pattern 5-ring, different sounds were produced by varying the amount of added paste, expressed as percentage of mass increase per grid cell, having 13 values in the range of 20 to 220.1%, and the outer radius of the ring was varied between 33.6 and 95% of the actual radius of the membrane to yield 14 values and the width of the ring between 2 and 8 cm to provide 8 values.
It is important to note that although the dataset is balanced with respect to the paste patterns, i.e., an approximately equal number of sounds were generated for each pattern, it was not possible to achieve a respective balance for the increase in the membrane mass due to paste. The reason for this is that the extra mass is a combination of the percentage of mass increase per cell, denoted as Paste (%) on Table 1, and the number of cells covered with paste. So instead of using all possible combinations, selected combinations were used. These combinations were determined to provide a compromise between considering realistic values of mass increase and a roughly even distribution of paste mass per pattern. This is the reason why the total number of sounds per pattern does not agree with the total number of parameter combinations multiplied by the three hitting points.
Figure 7 shows the histograms of the number of sounds produced for each bin corresponding to a range of values for the paste mass. Paste mass is depicted for 50 bins and for all paste patterns (Figure 7a) as well as separately for each pattern (Figure 7b–h). Besides the 0-no_paste pattern, all other patterns are represented by a higher number of sounds in the low range of paste mass (0–50 g) than the higher range of paste mass (50–200 g).
3.1.3. Implementation Details and Dataset Availability
To generate the audio files, the FDTD model was implemented using the CUDA architecture on an Intel i7-12700 2.1/4.9 GHz, 64 GB RAM, computer system using the NVIDIA GeForce GTX 970 4 GB GPU on Windows 10. The computation time was estimated to be around 3–4 s for generating 1 s of an audio signal at a sampling rate of 96 kHz.
A total number of 11,114 sounds were created using combinations of the values presented in Table 1. These sounds may be accessed via a public link (http://bit.ly/drumheads-sounddataset, accessed on 16 August 2023). The parameters values used to generate each file are provided with filenames explained in the accompanying document.
3.2. Data Investigation
One of the primary concerns of this research is to investigate whether each damping pattern yields perceptually similar sounds. Perceptual similarity was assessed by the frequency and amplitude ratios of the spectral overtones to those of the fundamental peak. An example of spectrum transformation due to paste, is presented in Figure 8. On top, the FFT spectrum and the grid diagram of the reference membrane is depicted. The red mark on the grid diagram represents the impact point of (18, 20). As shown in the spectrum legend, the funamental frequency is f0 = 45 Hz, which is in agreement with Equation (4). The frequency ratios of the first sixteen partials to the frequency of the fundamental are (1.00, 1.60, 2.31, 2.93, 3.62, 4.24, 4.93, 5.42, 5.56, 6.22, 6.76, 6.87, 7.36, 7.53, 7.89, 8.09). The first five frequency ratios approximate those of modes (0, 1), (1, 1), (0, 2), (1, 2), (3, 2) of Figure 2. At the bottom of Figure 8, the FFT spectrum is presented and the grid diagram of the same membrane damped according to the ring pattern is shown in the bottom right. The specific sound corresponds to increasing the mass of the cells covered with paste by 157.372%. The coverage of paste is defined by an outer radius that is 76.008% of the membrane radius and a width of 0.0648 cm. This corresponds to a total coverage of 2668 cells, a paste mass of 85.65 g, and a total mass of the damped membrane of 262.89 g, which according to Equation (4) results in the fundamental frequency f0 = 37.47 Hz, which is again in agreement with the bottom spectrum (37 Hz). In this case, the frequency ratios of the peaks are (1.00, 1.49, 2.35, 3.14, 2.76, 4.41, 4.51, 5.32, 5.97, 6.11, 6.24, 6.46, 7.16, 7.59, 7.70, 7.89), which are significantly different from the ratios of the normal modes in Figure 2. It is hence demonstrated that covering the specific cells with paste alters the eigenmodes in terms of their amplitude and frequency relationships.
A first attempt to investigate whether spectral similarities exist for each of the damping patterns is provided in one of our previous publications [21] for a smaller dataset comprising 2331 synthesized sounds using the paste distribution patterns of Figure 5 and an impact point at the center of the membrane. In that work, the FFT sound spectra and the spectral partials were computed using a peak-picking algorithm. The frequency ratios of partials to the fundamental were used to train a Self Organizing Map (SOM) that revealed similarities within the sound dataset. The sounds of each pattern were clustered in regions of high similarity, and a high dissimilarity was exhibited between circular patterns (disc, ring, and the no_paste pattern) and line patterns (i.e., radius, diameter, and cross). Moreover, the disc pattern appeared to belong to the same cluster as the no-paste pattern with respect to partial relationships, hence confirming that circular discs alter the fundamental frequency and damp partial amplitudes, without introducing significant changes in the frequency relationships.
The present dataset of 11,114 sounds was investigated using numerous dimensionality reduction algorithms including, Principal Component Analysis (PCA), t-distributed Stochastic Neighbor Embedding (t-SNE), Uniform Manifold Approximation and Projection (UMAP), and Linear Discriminant Analysis (LDA). Two of these efforts were highly informative and presented in the rest of this section.
Figure 9 demonstrates the diagram of an LDA map trained on the first sixteen partials of the FFT spectra. Specifically, the FFT spectrum of each 96 kHz sound was computed and a peak-picking algorithm estimated the frequency and amplitude ratios of the first sixteen partials to the fundamental peak. This provided datapoints within a multidimensional space of 11,114 × 32 dimensions. Then, LDA was employed to reduce the dimensionality of this space to 2D. LDA is a dimensionality reduction technique commonly used as a preprocessing step for pattern classification. It is ‘supervised’, hence classes are known before training. It computes the directions (‘linear discriminants’) that reveal the axes that maximize the separation between multiple classes. Diagrams (a) to (h) demonstrate the overlap and the separation of different patterns corresponding to similarities and dissimilarities of the spectral envelopes. As depicted by (b), the point pattern is highly dissimilar to the ‘bare’ membrane (i.e., no-paste pattern) as well as any symmetric, with respect to the membrane center, pattern (d). To percussionists, this suggests that applying an adhesive pad will introduce a remarkable change in the sound texture of the drumhead. In contrast, applying angular dampeners, i.e., circular pads or muffle rings, introduces a decrease in the fundamental frequency without significantly altering the partial relationships and hence the perceived timbre. Furthermore, applying damping material using adhesive tapes, i.e., diameter, radius, and cross patterns, will produce sound textures that are highly dissimilar to any membrane of radial symmetry as well as dissimilar to the application of any adhesive pad.
A further interesting visualization of the dataset is the one depicted in Figure 10. As an alternative to training with spectral overtones, PCA was employed to investigate the raw sounds after subsampling them to 22,050 Hz. This provided datapoints on a multidimensional space with a dimension of 11,114 × 22,050. PCA is an unsupervised data reduction technique, which projects the data values on the hyperplane that is closest to the datapoints, while preserving most of their variance.
Several interesting observations were made by hovering on the datapoints of this visualization. Mouse-hovering provided information about the paste mass and the impact point of the membrane excitation. It was surprising to observe that the three black trajectories of the 0-pattern (Figure 10b) correspond to the three hitting points of the membrane. The outer trajectory corresponds to impact point (35, 45), which is the closest to the center of the membrane (please refer to Figure 6). The neighboring middle trajectory corresponds to the point (25, 30), and the inner trajectory corresponds to the impact point that is closer to the rim, namely, the (18, 20) point. The remaining patterns are aligned around these three black trajectories, although they appear sparser than the black trajectories. This is because, as discussed in Section 3.1.2, the variation of thickness of the 0-pattern is uniformly distributed within its range, while for the remaining patterns, specific values of the parameter range were selected in an attempt to approximate a uniform distribution for the values of paste. A second interesting observation of this visualization is related to the distribution of paste mass. For every pattern and every trajectory, paste mass increases along the trajectory starting from bottom right to bottom left.
A valuable conclusion drawn from the exploration of the produced dataset is that, as different patterns appear in different areas on the map of Figure 9 and symmetric patterns are disimilar to non-symmetric patterns, the distribution pattern has an influence on the spectral envelop of the computed sounds, which may be computationally detectable. On the other hand, from the trajectories of Figure 10, it appears that, although the paste distribution pattern is not detectable from the raw waveform, the estimation of parameters such as the impact point of the intial excitation or the mass of the damping material may be effectively estimated by reducing the dimensionality of the raw waveform. An interactive web application of this visualization is currently being developed to allow percussionists to explore the sound dataset by listening to the corresponding sound samples and easily locating their preferred timbre. Annotated information will provide suggestions on how to physically manipulate their instruments to produce their favorite sounds.
3.3. Damping Inference
A deep neural network was implemented to identify the damping strategy for deriving a given sound texture. Dataset sounds were resampled at a sampling rate of 22,050 Hz, and the raw waveforms represented the input of the network, which was trained to recognize the paste pattern and to estimate the total mass of the applied paste, thus accounting for a classification and a regression task, respectively.
A multi-output CNN [22] was implemented to drive the training process towards making a combined inference of paste pattern and paste mass. As the dimensionality reduction techniques (Section 3.2) demonstrated that each paste pattern spanned a considerable area on the 2D maps and patterns were not isolated, it was revealed that pattern and mass increase due to paste had a combined effect on the resulting sound texture, which was the reason for opting for a multi-output network, instead of separately training a classification and a regression task.
3.3.1. CNN Architecture
The CNN model was implemented in Python using TensorFlow and Keras on the Google Colaboratory environment, which made use of a Tesla T4 GPU. The RandomSearch algorithm of the KerasTuner framework was used to derive an optimized model and tune the hyperparameter space. Through iterative cycles of training and validation, various architectural configurations, parameter combinations, and evaluation metrics were explored. The resulting optimal architecture consisted of a relatively shallow model with two narrow convolutional layers, followed by maxpooling layers, and a wide dense layer before generating the final output.
The architecture of the final mutli-output CNN is shown in Figure 11. It comprises several layers, including convolutional, pooling, dense, dropout, and flatten layers. The input layer accepts an audio signal of 1 s sampled at a rate of 22,050 Hz. The output of the input layer is driven to a 1D convolutional layer of 64 filters and a kernel size of three, and a maxpooling layer with a pool size of two, followed by a second convolutional layer of 128 filters and a pooling layer having a pool size of two. The output of the second pooling layer is passed through a dropout layer with a rate of 30%, and then it is flattened and retrieved to a dense layer of 512 units, which uses ReLU as the activation function. The network then splits into two separate outputs, one for classification and one for regression. The classification output is a dense layer with seven units and uses Softmax as the activation function. It outputs the class corresponding to the paste pattern, with values ranging from zero to six. The regression output is a dense layer with one regression unit and a linear activation function. It outputs the predicted amount of mass of the applied paste on the membrane in kg.
Besides the dropout layer, both convolutional layers used a maxnorm constraint as the regularization method to improve generalization [23]. The model used the Adaptive Moment Estimation (ADAM) algorithm for optimization, and the cost functions were based on Categorical Cross-Entropy (CCE) loss for multiclass classification and Mean Squared Error (MSE) for regression.
3.3.2. CNN Training
The sound dataset was split into training and test sets in a proportion of 75% (8335 sounds) to 25% (2779 sounds), respectively. Three-fold cross validation, specifically the StratifiedKFold, was used to preserve class balance across folds and eliminate potential biases in the validation process.
The training history is depicted in Figure 12. Training used a batch size of 20 samples. Mechanisms of early stopping and learning-rate reduction were used to increase the efficiency of the training process. As shown in Figure 12, training was completed in 200 iterations (epochs), which required almost 3 h.
4. Results
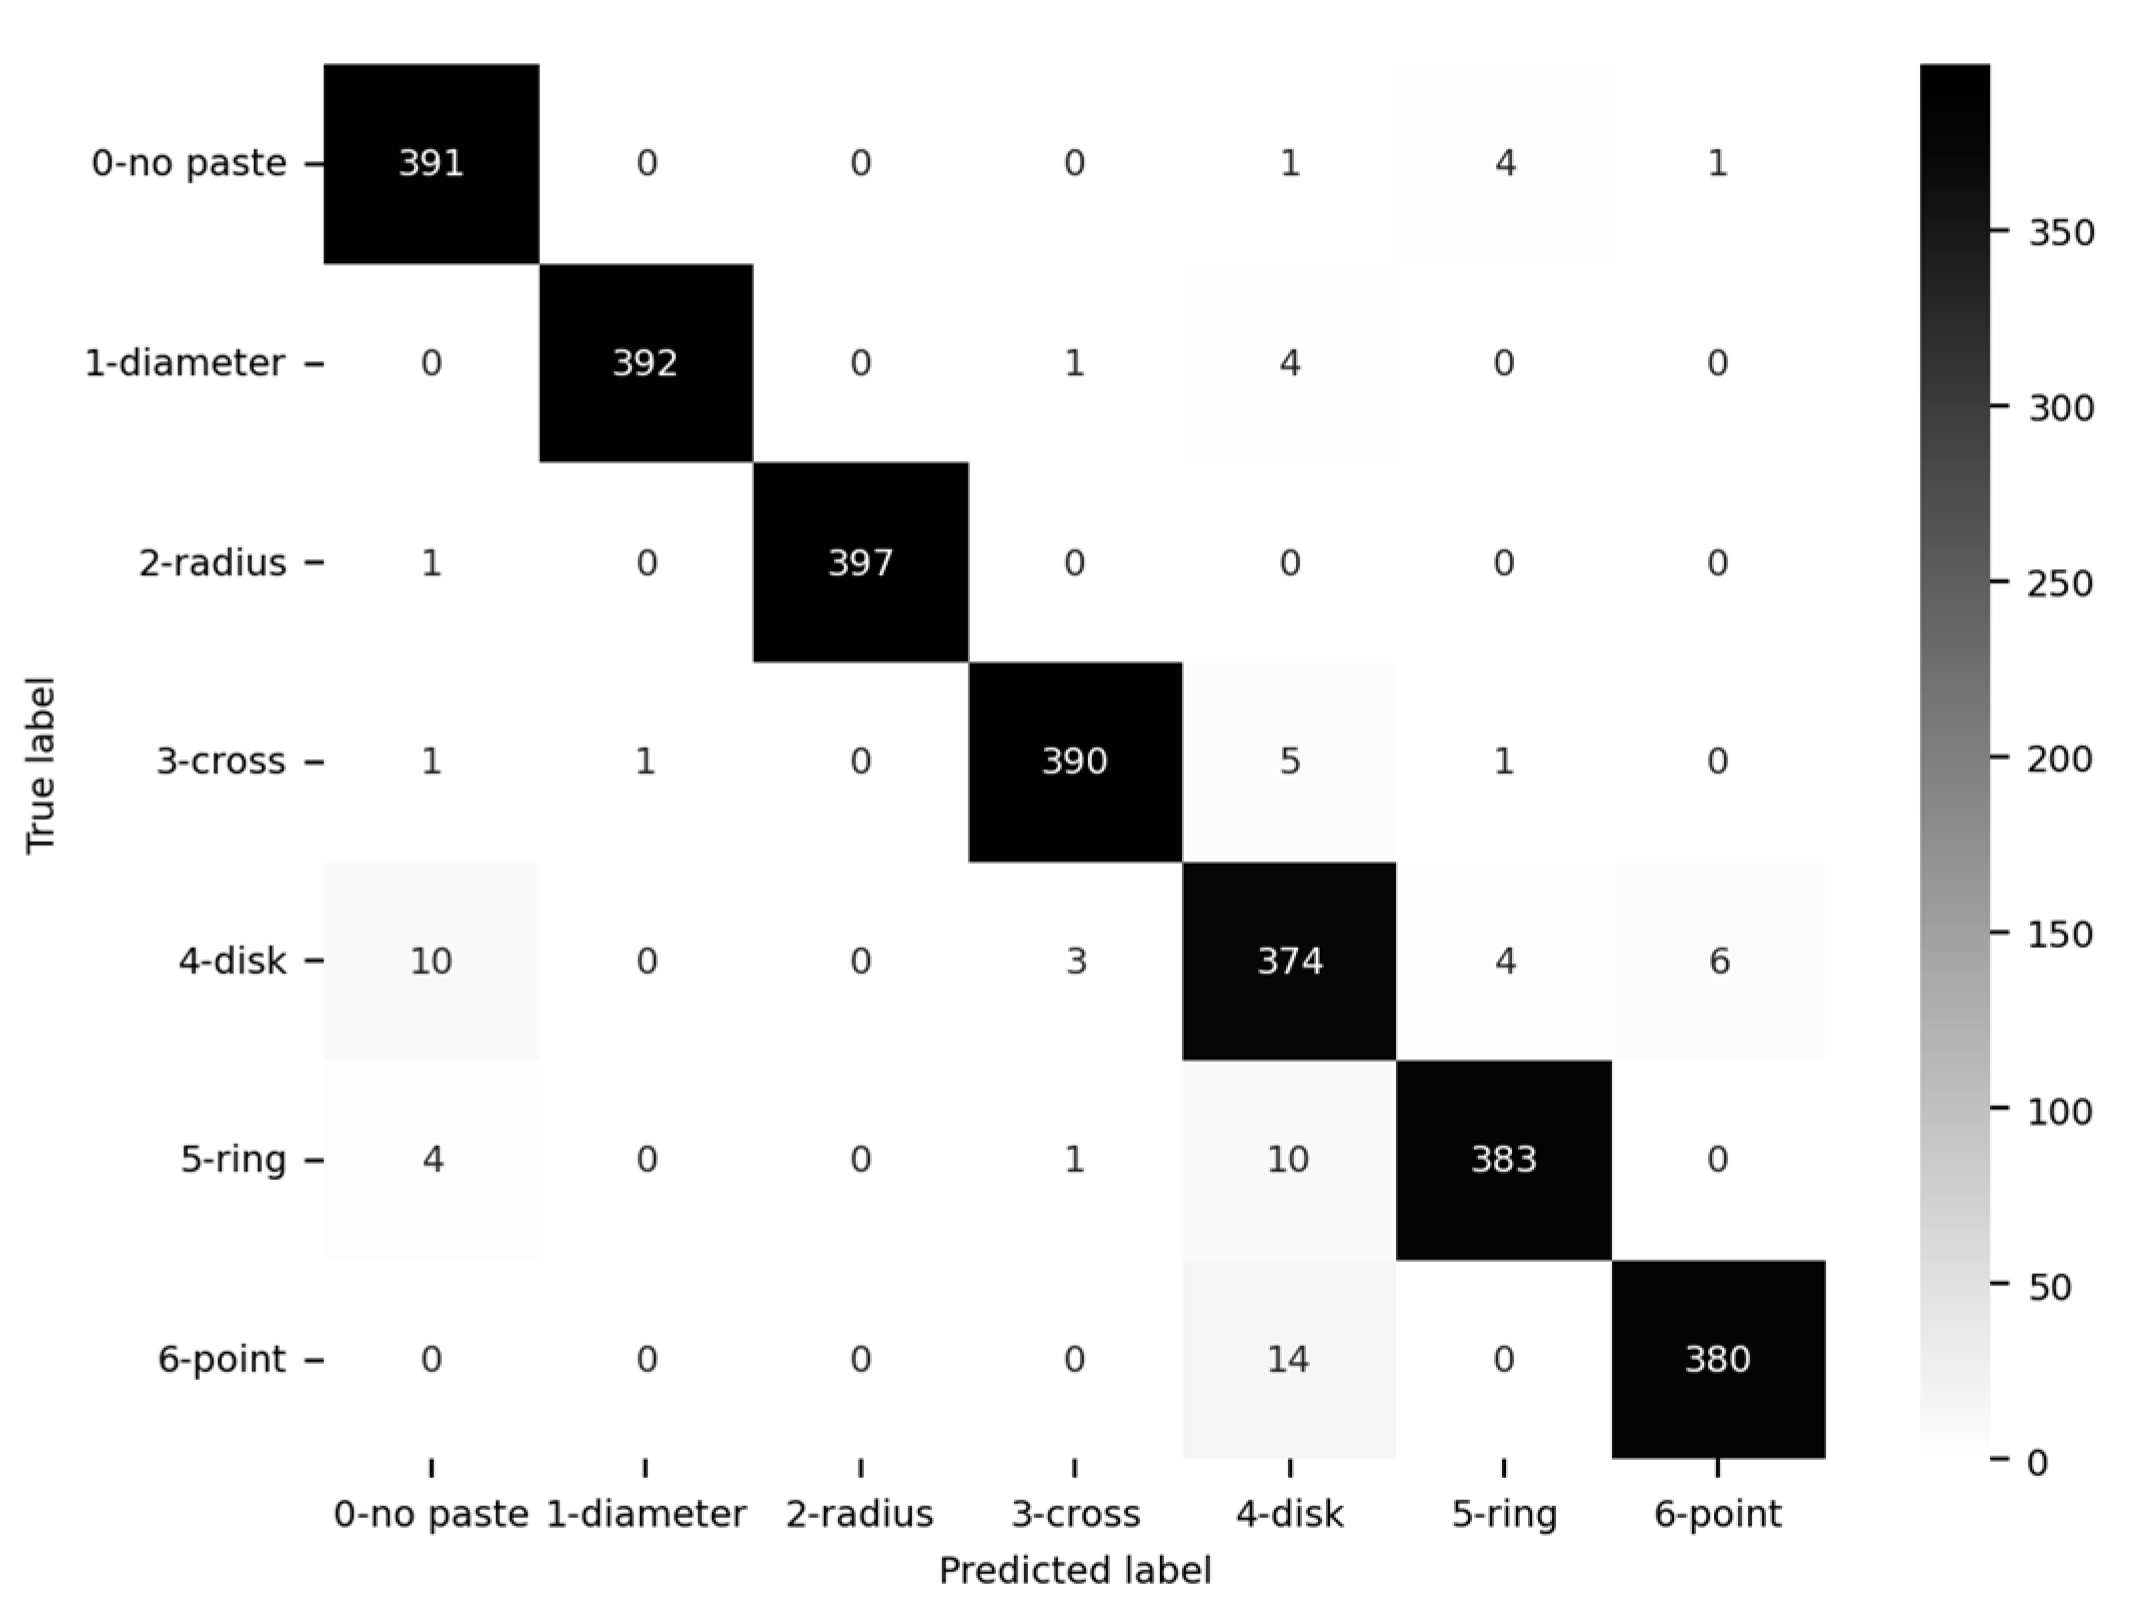
Table 2 provides the performance of the multi-output CNN in the classification task of identifying paste pattern, and Figure 13 shows the confusion matrix. Both evaluation measures involve the test set of 2779 ‘unseen’ sounds.
The model had a remarkable performance in the classification task reaching an accuracy of 97.4% for the test set. The highest accuracy was achieved for the line patterns, namely, radius, diameter, and cross, and the lowest performance was observed for the disc pattern. As the convolutional layers of the CNN applied on the raw waveform are comparable to filtering operations on the frequency domain [24], the lowest performance of the 0-no_paste and the 4-disc pattern may be attributed to the fact that these two patterns have highly similar spectral envelopes as confirmed by the LDA diagram in Figure 9.
The regression model was evaluated using the Mean Absolute Error (MAE), Root Mean Squared Error (RMSE), MSE, and R squared (R2) metrics. The R2 metric expresses the difference of the predicted values to the actual values as a proportion of their variance, which is important in this study as realistic values for the mass of added paste admit different ranges for different paste patterns. A zero value for R2 indicates that the model cannot explain any variation of the target variable, while the value of one means that estimations are identical to the true values. Table 3 demonstrates the performance of the CNN in these metrics for each paste pattern.
The weighted average values of the evaluation metrics shown in the last row of Table 2 as W.A. depict the overall performance of the regression task. For example, the MAE had a weighted average value of 19.75 g, which, compared to the total mass of the membrane (177.24 g), corresponds to an error of ±11.14% of the total mass of the membrane. The R2 value of 0.97 indicates that 97% of the variance of added mass is explainable by the sound signals. Moreover, it is interesting to note that the best performance is achieved for the bare membrane (no-paste pattern) and that the ring pattern had the lowest performance in the estimation of paste mass. This may be attributed to the uneven distribution of dataset sounds across the range of paste mass. Indeed, as depicted in Figure 7, the dataset paste mass is evenly distributed only for the 0-no_paste pattern, hence the best performance of the regression task, while the worse distribution is presented for the ring patter, hence the degraded performance of the regression task.
The remarkable performance of the classification task may raise concerns related to network overfitting during training. As various mechanisms were applied to prevent overfitting (e.g., regularization of the convolutional layers and the dropout layer), it is more likely that the CNN model benefits from the fact that the sounds have been generated by the same audio synthesis model, resulting in a high resemblance of the sounds used for training and for testing. As elaborated in the following section, this problem is being addressed in our current research efforts, which focus on combining synthesized sounds with recorded sounds and data augmentation techniques.
5. Discussion
This research demonstrates that applying damping material on drumheads alters the resulting sound texture in a predictable manner such that it is possible to infer the damping technique from the resulting sound. It was shown that applying damping material on membrane surface with specific patterns, such as those commonly employed by performers, has a significant impact on the amplitude and frequency relationships of sound spectra. The spectral transformations introduced by the different paste patterns are significantly different for circular patterns than for linear patterns, as was shown via data reduction techniques. Moreover, the amount of damping material as well as the point of membrane excitation may be effectively estimated by reducing the dimensionality of the raw waveform.
Training a CNN to estimate the damping technique from the sound signal, revealed that the damping pattern can be recognized with an accuracy of 97.4% and the mass of paste with an error of ±11% of the original mass of the membrane. The remarkable accuracy in identifying the paste pattern may be attributed to the fact that, as convolutional layers are comparable to filtering operations, different patterns lead to highly dissimilar sound spectra.
Evidently, an application suggesting damping techniques to derive a desired sound texture, can be very useful to percussionists. Searching the keywords ‘drumhead damping’ on YouTube provides enough evidence on the anxiety of performers to determine how to damp their drums to achieve the very subtle texture discrepancies that are desired and perceptually satisfying. This work presents only a first attempt towards solving this problem by suggesting computational approaches. Each combination of pattern and mass leads to a unique sound that is very different from any other combination, as proven by the high performance of the inference model.
Perhaps the most important limitation of the present methodology is related to the fact that all sound signals used for training the inference model have been derived using computational methods. Unfortunately, assembling a set of recorded sounds and corresponding measurements of physical properties and damping specificities that would be sufficient to train and evaluate the performance of the deep neural network is practically infeasible. To mitigate this problem, we are currently working on combining recorded sounds with FDTD sounds and contemporary data augmentation techniques (e.g., Variational Autoencoders [25]) to generate more realistic sounds.
Ultimately, the work presented in this paper demonstrates the potential of addressing an inverse acoustic problem for vibrating membranes. Future and ongoing research efforts aim at mitigating current limitations and providing damping suggestions of enhanced reliability.
Author Contributions
Conceptualization, C.A. and R.B.; methodology, M.S., C.A., and P.Z.; software, M.S. and P.Z.; validation, M.S., R.B., and P.Z.; formal analysis, C.A. and M.S.; investigation, C.A. and R.B.; resources, R.B.; data curation, M.S.; writing—original draft preparation, C.A.; writing—review and editing, C.A., M.S., P.Z., and R.B.; visualization, R.B. and M.S.; supervision, C.A., R.B. and P.Z. All authors have read and agreed to the published version of the manuscript.
Funding
This research received no external funding.
Data Availability Statement
The dataset of FDTD synthesized sounds is present in (http://bit.ly/drumheads-sounddataset, accessed on 16 August 2023). The parameters values used to generate each file are provided in the filenames explained by the accompanying document.
Conflicts of Interest
The authors declare no conflict of interest.
References
- Alvares-Sanches, T.; Osborne, P.E.; White, P.R. Mobile surveys and machine learning can improve urban noise mapping: Beyond A-weighted measurements of exposure. Sci. Total Environ. 2021, 775, 145600. [Google Scholar] [CrossRef]
- Yeh, C.Y.; Tsay, Y.S. Using machine learning to predict indoor acoustic indicators of multi-functional activity centers. Appl. Sci. 2021, 11, 5641. [Google Scholar] [CrossRef]
- Li, M.; Zhou, W.; Liu, J.; Zhang, X.; Pan, F.; Yang, H.; Li, M.; Luo, D. Vehicle Interior Noise Prediction Based on Elman Neural Network. Appl. Sci. 2021, 11, 8029. [Google Scholar] [CrossRef]
- Li, D.; Liu, F.; Shen, T.; Chen, L.; Yang, X.; Zhao, D. Generalizable Underwater Acoustic Target Recognition Using Feature Extraction Module of Neural Network. Appl. Sci. 2022, 12, 10804. [Google Scholar] [CrossRef]
- Lei, L. Multiple Musical Instrument Signal Recognition Based on Convolutional Neural Network. Sci. Program. 2022, 2022, 5117546. [Google Scholar] [CrossRef]
- Gonzalez, S.; Salvi, D.; Baeza, D.; Anotnacci, F.; Sarti, A. A data-driven approach to violin making. Sci. Rep. 2021, 11, 9455. [Google Scholar] [CrossRef] [PubMed]
- Gabrielli, L.; Tomassetti, S.; Squartini, S.; Zinato, C.; Guaiana, S. A multi-stage algorithm for acoustic physical model parameters estimation. IEEE/ACM Trans. Audio Speech Lang. Process. 2019, 27, 1229–1240. [Google Scholar] [CrossRef]
- Olivieri, M.; Malvermi, R.; Pezzoli, M.; Zanoni, M.; Gonzalez, S.; Antonacci, F.; Sarti, A. Audio Information Retrieval and Musical Acoustics. IEEE Instrum. Meas. Mag. 2021, 24, 10–20. [Google Scholar] [CrossRef]
- Buccoli, M.; Zanoni, M.; Setragno, F.; Antonacci, F.; Sarti, A. An unsupervised approach to the semantic description of the sound quality of violins. In Proceedings of the 2015 23rd European Signal Processing Conference (EUSIPCO), Nice, France, 31 August–4 September 2015; pp. 2004–2008. [Google Scholar] [CrossRef]
- Zanoni, M.; Setragno, F.; Antonacci, F.; Sarti, A.; Fazekas, G.; Sandler, M. Training-based semantic descriptors modeling for violin quality sound characterization. In 138th Audio Engineering Society Convention; Audio Engineering Society: New York, NY, USA, 2015; Volume 2, pp. 1125–1134. [Google Scholar]
- Bader, R.; Fischer, J.; Münster, M.; Kontopidis, P. Metamaterials in musical acoustics: A modified frame drum. J. Acoust. Soc. Am. 2019, 145, 3086–3094. [Google Scholar] [CrossRef] [PubMed]
- Gouph, C. Musical Acoustics. In Springer Handbook of Acoustics, 1st ed.; Schroeder, M., Rossing, T.D., Dunn, F., Hartmann, W.M., Campbell, D.M., Fletcher, N.H., Eds.; Springer Publishing Company, Incorporated: New York, NY, USA, 2007; pp. 533–667. [Google Scholar]
- Worland, R. Normal modes of a musical drumhead under non-uniform tension. J. Acoust. Soc. Am. 2010, 127, 525–533. [Google Scholar] [CrossRef] [PubMed]
- Worland, R.; Miyahira, W. Physics of musical drumhead damping using externally applied products. In Proceedings of Meetings on Acoustics; AIP Publishing: New York, NY, USA, 2018; Volume 35, p. 035004. [Google Scholar] [CrossRef]
- Sinha, A. Computing natural frequencies and mode shapes of a non-uniform circular membrane. Mech. Res. Commun. 2020, 107, 103553. [Google Scholar] [CrossRef]
- Bader, R. Finite-Difference model of Mode shape changes of the Myanmar pat wain drum circle using tuning paste. In Proceedings of Meetings on Acoustics; AIP Publishing: New York, NY, USA, 2016; Volume 29, p. 035004. [Google Scholar] [CrossRef]
- Bader, R. Spectrally-Shaping Viscoelastic Finite-Difference Time Domain Model of a Membrane. Int. J. Inform. Soc. 2020, 12, 81–93. [Google Scholar] [CrossRef]
- Bilbao, S. Numerical Sound Synthesis: Finite Difference Schemes and Simulation in Musical Acoustics, 1st ed.; John Wiley and Sons Ltd.: West Sussex, UK, 2009. [Google Scholar]
- Courant, R.; Friedrichs, K.; Lewy, H. Über die partiellen Differenzengleichungen der mathematischen Physik. Math. Ann. 1928, 100, 32–74. (In German) [Google Scholar] [CrossRef]
- Hairer, E.; Lubich, C.; Wanner, G. Geometric numerical integration illustrated by the Störmer–Verlet method. In Acta Numerica; Cambridge University Press: Cambridge, UK, 2003; pp. 399–450. [Google Scholar] [CrossRef]
- Alexandraki, C.; Starakis, M.; Bader, R.; Zervas, P. Machine Learning of Finite-Difference Time Domain (FDTD) Physical Modelling Sound Simulations of Drumhead Paste Pattern Distributions. In Proceedings of the Forum Acusticum 2023, Torino, Italy, 11 September 2023. [Google Scholar]
- Xu, D.; Shi, Y.; Tsang, I.W.; Ong, Y.S.; Gong, C.; Shen, X. Survey on Multi-Output Learning. IEEE Trans. Neural Netw. Learn. Syst. 2020, 31, 2409–2429. [Google Scholar] [CrossRef] [PubMed]
- Srivastava, N.; Hinton, G.; Krizhevsky, A.; Sutskever, I.; Salakhutdinov, R. Dropout: A simple way to prevent neural networks from overfitting. J. Mach. Learn. Res. 2014, 15, 1929–1958. [Google Scholar]
- Lee, J.; Park, J.; Kim, K.L.; Nam, J. SampleCNN: End-to-End Deep Convolutional Neural Networks Using Very Small Filters for Music Classification. Appl. Sci. 2018, 8, 150. [Google Scholar] [CrossRef]
- Chadebec, C.; Allassonnière, S. Data Augmentation with Variational Autoencoders and Manifold Sampling. In Lecture Notes in Computer Science; Springer Science and Business Media Deutschland GmbH: Berlin/Heidelberg, Germany, 2021; Volume 13003, pp. 184–192. [Google Scholar] [CrossRef]
Figure 1.
Frame drum instruments.
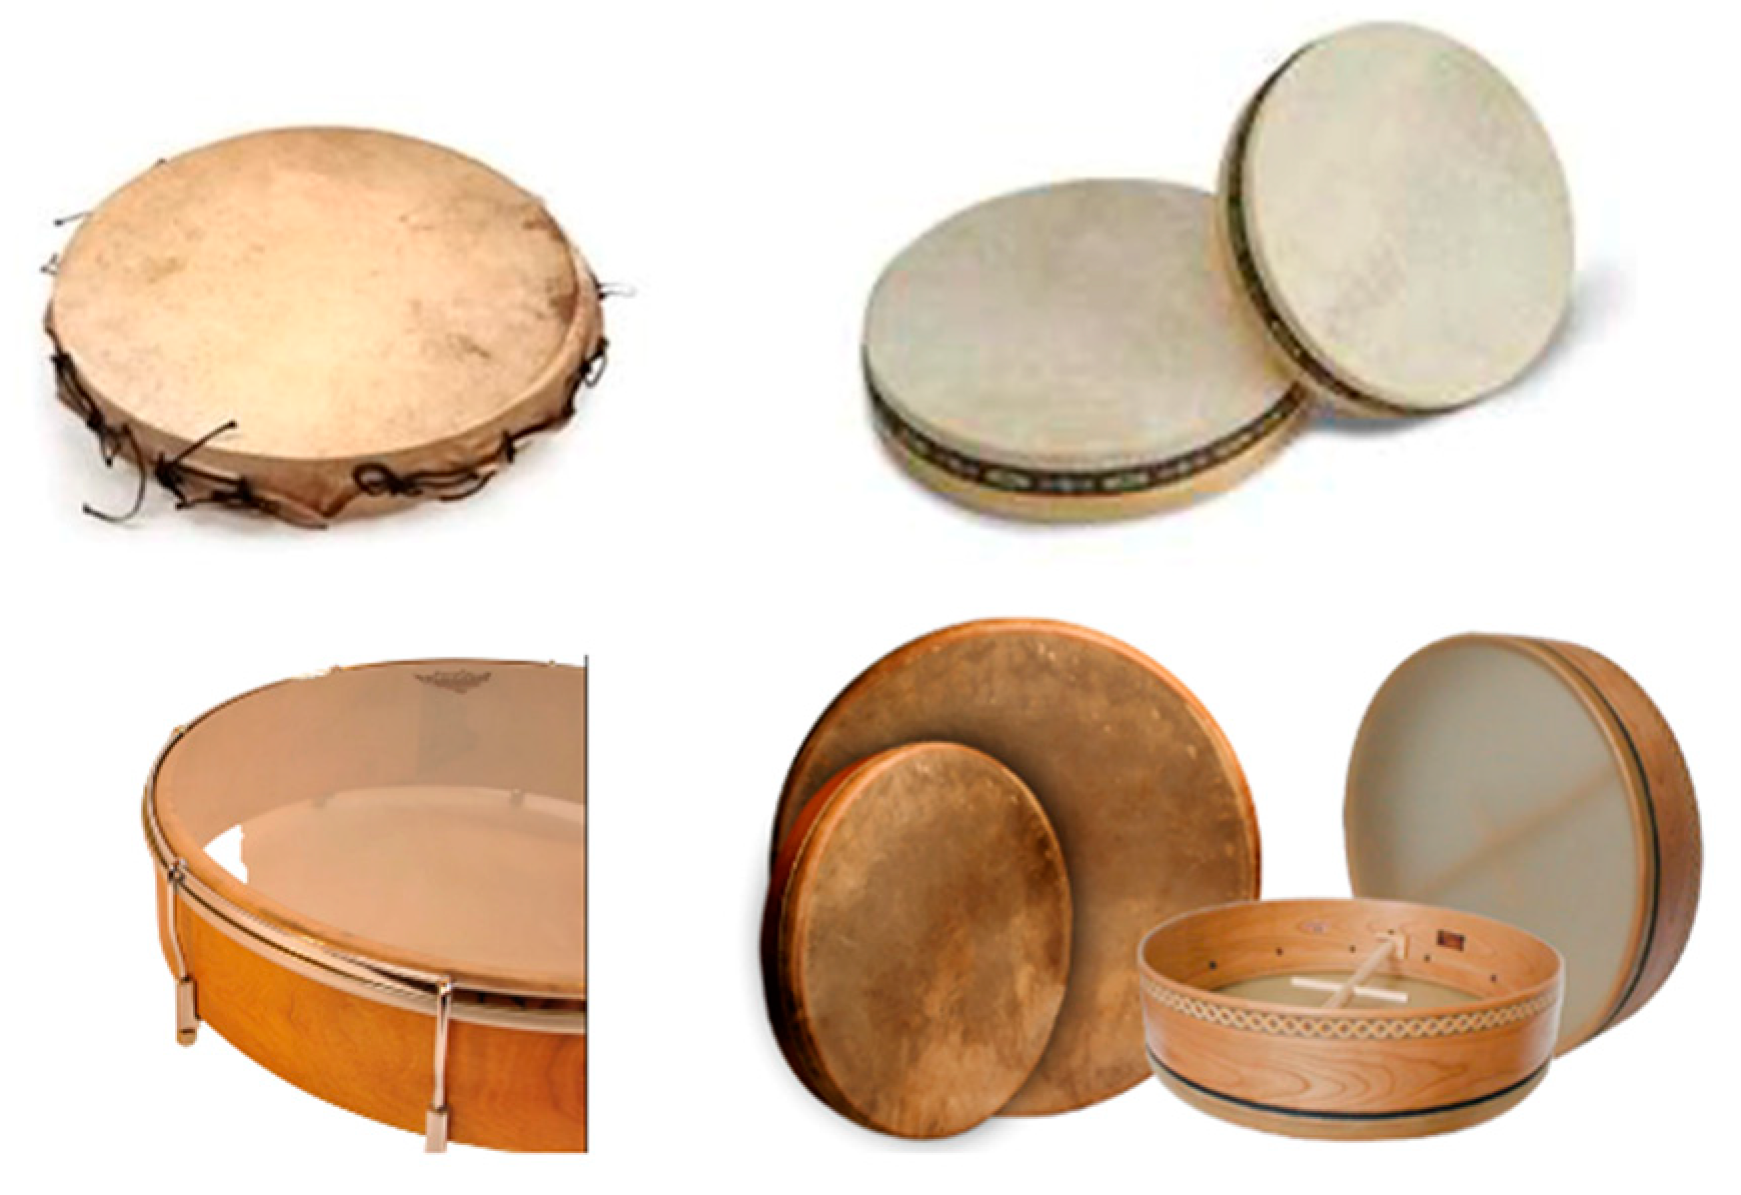
Figure 2.
The first twelve vibrational modes of an ideal circular membrane.
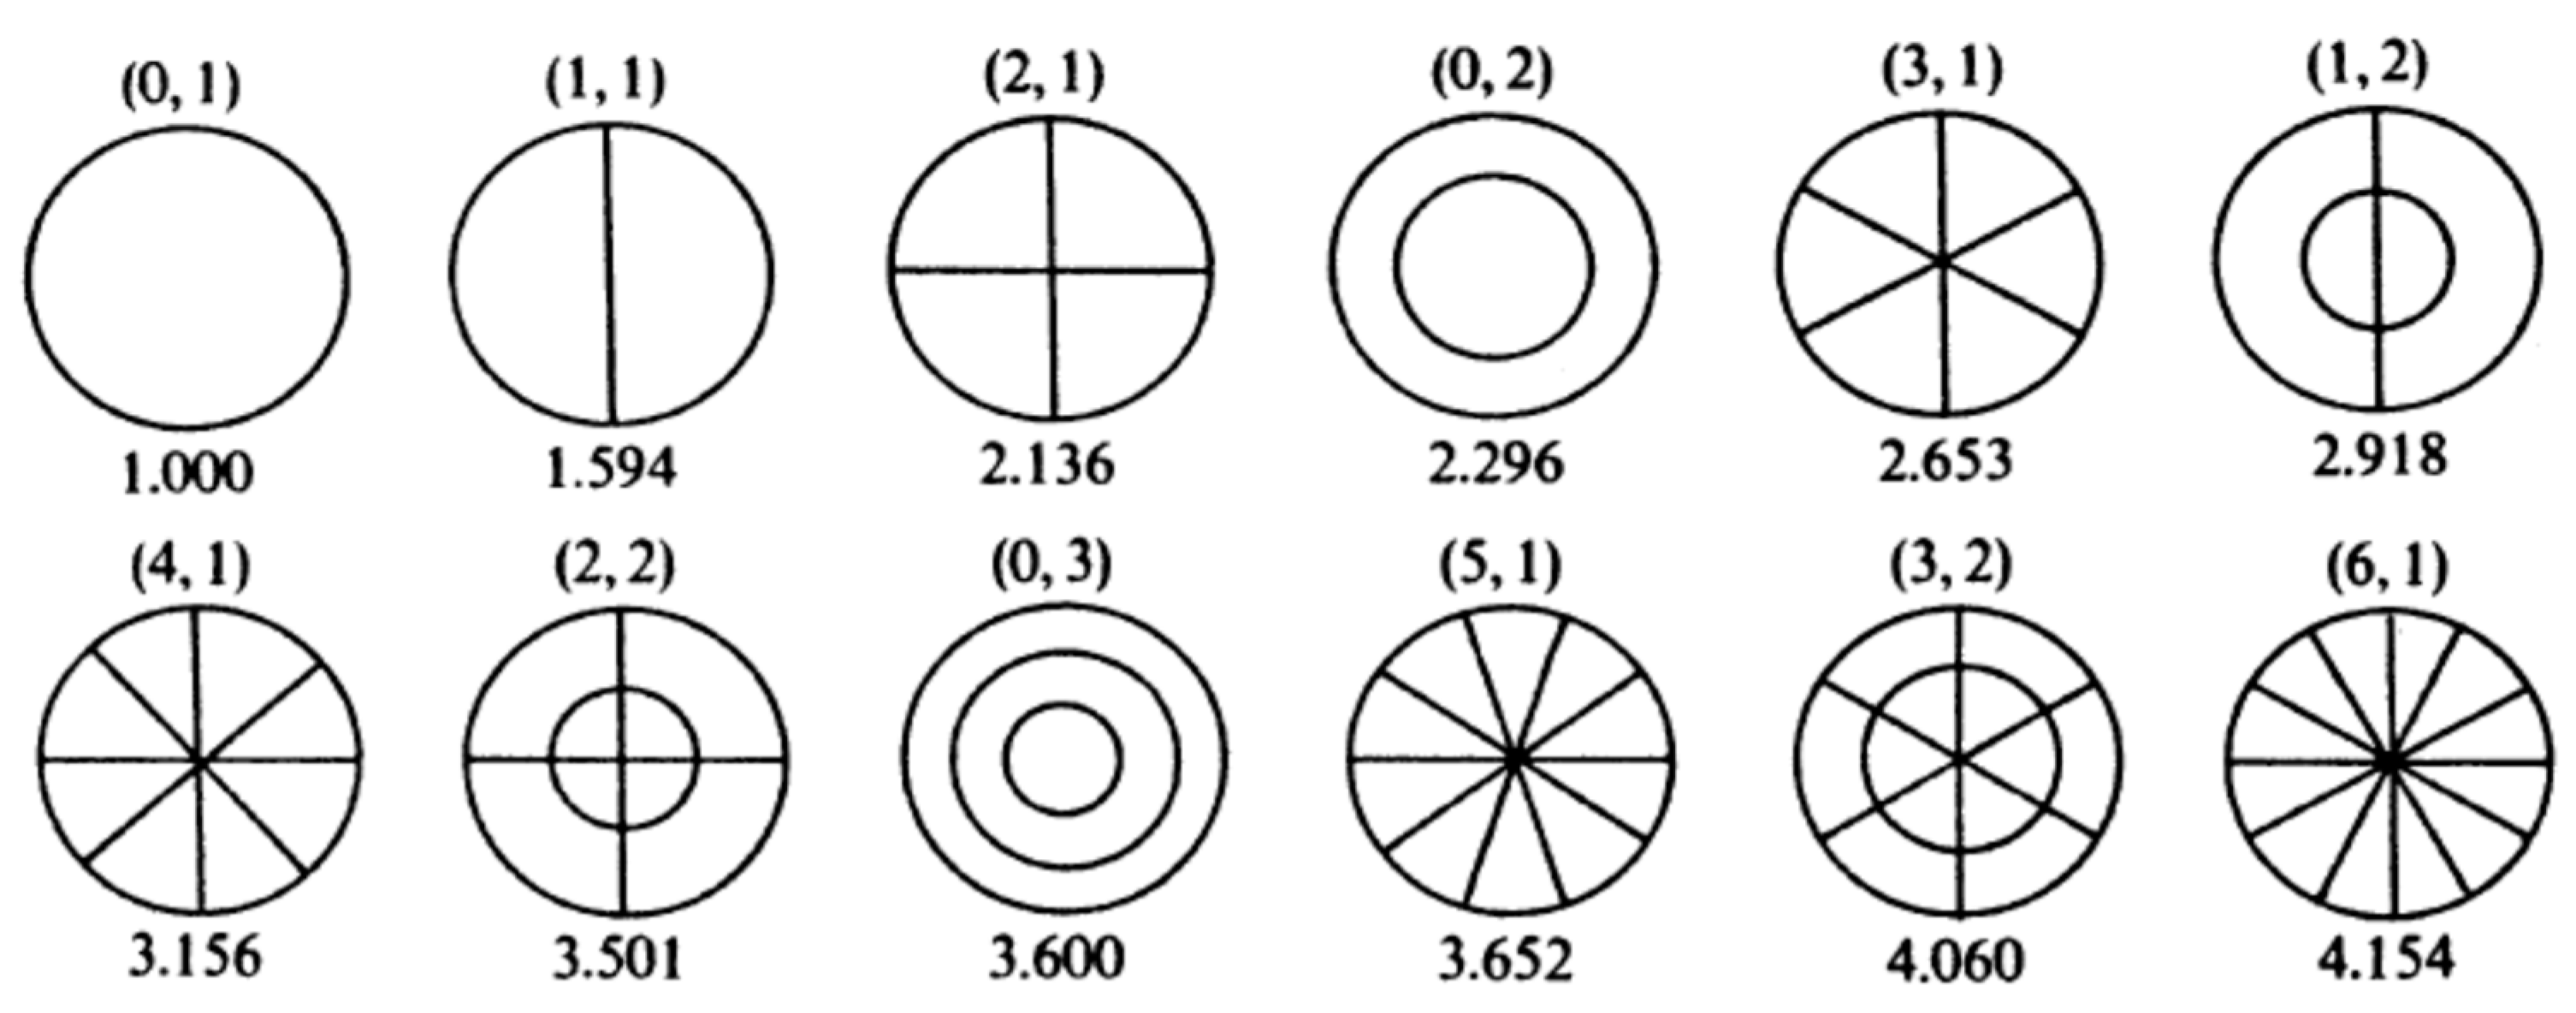
Figure 3.
Different types of commercial drum dampeners. Photographs have been derived from amazon.com.
Figure 3.
Different types of commercial drum dampeners. Photographs have been derived from amazon.com.
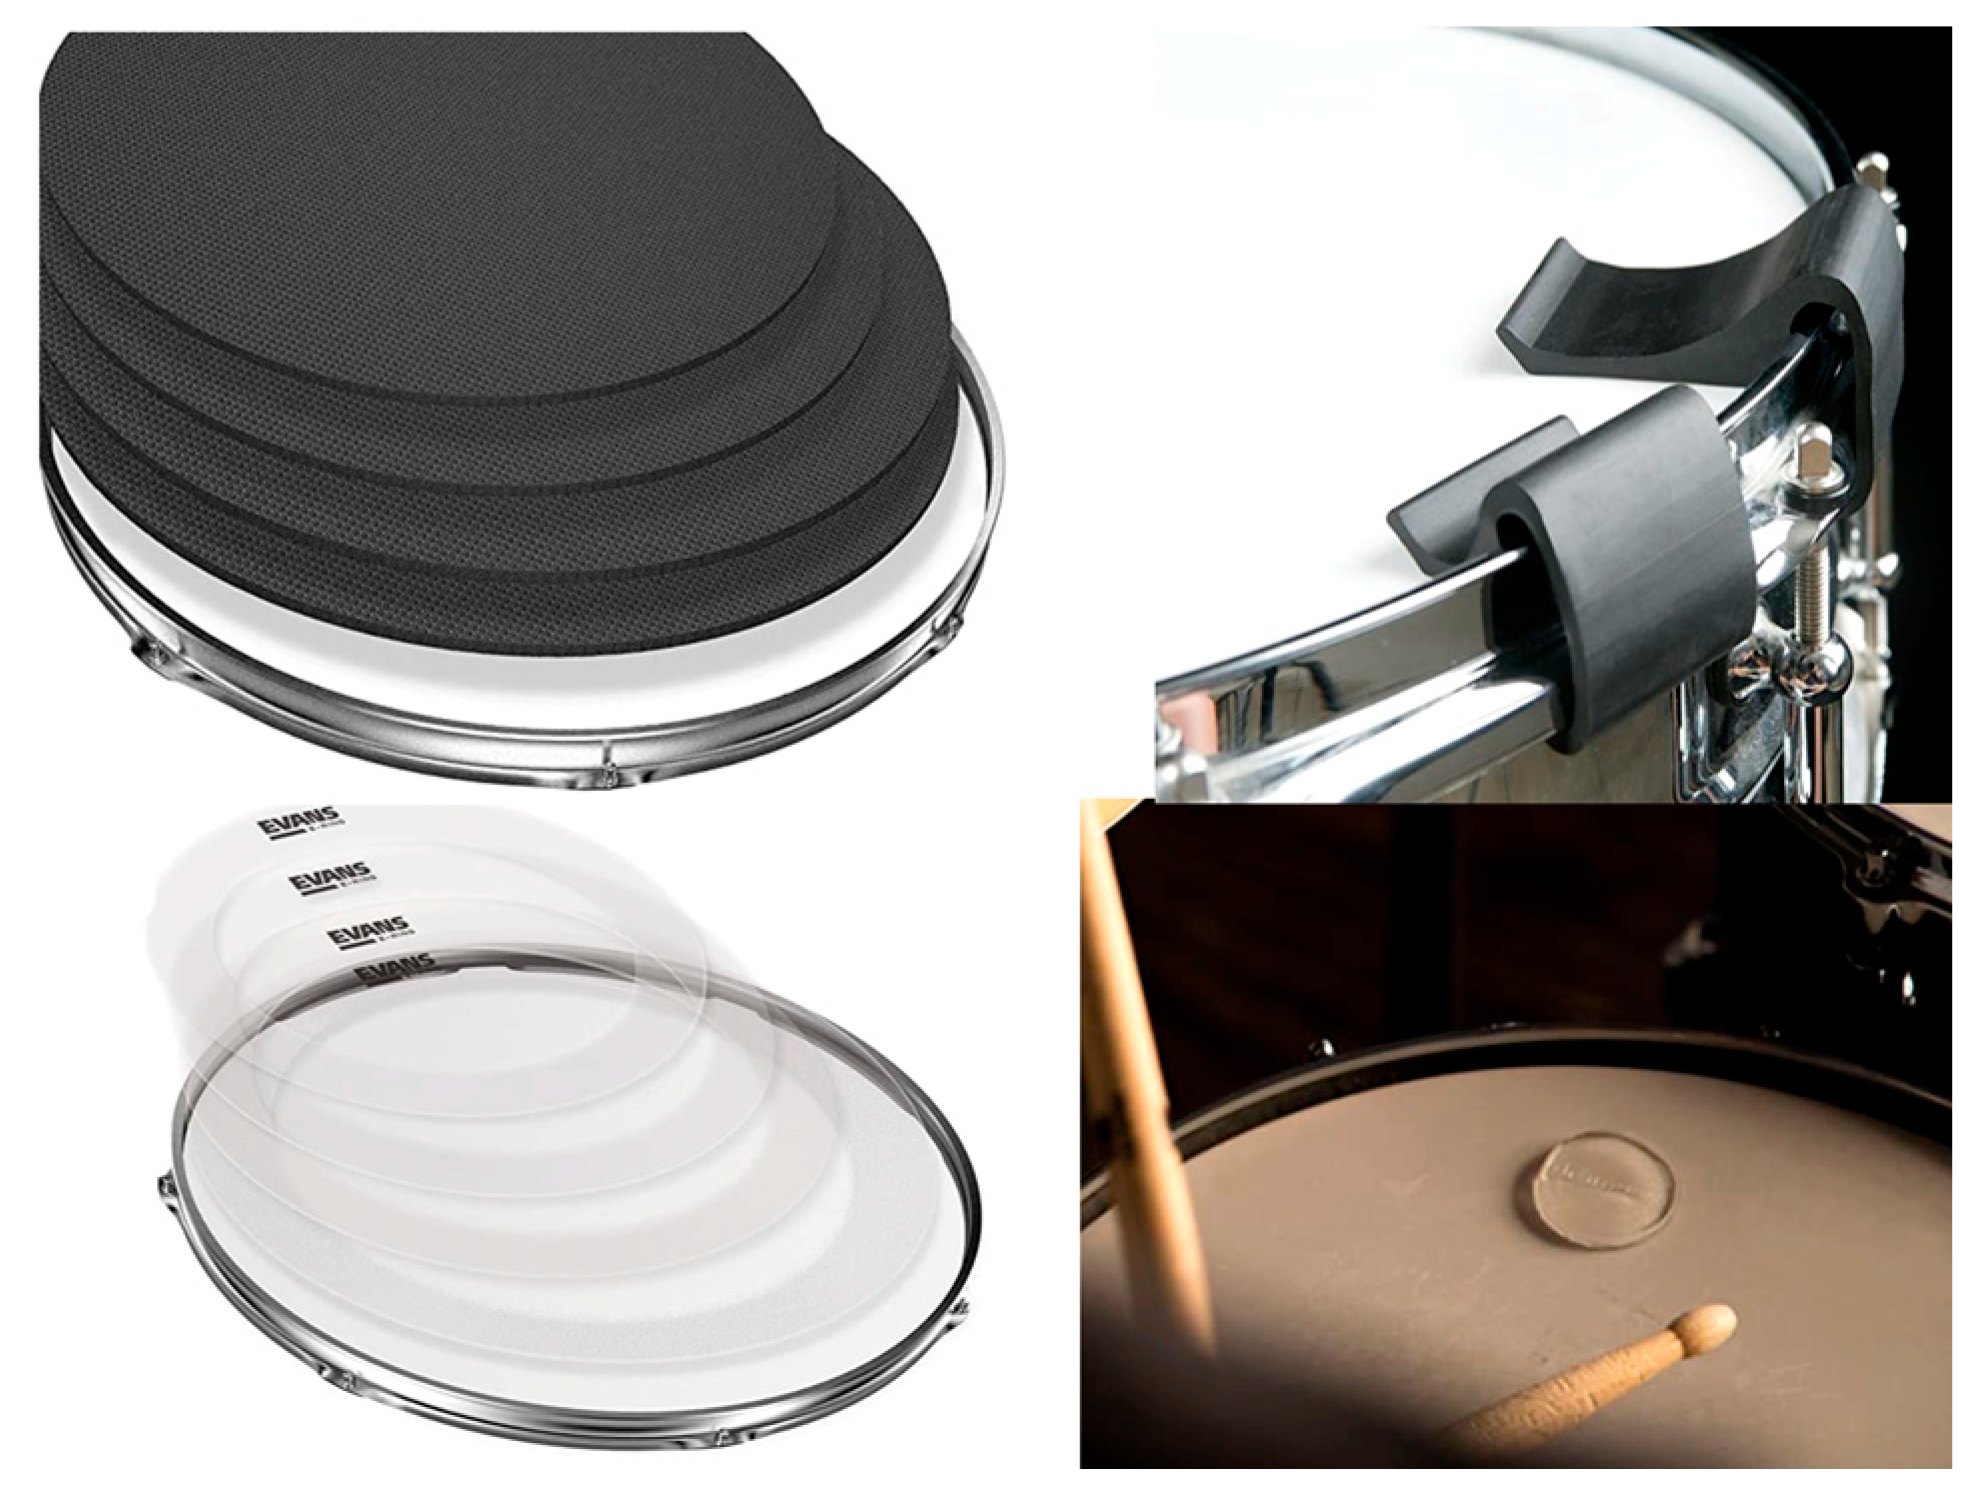
Figure 4.
The cell grid of the circular membrane.
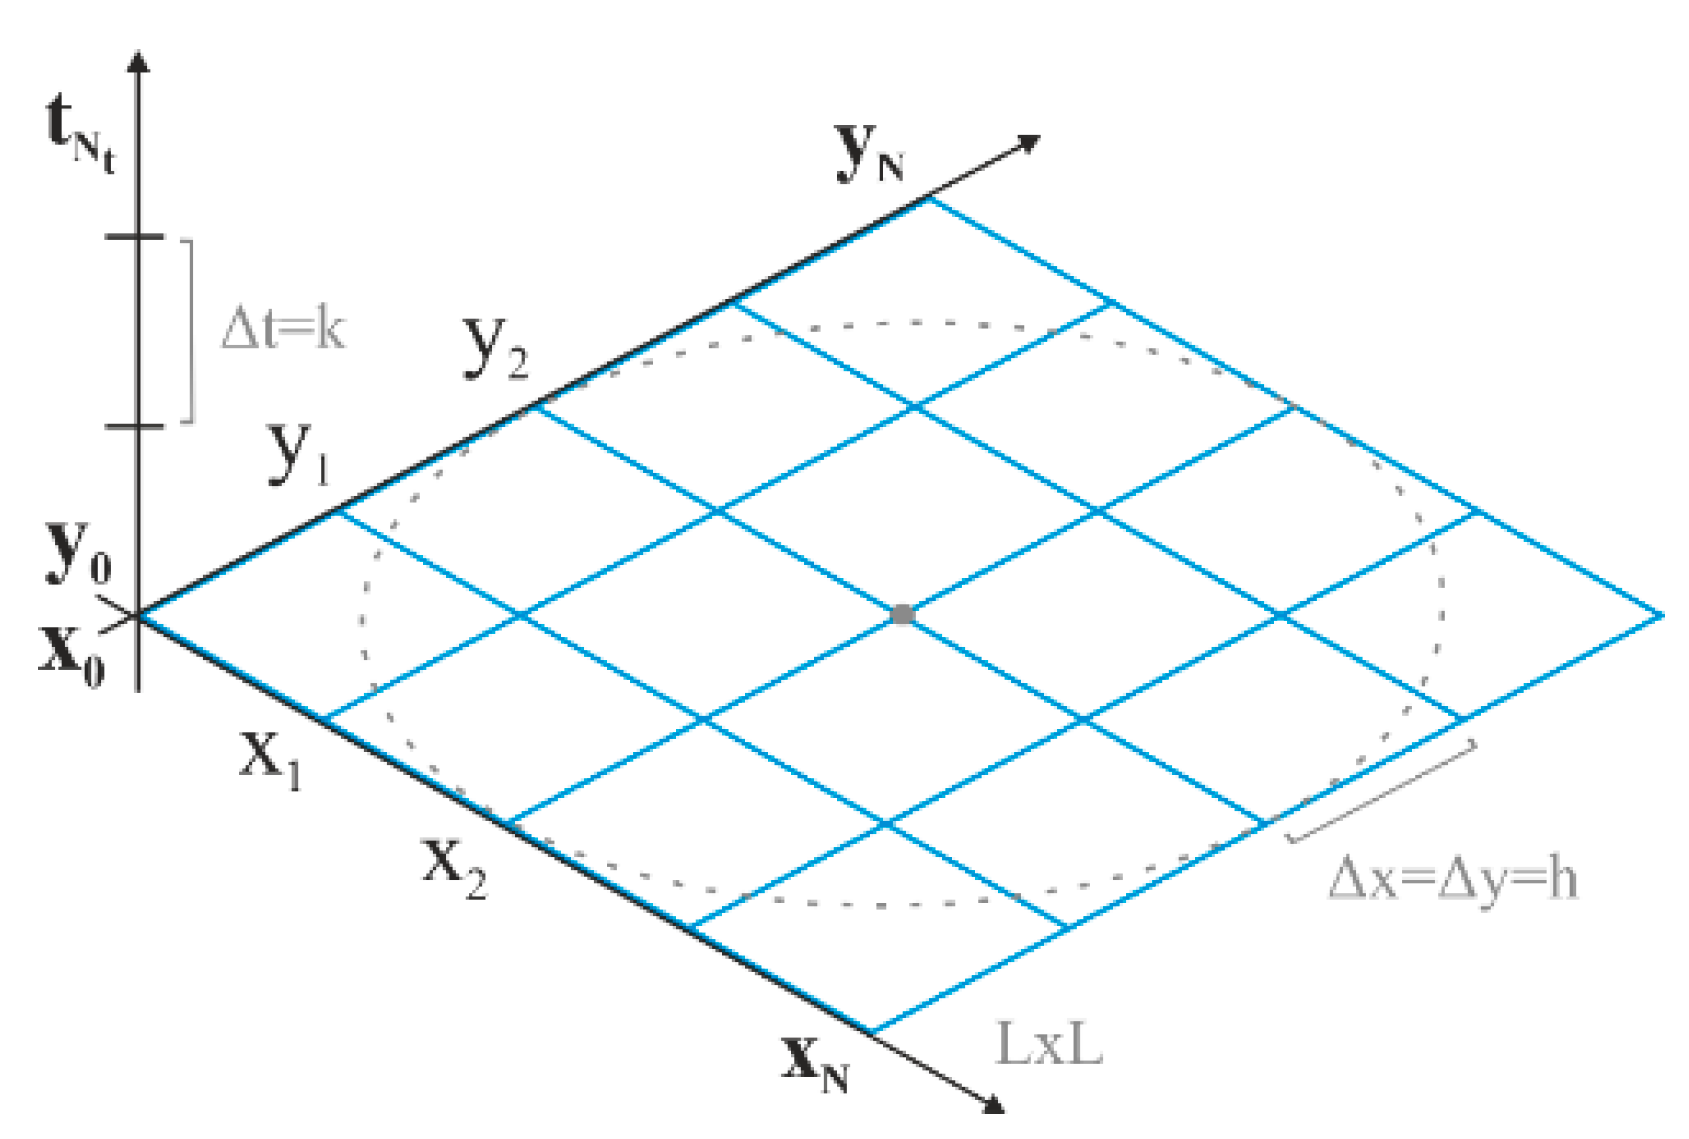
Figure 5.
The paste patterns used for generating the audio dataset.
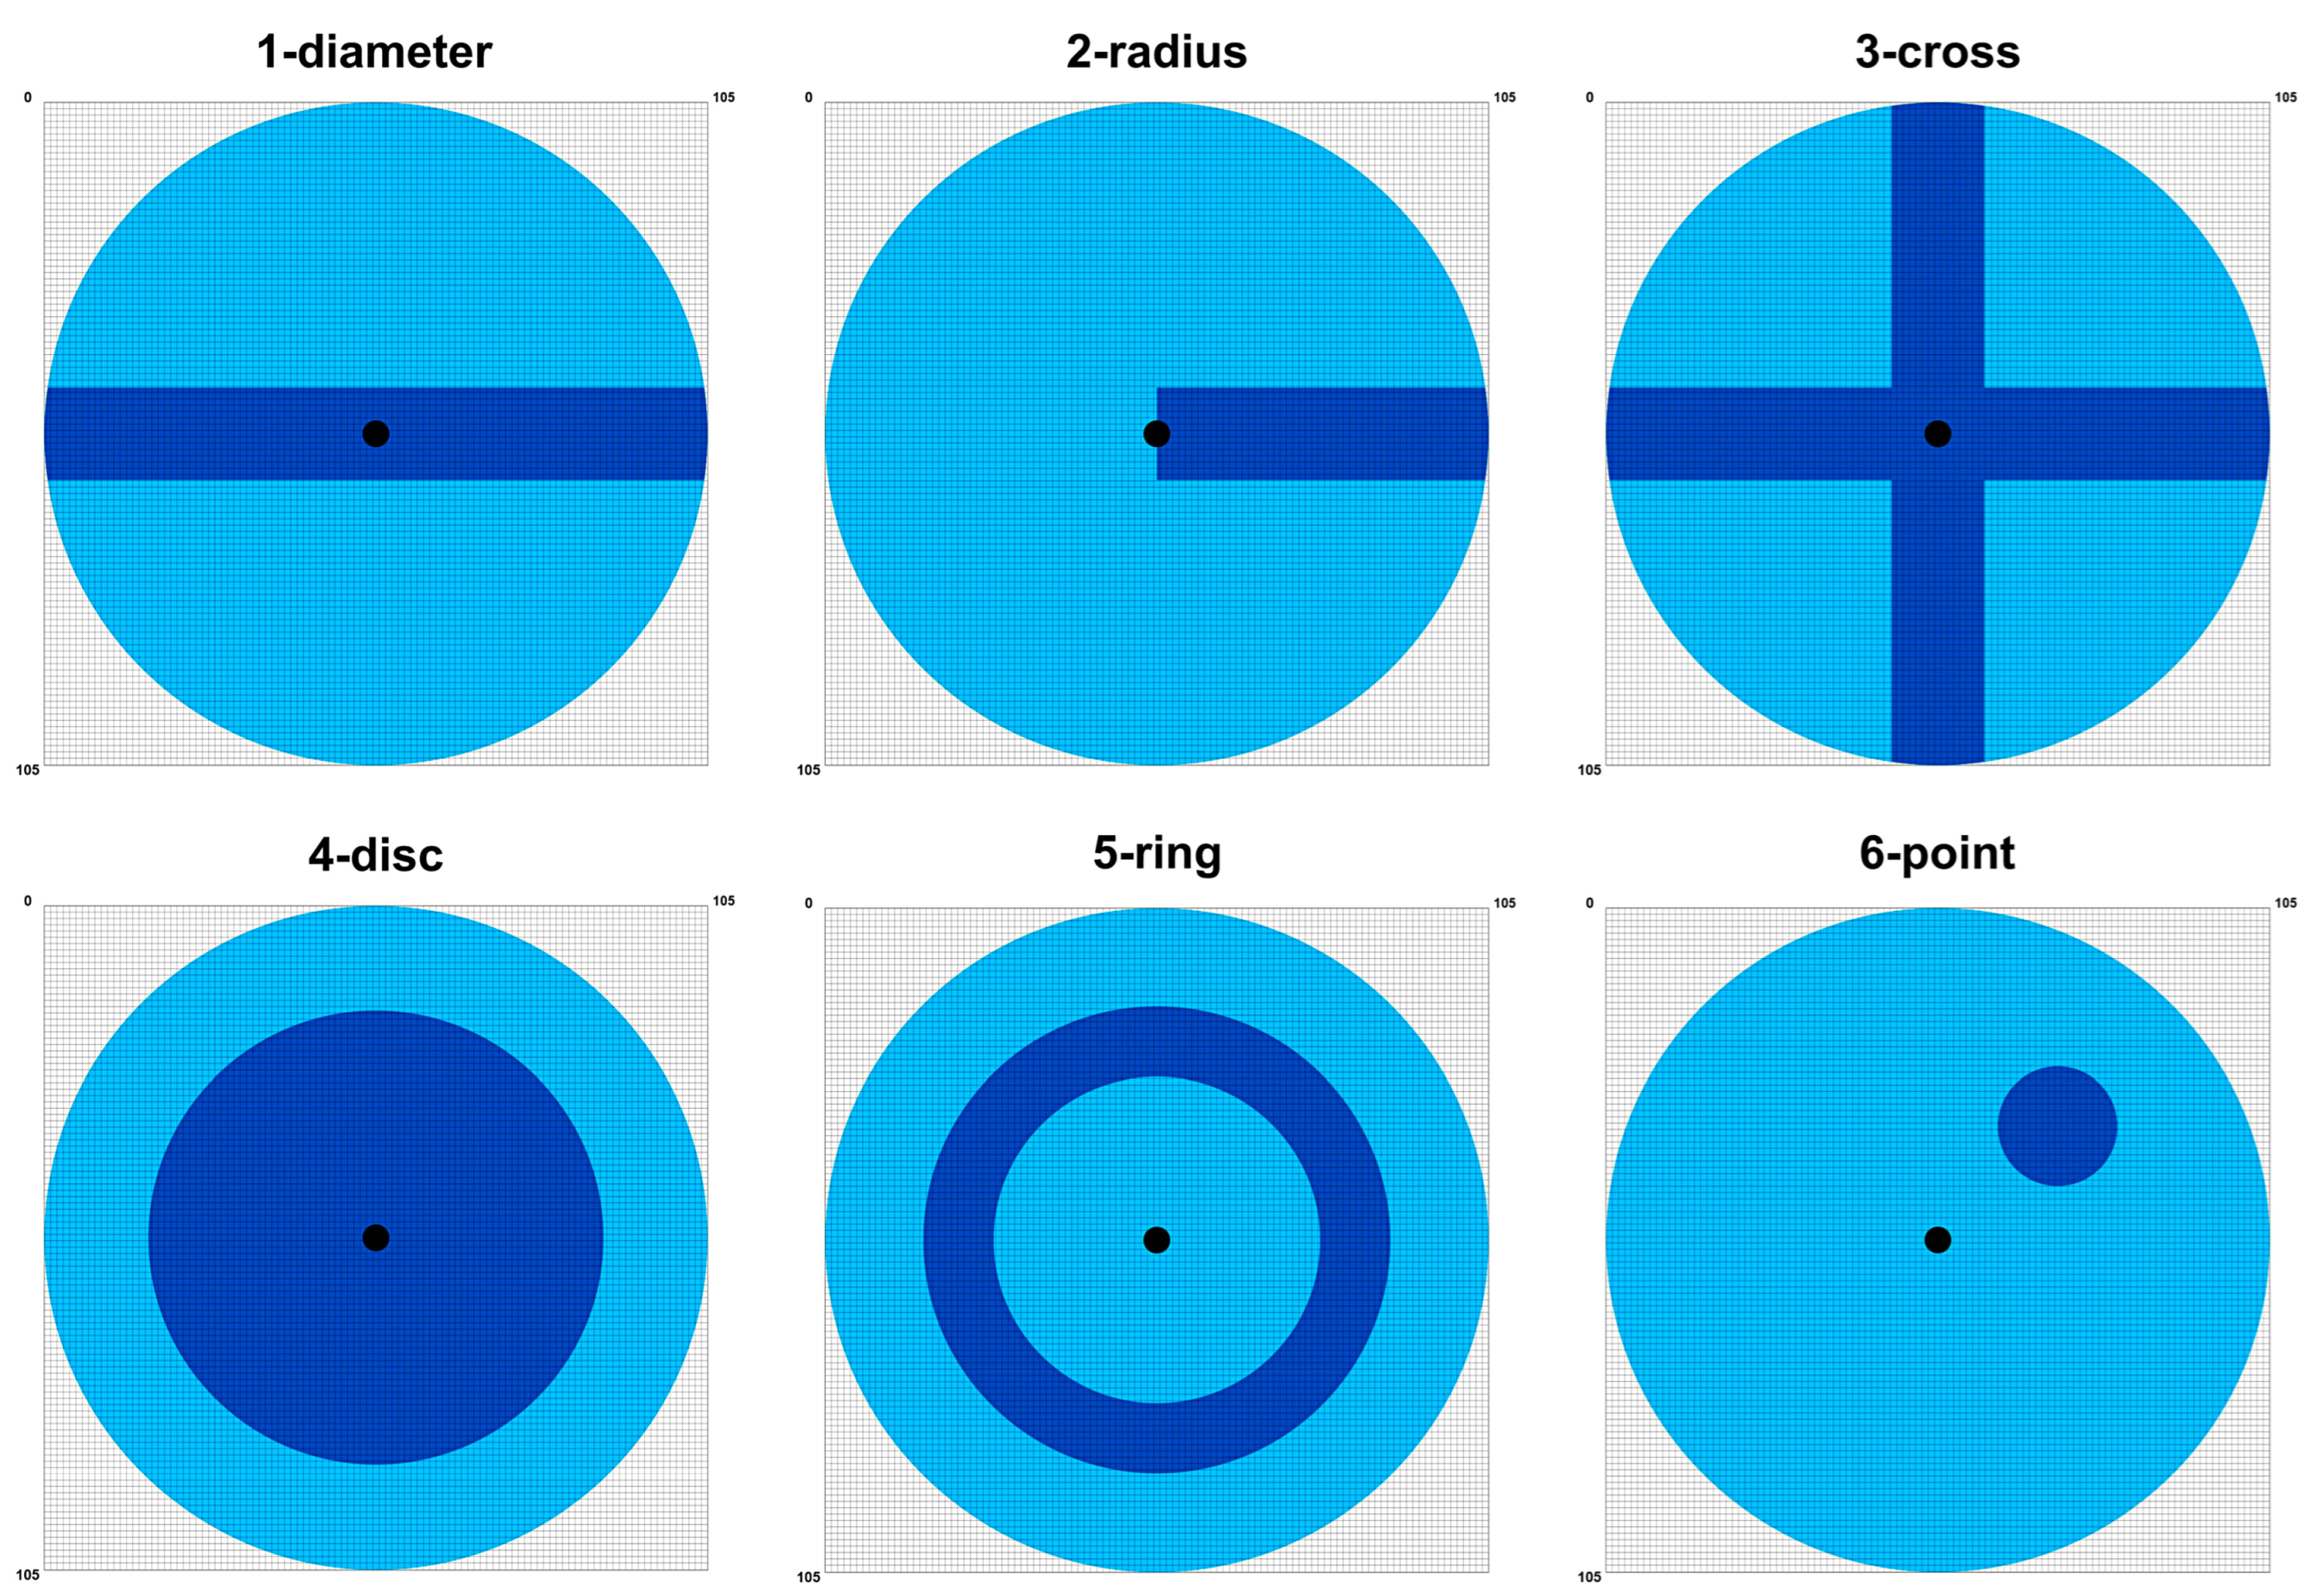
Figure 6.
The three impact points of the dataset sounds.

Figure 7.
The histograms of paste mass distribution across the different paste patterns. The vertical axis provides the number of sounds corresponding to a mass interval of the horizontal axis. The horizontal axis corresponds to 50 bins, and the values are the total mass of paste in kg. (a) All patterns; (b) The no-paste pattern; (c) The diameter pattern; (d) The radius pattern; (e) The cross pattern; (f) The disc pattern; (g) The ring pattern; (h) The point pattern.
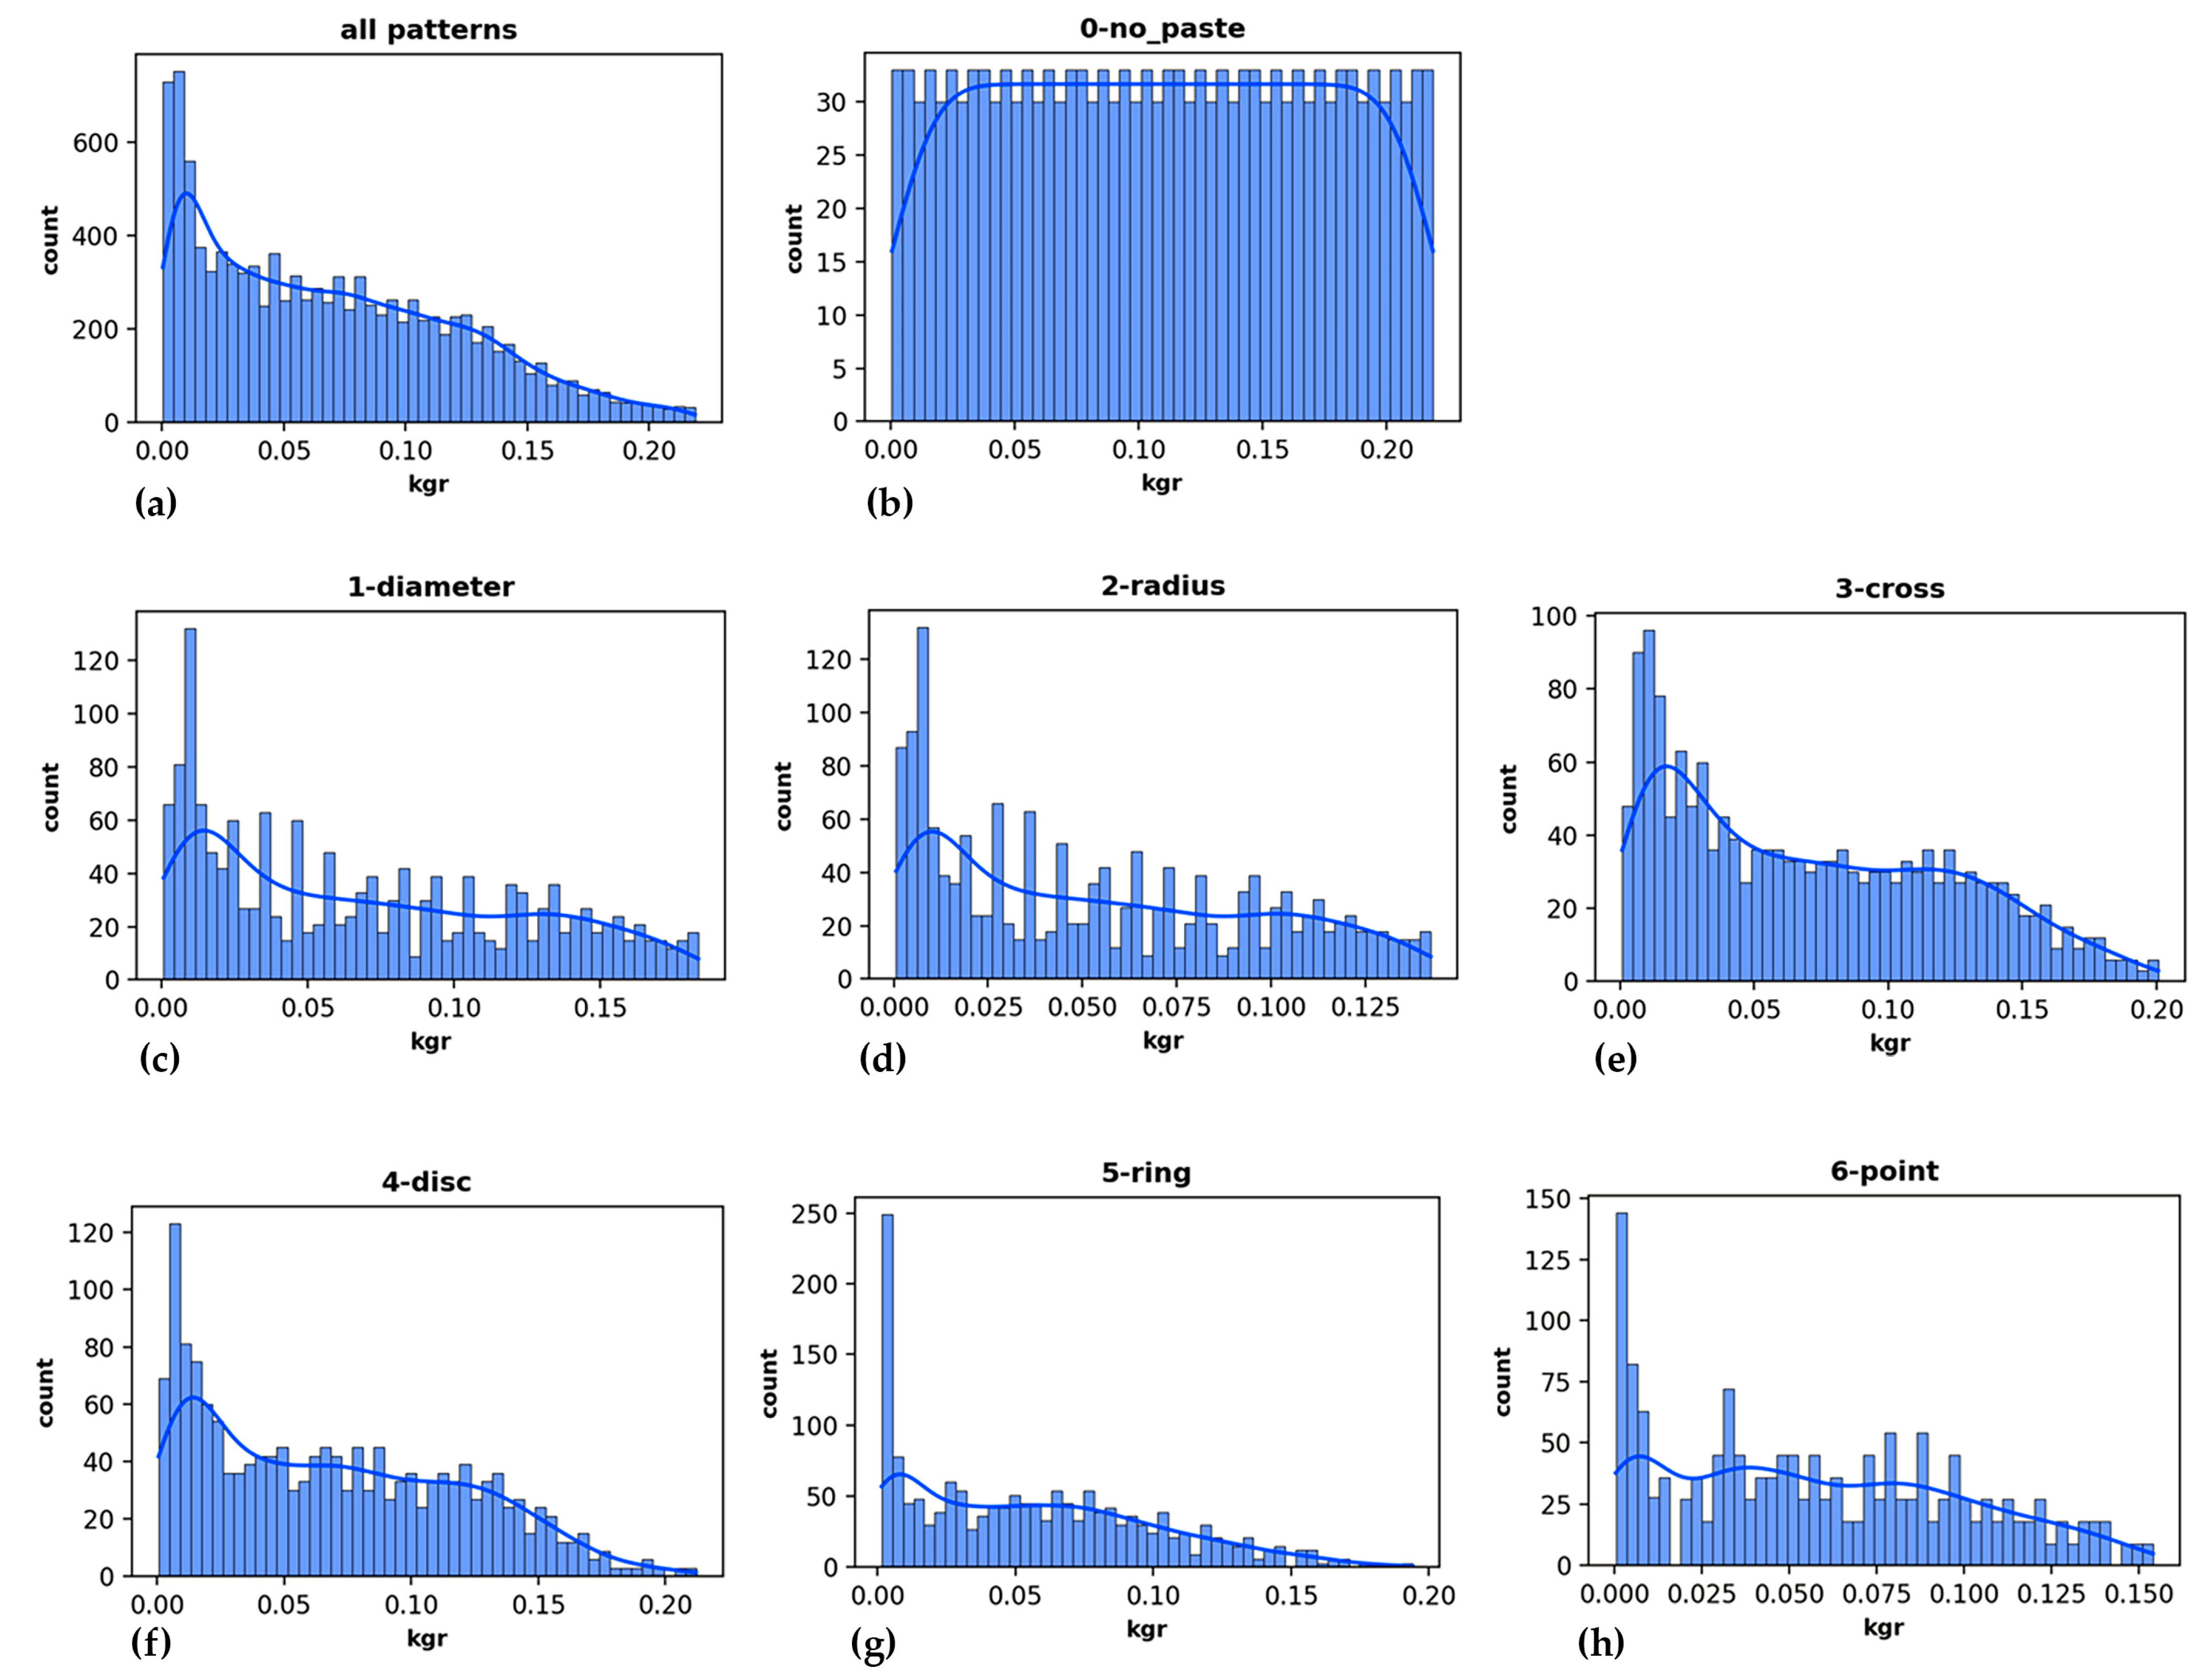
Figure 8.
The FFT spectrum and the grid diagram of the reference membrane (top) and a membrane damped according to the ring pattern (bottom). The red mark on the grid diagrams represents the impact point of the initial excitation at (x, y) = (18, 20).
Figure 8.
The FFT spectrum and the grid diagram of the reference membrane (top) and a membrane damped according to the ring pattern (bottom). The red mark on the grid diagrams represents the impact point of the initial excitation at (x, y) = (18, 20).
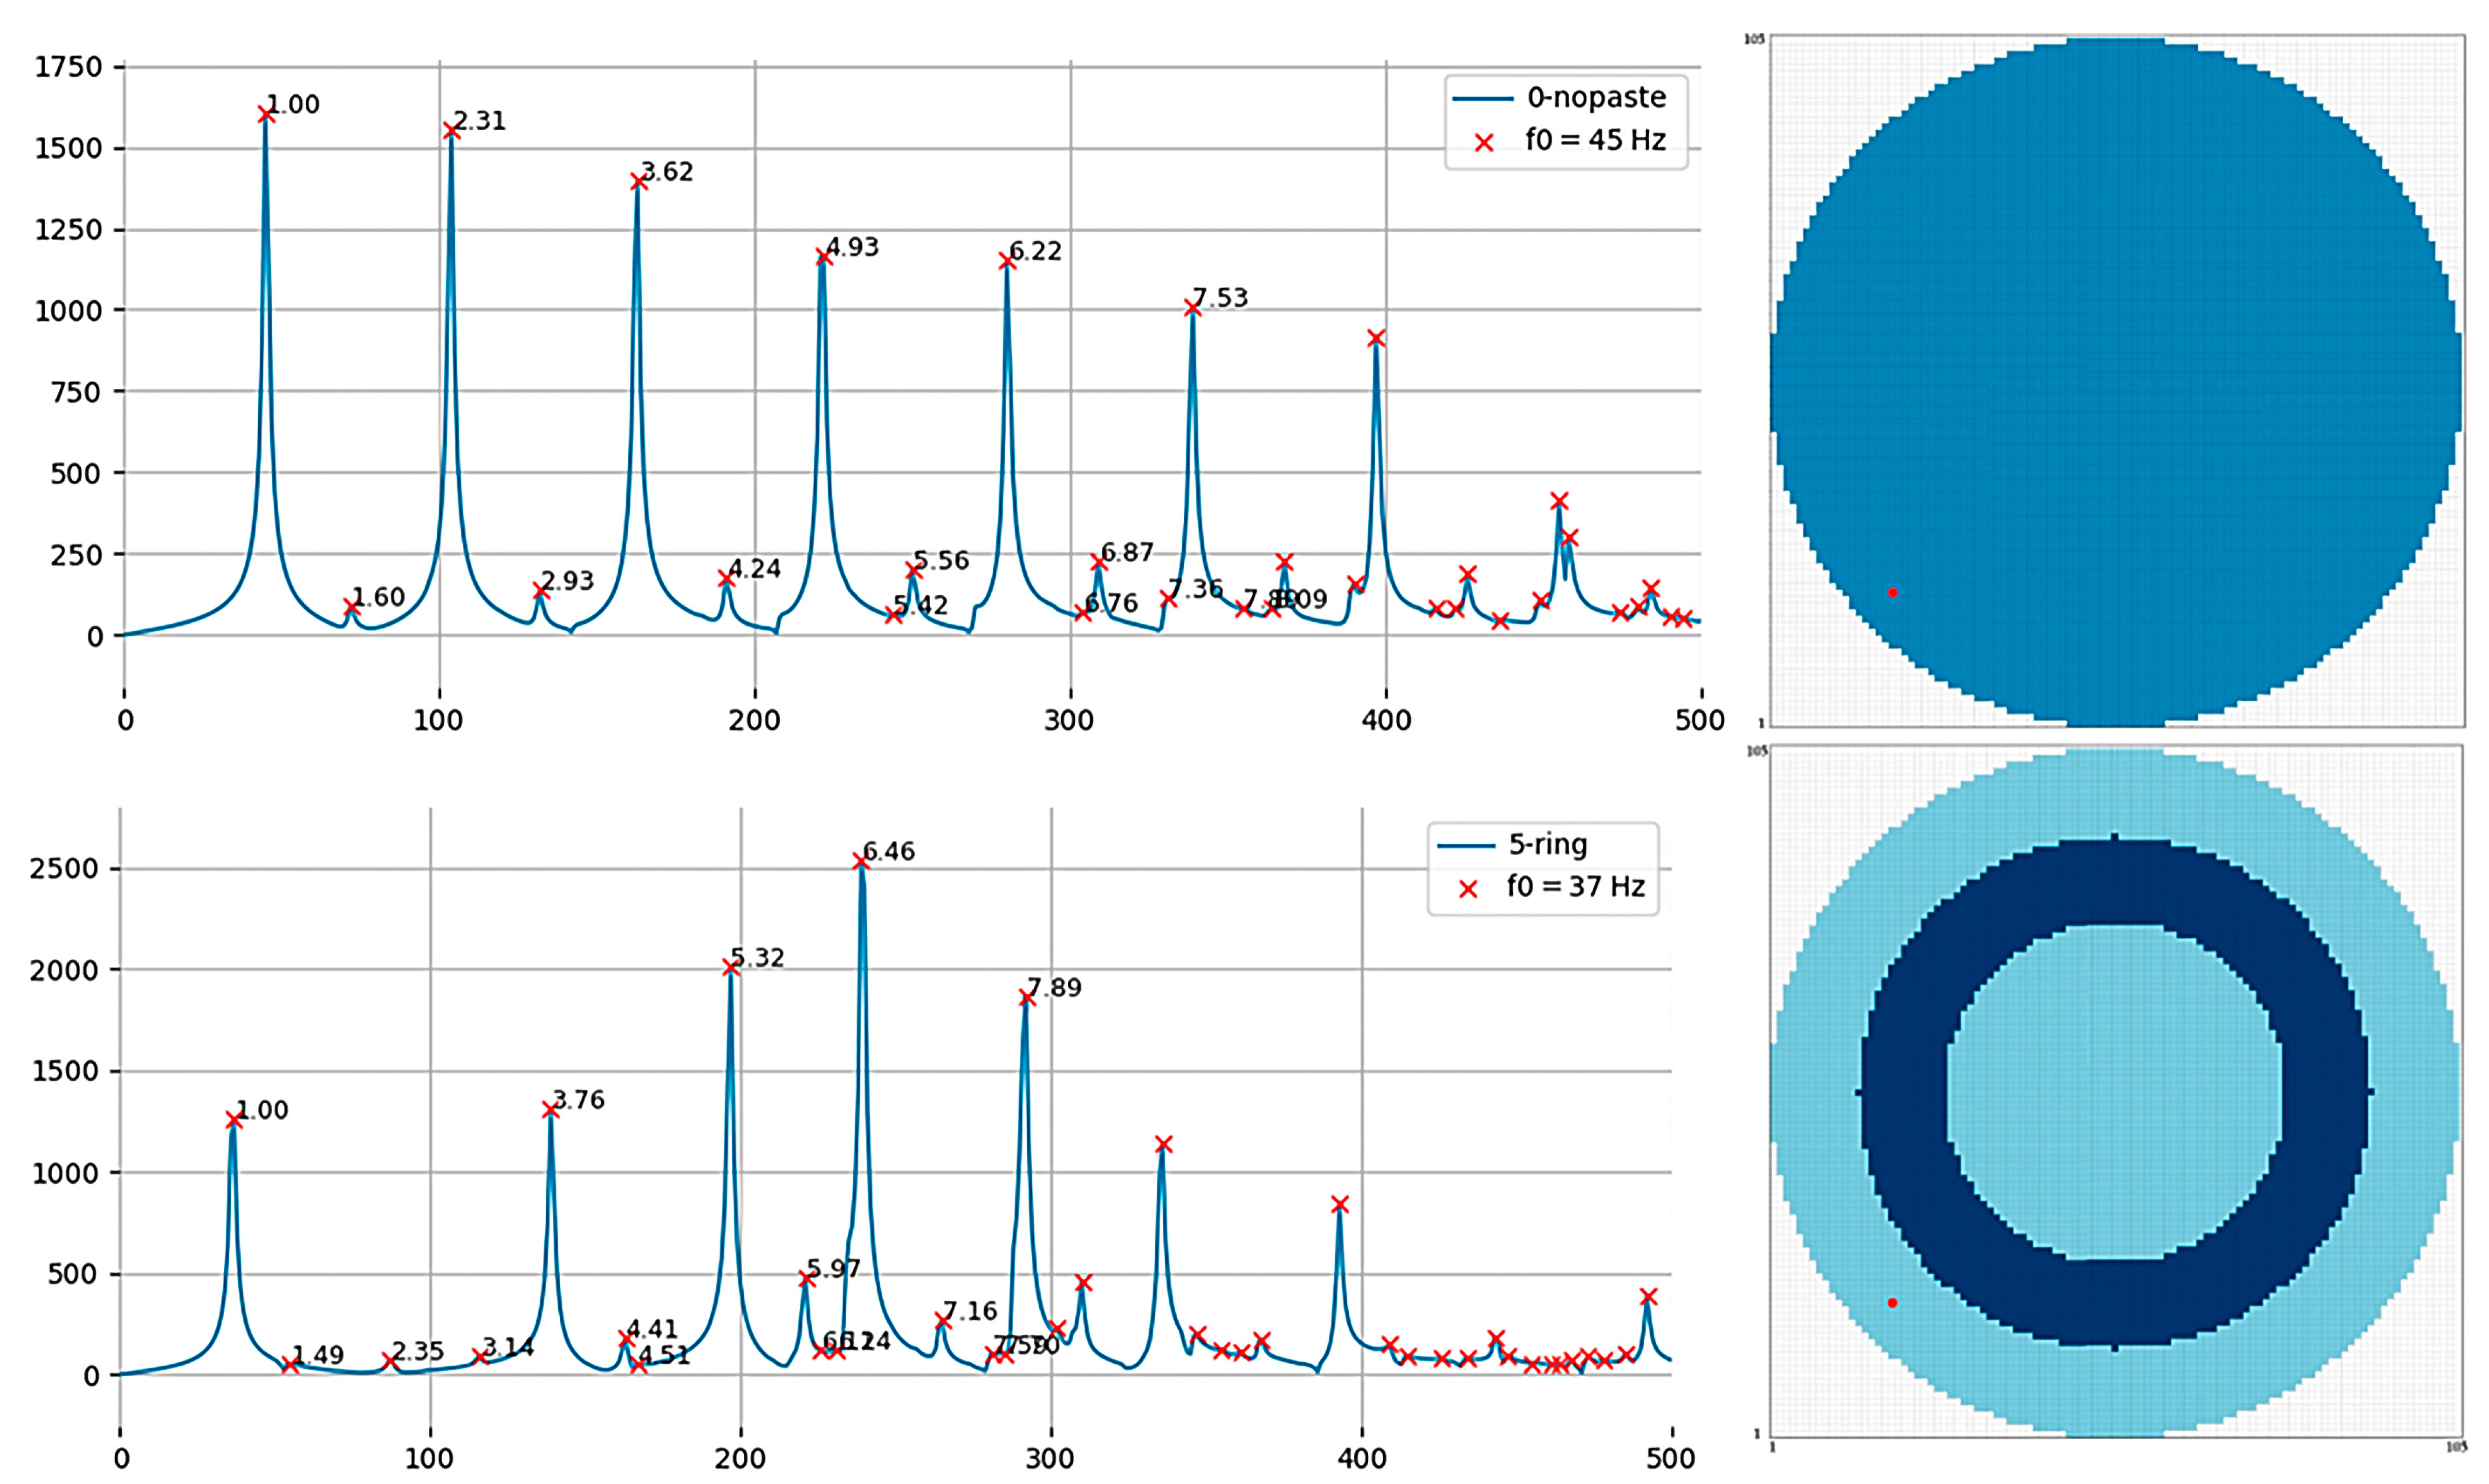
Figure 9.
2D map attained by applying LDA on the amplitude and frequency ratios of the first sixteen FFT partials. (a) Displaying all patterns; (b) The reference membrane (no-paste) and the point pattern; (c) The disc pattern covers the no-paste pattern; (d) The ring pattern overlaps with the top of the disc pattern; (e) The diameter pattern is located away from circular patterns; (f) The diameter pattern has a slight overlap with the point patterns; (g) The radius pattern appears on the intersection of the diameter and the point pattern; (h) The cross pattern appears on the intersection of the radius and the diameter pattern.
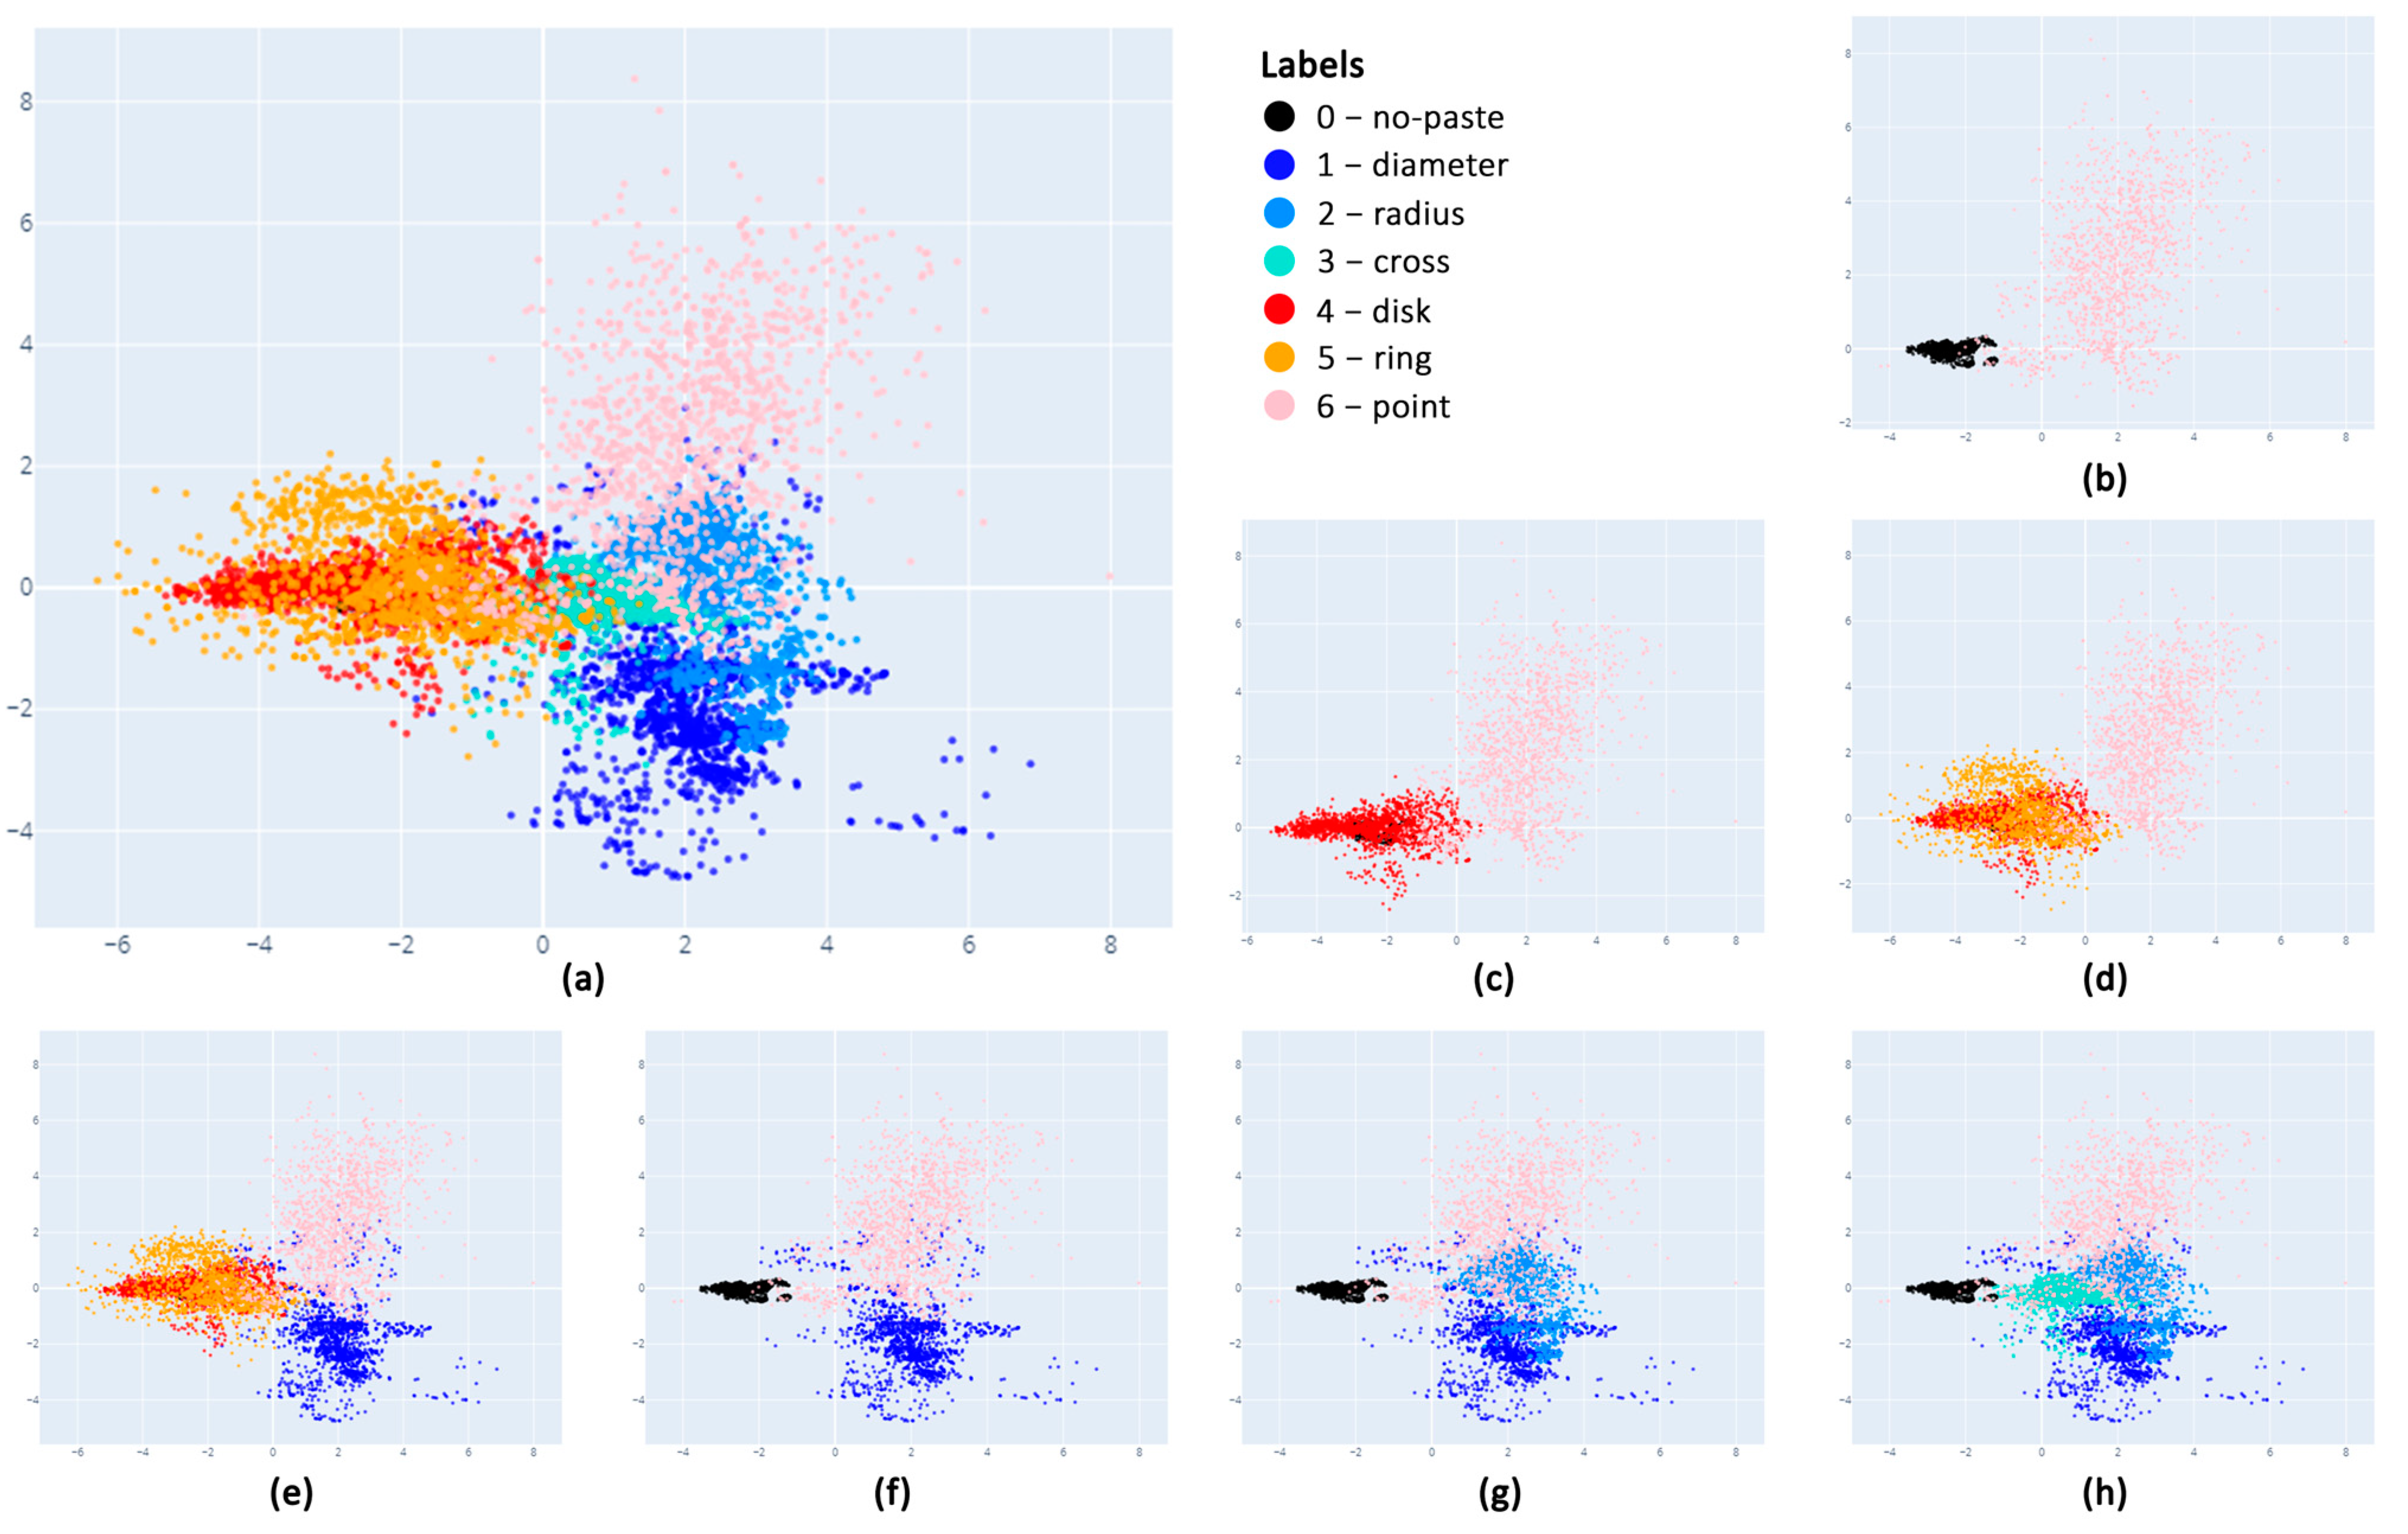
Figure 10.
2D map attained by applying PCA on the sounds of the dataset after subsampling to 22,050 Hz. (a) Displaying all patterns; (b) The reference membrane (no-paste) and the point pattern. The three black trajectories correspond to the three impact points of membrane striking; (c) Adding the disk patter; (d) Adding the ring pattern; (e) Adding the diameter pattern; (f) The alignment of the diameter pattern on the no-paste pattern; (g) Adding the radius pattern on (f); (g) Adding the radius pattern; (h) Adding the cross pattern.
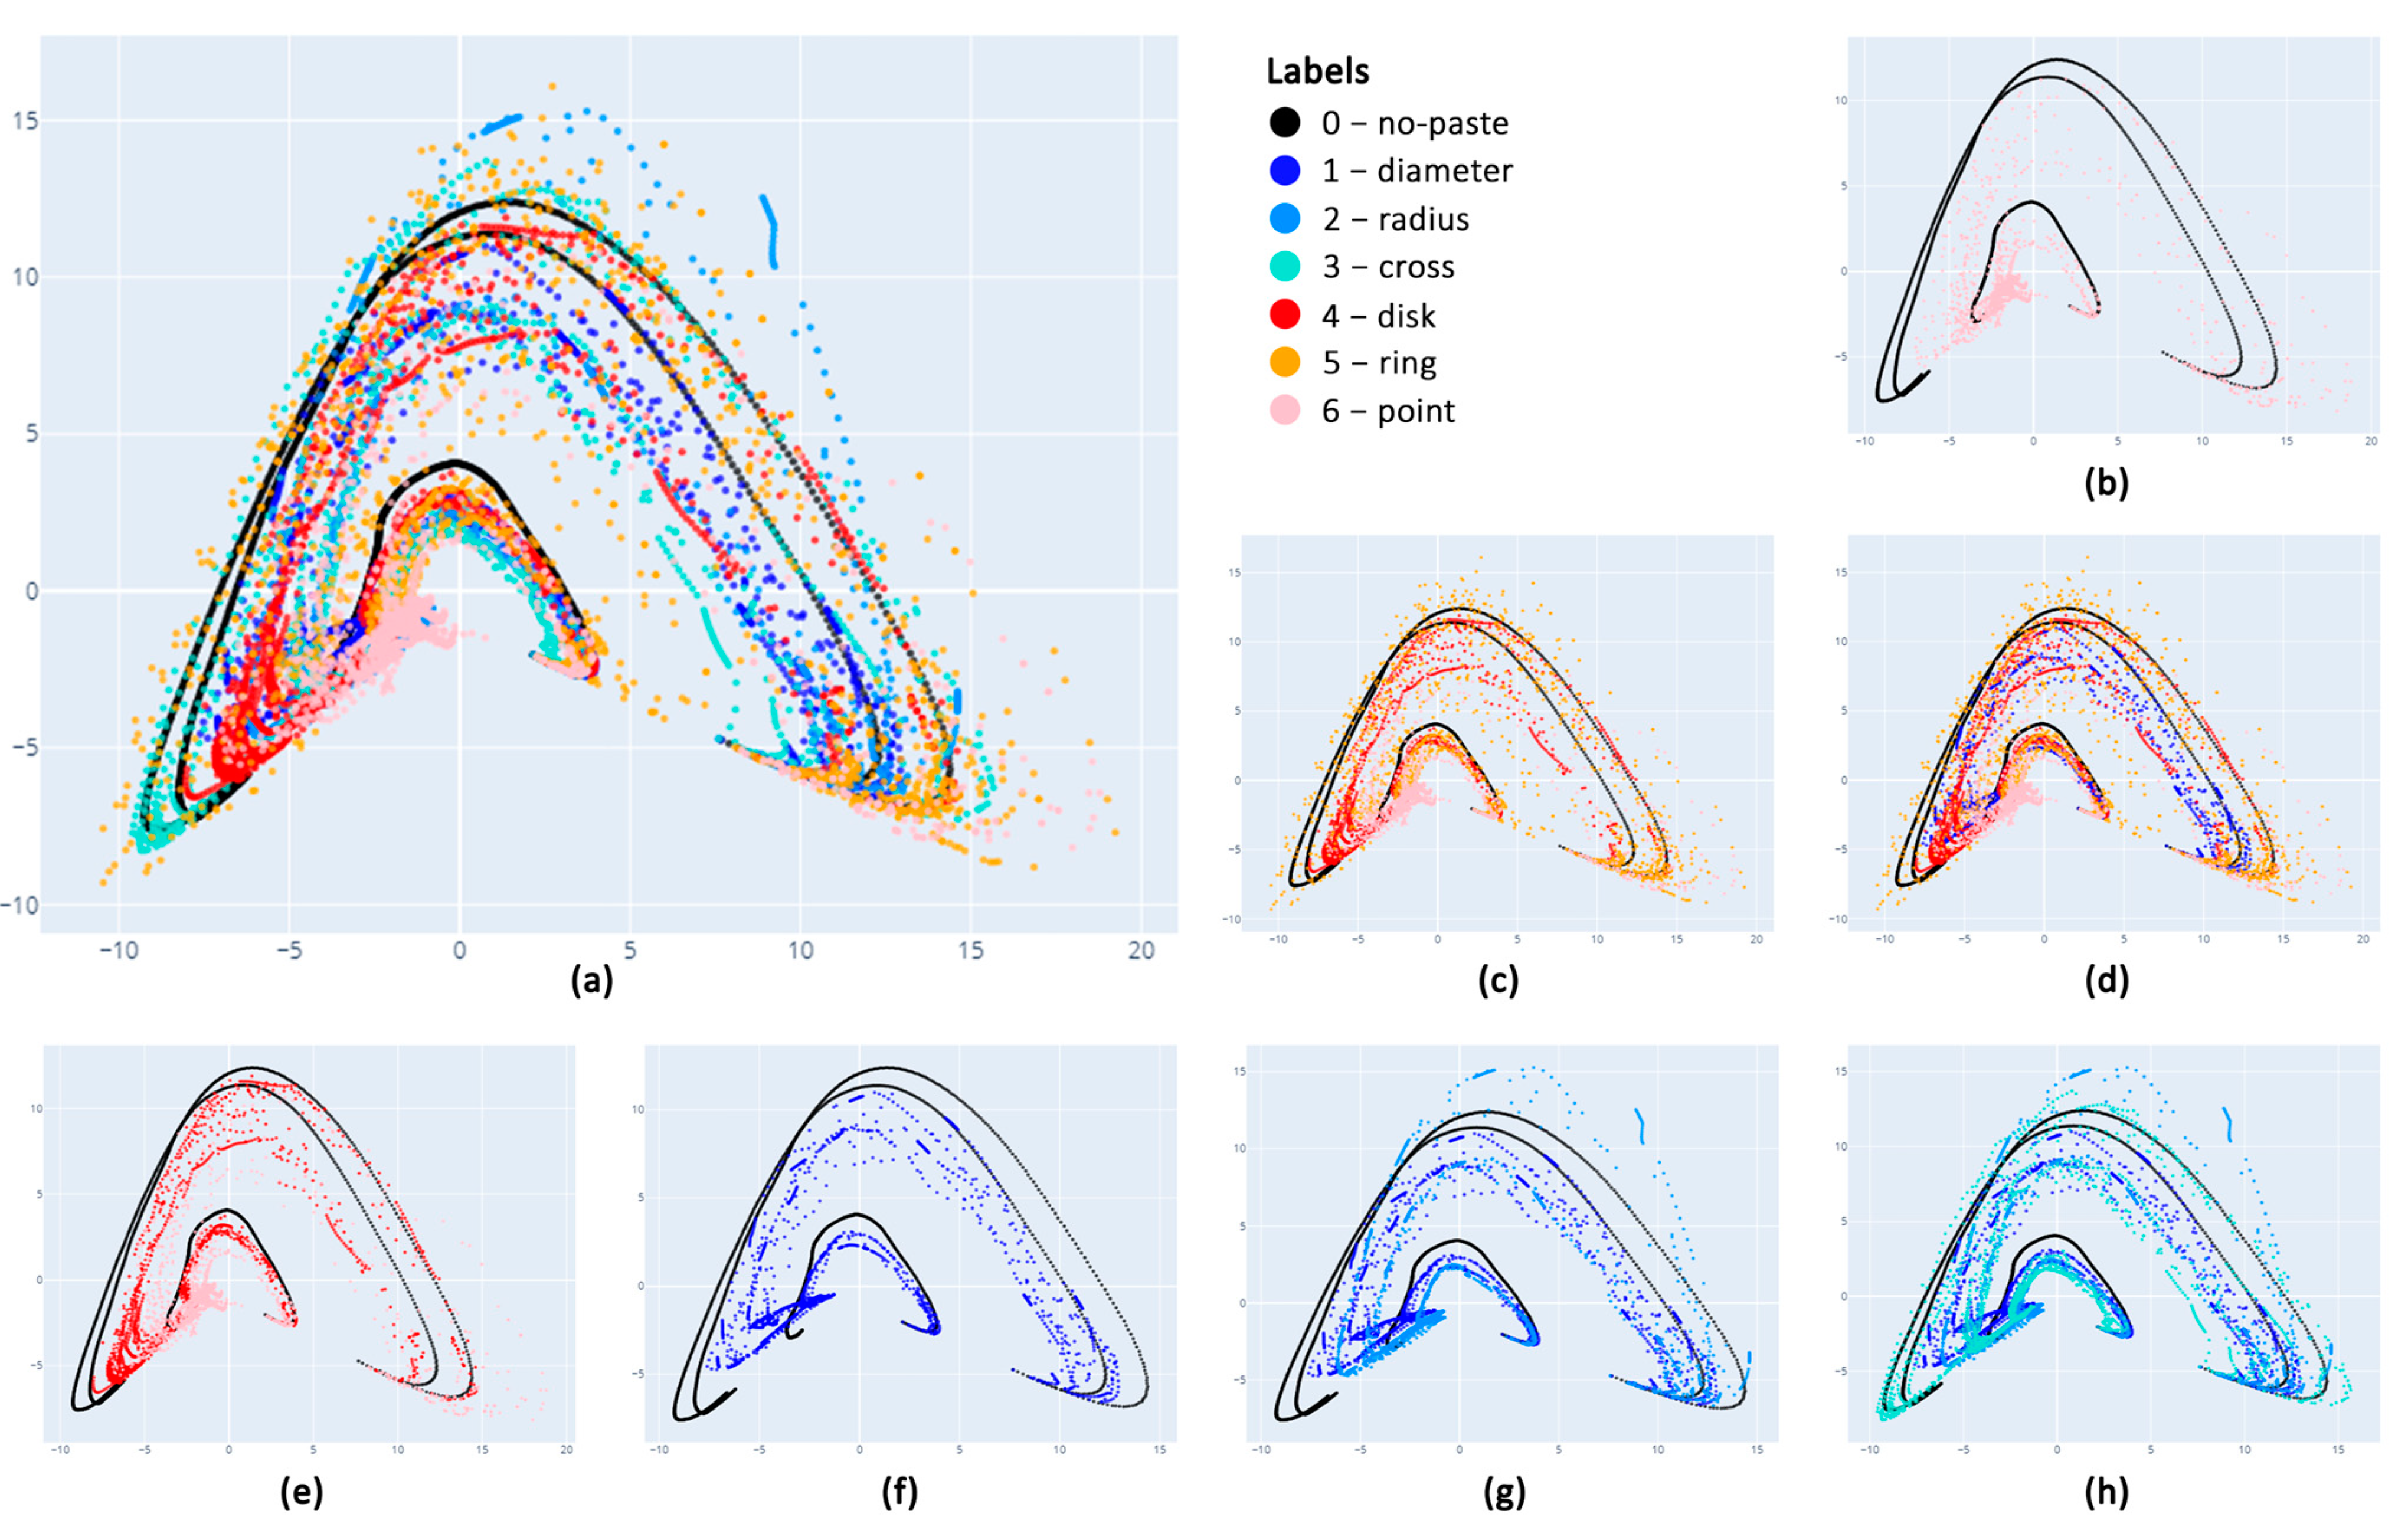
Figure 11.
The architecture of the multi-output CNN that was implemented to infer paste pattern and paste mass.
Figure 11.
The architecture of the multi-output CNN that was implemented to infer paste pattern and paste mass.
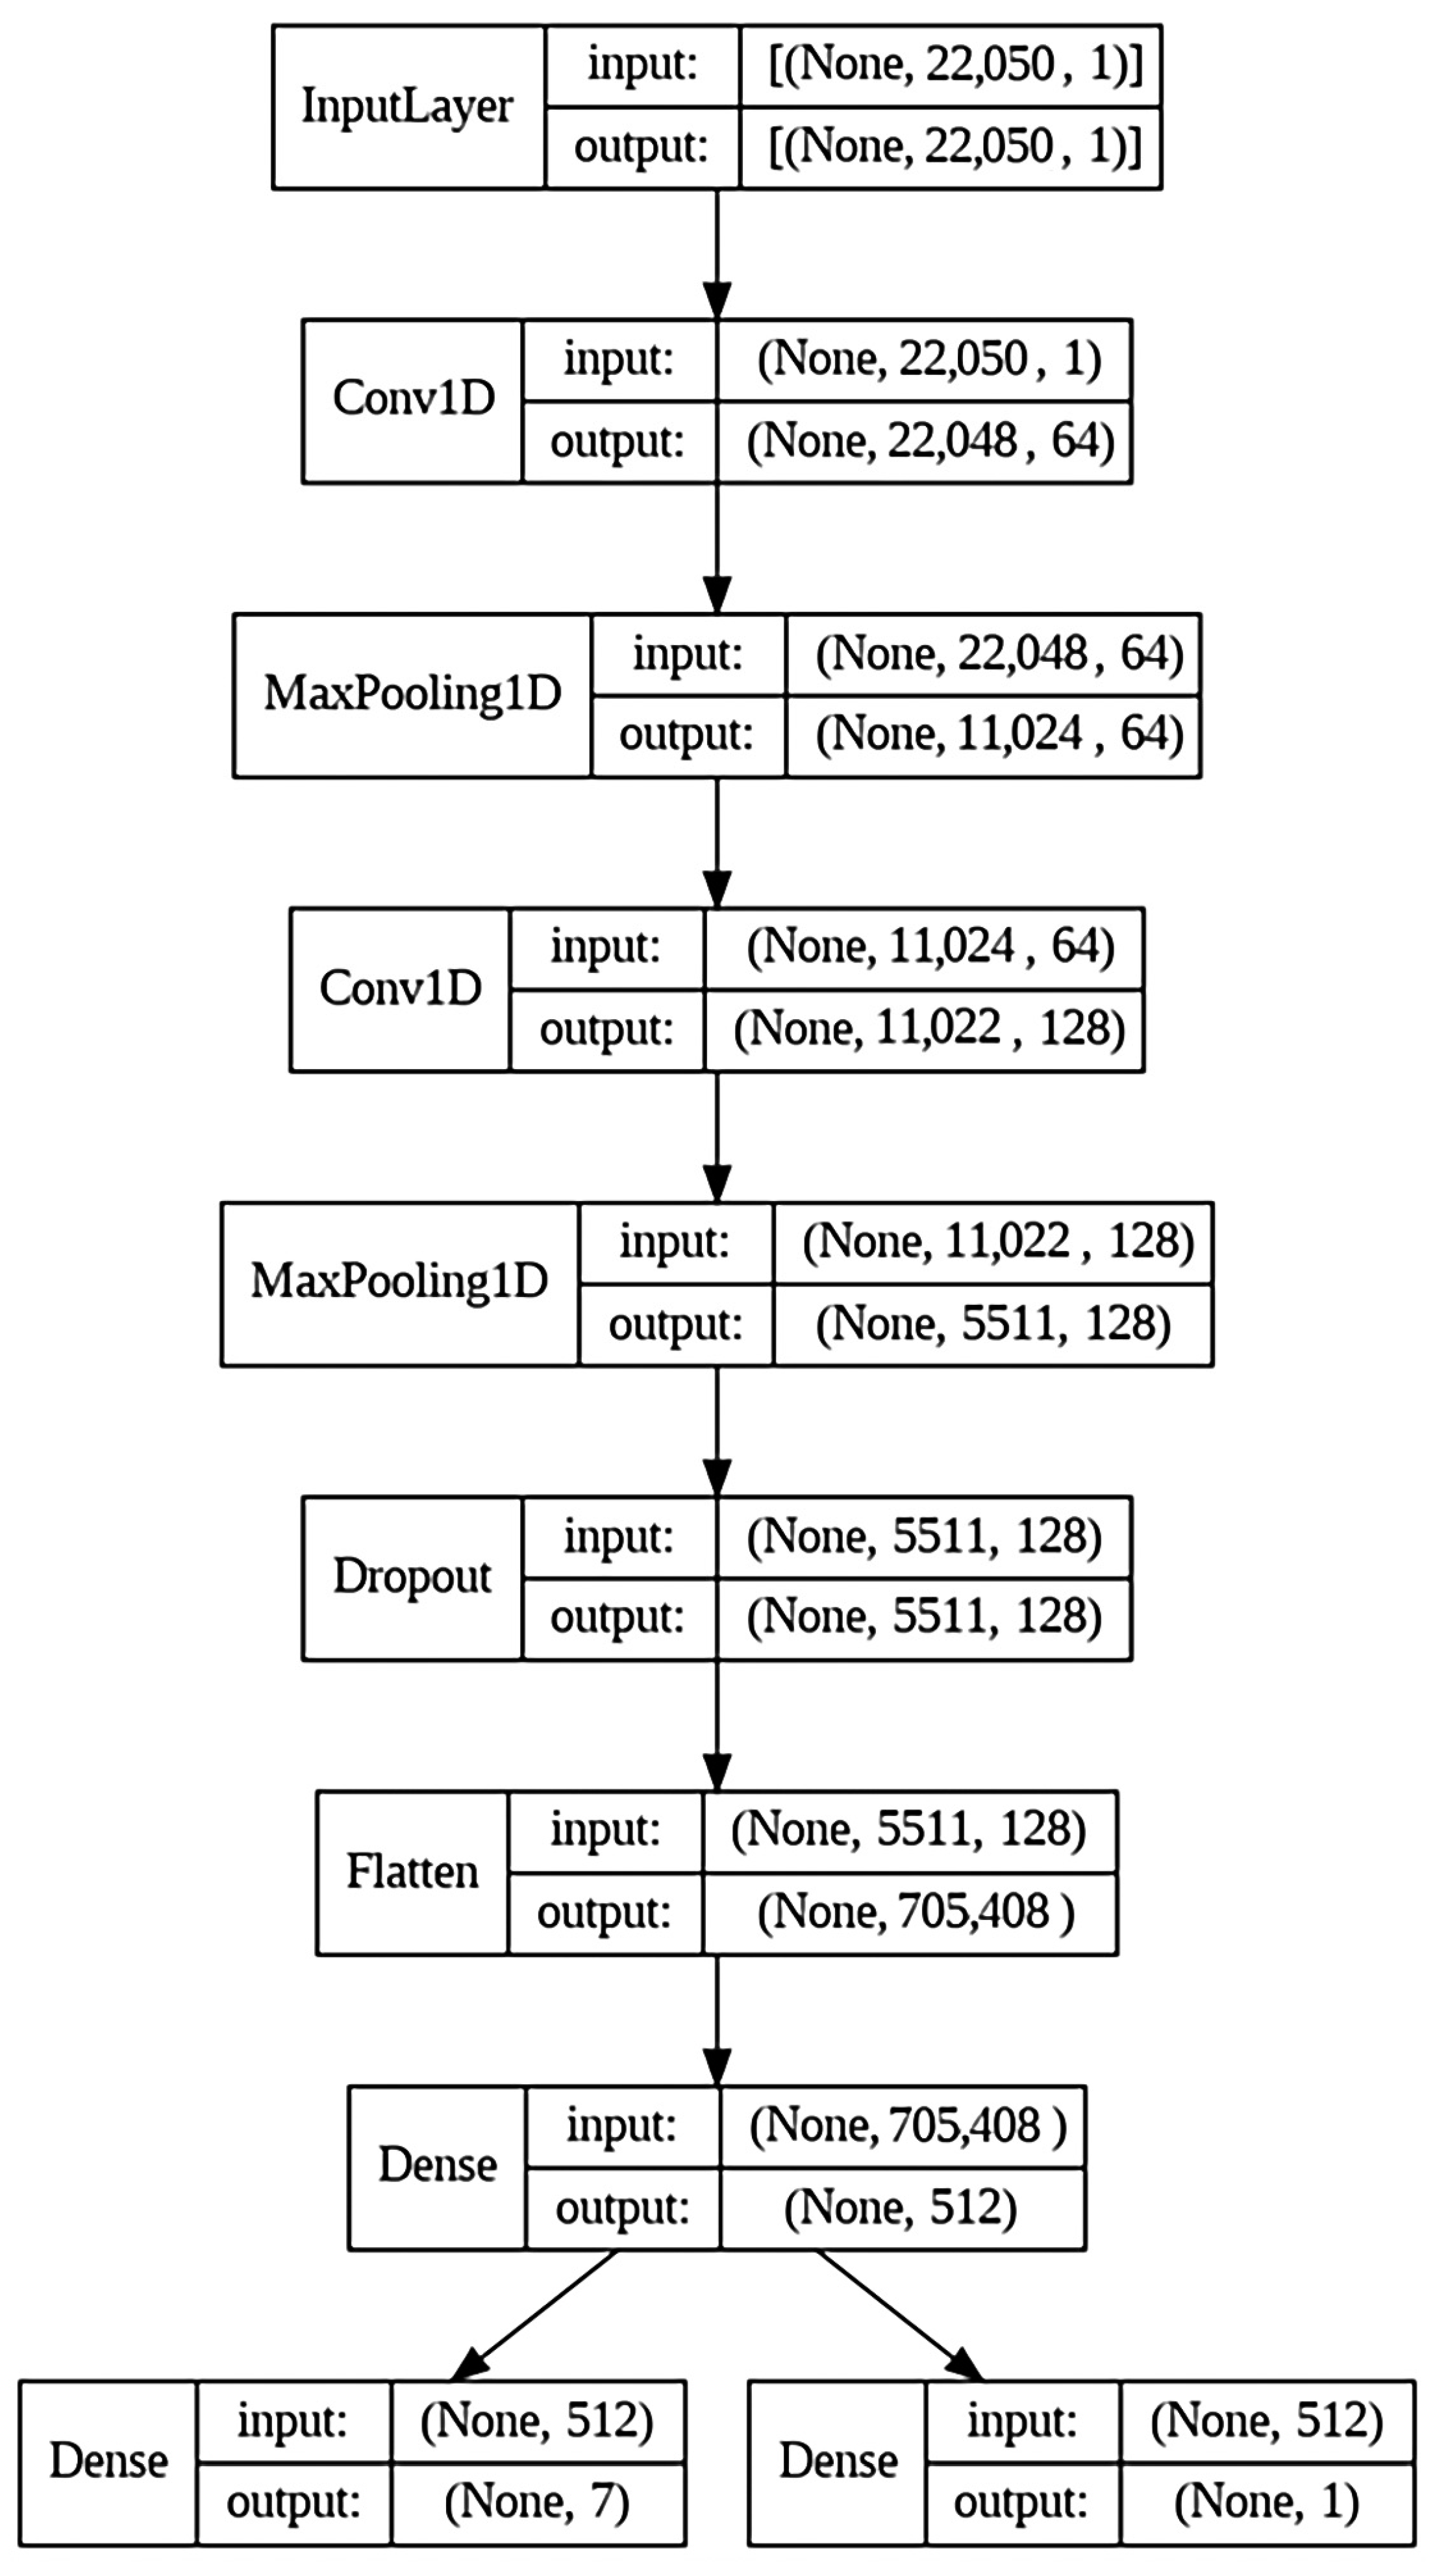
Figure 12.
The training history of the multi-output network. (a) The classification loss during training is represented by the values of CCE; (b) The regression loss during training is represented by the values of MSE.
Figure 12.
The training history of the multi-output network. (a) The classification loss during training is represented by the values of CCE; (b) The regression loss during training is represented by the values of MSE.
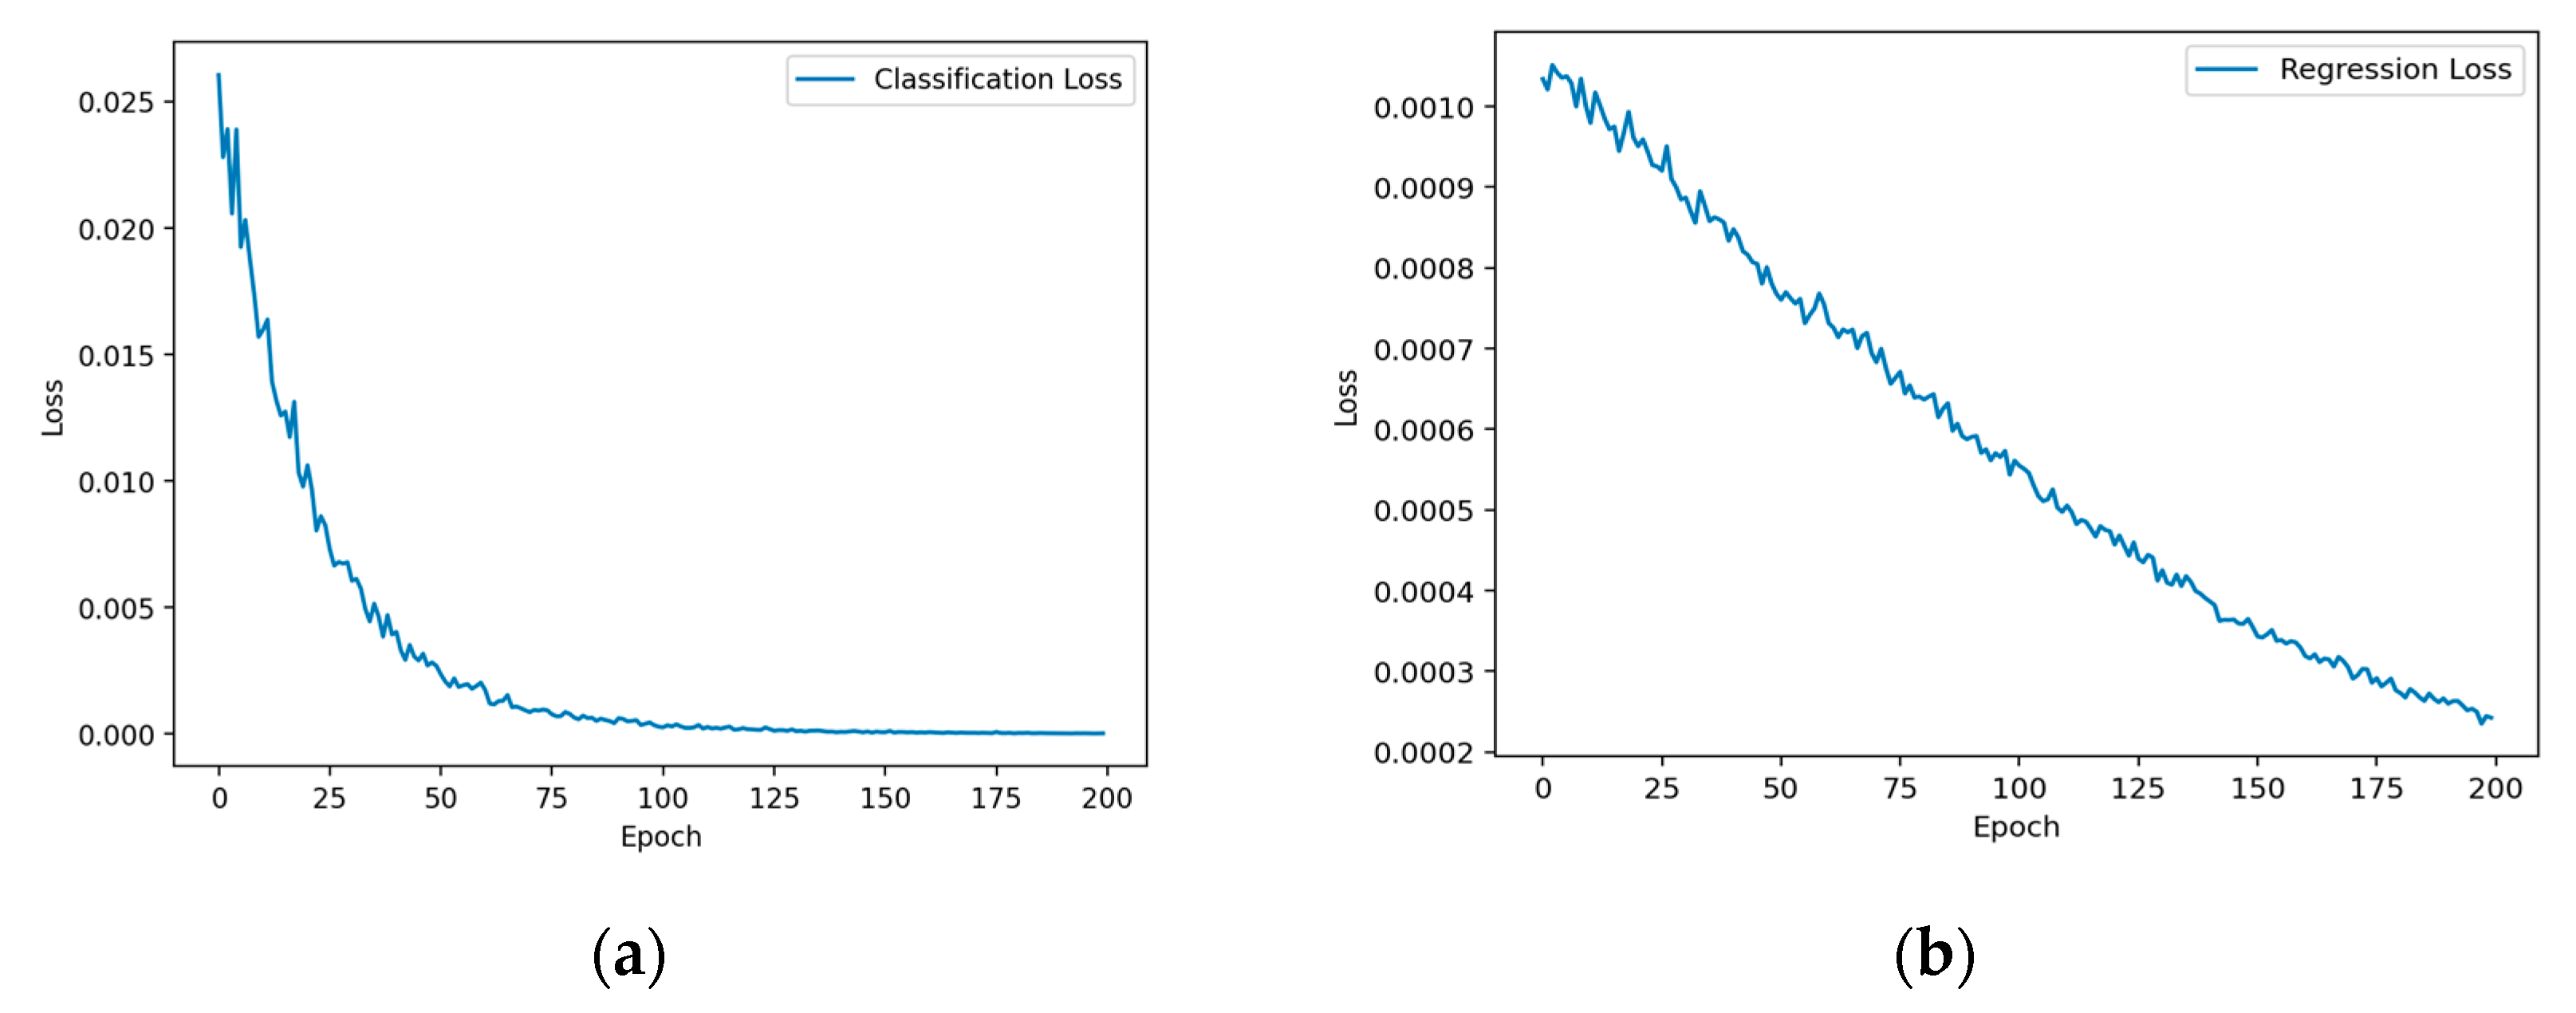
Figure 13.
The confusion matrix depicting the performance of paste pattern classification in the test set of 2779 ‘unseen’ sounds. The numbers reveal a classification accuracy of 97.40%.
Figure 13.
The confusion matrix depicting the performance of paste pattern classification in the test set of 2779 ‘unseen’ sounds. The numbers reveal a classification accuracy of 97.40%.

Table 1.
The parameters that were used to provide different sounds in the dataset. A total number of 11,114 sounds were synthesized. Please note that the # symbol represents the number of values considered within the value range of the preceding column.
Table 1.
The parameters that were used to provide different sounds in the dataset. A total number of 11,114 sounds were synthesized. Please note that the # symbol represents the number of values considered within the value range of the preceding column.
| Pattern | Parameter | ||||||
|---|---|---|---|---|---|---|---|
| Value Range | # | ||||||
| 0-no_paste | Thickness (mm) | ||||||
| 3.01–6.70 (×10−3) | 529 | ||||||
| 1587 sounds | |||||||
| 1-diameter | Paste (%) | Width (m) | # | ||||
| 20–280.1 | 45 | 0.01–0.15 | 15 | ||||
| 1590 sounds | |||||||
| 2-radius | Paste (%) | Width (m) | |||||
| 30–430.1 | 45 | 0.01–0.15 | 15 | ||||
| 1590 sounds | |||||||
| 3-cross | Paste (%) | Width (m) | |||||
| 10–180.1 | 45 | 0.01–0.15 | 15 | ||||
| 1590 sounds | |||||||
| 4-disc | Paste (%) | Disc Radius (%) | # | ||||
| 10–150.1 | 39 | 20–91 | 19 | ||||
| 1590 sounds | |||||||
| 5-ring | Paste (%) | Outer radius (%) | # | Ring Width (m) | # | ||
| 20–220.1 | 13 | 33.642–95.01 | 14 | 0.02–0.081 | 8 | ||
| 1590 sounds | |||||||
| 6-point | Paste (%) | Point Width (m) | # | Point Center (x, y) | |||
| 20–550.1 | 22 | 2.698–10.1 (×10−2) | 16 | (50, 55) (60, 65) (70, 75) | 3 | ||
| 1577 sounds | |||||||
Table 2.
The performance of the classification task of paste pattern identification for the test set.
Table 2.
The performance of the classification task of paste pattern identification for the test set.
| Pattern | Support | Precision | Recall | F1-Score |
|---|---|---|---|---|
| 0-no_paste | 397 | 0.96 | 0.98 | 0.97 |
| 1-diameter | 397 | 1.00 | 0.99 | 0.99 |
| 2-radius | 398 | 1.00 | 1.00 | 1.00 |
| 3-cross | 398 | 0.99 | 0.98 | 0.98 |
| 4-disk | 397 | 0.92 | 0.94 | 0.93 |
| 5-ring | 398 | 0.98 | 0.96 | 0.97 |
| 6-point | 394 | 0.98 | 0.96 | 0.97 |
| Sum or W. A. | 2779 | 0.97 | 0.97 | 0.97 |
Table 3.
The performance of the regression task of paste mass estimation per distribution pattern in the test set.
Table 3.
The performance of the regression task of paste mass estimation per distribution pattern in the test set.
| Pattern | Support | MAE | RMSE | MSE | R2 |
|---|---|---|---|---|---|
| 0-no_paste | 397 | 0.007852 | 0.010579 | 0.000112 | 0.998635 |
| 1-diameter | 397 | 0.011495 | 0.015769 | 0.000249 | 0.995792 |
| 2-radius | 398 | 0.010492 | 0.014440 | 0.000209 | 0.994602 |
| 3-cross | 398 | 0.018441 | 0.025068 | 0.000628 | 0.989025 |
| 4-disk | 397 | 0.024338 | 0.035043 | 0.001228 | 0.976437 |
| 5-ring | 398 | 0.037186 | 0.059321 | 0.003519 | 0.908942 |
| 6-point | 394 | 0.028524 | 0.038044 | 0.001447 | 0.960487 |
| Sum or W. A. | 2779 | 0.019754 | 0.028318 | 0.001056 | 0.974850 |
Disclaimer/Publisher’s Note: The statements, opinions and data contained in all publications are solely those of the individual author(s) and contributor(s) and not of MDPI and/or the editor(s). MDPI and/or the editor(s) disclaim responsibility for any injury to people or property resulting from any ideas, methods, instructions or products referred to in the content. |
© 2023 by the authors. Licensee MDPI, Basel, Switzerland. This article is an open access article distributed under the terms and conditions of the Creative Commons Attribution (CC BY) license (https://creativecommons.org/licenses/by/4.0/).
Share and Cite
MDPI and ACS Style
Alexandraki, C.; Starakis, M.; Zervas, P.; Bader, R. Inferring Drumhead Damping and Tuning from Sound Using Finite Difference Time Domain (FDTD) Models. Acoustics 2023, 5, 798-816. https://doi.org/10.3390/acoustics5030047
AMA Style
Alexandraki C, Starakis M, Zervas P, Bader R. Inferring Drumhead Damping and Tuning from Sound Using Finite Difference Time Domain (FDTD) Models. Acoustics. 2023; 5(3):798-816. https://doi.org/10.3390/acoustics5030047
Chicago/Turabian StyleAlexandraki, Chrisoula, Michael Starakis, Panagiotis Zervas, and Rolf Bader. 2023. "Inferring Drumhead Damping and Tuning from Sound Using Finite Difference Time Domain (FDTD) Models" Acoustics 5, no. 3: 798-816. https://doi.org/10.3390/acoustics5030047