Article

Flow Dynamics and Acoustics from Glottal Vibrations at Different Frequencies

1
Department of Biomedical Engineering, University of Massachusetts, Lowell, MA 01854, USA
2
Department of Aerospace, Industrial and Mechanical Engineering, California Baptist University, Riverside, CA 92504, USA
3
Department of Mechanical and Aerospace Engineering, University of Virginia, Charlottesville, VA 22904, USA
*
Author to whom correspondence should be addressed.
Acoustics 2022, 4(4), 915-933; https://doi.org/10.3390/acoustics4040056
Submission received: 13 September 2022 / Revised: 11 October 2022 / Accepted: 14 October 2022 / Published: 28 October 2022
(This article belongs to the Special Issue Vibration and Noise)

Abstract

:
Glottal vibration is fundamental to breathing-related disorders and respiratory sound generation. However, responses of the flow and acoustics to glottal vibrations of different frequencies are unclear. The objective of this study is to numerically evaluate the influences of glottal vibration frequencies on inspiratory airflow dynamics and flow-induced sound signals; this is different from normal phonation that is driven by controlled expiratory flows. A computational model was developed that comprised an image-based mouth–throat–lung model and a dynamic glottis expanding/contracting following a sinusoidal waveform. Large Eddy simulations were used to solve the temporal and spatial flow evolutions, and pressure signals were analyzed using different transform algorithms (wavelet, Hilbert, Fourier, etc.). Results show that glottal vibrations significantly altered the flows in the glottis and trachea, especially at high frequencies. With increasing vibration frequencies, the vortices decreased in scale and moved from the main flow to the walls. Phase shifts occurred between the glottis motion and glottal flow rates for all frequencies considered. Due to this phase shift, the pressure forces resisted the glottal motion in the first half of contraction/expansion and assisted the glottal motion in the second half of contraction/expansion. The magnitude of the glottal flow fluctuation was approximately linear with the vibration frequency (~f0), while the normal pressure force increased nonlinearly with the frequency (~f01.85). Instantaneous pressure signals were irregular at low vibration frequencies (10 and 20 Hz) but became more regular with increasing frequencies in the pressure profile, periodicity, and wavelet-transformed parameters. The acoustic characteristics specific to the glottal vibration frequency were explored in temporal and frequency domains, which may be used individually or as a combination in diagnosing vocal fold dysfunction, snoring, sleep apnea, or other breathing-related diseases.

1. Introduction

The glottis is one of the minimal flow conduits in the upper respiratory tract and is one primary source of flow turbulence and sound generation. The glottal aperture changes in shape and size periodically, generating complex patterns of flows and vortices [1,2]. Previous studies demonstrated highly oscillating features of the laryngeal flow jet and intensive vortex shedding caused by glottal vibrations [3,4], reflective of the insufficiency of using a time series of static apertures to approximate dynamic respiratory dynamics [5,6]. The glottal vibrations modified the laryngeal jet instability and vortex generation. For instance, the glottal opening (abduction) postponed the onset of vortex shedding, flow fluctuation, and intra-glottal pressure variation, which eased the demand for diaphragm muscle work and decreased the risk of pharynx collapse [7].
Vast differences exist in glottal vibration among individuals in waveform and frequencies. Patel et al. [8] recorded the vocal fold vibrations using a high-speed camera at 4000 frames per second during sustained phonation in 27 children (5–9 years old) and 35 adults (21–45 years old). The glottal vibration was measured to be 295 ± 31 Hz for male children, 275 ± 31 Hz for female children, 145 ± 36 Hz for adult males, and 251 ± 31 Hz for adult females. Smith and Titze [9] reported that the glottal vibration frequency was 125 Hz for a typical adult male, while Stevens and Hanson [10] studied female singers and reported that the first-formant bandwidth for /e/ varied from 41 to 190 Hz, with 190 Hz corresponding to a minimum glottal aperture of 0.07 cm2. As high as 1568 Hz has been reported by Echternach et al. [11] using a high-speed trans-nasal endoscope. Even for the same person, glottal vibrations can differ significantly in magnitude and waveform [12]. Some of these differences are related primarily to differences in vocal fold anatomy, while others may arise from how the vocal folds are stressed. In addition, both complete and incomplete glottal closure was observed during the phonation [10].
Inspiratory nocturnal stridor due to glottal vibrations has been considered a major symptom of early-stage Multiple system atrophy (MSA), which is a neurodegenerative disorder that causes vocal fold abductor paralysis or paradoxical vocal cord motions. Kakitsuba [13] measured the stridor sounds in MSA patients and reported the fundamental frequencies to be 260–330 Hz. Note that the stenotic portion was the glottis in MSA patients with stridor but was the pharynx or soft palate in patients with snoring or apnea [14]. Shy–Drager syndrome is another progressive neurological disorder that is often accompanied by sleep apnea, laryngeal stridor, vocal cord paralysis, and dyspnea that requires tracheotomy [15,16,17]. The use of glottal vibration derivatives as diagnostic instruments in laryngeal diseases and voice disorders has been proposed, while a better understanding of the responses of these derivatives to glottal vibrations is needed for future clinical applications [18].
Sound generation at high glottal vibration frequencies is not yet well understood, which is complicated by turbulences, high-frequency flow instabilities, and vortex–structure interactions [11]. On the other hand, the glottic tissue responses could be highly frequency dependent, with high-frequency vibrations predisposed to tissue fatigue [19]. Sundberg [12] compared different modes of phonation vs. glottal vibration and concluded that sound generation was more associated with glottal closing (adduction) than opening (abduction). This view was also supported by in vivo larynx models by Regner et al. [20], who observed that acoustic perturbation increased with the degree of glottal adduction and that a hyper-adducted state generated the best perceptual quality of sound. However, investigations of glottal vibrations and their impact on flow and sound generation have been difficult both due to technical limitations and the complex mechanisms underlying this highly transient phenomenon.
Glottal vibrations are driven by a time-varying pressure on the vocal folds. How the vibrations keep self-sustained is not clear yet. The intra-glottal pressure variation within one vibration cycle has been found to be highly dependent on both spatial and temporal flow behaviors, especially the coherent vortex structures [21]. The vortices interact with the oscillating vocal folds and transfer energy from the respiratory airflow that sustains the energy expenditures by the inertance, resistance, and compliance of the air–structure system [7,9,22]. Previous studies have shown that increasing airflow could significantly increase the glottal vibratory amplitudes [21]. Anatomical factors such as the length and thickness of the vocal folds, as well as their physical properties such as viscoelasticity, were also shown to regulate the glottis dynamics to varying degrees [23,24,25]. Conversely, the viscoelastic response of the laryngeal and vocal fold tissues was highly frequency dependent, as demonstrated by Chan [19], who tested twelve ex vivo vocal fold mucosal specimens under sinusoidal shear strains in the range of 100–230 Hz. However, the transient energy transfer within one cycle, and whether it promotes or resists the glottis vibration (i.e., for or against self-sustainability), especially at varying vibration frequencies, are far from clear.
The objective of this study is to evaluate the influences of the glottal vibration frequency on inspiratory airflow dynamics and flow-induced sound signals. Specific aims include: (1) develop a computational respiration model with an expanding/contracting glottis; (2) characterize the airflow dynamics with different glottal vibration frequencies; (3) quantify the forces acting on the glottal wall and normalize the forces relative to the glottal vibration frequency; (4) quantify the instantaneous pressure signals under varying glottal vibration frequencies; and (5) analyze the sound pressure signals using different transform algorithms (wavelet, Hilbert, Fourier, etc.).

2. Materials and Methods

2.1. Study Design

To simulate the flow and acoustics to glottal vibrations during inhalation, an image-based mouth–throat–lung (MTL) model with time-varying glottal apertures was developed. Note that this study is different from the normal phonation that is driven by controlled exhalation [26,27,28]. The model geometry was developed in [29] and consisted of three components: a mouth model, a pharyngolaryngeal model, and a tracheobronchial (TB) model extending to the sixth generation (G6) (Figure 1a). A user-defined function (UDF) was implemented in ANSYS Fluent to control the glottis motion following a prescribed waveform, with more details presented in Section 2.2. Large-eddy simulation (LES) was used to capture the instantaneous flow and pressure evolution, as described in Section 2.3. To validate the computational model, pressure values in 3D-printed MTL casts were measured using TSI 9565 VelociCalc ventilation meter (TSI, Shoreview, MN, USA) and compared to complementary model predictions with three static glottal apertures (Figure 1b). The validated model was then used to simulate airflows, forces, and acoustics under six glottal vibration frequencies (10–500 Hz). Considering that one breathing cycle, which is typically 5 s, is much longer than the glottal vibration period, a constant inhalation flow rate of 15 L/min was considered in this study. To assess the influences from the glottal vibration frequency f0, a wide range of f0 was considered, including 10, 20, 50, 100, 200, and 500 Hz. The transient flows induced by the vibrating glottis were characterized in terms of velocity, stream traces, and vortex structures. The pressure forces acting on the glottal wall were examined on their roles in either promoting or suppressing the glottal vibration. To understand the glottal vibration frequency on flow-induced acoustics, the instantaneous pressure values at 0.3 m from the mouth opening were analyzed using different transform algorithms, as presented in Section 2.4.

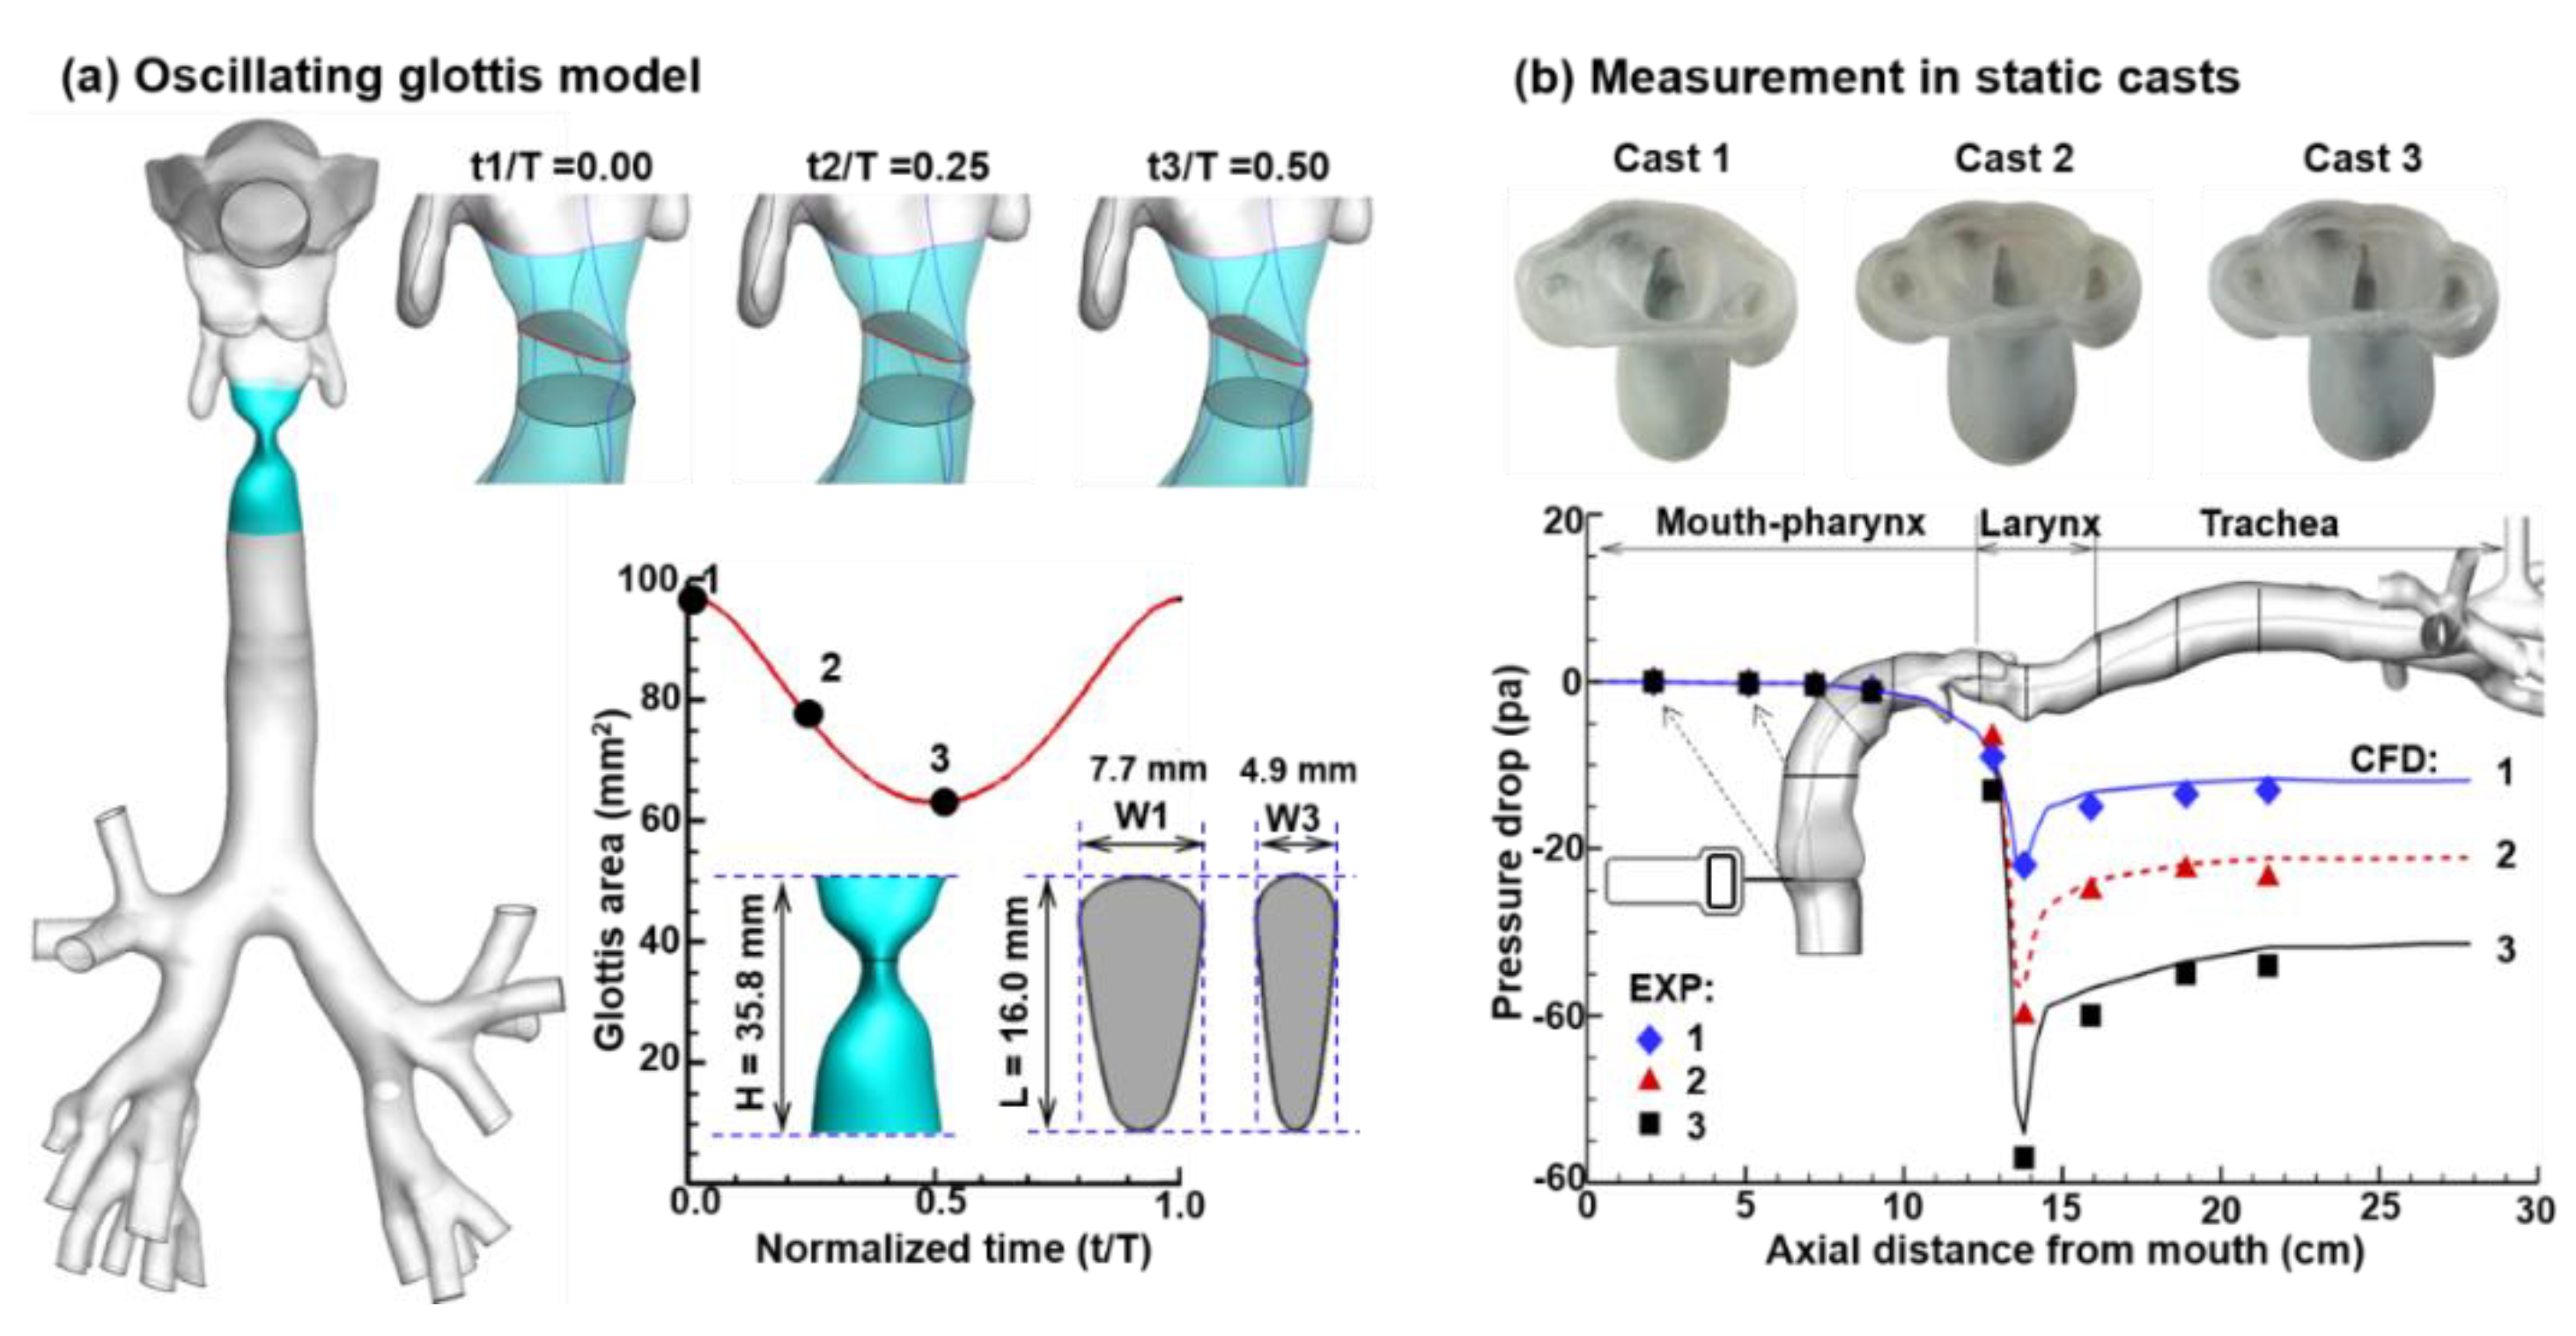
2.2. Dynamic Glottal Model

The glottal vibration kinematics followed the measurements in Scheinherr et al. [30,31]. The glottal aperture had a triangular shape. Its midline length was the average of a group of patients [30] and remained constant during the vibration. The width was prescribed to contract and then expand, with a symmetric motion on the two lateral walls following a sinusoidal waveform. The aperture variation ratio was 1.6 in this study, with the maximal area being 153.7 mm2 and the minimal area being 96.5 mm2 (Figure 1a). This ratio fell within the range of 1.16–1.8 in normal adults [32,33,34]. To make sure that the dynamic glottal aperture transited smoothly to the static airway walls both upstream and downstream, sinusoidal functions were implemented to connect with the larynx 4 mm above and 6 mm below the glottis (Figure 1a), which conformed with the glottis model described in Wu and Zhang [35].

2.3. Numerical Methods

The inhaled air was assumed compressible and had a constant flow rate of 15 L/min. To account for the upstream effects, the inlet velocity at the mouth opening had a blunt profile:
u ( r ) = 1.224 u m ( R r R ) 1 / 7
where um is the average velocity (i.e., 0.66 m/s), r is the radius from the mouth opening center, and R is the mouth opening radius (i.e., 11 mm). The outflow distributions for the twenty-three bronchiolar outlets followed the measurement by Cohen et al. [36]. Note that the lung model in this study was reconstructed from a cadaver-based lung cast used in [36]. The respiratory flows were solved using large eddy simulations (LES), which have been demonstrated to accurately capture flow evolutions and turbulent-laminar transitions [37,38]. The subgrid-scale variables were resolved using the wall-adapting local eddy-viscosity (WALE) model [37].
The flow-induced acoustics were simulated using the Ffowcs Williams and Hawkings (FW-H) model [39]:
1 a 0 2 2 p t 2 2 p = t [ ρ 0 v n δ ( f ) ] x i [ P i j n i δ ( f ) ] + 2 x i x j [ T i j H ( f ) ]
where f = 0 represented the airway wall, f > 0 represented the environment, and Tij was the Lighthill stress tensor. The variables ni, δ(f), and H(f) were the normal vector of the wall, Dirac delta function, and Heaviside function, respectively. The three groups on the right-hand side represented the monopole, dipole, and quadrupole sources, respectively. Fast Fourier transformation (FFT) was applied to transform the time series pressure signals into the frequency domain. The sound pressure level (SPL, unit: dB) was calculated as SPL = 20 log(p/pref), with the reference pressure pref = 2 × 10⁻⁵ Pa [40]. The A-weighted sound pressure level (unit: dBA) was calculated using an A-scale function to better mimic the perception of human ears, which are more sensitive to signals between 500 and 6000 Hz [41]. The power spectral density (PSD, unit: Pa2) denotes the signal power distribution in the frequency domain and is defined as the Fourier transform of the autocorrelation function [42].
ANSYS ICEM CFD (19, Ansys, Inc, Canonsburg, PA, USA) was used to generate the computational mesh, and ANSYS Fluent was used to solve the flow and aeroacoustics governing equations. A grid-independent study was conducted by testing different mesh sizes ranging from 1.5 million to 8.5 million. All meshes had a cell height of 0.05 mm near the wall [43]. Grid-independent results were obtained at 6.5 million, which was subsequently used for all simulations with varying glottal vibration frequencies. The fine mesh size in the flow domain, as well as the extra fine prismatic mesh in the near-wall region, has been shown to be critical in adequately capturing flow details, especially the generation and evolution of small vortices [44,45]. The time step size was 1.0 × 10⁻⁶ s for all test cases and the pressure was recorded every 1.0 × 10⁻⁶ s at 0.3 m from the mouth opening [46]. A UDF-controlled dynamic mesh model was implemented in the glottal region, with the glottis shape and computational mesh updated at each time step. For each case, 20 vibration cycles were simulated. The SPL and PSD were computed from the recorded time series of pressure signals as a post-processing procedure in ANSYS Fluent using the fast Fourier transform module.

2.4. Hilbert and Wavelet Transform Analyses

Hilbert transform was used to visualize the signals’ transient behaviors and was expressed as [47]:
g ( x ) = H [ f ( t ) ] = 1 π f ( t ) t x d t
The transform returned a complex number, with the real component being the oscillation magnitudes and the imaginary component being the phase angle. The resultant phase space plot could differentiate the periodic or quasi-periodic signals from chaotic responses [48]. CWT analyses were used to decompose the instantaneous pressure coefficients CP into varying scales to seek correlations, which are not that obvious in the original CP profiles. A series of wavelets were implemented to scale and shift the signal f(t):
w t ( a , b ) = 1 a f ( t ) ψ ( t b a ) d t , a > 0
with ψ ( t ) being the Morlet wavelet, a the scaling factor, and b the time shifting or lag [49]. By varying a and b, local irregularities could be extracted [49]. A larger a represented an expanded wavelet and corresponded to a low frequency, which captured slow variations. Conversely, a smaller a corresponded to a compressed wavelet and a high frequency, which captured fast and abrupt variations. Shifting by a time lag b advanced or delayed the wavelet’s onset along the signal’s length. The time–frequency energy map (scalogram) and wavelet semblance were obtained using continuous wavelet transform. The multifractal spectrum of signals was obtained using discrete wavelet transform [49]. For both analyses, the mother wavelet was the Morlet wavelet. MATLAB was used to perform the Hilbert transform and continuous wavelet transform in this study.

3. Results

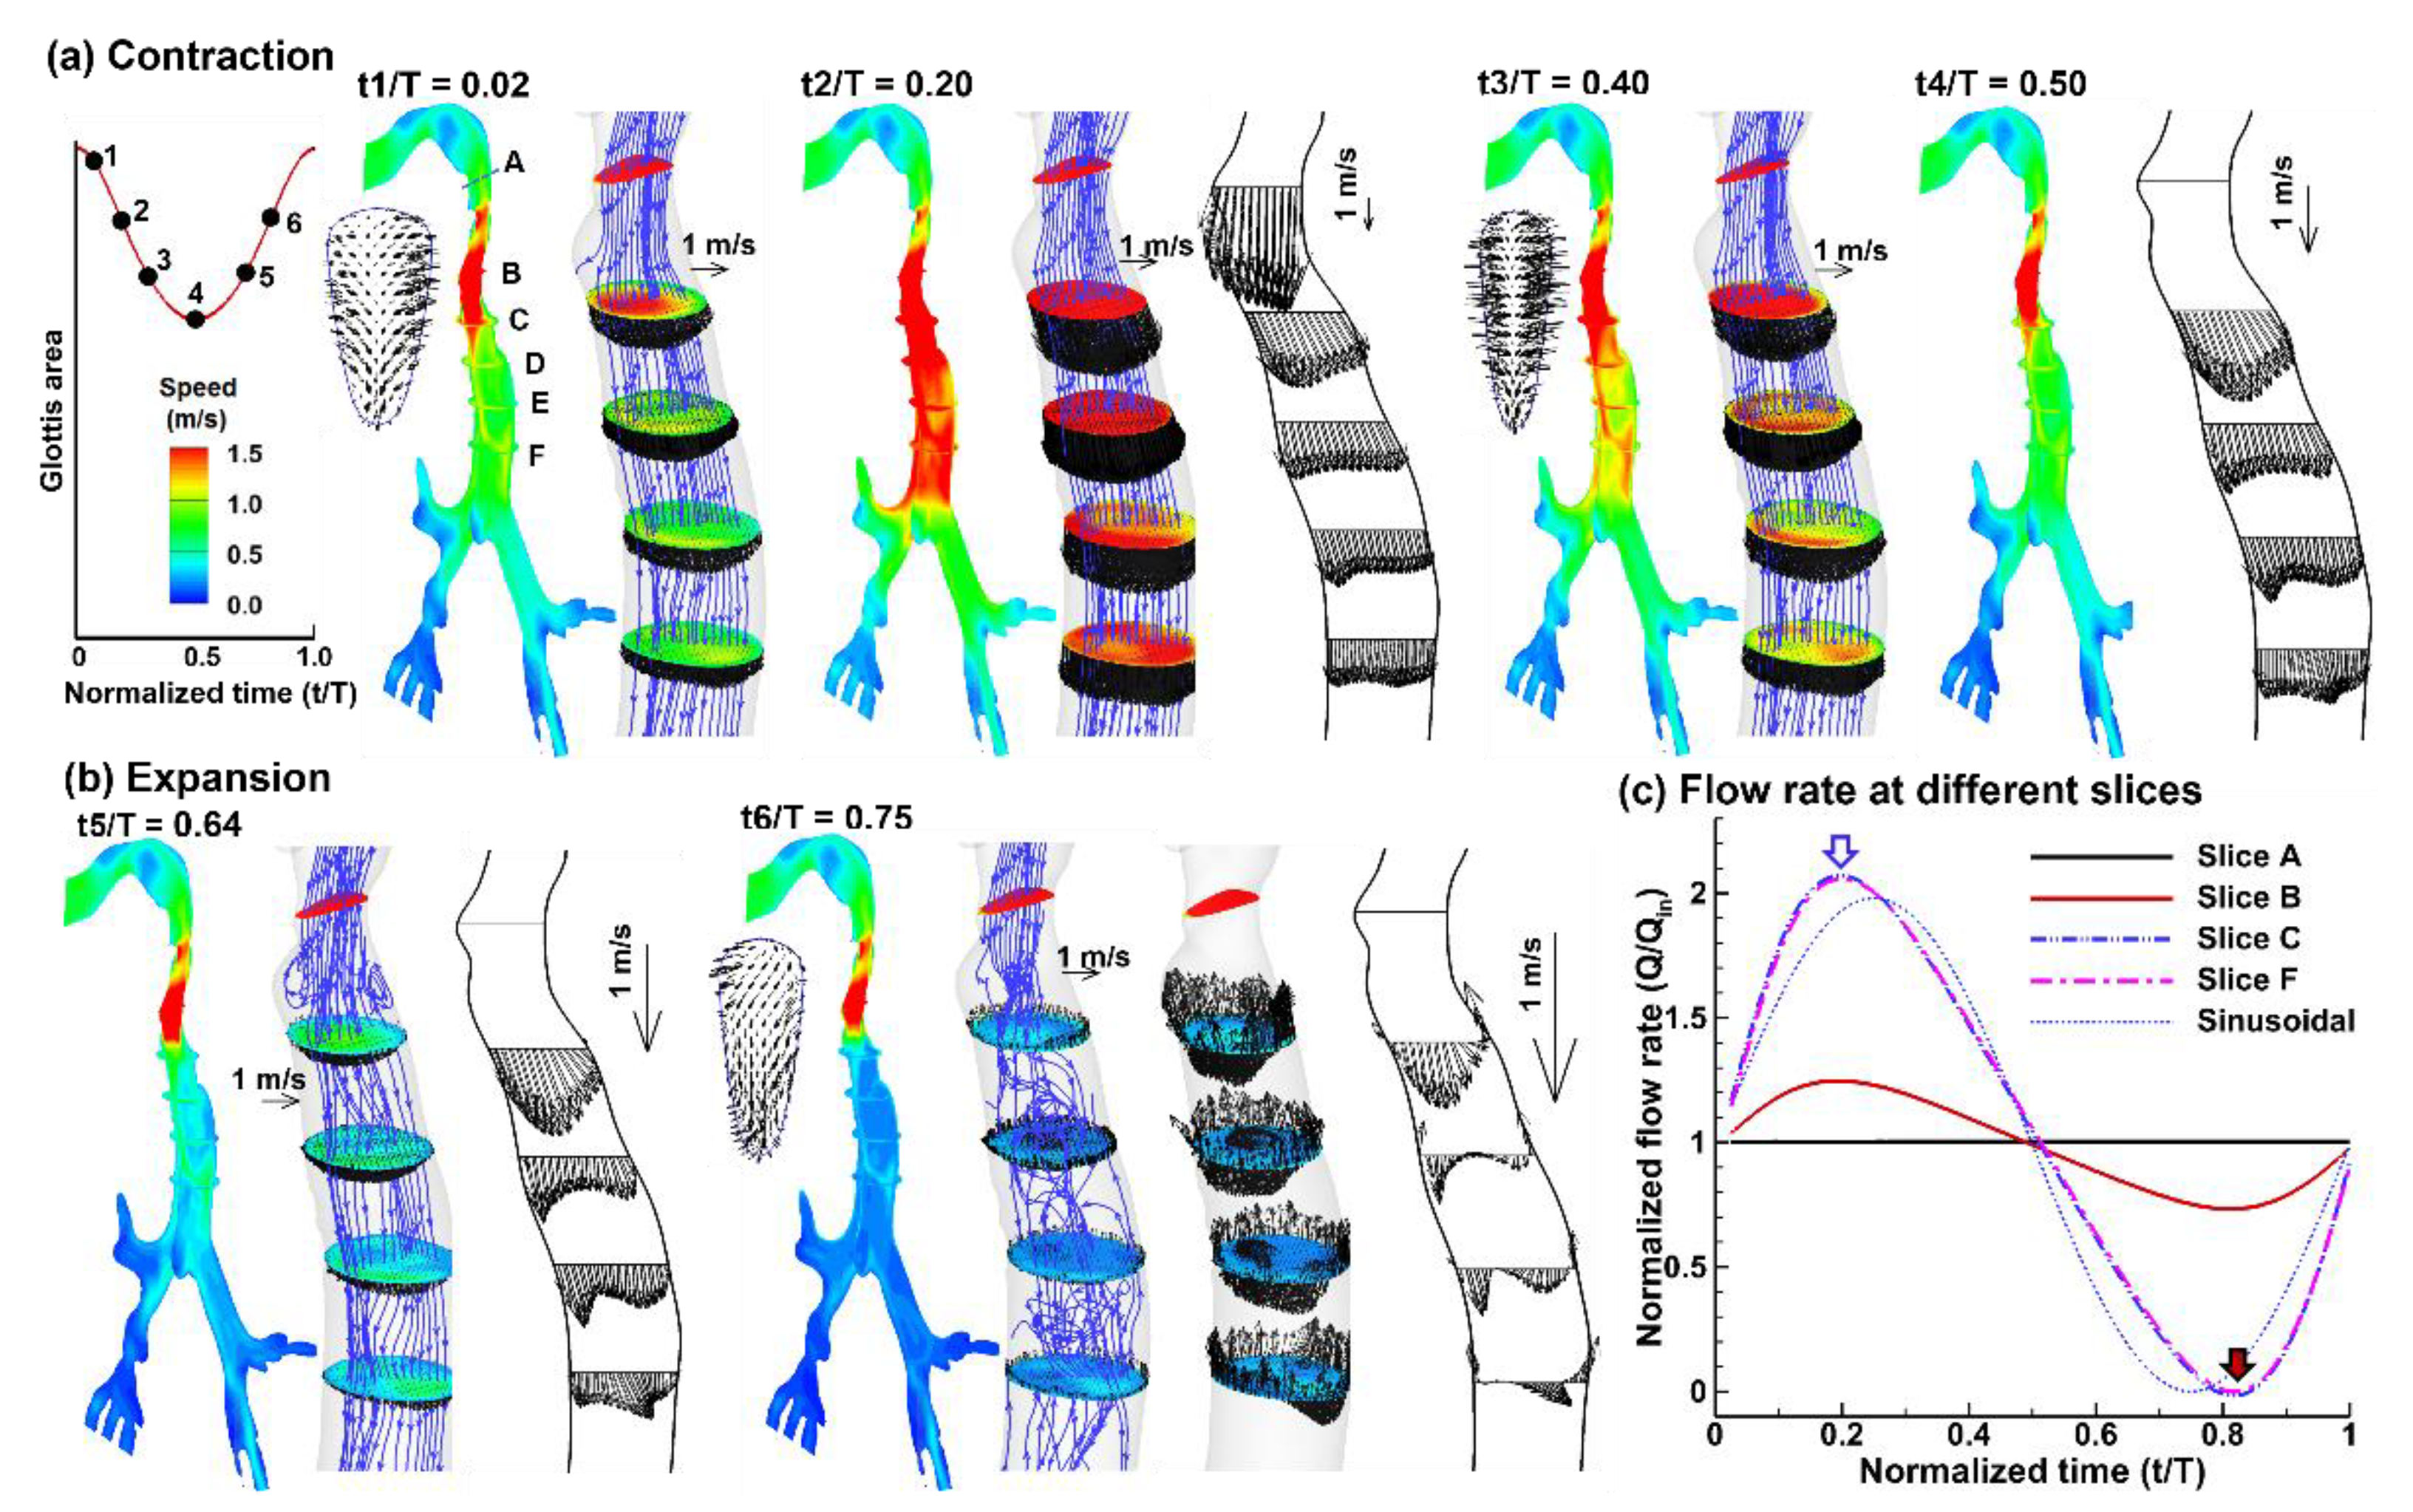
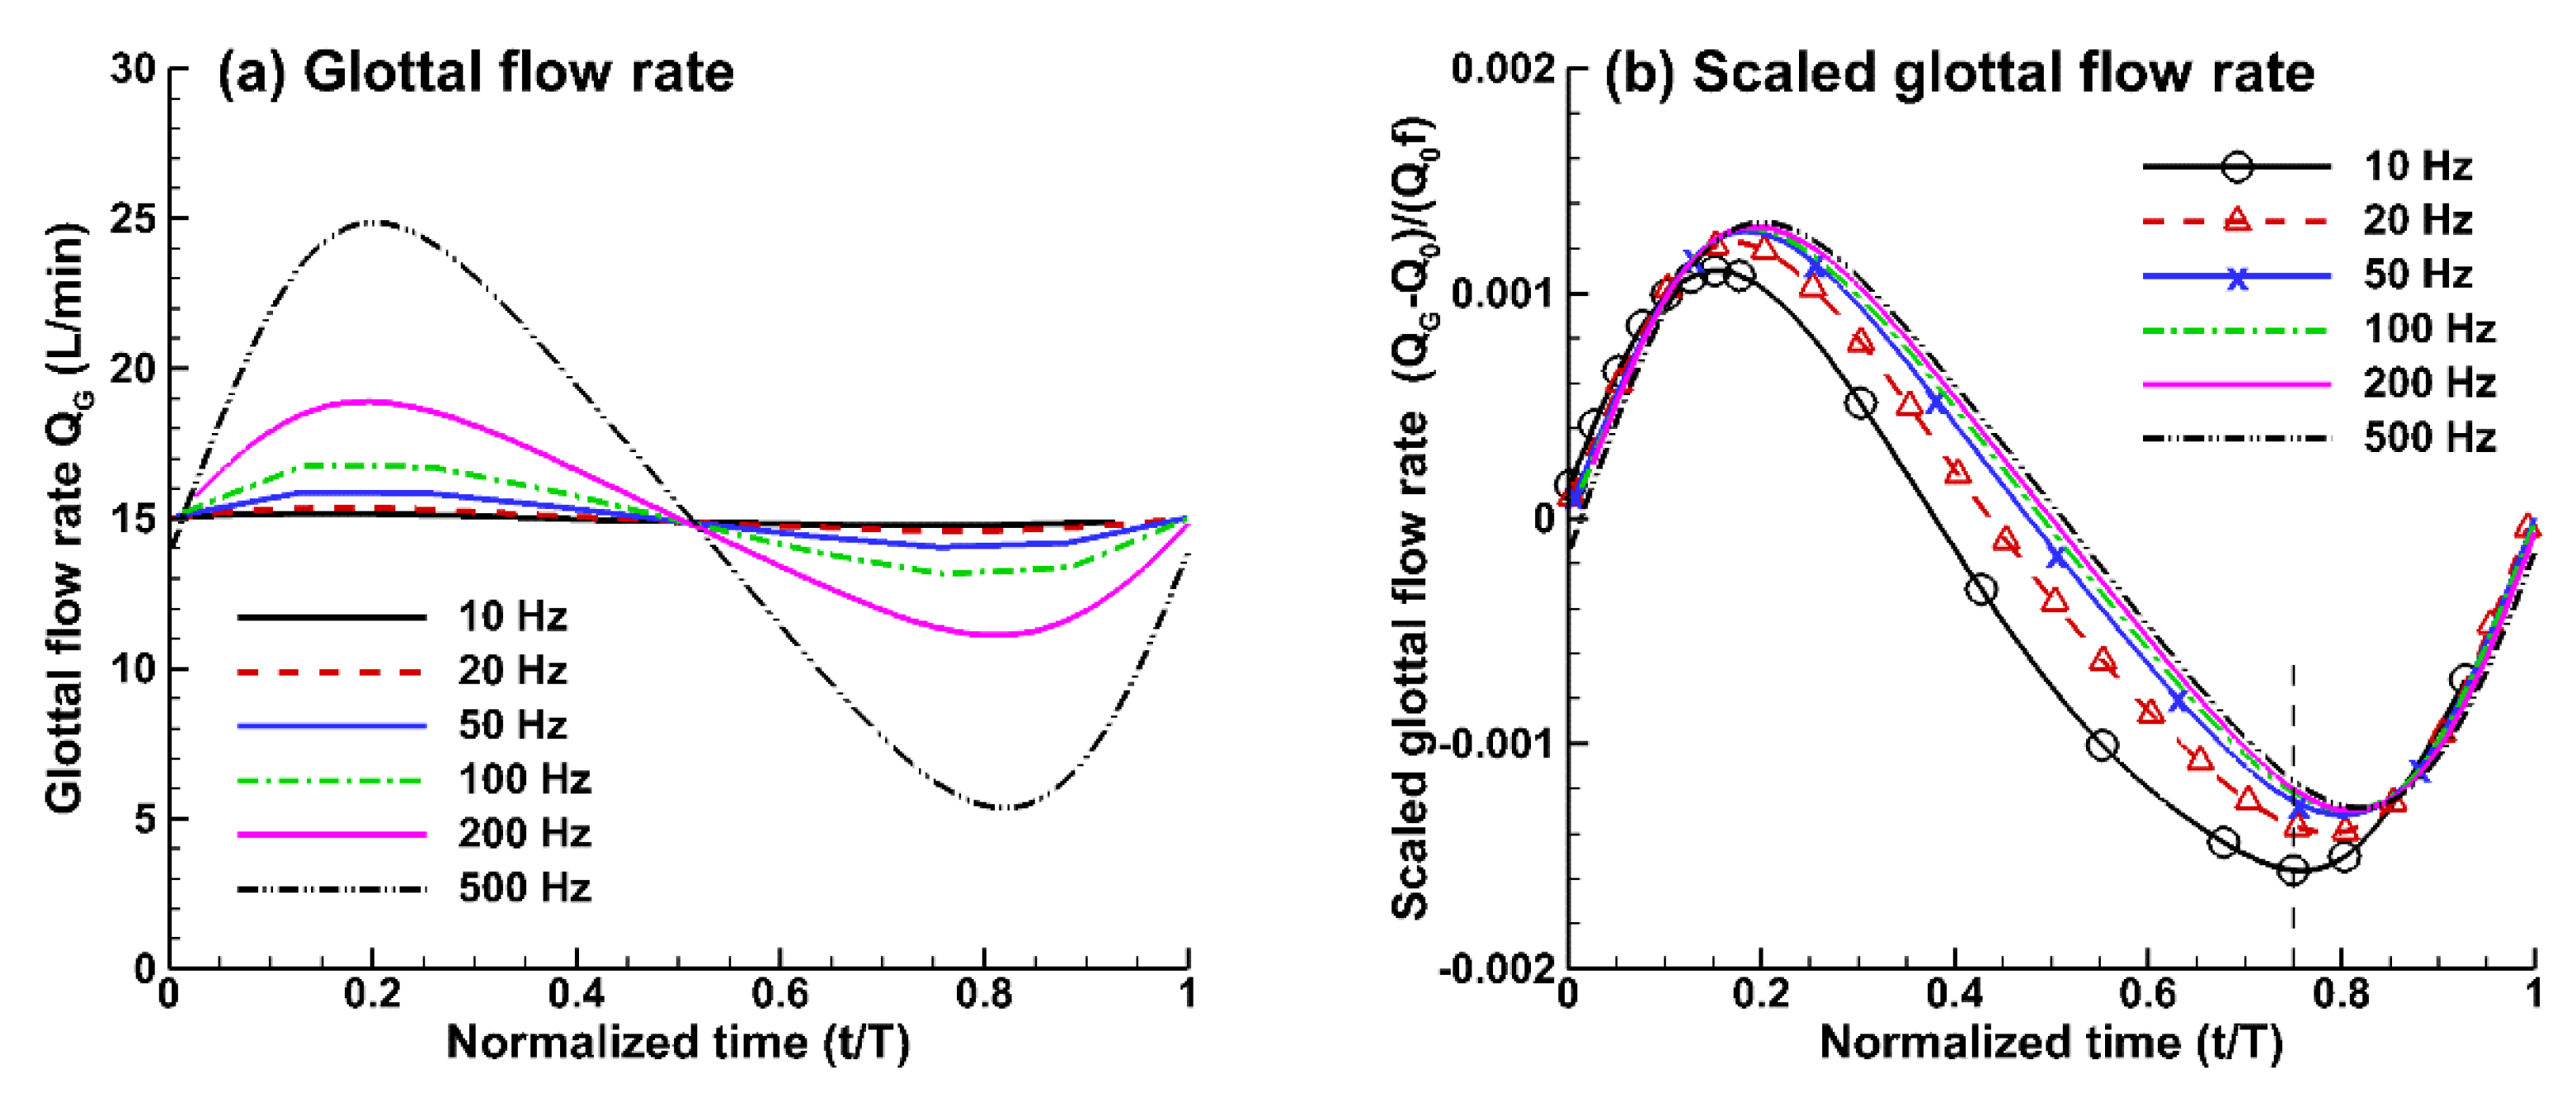
3.1. Airflow Dynamics

Figure 2 shows the respiratory airflow dynamics at the minimum glottal aperture at different vibration frequencies. Flow topologies are visualized in terms of mid-plane velocity contour and Q-criterion-based coherent structures from different views (i.e., front, lateral, and mid-plane). The color bar is provided in Figure 2a. Major differences in flow were noted in the pharynx. The pharyngeal jet persisted longer at low glottal vibration frequencies (10, 20 Hz) than at high frequencies (50, 200 Hz). At low frequencies (10, 20 Hz), there was a curled-up vortex tail in the trachea, whereas this vortex tail was absent at 50 Hz and above. In particular, the laryngeal jet flow appeared more like a plug flow at 200 Hz.
More significant differences existed in the vortex structures among different glottal vibration frequencies. At low frequencies (10 Hz and 20 Hz, Figure 2a,b), the vortices were more regular and smoother, manifested as vortex filaments and rings, and concentrated in the main flows. With increasing glottal vibration frequencies, the coherent vortex structures broke down into irregular vortex patches of progressively smaller scales (Figure 2c,d). Furthermore, these vortex patches were more concentrated in the near-wall region, which was presumably associated with higher boundary flow instabilities.
Figure 3 shows the evolution of the inspiratory flow during a glottal vibration cycle at 200 Hz, with the color bar in Figure 3a. During the contraction phase (t/T = 0–0.5, Figure 3a), the flow in the larynx accelerated. Despite a small volume variation, the speed increase can be nontrivial at high vibration frequencies. As a result, the axial (main flow) velocity magnitudes were larger at t/T = 0.20 than at 0.10 (i.e., the first two panels in Figure 3a). The velocity distributions were approximately similar during the acceleration phase, as demonstrated by the 2D vector plots between t/T = 0.20 and 0.50 (Figure 3a).
By contrast, the flow distributions differed significantly during the expansion phase (i.e., deceleration) (Figure 3b). In comparison to smooth streamlines during the acceleration phase, stream traces during the deceleration phase gradually became irregular. Recirculating flows formed immediately downstream of the glottis at the early stage of expansion (i.e., t/T = 0.64, Figure 3b). The flow pattern became more irregular with increasing glottal aperture. This was expected because of the counteractions between the flow inertia built during the contraction phase and the flow reversal during the expansion. As the flow reversal occurred primarily in the main flow rather than near the wall, the 2D vector plots at t/T = 0.75 showed low-speed flows in the trachea center vs. high-speed flows near the trachea wall.
Figure 3c shows the temporal variation of the normalized flow rates at different slices in the pharyngolaryngeal region. As expected, the frequency-associated transient effects were more significant near the glottis (i.e., source of perturbation) and decreased in magnitude at locations further away from the glottis. An unexpected observation was the phase shift in the peak flows, which occurred earlier than the sinusoidal peak during contraction (hollow blue arrow) but later than the sinusoidal peak during the expansion (solid red arrow).
The comparison of the glottal flow rates among different vibration frequencies is shown in Figure 4a. The phase shift between the glottal flow and vibration was noted for all vibration frequencies considered (10–500 Hz). Moreover, the glottal flow fluctuation increased with the vibration frequency. To better compare the flow response to glottis vibrations, data in Figure 4a have been replotted in Figure 4b by normalizing the glottal flow rate Qg using the inhalation flow rate Qinh (15 L/min) and vibration frequency f0: [(QgQinh)/(Qinh f0)]. The normalized (scaled) flows were asymmetric relative to the baseline, which skewed toward the main flow direction and most likely resulted from the flow inertia. In addition, the glottal flow fluctuations (QgQinh) were approximately linear with the glottal vibration frequency.

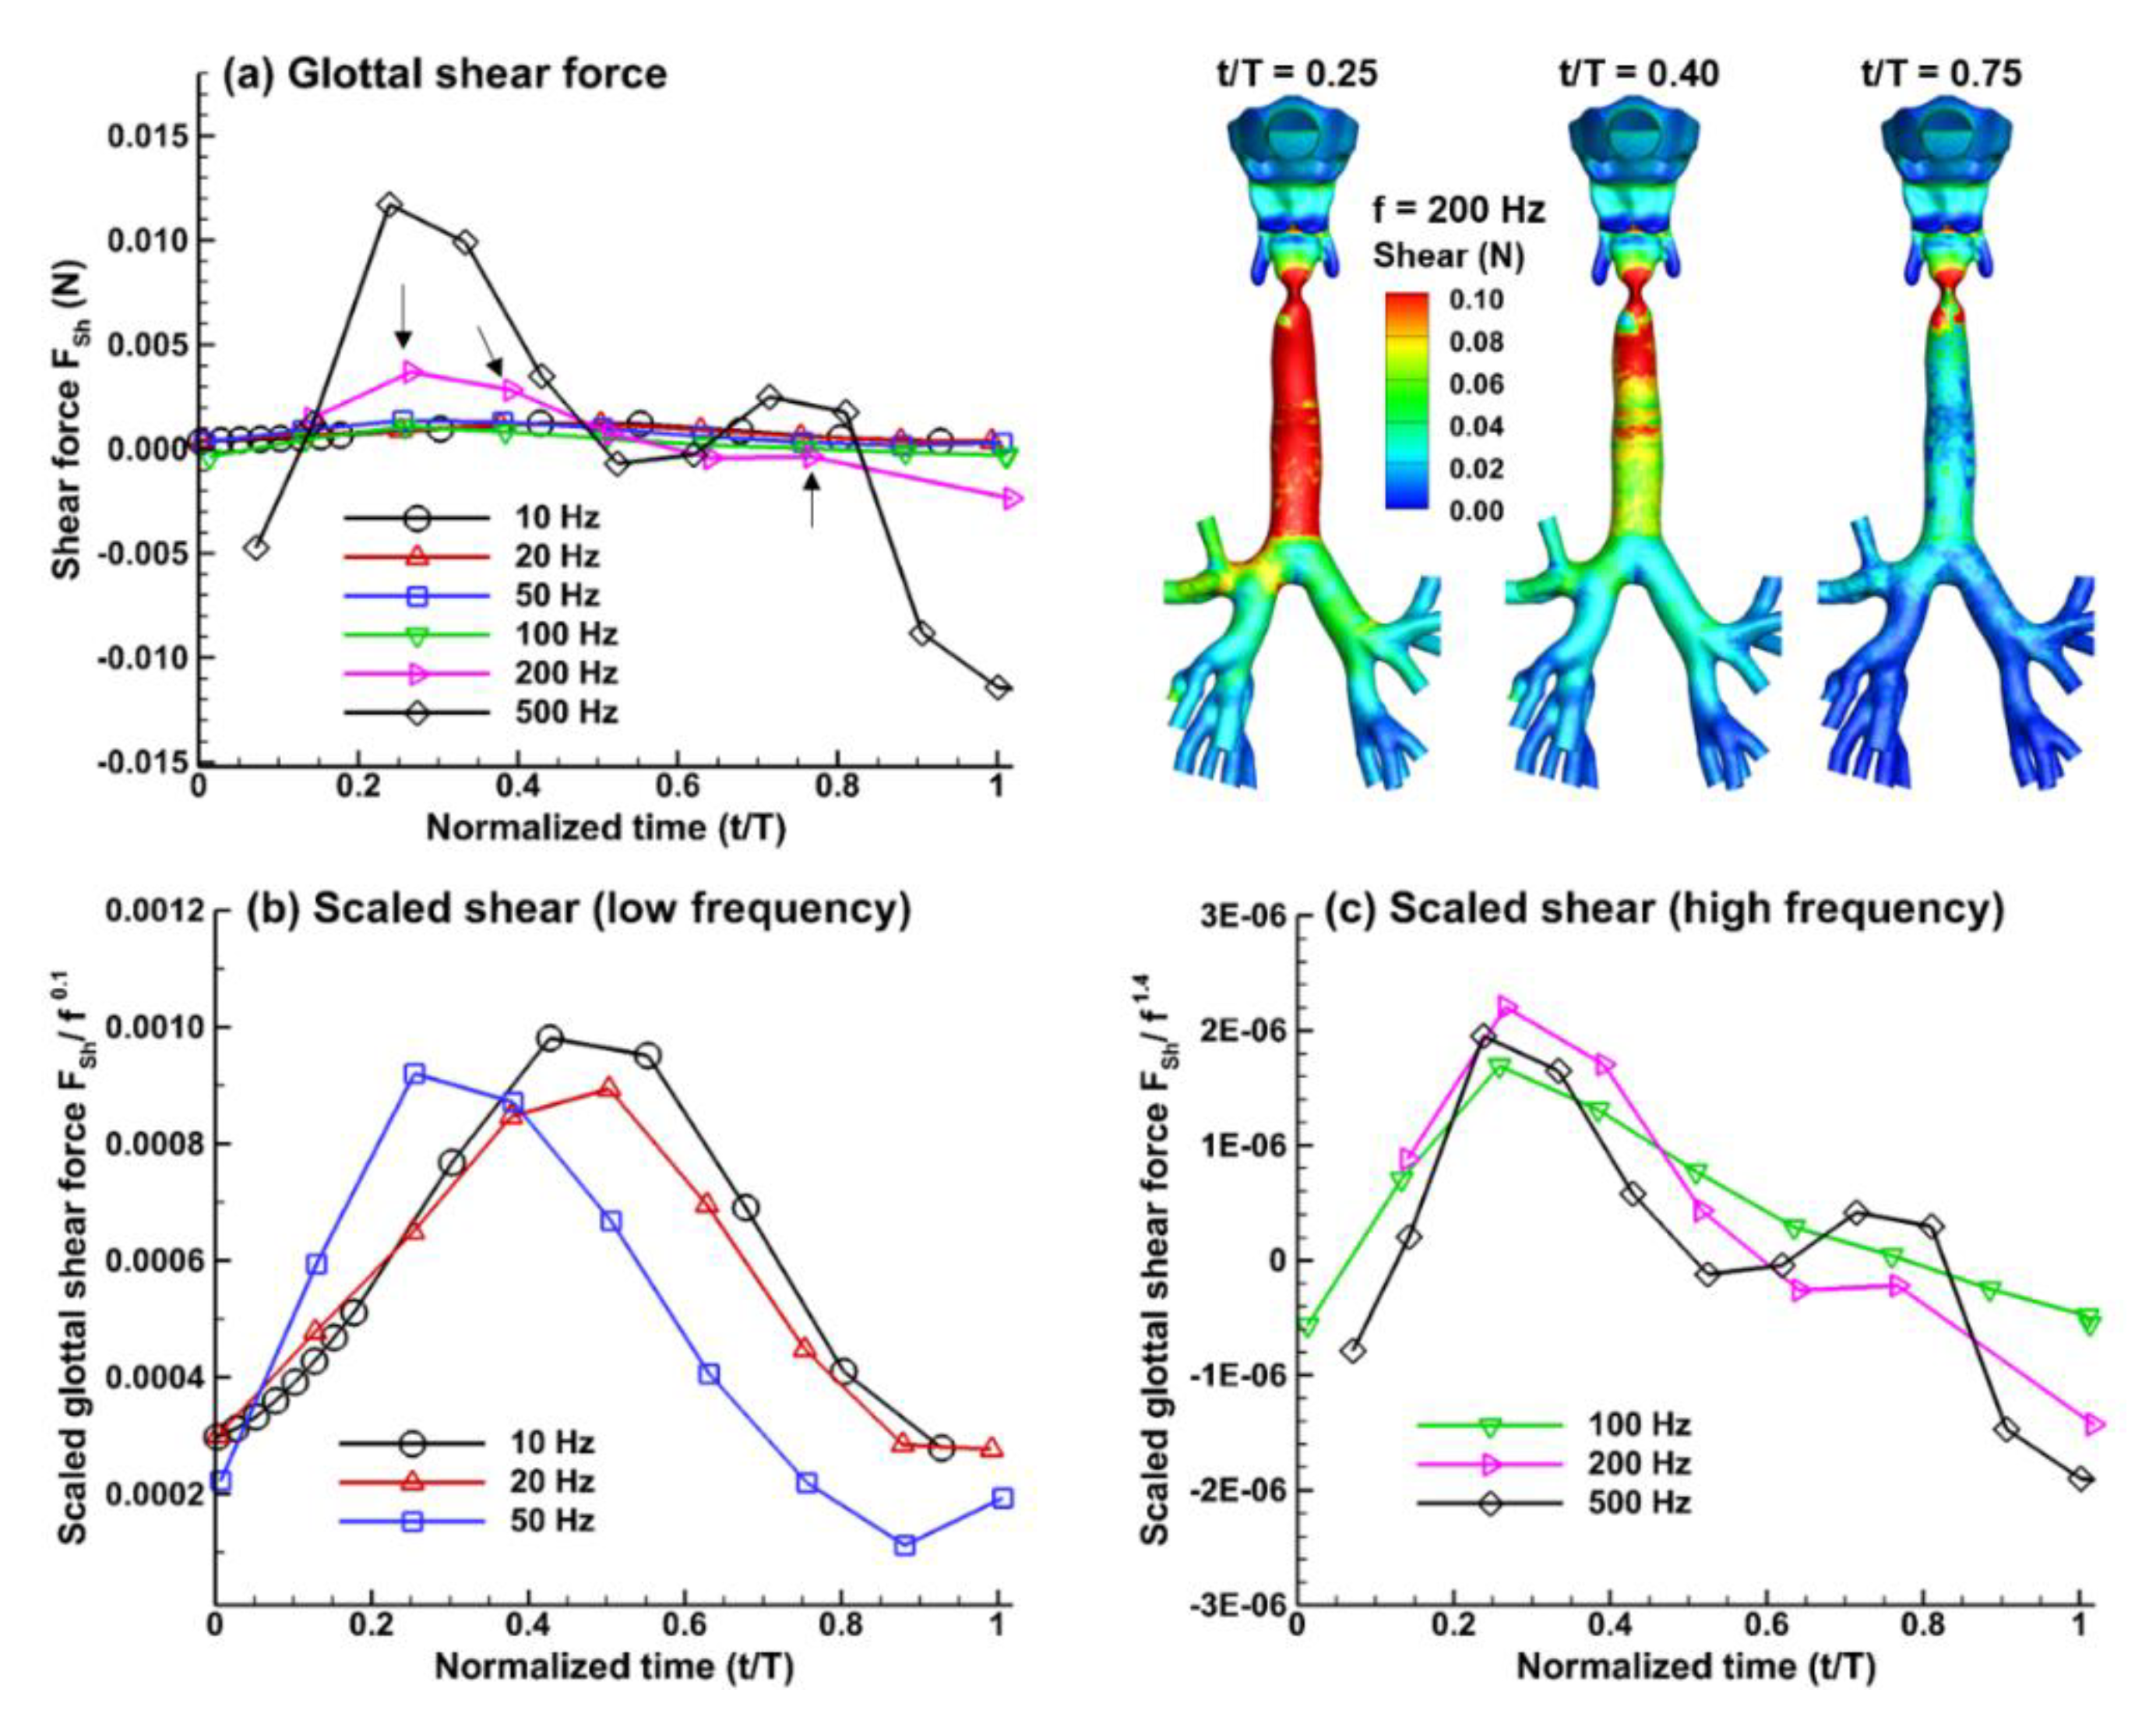
3.2. Forces on the Glottal Walls

To understand the dynamics of the flow-induced glottis vibration at varying frequencies, the lateral forces acting on the glottal walls were integrated from the pressure on the right and left lateral walls (Figure 5a–c). As shown in Figure 5b, the pressure force in the first and third quartiles of a vibration cycle facilitated the glottal vibration (self-sustaining), as the pressure force and the glottal motion were in the same direction. By contrast, the pressure force in the second and third quartiles was in the opposite direction of the glottal motion and thereby worked against the vibration (anti-self-sustaining). Furthermore, the pressure force exhibited a nonlinear relationship with the vibration frequency, which had significantly larger magnitudes at higher frequencies (e.g., 500 Hz vs. 200 Hz). Figure 5c shows the normalized lateral pressure forces by a frequency-associated coefficient f01.85, which successfully collapsed the scatters of all frequencies (Figure 5c). The exponent of 1.85 could be attributed to the dominant flow inertia effect (i.e., V2) vs. less dominant viscous effects.
The shear force τ acting on the glottal walls during one vibration cycle is shown in the left panel of Figure 6a at vibration frequencies ranging from 10 to 500 Hz. The shear stress mapping at 200 Hz on the entire upper airway is shown in the right three panels of Figure 6a. The shear at t/T = 0.25 was higher than that at both t/T = 0.40 and 0.75, suggesting a close relationship between shear and transient effect (i.e., the glottis at t/T =0.25 contracting at the highest speed but yet to reach the narrowest aperture).
The regression of the shear forces vs. f is shown in Figure 6b,c for low and high frequencies, respectively. In contrast to the lateral force, the regression failed to collapse the shear forces of varying frequencies within a reasonable range. Moreover, the shear force τ did not obey one common relationship with the glottal vibration frequency, with a very weak τ dependence on f when f ≤ 50 Hz (f0 0.1) and a stronger dependence on f when f0 ≥ 100 Hz (f0 0.14). As discussed in Figure 2, this difference might result from the more complex vortex patterns in the near-wall region at high frequencies.

3.3. Sound Pressure and Acoustic Analyses

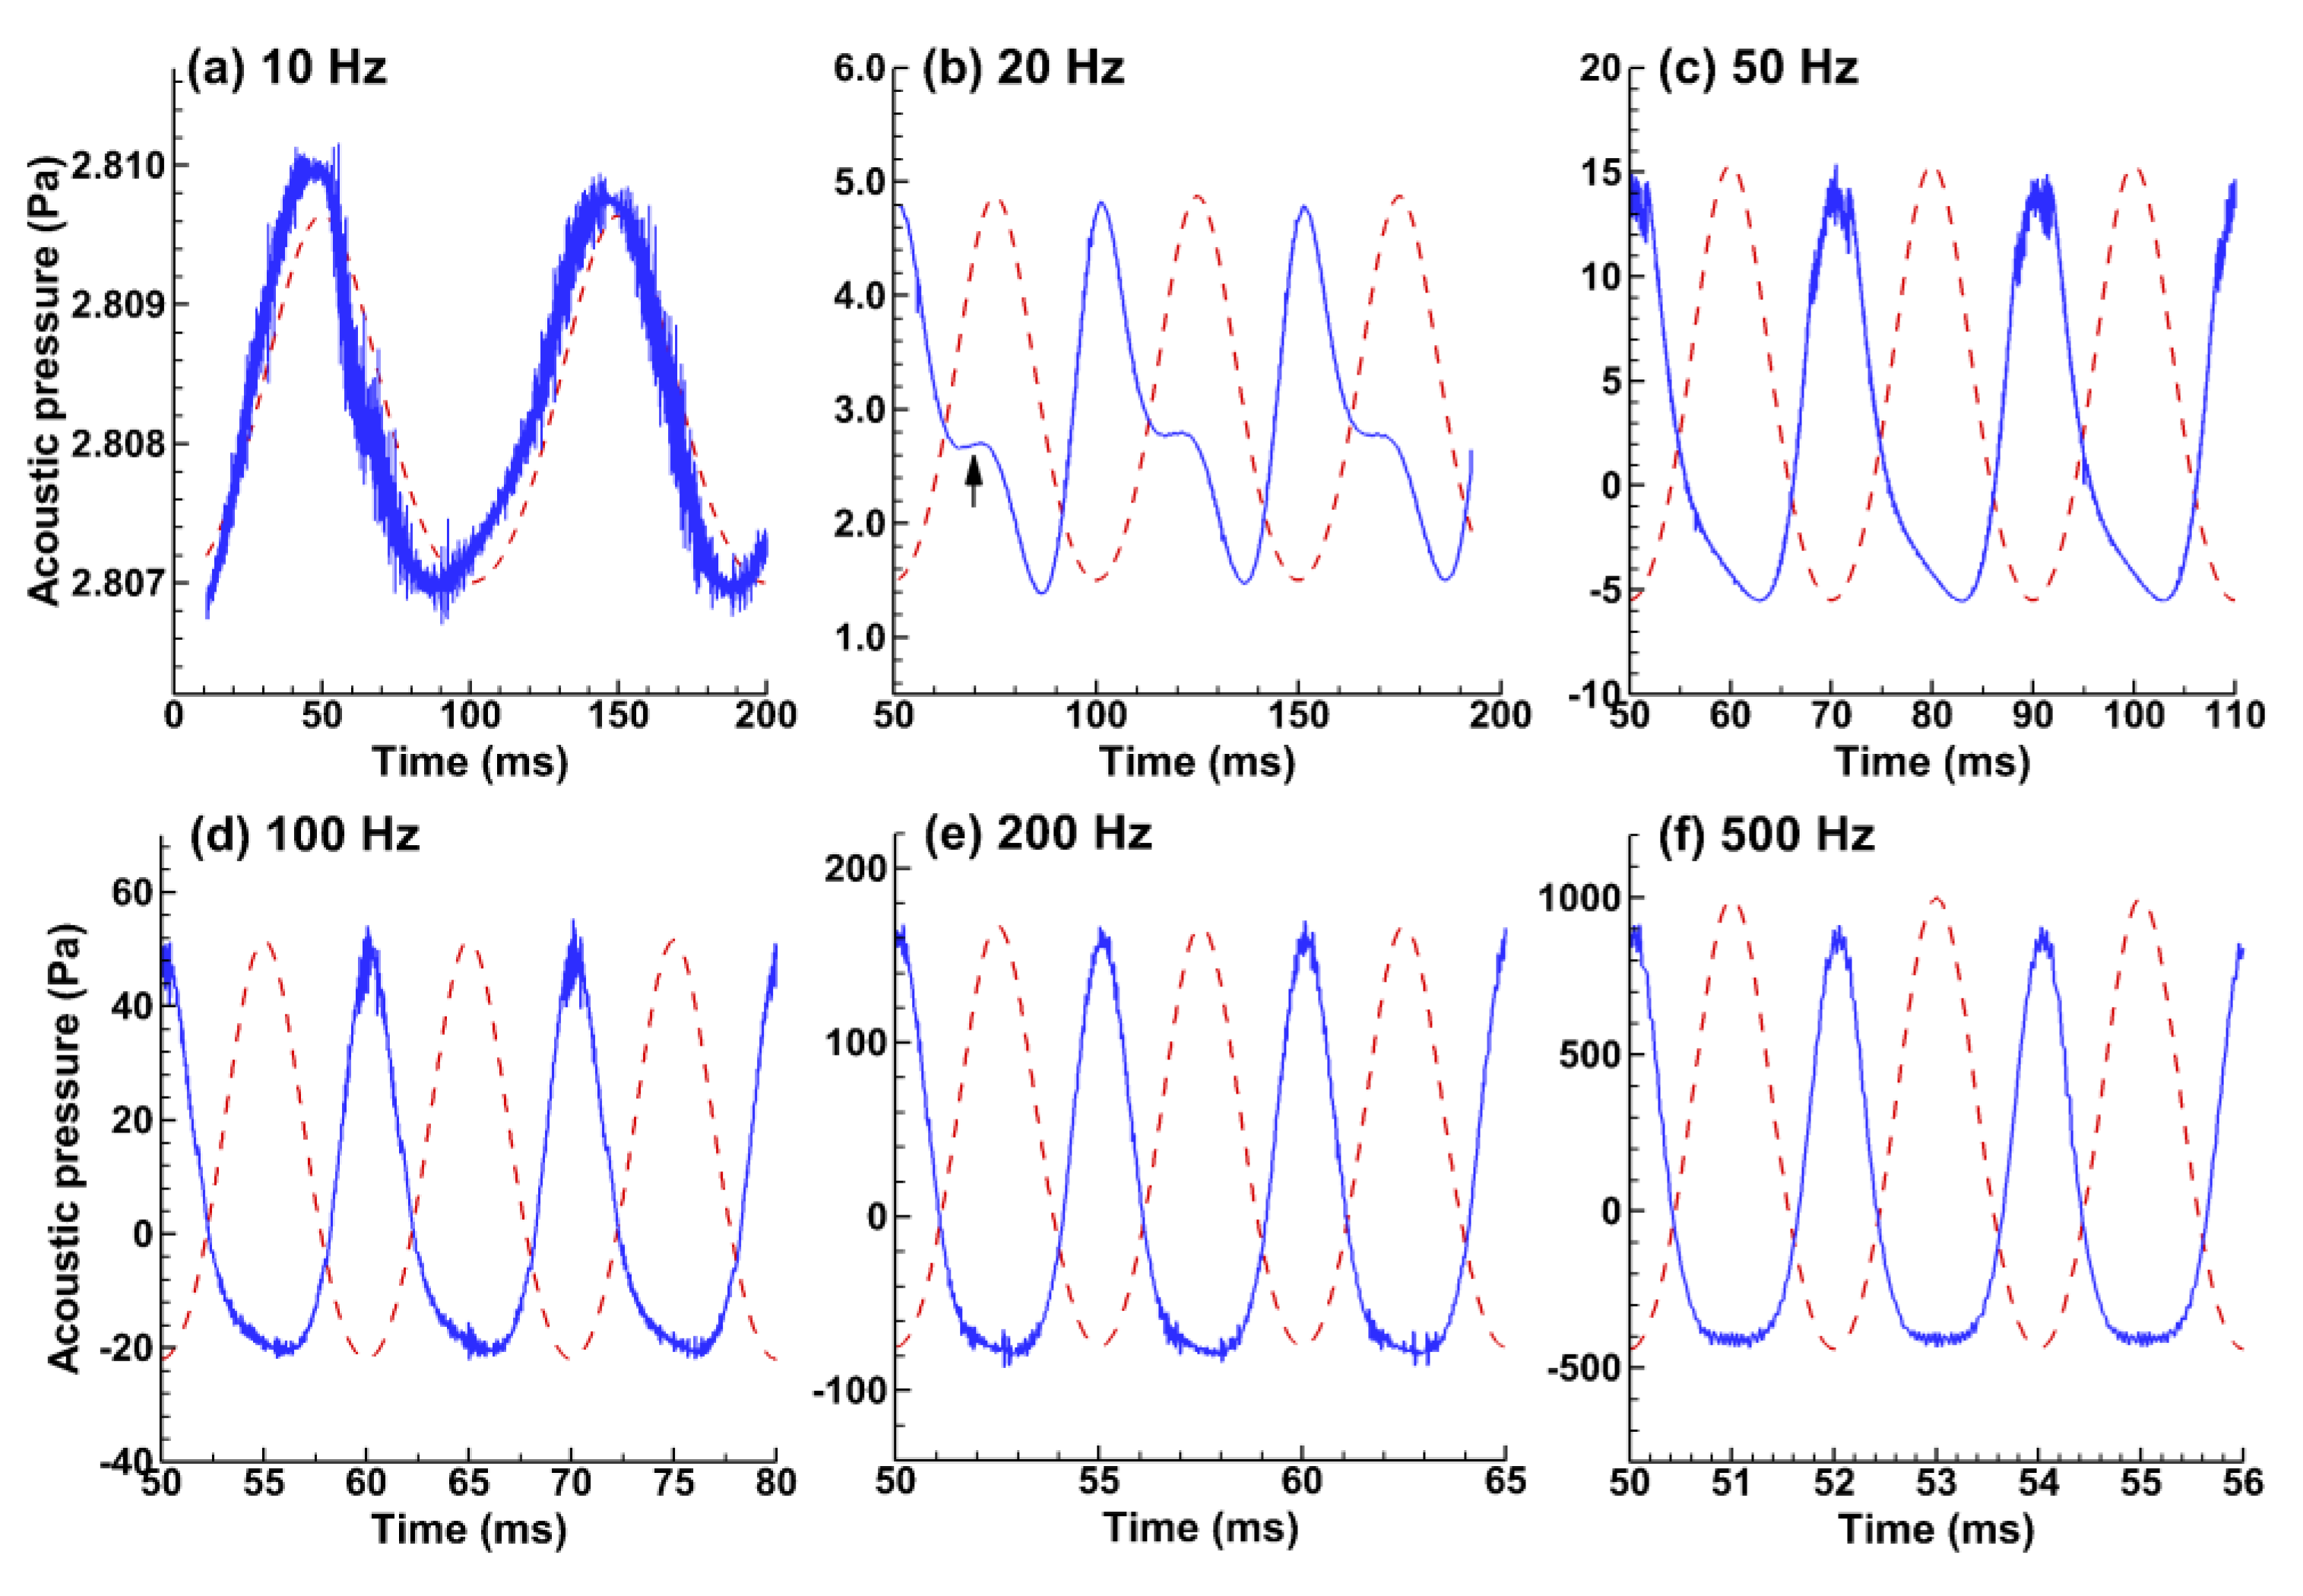
3.3.1. Pressure Signals at the Receiver (Mouth Opening)

The pressure signals at 0.3 m from the mouth opening computed using the FW-H model are shown in Figure 7a–f for varying glottal vibration frequencies (10–500 Hz). The sinusoidal waveform of the glottal vibration was also plotted as a reference line (red dashed). It was interesting to note that the pressure and wall motion are generally in phase at 10 Hz, while there was a half period lag for all other higher frequencies (20–500 Hz). In addition, similar patterns were observed among vibration frequencies > 50 Hz (Figure 7c–f). By contrast, the pressure variation at 20 Hz exhibited a plateau (black arrow) that was absent at other frequencies considered herein. It was also noted that the acoustic pressure magnitude increased drastically with the vibration frequency, as demonstrated by the y-coordinate maximal of 60 Pa at 100 Hz, 200 Pa at 200 Hz, and 1000 Pa at 500 Hz.

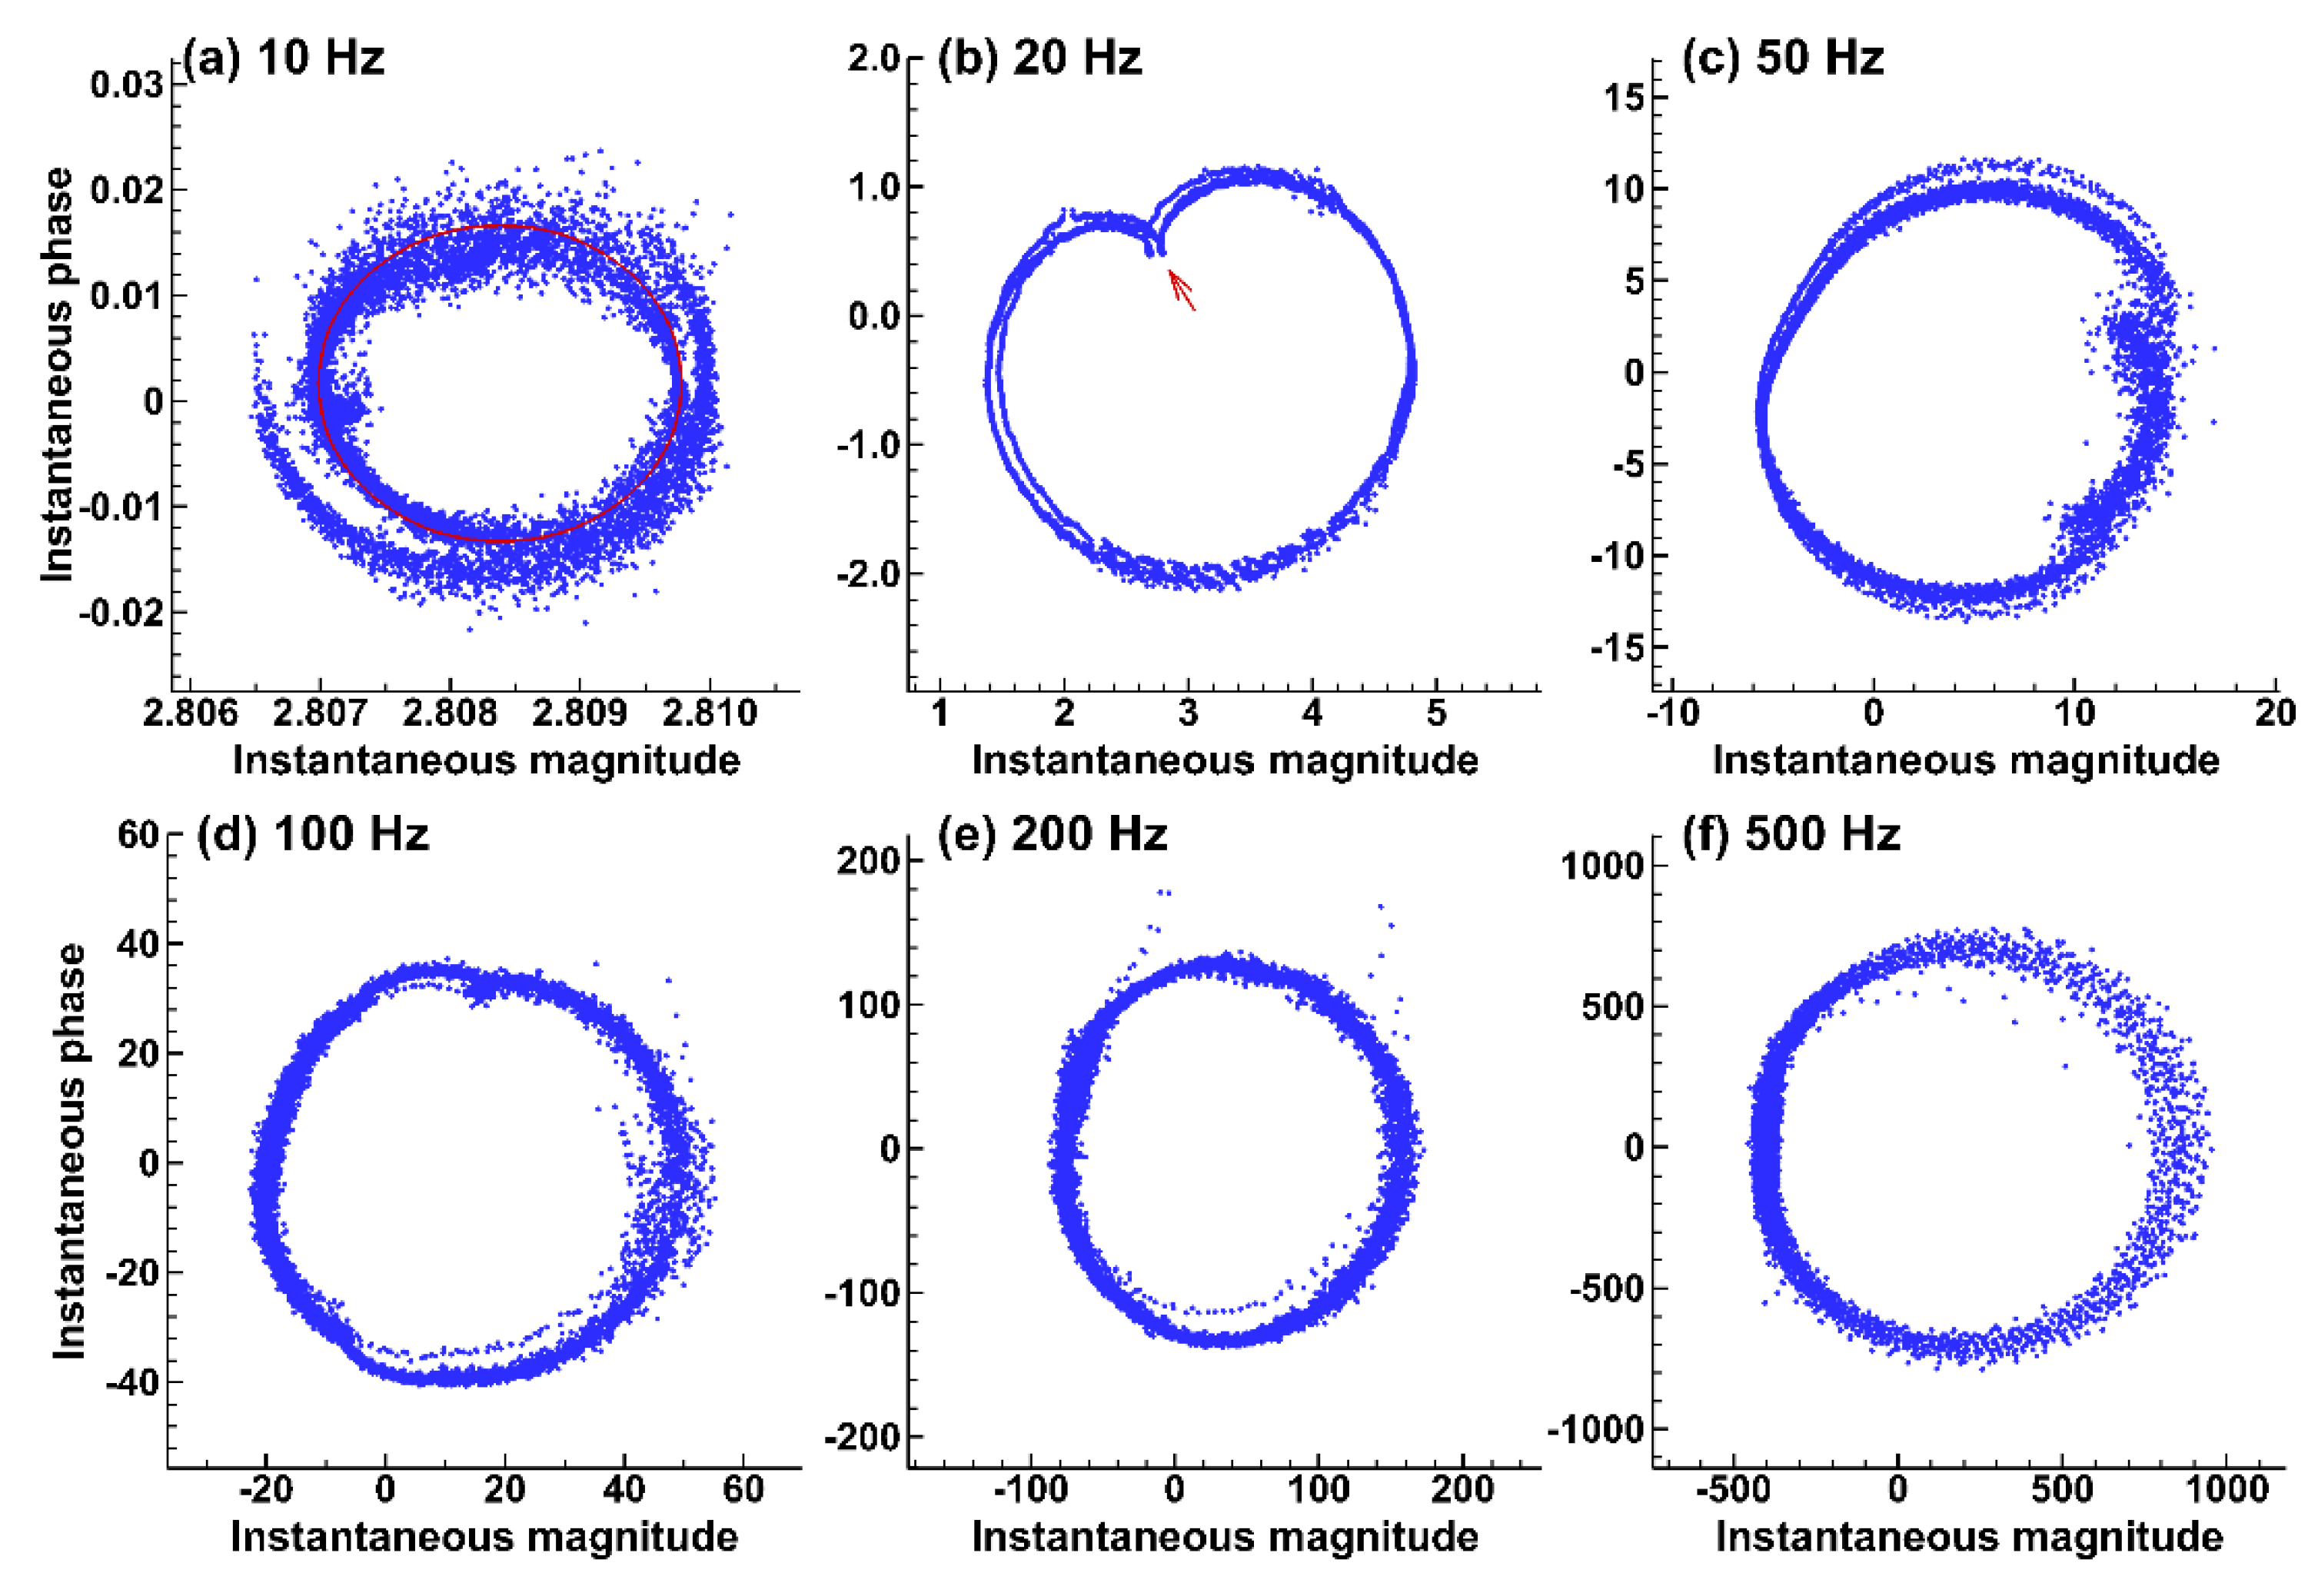
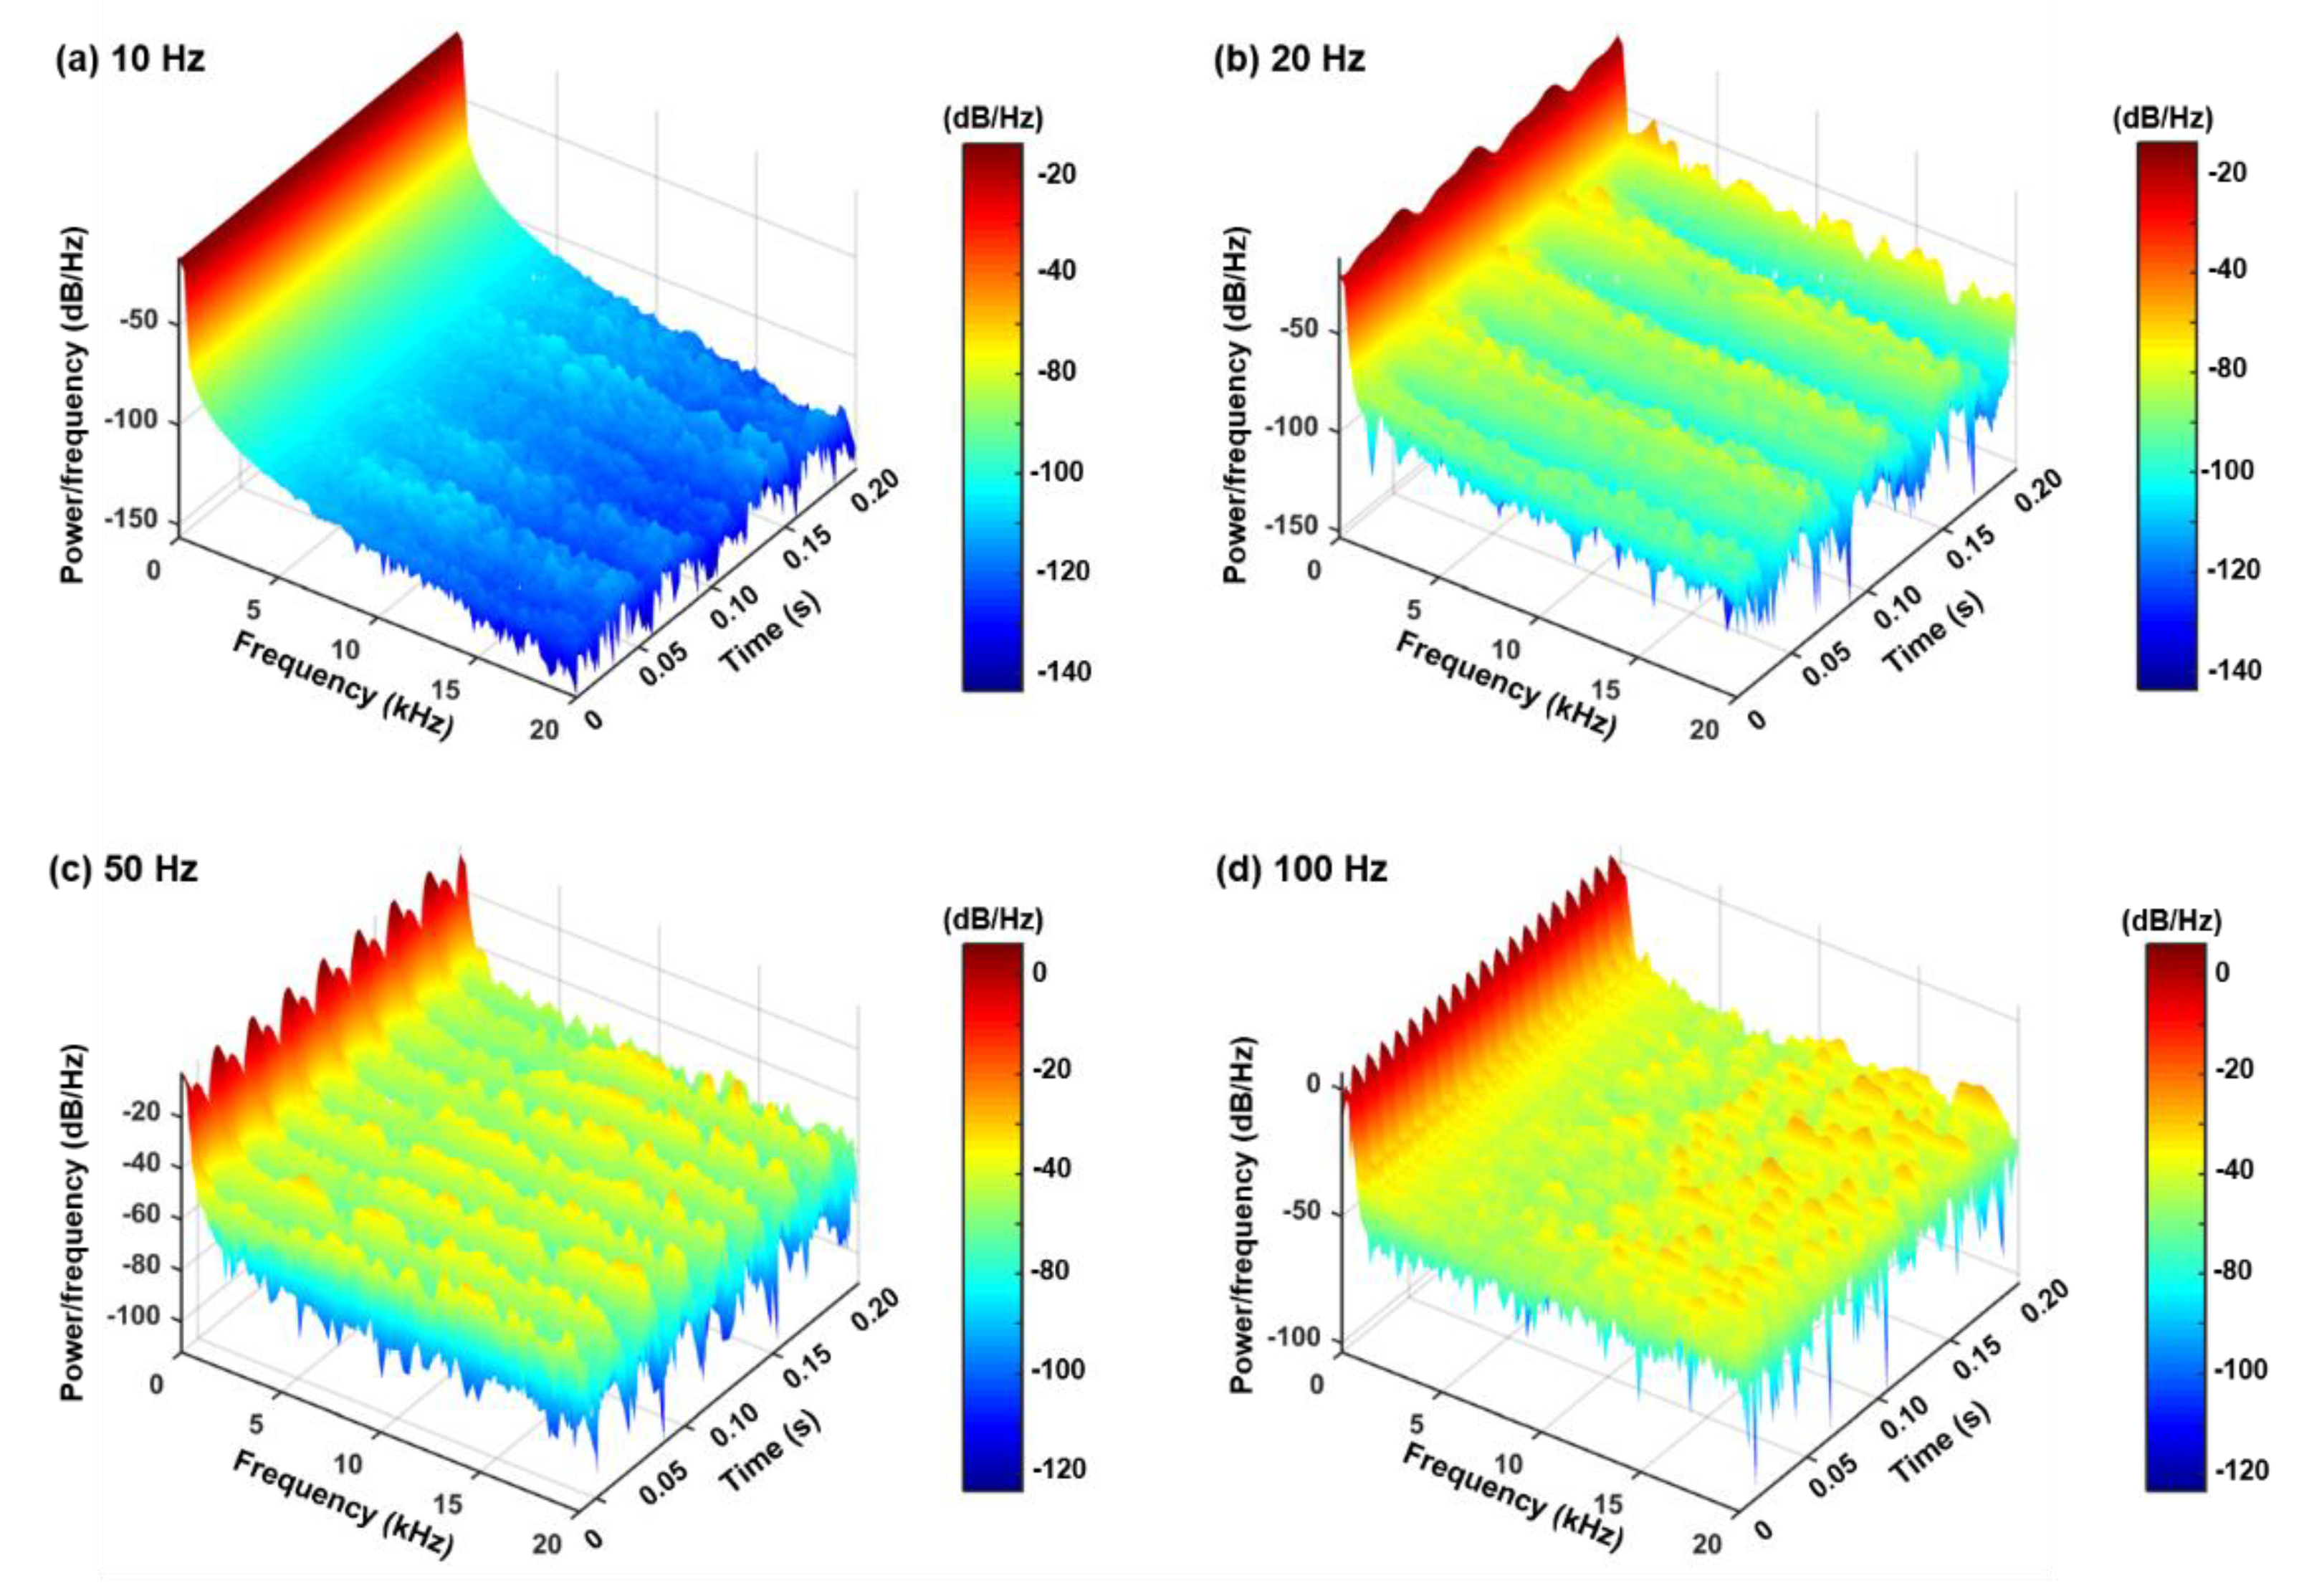
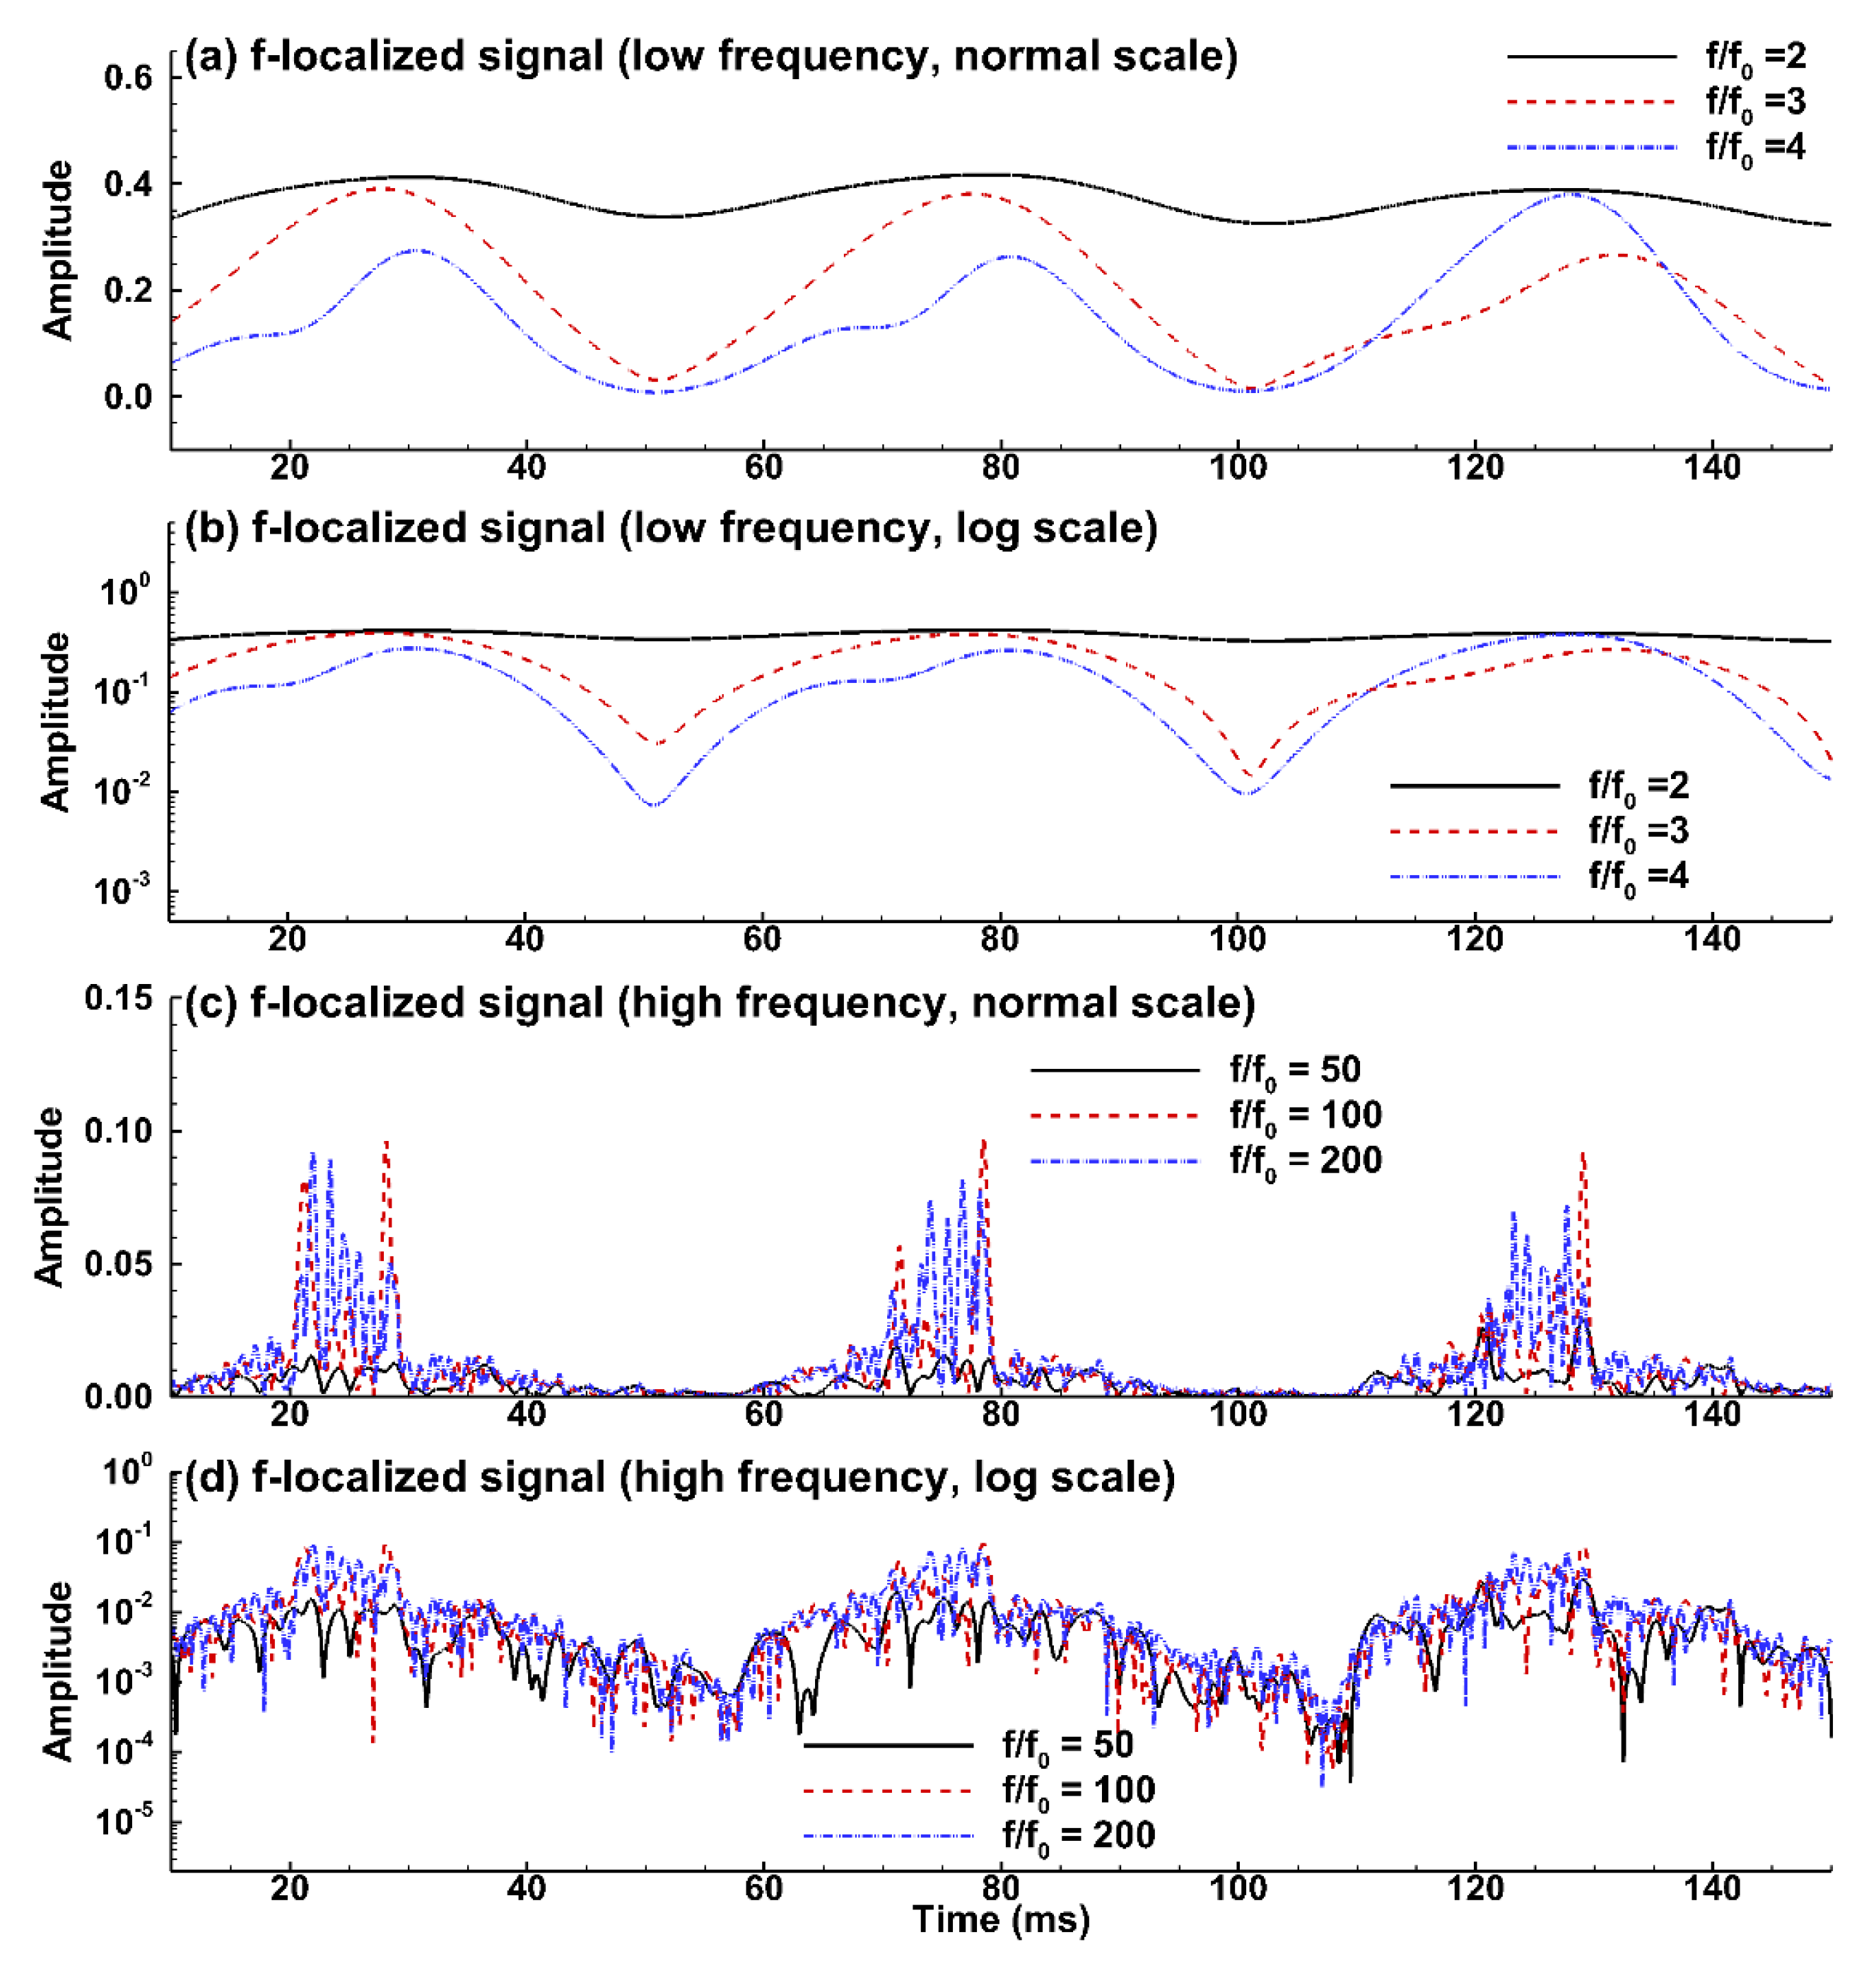
3.3.2. Hilbert and Wavelet Transform Analyses

To understand the responses of the pressure signals to the glottal vibration frequency, Hilbert transform of the pressure signals of two vibration cycles was conducted, and the resultant phase space was displayed in Figure 8a–f for frequencies 10–500 Hz, respectively. Overall, good periodicity existed for signals in consecutive cycles for all frequencies considered, as evidenced by the closed circular-like profiles in Figure 8a–f. The deviation from the circular profile grew with decreasing frequencies. Specifically, the 20 Hz phase space showed a recurrent dip (red arrow), and the 10 Hz space phase exhibited the highest level of scattering, both of which were consistent with the observations in Figure 7a,b.
Further analyses of the pressure signals at varying vibration frequencies were also conducted by examining their multifractal dimensions. As shown in Figure 9a, apparent differences were noted between 10 Hz and other frequencies. Subtle disparities also existed among high frequencies (20–500 Hz), generally with a wider range of multifractal dimensions Dh and holder exponent h for higher frequencies. Similar observations were made in Figure 9b, with a wider range of the scaling exponent λ at a higher vibration frequency. The increase rate of the λ-range was nonlinear, which increased faster at low frequencies and slower at high frequencies (Figure 9b).
Figure 10 shows the power ’waterfall’ spectrogram of the sound pressure signals at varying vibration frequencies. The term "waterfall" came from the visual appearance as plotted in 3D with frequency-normalized power in the z-coordinate and frequency (Hz) and time (s) in the x- and y- coordinates. Overall, for a given glottal vibration frequency (f0), the sound pressure dropped quickly along the frequency f axis, and there was apparent periodicity along the time axis. Meanwhile, high levels of disturbances existed, presumably due to turbulence-generated fluctuations.

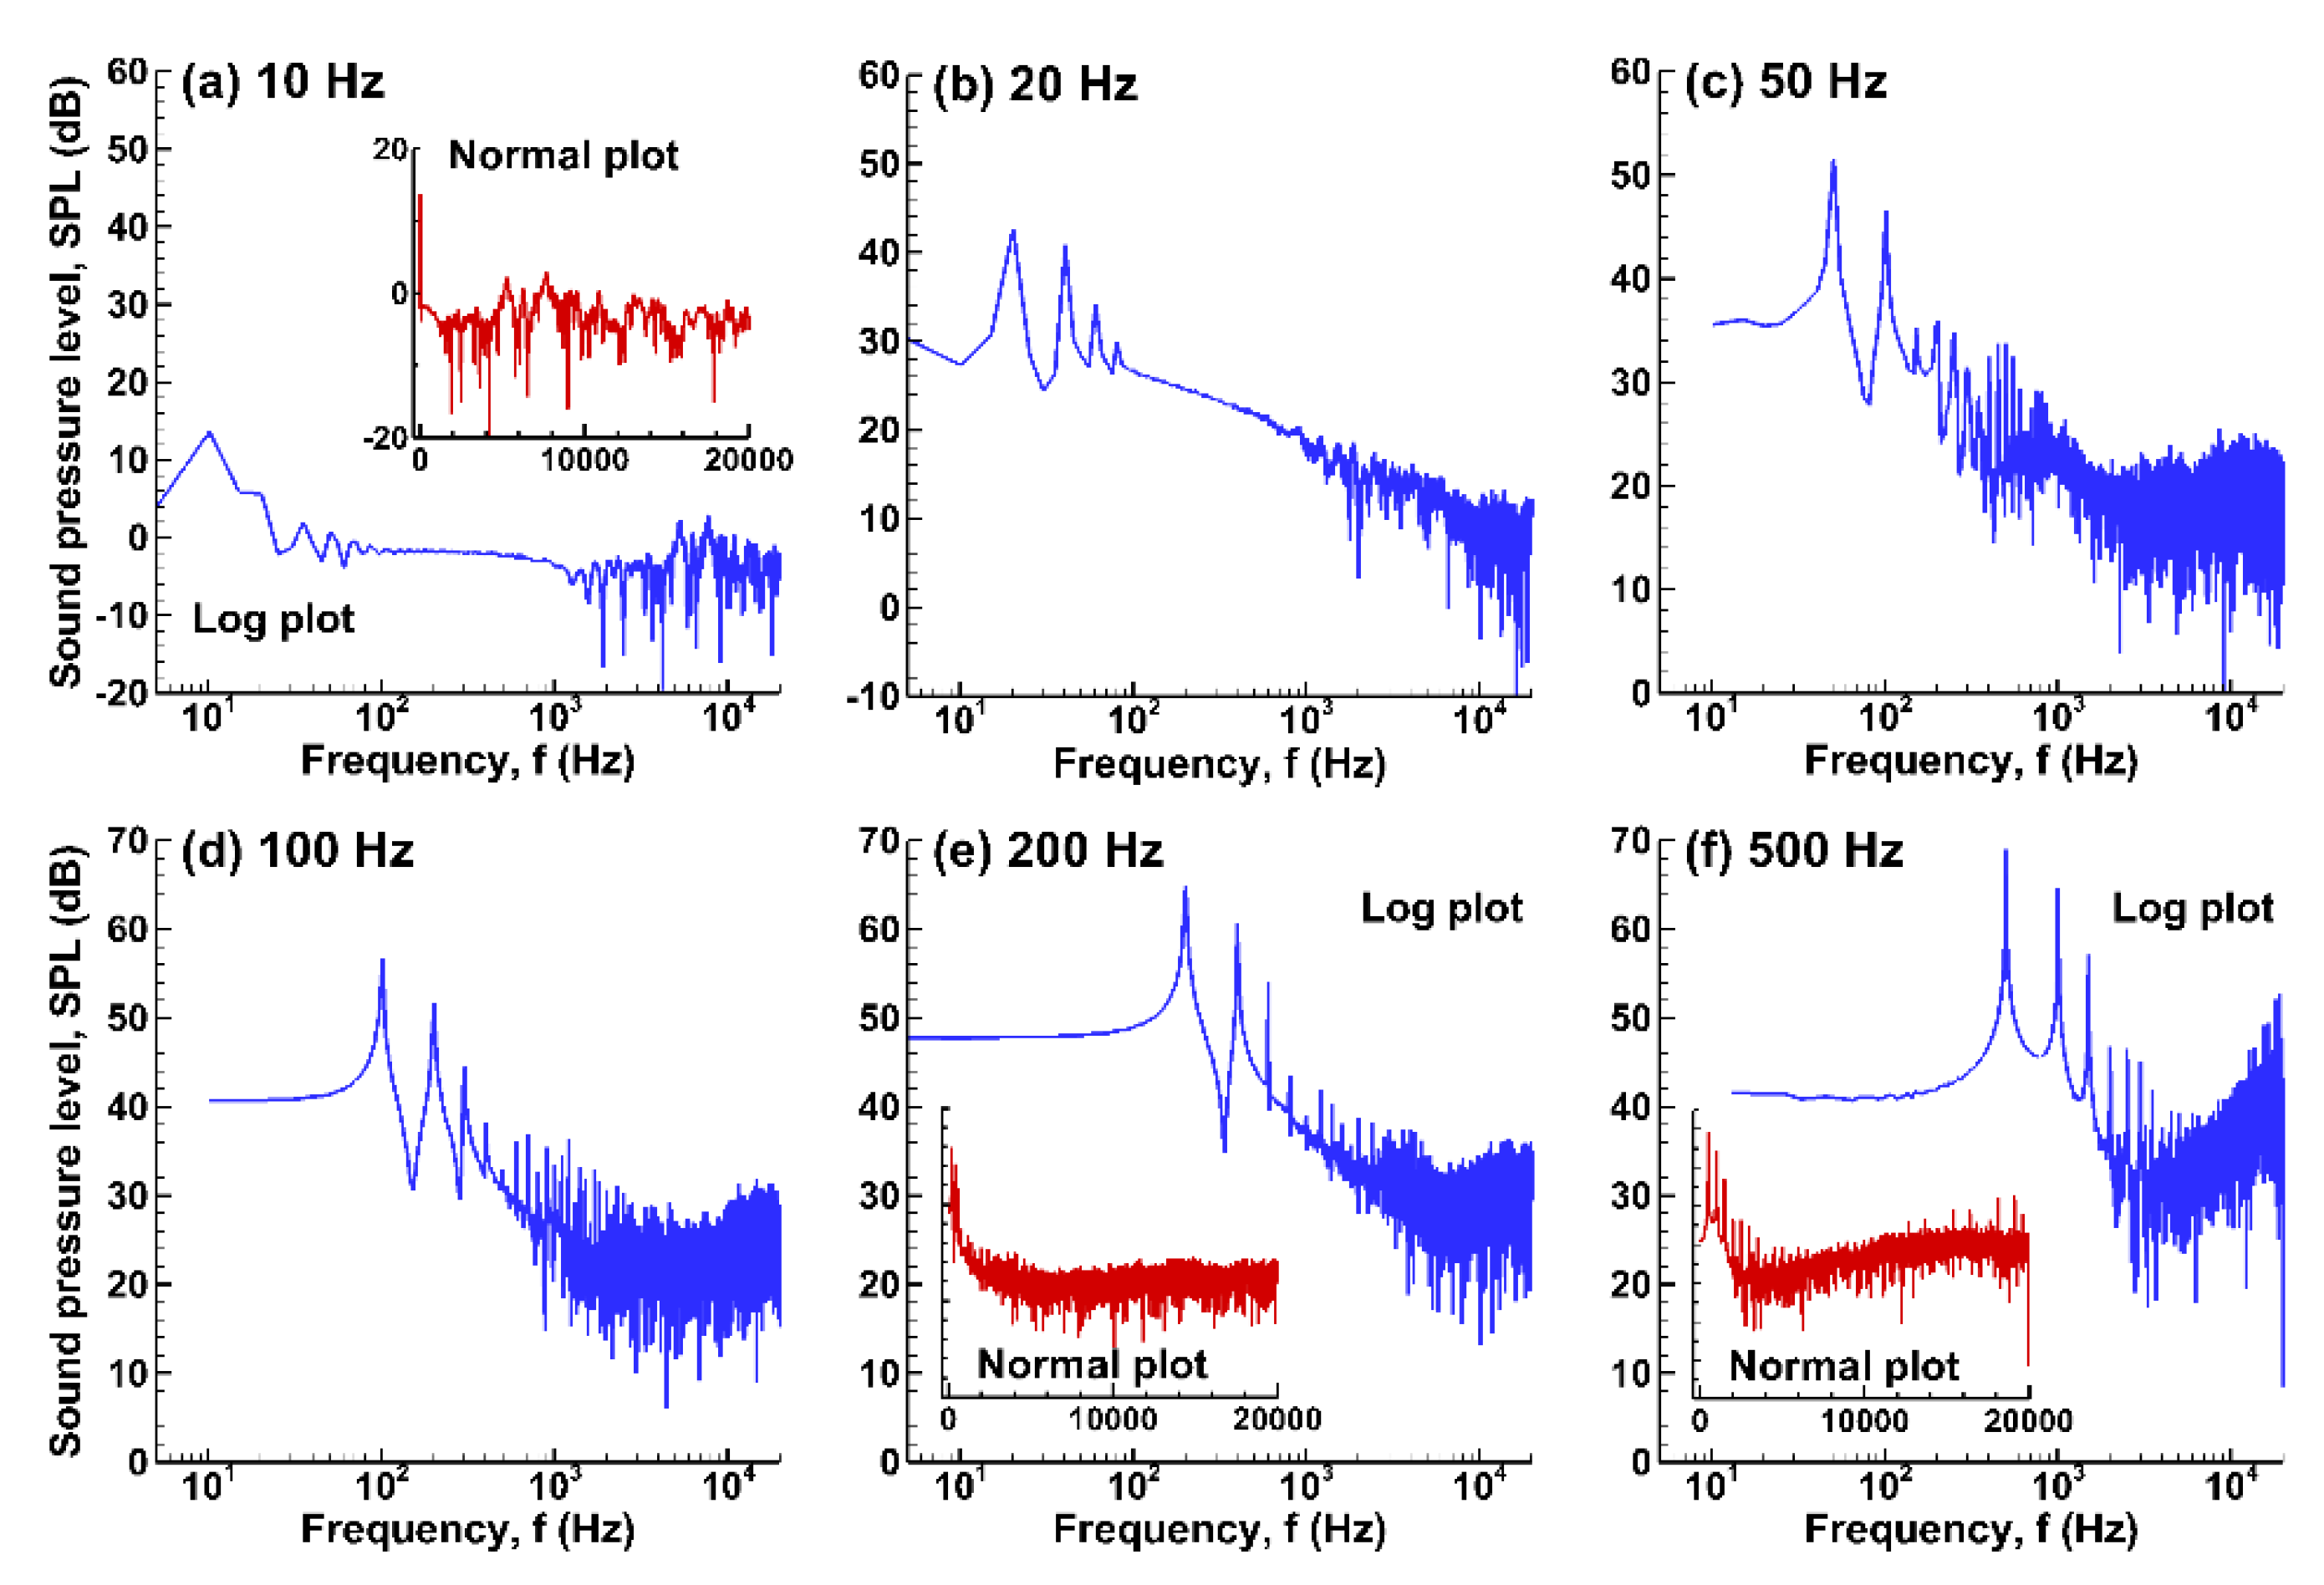
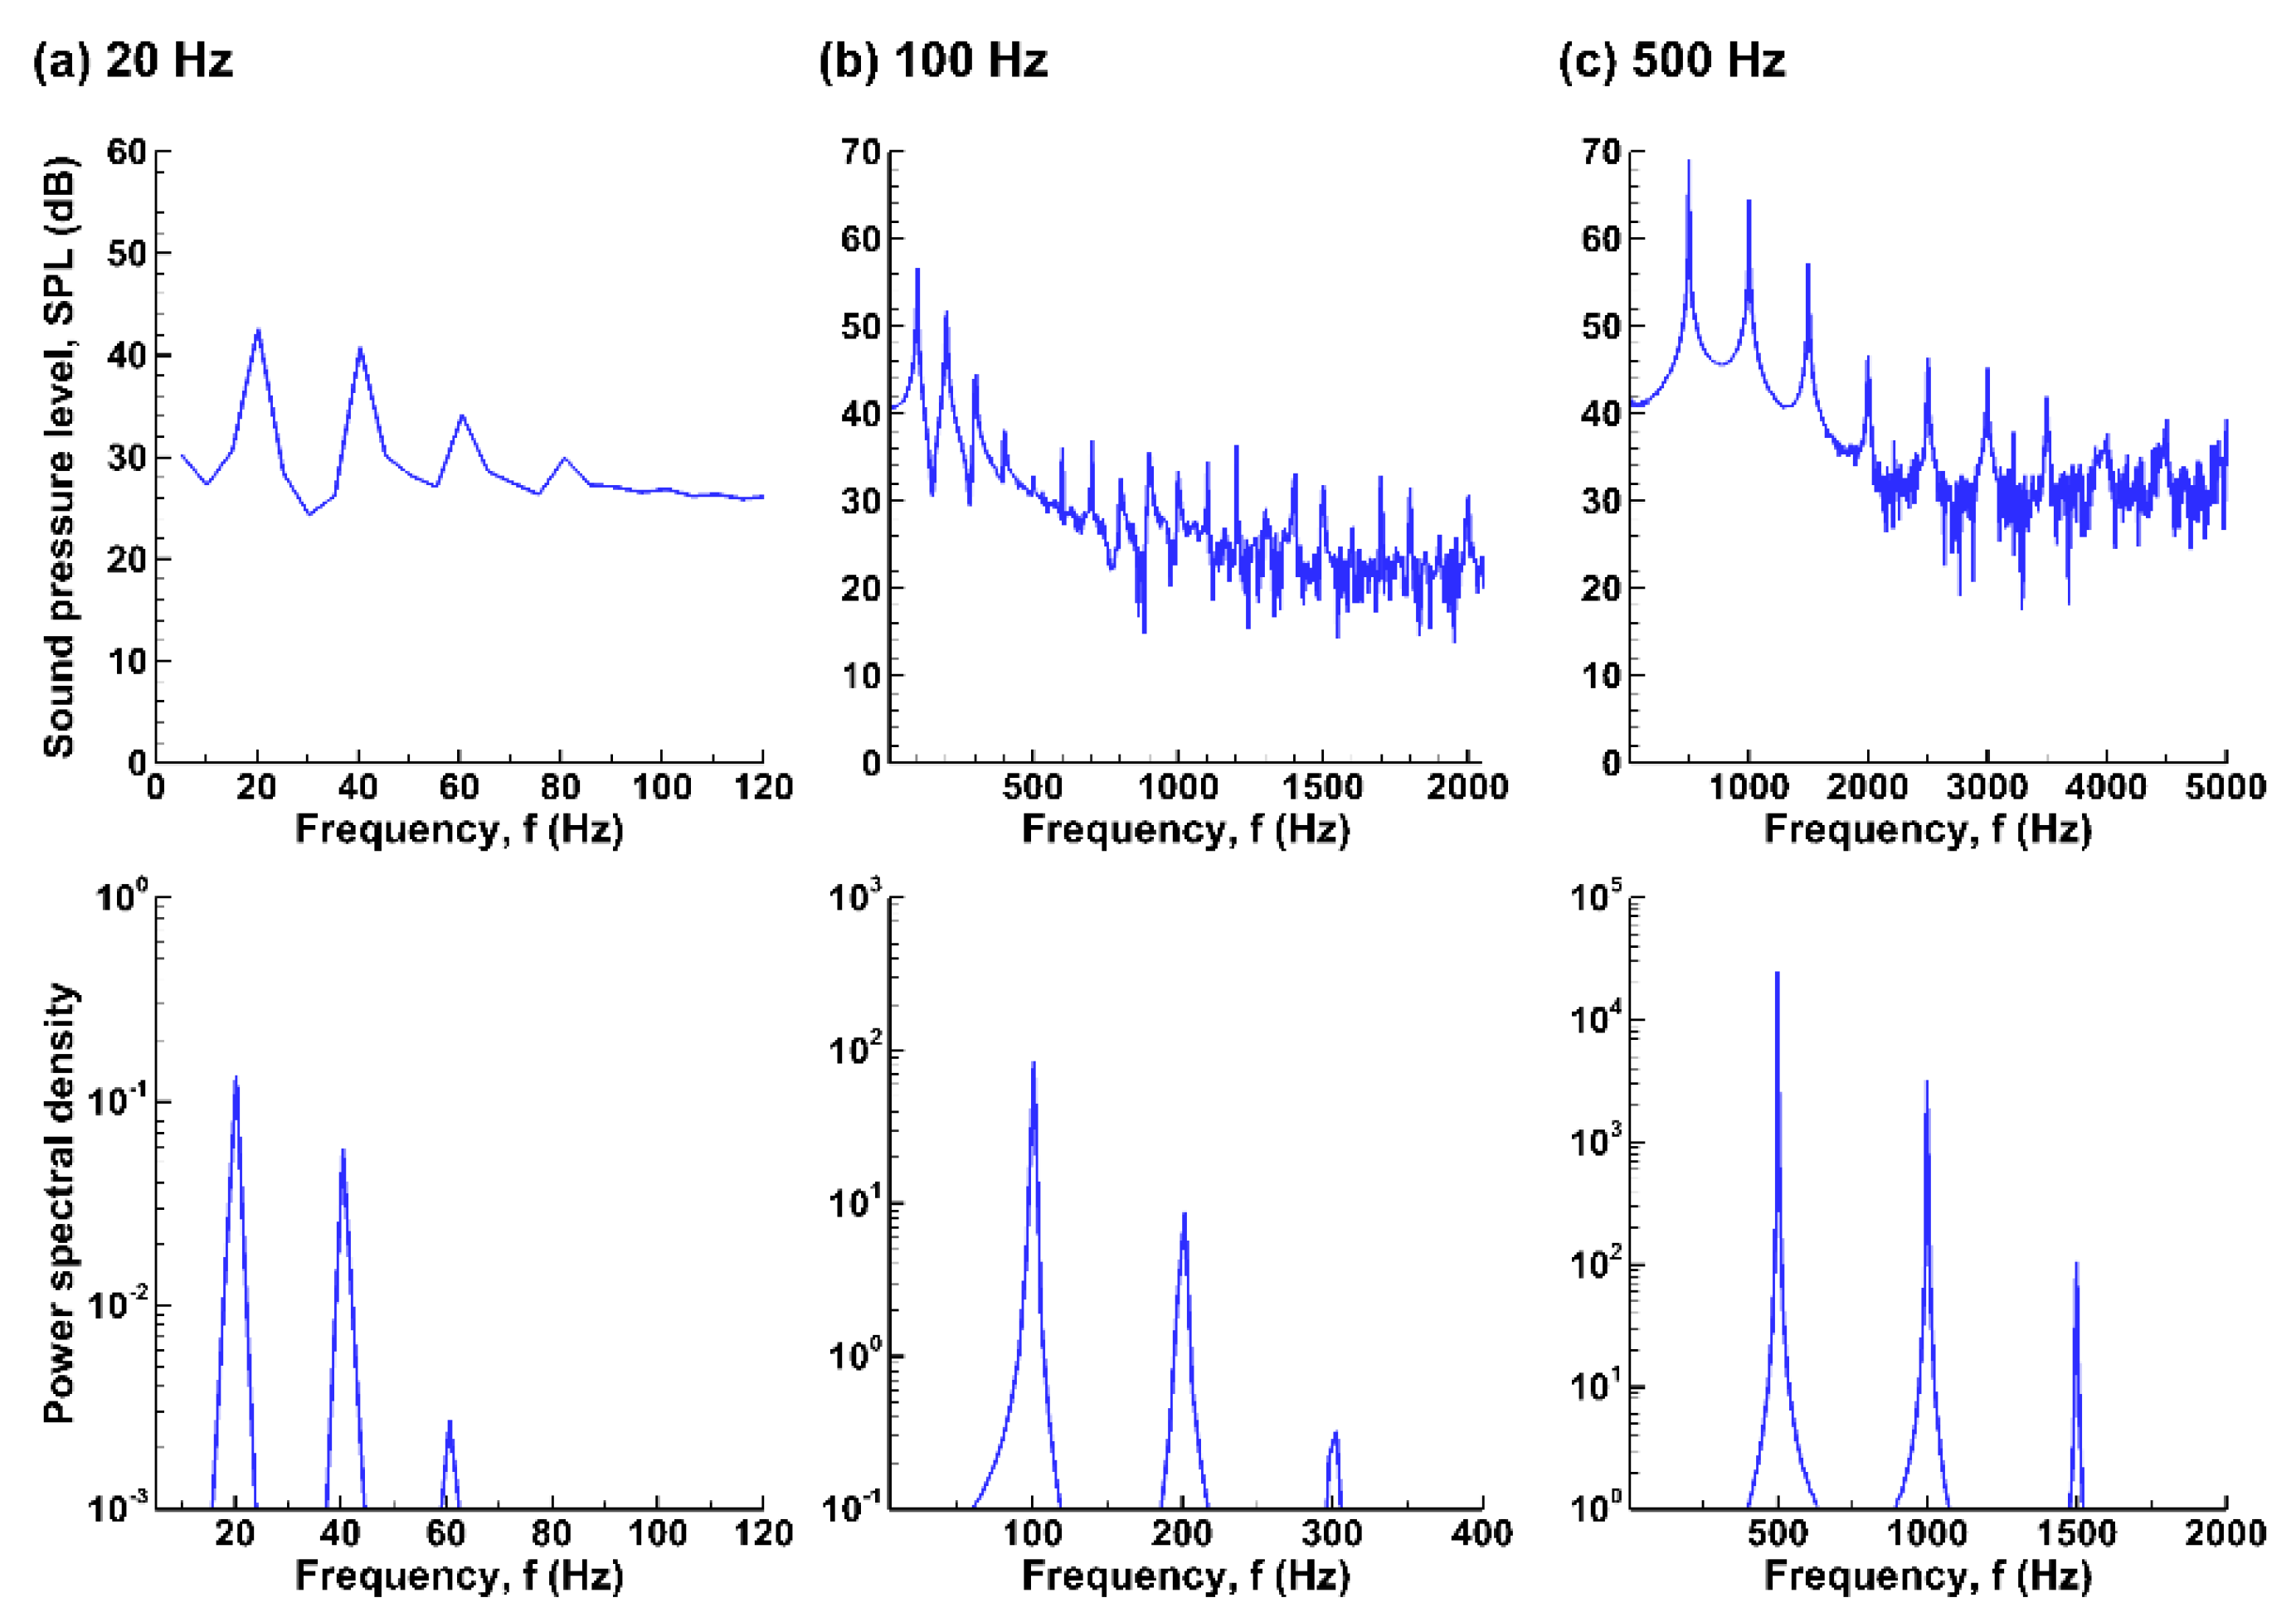
3.3.3. Fast Fourier Transform (FFT) Analyses

The sound pressure level (SPL) is shown in Figure 11 in the range of f = 0–20,000 Hz for glottal vibration frequencies of f0 = 10–500 Hz. The reference pressure was 2 × 10⁻⁵ Pa. Both normal and semi-logarithmic plots were presented. When f0 ≥ 20 Hz, harmonics occurred at the low end of acoustics frequency (f) with descending amplitudes, while no obvious harmonic was detected when f0 = 10 Hz. At the high end of acoustics frequency (f > 2000), the SPL magnitudes became random regardless of the glottal vibration frequency f0 (Figure 11a–f).
Figure 12a shows the SPL at the low end of acoustic frequency (f) for three glottal vibration frequencies (f0 = 20, 100, and 500 Hz). For a given f0, the first SPL peak occurred at the vibration frequency (f0, forcing frequency). It was followed by three or more harmonics with descending sound energy. Similar observations were made in the plots of the power spectral density (PSD, lower panels of Figure 12a–c). Note the large differences in the PSD magnitude among the three cases, which was three orders of magnitude higher when increasing f0 from 10 to 100 Hz and two orders of magnitude higher when increasing f0 from 100 to 500 Hz.
Humans perceive sound differently, depending on the ear’s sensitivity to different acoustic frequencies. The A-weighted SPL (unit: dBA) was plotted in Figure 13 as a function of the octave band (Hz) for six glottal vibration frequencies. As human ears are more sensitive to sound frequencies between 500 and 6000 Hz, the peak loudness also occurred within this range (Figure 13b). A-weighted SPL generated at glottal vibration frequencies 10, 20, and 50 Hz are all below 40 dBA and, thus, should be inaudible to human ears. Increasing the glottal vibration frequency (f0) increased the perceived loudness both at individual acoustic frequencies (f) and total sound loudness (i.e., area under the curve between 20 and 20,000 Hz).
In Figure 14, the sound pressure signals at f0 = 20 Hz were decomposed into f-specific components. Figure 14a,b show the f-localized signals that are 2, 3, and 4 times that of the forcing frequency f0 (i.e., f/f0 = 2, 3, 4) at normal and semi-logarithmical scales, while Figure 14c, d show those at f/f0 = 50, 100, 200. At lower acoustic frequencies (f/f0 = 2, 3, 4), the sound signals had larger amplitudes, smaller variations in magnitude, and were periodic; while these were not true at high acoustic frequencies (f/f0 = 50, 100, 200), exhibited high levels of variations. In addition, the amplitude of the first harmonic (f/f0 = 2) is higher than all other f-localized signals.

4. Discussion

The glottal vibration is fundamental to breath-related disorders and sound generation, yet detailed numerical studies on its role in airflow kinematics and dynamics are scarce; the conventional understanding and theoretical analyses of this topic still rely heavily on Bernoulli’s law [50] and ignore flow unsteadiness, vortices, and instability, which can be key factors to sound generation [51,52,53]. A systemic study was conducted of the flow and acoustics with glottal vibrations of different frequencies, from which new insights can be gained into the flow–structure interactions, as discussed below.

4.1. Flow Responses to Glottal Vibrations

In this study, we observed different sensitivities of the airflow, pressure forces, and acoustics to the glottal vibration frequency. For a given inspiratory flow rate (15 L/min herein), flow oscillations occurred in the throat (Figure 3 and Figure 4). The upper airway can be treated as a mass–spring–damper system, and the ratio of acoustic pressure to flow is the acoustic impedance, i.e., Z = R + j(ωI1/ωC), where R is the resistance, I is the inertance, C is the compliance, and ω = 2πf is the oscillation frequency in radians. In Figure 4b, the scaled glottal flow fluctuation over f (i.e., (QGQ0)/Q0f) nicely collapsed the QG data into approximately one curve, indicating that the inertance term ωI was dominant in the glottal region. Theoretically, the inertance I is a fluid-geometrical property and can be expressed as ρL/A, with ρ being the air density, and L and A being the glottal length and cross-sectional area, respectively [54].
In addition to the approximate linearity between flow oscillation and glottal vibration, phase shifts were predicted for all vibrations considered (Figure 3c and Figure 4), with the peak flow ahead of the sinusoidal peak. This was because of the dominance of inertance in the glottal region, which also caused phase differences between the flow and pressure. Due to the inertance, the pressure needs to go ahead of the flow for a certain period of time so that a flow change can occur (i.e., Δv = int (a·dt)). In Figure 4c, we also observed slight phase differences among different vibration frequencies, with 500 Hz shifting to the rightmost (dashed line). This might come from the compliance term 1/ωC, which caused the flow to lag the geometry change. The compressibility of the glottal air column gave it acoustic compliance.

4.2. Is the Glottal Vibration Self-Sustained?

In this study, the vibrations of the glottis were prescribed as sinusoidal waveforms of varying frequencies. The temporal and spatial evolutions of pressure and force were computed in response to these glottal vibrations. However, even in this passive mode, we observed one interesting flow behavior that was amendable to self-sustained glottal vibrations. In other words. the flow-induced forces would assist the glottal motion, rather than resist its motion as in conventional dynamic systems. As presented in Figure 3c, there was a phase shift between the glottal flow rate and the glottal aperture area, a phenomenon that had been reported in several studies of glottis dynamics [55,56,57]. This phase shift (i.e., an asymmetric flow–structure interaction) has been suggested to result from the inertive (mass-like) properties of the glottal airflow and could be one critical factor in determining whether the glottal vibration could be self-sustained or not.
In theory, the intra-glottal pressure pg is proportional to the flow change rate, i.e., pg = I·dQ/dt, where I is the glottal inertance. At the initial stage of glottal contraction (first quartile, Figure 15), the flow rate increased (i.e., dQ/dt > 0), leading to a positive intra-glottal pressure pg, and therefore opposing the glottal contraction. In the second quartile, the glottal contraction continued, but the flow rate decreased (i.e., dQ/dt < 0) to the inertance-induced phase shifted; this resulted in a negatively valued pg, which assisted the glottal contraction to the minimum aperture. In the third quartile, the glottis started to expand, and the glottal flow rate decreased (i.e., dQ/dt < 0), leading to a negative pg and resisting the expansion process. The glottis continued to expand in the fourth quartile, but the flow rate started to increase (dQ/dt > 0), and the positive pg promoted the expansion to the maximal aperture (Figure 15). These theoretical results were verified by the numerically predicted pressure forces acting on the glottal wall in Figure 5c, which opposed the glottal motion in the first and the third quartiles and assisted the motion in the second and fourth quartiles of the vibration cycle. Considering that the negative work in the first/third quartiles and the positive work in the second/fourth quartiles may cancel each other, reaching a net zero work, a self-sustained vibration is possible. In this case, an existing vibration, regardless of the forces that started it, will continue and remain self-sustained till an anti-work slows it down or a positive work speeds it up.

4.3. Effect of Glottal Vibrations on Acoustics

The responses of the instantaneous pressure and acoustics to varying glottal vibration frequencies are more complex than the flow and force responses. Therefore, theoretical analyses using different algorithms were performed to understand the underlying mechanisms from different angles, as shown in Figure 7, Figure 8, Figure 9, Figure 10, Figure 11, Figure 12, Figure 13 and Figure 14. Aside from the amplitude of pressure fluctuations, the pressure variation over one vibration, as well as the phase shift and periodicity, differed mainly in low-frequency vibrations (i.e., 10 Hz and 20 Hz vs. 50–500 Hz, Figure 7 and Figure 8). Note that both the extreme low (10 Hz) and high (500 Hz) frequencies were considered merely for comparison purposes and might not occur naturally in humans. In addition, note that the pressure signals were sampled at 0.3 m from the mouth opening, not the throat, to mimic a sound recorder in sleep tests. In Figure 7a (10 Hz), the insignificant phase shift and erratic pressure fluctuations relative to the baseline might come from the still non-dominant flow inertia. Similarly, the periodicity of the pressure signals could also be significantly affected by the main flow, as demonstrated in Figure 8a. The pressure profile under 20 Hz vibrations was different from those under vibrations with higher frequencies, with a saddle in Figure 7b and a transition point in Figure 8b in comparison to the smoother profiles at 50 Hz and higher. The reasons underlying the unique profiles at 20 Hz were not clear and might result from the augmentation/attenuation of signals at certain acoustic frequencies from the glottis to the mouth opening [38,46]. One result supporting this speculation was the gradual smoothing out of the transition point from 20 to 100 Hz (Figure 8b–d), which disappeared completely at 200 and 500 Hz (Figure 8e,f).
Vibration-specific responses were also observed in the multifractal spectrum (Figure 9), spectrogram in the time–frequency domain (Figure 10), sound pressure level (Figure 11 and Figure 12), and power spectral density (Figure 12). In addition to the large amplitude differences among vibration frequencies f0, signature features were obtained for certain ranges of f0. The 10 Hz multifractal spectrum had a much narrower range than other vibration frequencies (Figure 9). Likewise, the power spectral density, and to a lesser degree the sound power level, was closely related to the glottal vibration frequency, especially for f0 = 100 Hz and above (Figure 12). A variation in vibration frequency is often a direct result of alterations in the structure and/or material properties, as demonstrated by Lodermeyer et al. [27] and Kimura et al. [58]; as such, the vibration-frequency-specific responses are promising to be used as a diagnostic tool, individually or as a combination, in vocal fold dysfunction, snoring, sleep apnea, or other breathing-related diseases [59].
We note that two frequencies were used in this study, one was the glottal vibration frequency f0 (source of the perturbation, 10–500 Hz herein), and the other was the acoustic frequency (fa or simply f) of the flow-generated sound (0–20,000 Hz). In Figure 14, acoustic-frequency-specific (f-localized) signals were also decomposed from the acoustic spectrum at f0 = 20 Hz. Because of the two-way structure–vibration association, such acoustic f-localized signals have also been widely applied in diagnostics, prognosis, and monitoring [60].

4.4. Limitations

The applicability of the results can also be limited by the simplifications adopted in this study, including one-way structure-to-flow coupling, idealized glottis kinematics, and simplified glottis geometry. This study only considered the flow responses to glottal vibrations; however, two-way coupling exists between the glottis motion and flow, which may, in turn, elicit more complex glottal motions and alter flow instabilities [61,62]. The glottal vibration kinematics is not an exact sinusoidal waveform [31]. Moreover, the vocal fold is a multi-layer tissue and follows a specific 3D vibration pattern [63]. In addition to the transverse motion, out-of-plane motions of the glottis have also been reported [64]. The influences of false vocal folds were excluded, which could play an important role in regulating both inspiratory and expiratory flows [28,65,66]. However, using an idealized glottis geometry and motion greatly reduces the computational requirements but still adequately captures the predominant physics and serves as a reasonable approximation to life conditions. Note that the Ffowcs Williams and Hawkings (FW-H) model was inherently an integral approach for acoustic radiation and could not consider acoustic resonance [67]. This might be the reason that formant-like spectral characteristics were not observed in this study. In this regard, the more recent aeroacoustics models, such as Acoustic Perturbation Equations (APE) or Perturbed Convective Wave Equation (PCWE), may yield more realistic results, as demonstrated by Schoder et al., who characterized the sound sources of human phonation using PCWE [67].

5. Conclusions

In summary, this study numerically evaluated the influences of glottal vibration frequency ranging from 10 to 500 Hz on airflow dynamics and acoustics. The flow-induced forces were examined on their roles in the glottal vibration mechanism. Instantaneous pressure signals were analyzed to identify vibration-frequency-specific properties. Specific findings include:
1. Glottal vibration can significantly alter the flows in the glottis and trachea, especially at high frequencies. With increasing vibration frequencies, the vortices decreased in scale and moved from the main flow to the walls.
2. Phase shifts occurred between the glottis motion and glottal rates for all frequencies considered. Due to this phase shift, the pressure forces resisted the glottal motion in the first half of contraction/expansion (first/third quartiles) and assisted the glottal motion in the second half of contraction/expansion (second/fourth quartiles).
3. The magnitude of the glottal flow fluctuation was approximately linear with the vibration frequency (~f0), while the normal pressure force increased nonlinearly with the frequency (~f01.85).
4. Regression of the shear forces acting on the glottal wall showed different levels for low and high frequencies.
5. Instantaneous pressure signals and derived variables were irregular at low vibration frequencies (10 and 20 Hz) and became increasingly regular in the pressure profile, periodicity, and wavelet-transformed parameters.

Author Contributions

Conceptualization, J.X., X.S. and H.D.; methodology, J.X., X.S. and H.D.; software, M.T. and X.S.; validation, J.X., M.T. and X.S.; formal analysis, T.M and X.S.; investigation, M.T. and X.S.; resources, J.X. and H.D.; data curation, X.J and M.T.; writing—original draft preparation, J.X. and X.S.; writing—review and editing, M.T. and H.D.; visualization, J.X., M.T. and X.S.; supervision, J.X.; funding acquisition, J.X. and H.D. All authors have read and agreed to the published version of the manuscript.

Funding

This research was funded by NSF Grants CBET 1605432 (J.X.) and 1605234 (H.D.).

Data Availability Statement

Data are available within the article.

Acknowledgments

Amr Seifelnasr at UMass Lowell Biomedical Engineering is gratefully acknowledged for reviewing this manuscript before its submission.

Conflicts of Interest

The authors declare no conflict of interest. The funders had no role in the design of the study; in the collection, analyses, or interpretation of data; in the writing of the manuscript; or in the decision to publish the results.

References

  1. Colton, R.H. Physiological mechanisms of vocal frequency control: The role of tension. J. Voice 1988, 2, 208–220. [Google Scholar] [CrossRef]
  2. Triep, M.; Brücker, C. Three-dimensional nature of the glottal jet. J. Acoust. Soc. Am. 2010, 127, 1537–1547. [Google Scholar] [CrossRef] [PubMed]
  3. Khosla, S.; Muruguppan, S.; Gutmark, E.; Scherer, R. Vortical flow field during phonation in an excised canine larynx model. Ann. Otol. Rhinol. Laryngol. 2007, 116, 217–228. [Google Scholar] [CrossRef] [PubMed] [Green Version]
  4. Mihaescu, M.; Khosla, S.M.; Murugappan, S.; Gutmark, E.J. Unsteady laryngeal airflow simulations of the intra-glottal vortical structures. J. Acoust. Soc. Am. 2010, 127, 435–444. [Google Scholar] [CrossRef] [PubMed] [Green Version]
  5. Mattheus, W.; Brücker, C. Characteristics of the pulsating jet flow through a dynamic glottal model with a lens-like constriction. Biomed. Eng. Lett. 2018, 8, 309–320. [Google Scholar] [CrossRef]
  6. Brouns, M.; Verbanck, S.; Lacor, C. Influence of glottic aperture on the tracheal flow. J. Biomech. 2007, 40, 165–172. [Google Scholar] [CrossRef]
  7. Xi, J.; April Si, X.; Dong, H.; Zhong, H. Effects of glottis motion on airflow and energy expenditure in a human upper airway model. Eur. J. Mech. B Fluids 2018, 72, 23–37. [Google Scholar] [CrossRef]
  8. Patel, R.R.; Dubrovskiy, D.; Döllinger, M. Measurement of glottal cycle characteristics between children and adults: Physiological variations. J. Voice Off. J. Voice Found. 2014, 28, 476–486. [Google Scholar] [CrossRef] [Green Version]
  9. Smith, S.L.; Titze, I.R. Vocal fold contact patterns based on normal modes of vibration. J. Biomech. 2018, 73, 177–184. [Google Scholar] [CrossRef]
  10. Stevens, K.N.; Hanson, H.M. Classification of glottal vibration from acoustic measurements. In Vocal Fold Physiology: Voice Quality Control; Fujimura, O., Hirano, M., Eds.; Singular: San Diego, CA, USA, 2017; Volume 9, pp. 147–170. [Google Scholar]
  11. Echternach, M.; Döllinger, M.; Sundberg, J.; Traser, L.; Richter, B. Vocal fold vibrations at high soprano fundamental frequencies. J. Acoust. Soc. Am. 2013, 133, El82–El87. [Google Scholar] [CrossRef]
  12. Sundberg, J. Vocal fold vibration patterns and modes of phonation. Folia. Phoniatr. Logop. 1995, 47, 218–228. [Google Scholar] [CrossRef] [PubMed]
  13. Kakitsuba, N.; Sadaoka, T.; Kanai, R.; Fujiwara, Y.; Takahashi, H. Peculiar snoring in patients with multiple system atrophy: Its sound source, acoustic characteristics, and diagnostic significance. Ann. Otol. Rhinol. Laryngol. 1997, 106, 380–384. [Google Scholar] [PubMed]
  14. Isozaki, E.; Hayashi, M.; Hayashida, T.; Tanabe, H.; Hirai, S. Vocal cord abductor paralysis in multiple system atrophy--paradoxical movement of vocal cords during sleep. Rinsho Shinkeigaku Clin. Neurol. 1996, 36, 529–533. [Google Scholar]
  15. Bawa, R.; Ramadan, H.H.; Wetmore, S.J. Bilateral vocal cord paralysis with Shy-Drager syndrome. Otolaryngol. Head Neck Surg. 1993, 109, 911–914. [Google Scholar] [CrossRef] [PubMed]
  16. McBrien, F.; Spraggs, P.D.; Harcourt, J.P.; Croft, C.B. Abductor vocal fold palsy in the Shy-Drager syndrome presenting with snoring and sleep apnoea. J. Laryngol. Otol. 1996, 110, 681–682. [Google Scholar] [CrossRef]
  17. Kavey, N.B.; Whyte, J.; Blitzer, A.; Gidro-Frank, S. Sleep-related laryngeal obstruction presenting as snoring or sleep apnea. Laryngoscope 1989, 99, 851–854. [Google Scholar] [CrossRef]
  18. Ricci-Maccarini, A.; Bergamini, G.; Fustos, R. Proposal of a form for the collection of videolaryngostroboscopy basic findings. Eur. Arch. Otorhinolaryngol. 2018, 275, 1927–1933. [Google Scholar] [CrossRef] [Green Version]
  19. Chan, R.W. Ovine Vocal Fold Tissue Fatigue Response to Accumulated, Large-Amplitude Vibration Exposure at Phonatory Frequencies. J. Speech Lang. Hear Res. 2019, 62, 4291–4299. [Google Scholar] [CrossRef]
  20. Regner, M.F.; Tao, C.; Ying, D.; Olszewski, A.; Zhang, Y.; Jiang, J.J. The effect of vocal fold adduction on the acoustic quality of phonation: Ex vivo investigations. J. Voice Off. J. Voice Found. 2012, 26, 698–705. [Google Scholar] [CrossRef] [Green Version]
  21. Motie-Shirazi, M.; Zañartu, M.; Peterson, S.D.; Erath, B.D. Vocal fold dynamics in a synthetic self-oscillating model: Intraglottal aerodynamic pressure and energy. J. Acoust. Soc. Am. 2021, 150, 1332. [Google Scholar] [CrossRef]
  22. Si, X.; Xi, J.S.; Talaat, M.; Donepudi, R.; Su, W.-C.; Xi, J. Evaluation of impulse oscillometry in respiratory airway casts with varying obstruction phenotypes, locations, and complexities. J. Respir. 2022, 2, 44–58. [Google Scholar] [CrossRef]
  23. Hollien, H. Vocal fold dynamics for frequency change. J. Voice Off. J. Voice Found. 2014, 28, 395–405. [Google Scholar] [CrossRef] [PubMed]
  24. Zhao, X.; Wang, J.; Han, P.; Xi, J.; Dong, H. Effect of uvula length on airflow and pressure oscillation in a human pharynx model. In Proceedings of the ASME 2019 International Mechanical Engineering Congress and Exposition, Salt Lake City, UT, USA, 11–14 November 2019; p. 11697. [Google Scholar]
  25. Lou, Z.; Wang, J.; Daniero, J.J.; Dong, H.; Xi, J. Airflow characterization combined with 3D reconstruction of rabbit vocal cord based on in-vivo phonatory experiments. In Proceedings of the ASME 2020 Fluids Engineering Division Summer Meeting collocated with the ASME 2020 Heat Transfer Summer Conference and the ASME 2020 18th International Conference on Nanochannels, Microchannels, and Minichannels, Virtual, 13–15 July 2020; p. 23369. [Google Scholar]
  26. Farbos de Luzan, C.; Chen, J.; Mihaescu, M.; Khosla, S.M.; Gutmark, E. Computational study of false vocal folds effects on unsteady airflows through static models of the human larynx. J. Biomech. 2015, 48, 1248–1257. [Google Scholar] [CrossRef] [Green Version]
  27. Lodermeyer, A.; Bagheri, E.; Kniesburges, S.; Näger, C.; Probst, J.; Döllinger, M.; Becker, S. The mechanisms of harmonic sound generation during phonation: A multi-modal measurement-based approach. J. Acoust. Soc. Am. 2021, 150, 3485. [Google Scholar] [CrossRef]
  28. Zhang, C.; Zhao, W.; Frankel, S.H.; Mongeau, L. Computational aeroacoustics of phonation, part II: Effects of flow parameters and ventricular folds. J. Acoust. Soc. Am. 2002, 112, 2147–2154. [Google Scholar] [CrossRef] [PubMed]
  29. Xi, J.; Longest, P.W. Evaluation of a drift flux model for simulating submicrometer aerosol dynamics in human upper tracheobronchial airways. Ann. Biomed. Eng. 2008, 36, 1714–1734. [Google Scholar] [CrossRef]
  30. Scheinherr, A.; Bailly, L.; Boiron, O.; Lagier, A.; Legou, T.; Pichelin, M.; Caillibotte, G.; Giovanni, A. Realistic glottal motion and airflow rate during human breathing. Med. Eng. Phys. 2015, 37, 829–839. [Google Scholar] [CrossRef]
  31. Scheinherr, A.; Bailly, L.; Boiron, O.; Legou, T.; Giovanni, A.; Caillibotte, G.; Pichelin, M. Glottal motion and its impact on the respiratory flow. Comput. Methods Biomech. Biomed. Engin. 2012, 15, 69–71. [Google Scholar] [CrossRef]
  32. Jackson, A.; Gulesian, P.; Mead, J. Glottal aperture during panting with voluntary limitation of tidal volume. J. Appl. Physiol. 1975, 39, 834–836. [Google Scholar] [CrossRef]
  33. Brancatisano, T.; Collett, P.W.; Engel, L.A. Respiratory movements of the vocal cords. J. Appl. Physiol. 1983, 54, 1269–1276. [Google Scholar] [CrossRef]
  34. England, S.J.; Bartlett, D., Jr.; Daubenspeck, J.A. Influence of human vocal cord movements on airflow and resistance during eupnea. J. Appl. Physiol. 1982, 52, 773–779. [Google Scholar] [CrossRef] [PubMed]
  35. Wu, L.; Zhang, Z. A computational study of vocal fold dehydration during phonation. IEEE Trans. Biomed. Eng. 2017, 64, 2938–2948. [Google Scholar] [CrossRef] [PubMed]
  36. Cohen, B.S.; Sussman, R.G.; Lippmann, M. Ultrafine particle deposition in a human tracheobronchial cast. Aerosol Sci. Technol. 1990, 12, 1082–1093. [Google Scholar] [CrossRef]
  37. Nicoud, F.; Ducros, F. Subgrid-Scale Stress Modelling Based on the Square of the Velocity Gradient Tensor. Flow Turbul. Combust. 1999, 62, 183–200. [Google Scholar] [CrossRef]
  38. Xi, J.; Si, X.; Kim, J.; Su, G.; Dong, H. Modeling the pharyngeal anatomical effects on breathing resistance and aerodynamically generated sound. Med. Biol. Eng. Comput. 2014, 52, 567–577. [Google Scholar] [CrossRef] [PubMed]
  39. Brentner, K.S.; Farassat, F. Modeling aerodynamically generated sound of helicopter rotors. Prog. Aerosp. Sci. 2003, 39, 83–120. [Google Scholar] [CrossRef] [Green Version]
  40. Lilley, G.M. The Radiated Noise from Isotropic Turbulence Revisited; NASA Contract Report 93–75; NASA Langley Research Center: Hampton, VA, USA, 1993. [Google Scholar]
  41. Salomons, E.M.; Janssen, S.A. Practical ranges of loudness levels of various types of environmental noise, including traffic noise, aircraft noise, and industrial noise. Int. J. Environ. Res. Public Health 2011, 8, 1847–1864. [Google Scholar] [CrossRef] [Green Version]
  42. Kang, J.M.; Kim, S.T.; Mariani, S.; Cho, S.E.; Winkelman, J.W.; Park, K.H.; Kang, S.G. Difference in spectral power density of sleep EEG between patients with simple snoring and those with obstructive sleep apnoea. Sci. Rep. 2020, 10, 6135. [Google Scholar] [CrossRef] [Green Version]
  43. Longest, P.W.; Xi, J. Effectiveness of direct Lagrangian tracking models for simulating nanoparticle deposition in the upper airways. Aerosol Sci. Technol. 2007, 41, 380–397. [Google Scholar] [CrossRef]
  44. Xi, J.; Talaat, M.; Si, X.A. Two-way coupling and Kolmogorov scales on inhaler spray plume evolutions from Ventolin, ProAir, and Qvar. Math. Biosci. Eng. 2022, 19, 10915–10940. [Google Scholar] [CrossRef]
  45. Xi, J.; Wang, J.; Si, X.A.; Dong, H. Direct numerical simulations and acoustic analyses of flapping-uvula-induced flow evolutions within normal and constricted pharynx. Theor. Comput. Fluid Dyn. 2022. in review. [Google Scholar]
  46. Xi, J.; Wang, Z.; Talaat, K.; Glide-Hurst, C.; Dong, H. Numerical study of dynamic glottis and tidal breathing on respiratory sounds in a human upper airway model. Sleep Breath 2017, 22, 463–479. [Google Scholar] [CrossRef] [PubMed]
  47. Subbu, A.; Ray, A. Space Partitioning via Hilbert Transform for Symbolic Time Series Analysis. Appl. Phys. Lett. 2008, 92, 084107. [Google Scholar] [CrossRef]
  48. Jubran, B.A.; Hamdan, M.N.; Shabanneh, N.H.; Szepessy, S. Wavelet and chaos analysis of irregularities of vortex shedding. Mech. Res. Commun. 1998, 25, 583–591. [Google Scholar] [CrossRef]
  49. Grossmann, A.; Morlet, J. Decomposition of hardy functions into square integrable wavelets of constant shape. SIAM J. Math. Anal. 1984, 15, 723–736. [Google Scholar] [CrossRef] [Green Version]
  50. Honda, K. Physiological processes of speech production. In Handbook of Speech Processing; Benesty, J., Sondhi, M.M., Huang, Y., Eds.; Springer: Berlin/Heidelberg, Germany, 2008; pp. 7–26. [Google Scholar]
  51. Khosla, S.; Murugappan, S.; Gutmark, E. What can vortices tell us about vocal fold vibration and voice production. Curr. Opin. Otolaryngol. Head Neck Surg. 2008, 16, 183–187. [Google Scholar] [CrossRef] [PubMed]
  52. Jiang, J.J.; Zhang, Y.; McGilligan, C. Chaos in voice, from modeling to measurement. J. Voice Off. J. Voice Found. 2006, 20, 2–17. [Google Scholar] [CrossRef] [PubMed]
  53. Khosla, S.; Murugappan, S.; Paniello, R.; Ying, J.; Gutmark, E. Role of vortices in voice production: Normal versus asymmetric tension. Laryngoscope 2009, 119, 216–221. [Google Scholar] [CrossRef]
  54. Farbos de Luzan, C.; Oren, L.; Gutmark, E.; Khosla, S. Effects of vocal tract inertance on the glottal flow. J. Acoust. Soc. Am. 2016, 140, 3331. [Google Scholar] [CrossRef]
  55. Orlikoff, R.F.; Golla, M.E.; Deliyski, D.D. Analysis of longitudinal phase differences in vocal-fold vibration using synchronous high-speed videoendoscopy and electroglottography. J. Voice Off. J. Voice Found. 2012, 26, e813–e820. [Google Scholar] [CrossRef] [Green Version]
  56. Drioli, C.; Aichinger, P. Modelling sagittal and vertical phase differences in a lumped and distributed elements vocal fold model. Biomed. Signal Process. Control. 2021, 64, 102309. [Google Scholar] [CrossRef]
  57. Zhang, Z. Vibration in a self-oscillating vocal fold model with left-right asymmetry in body-layer stiffness. J. Acoust. Soc. Am. 2010, 128, EL279–EL285. [Google Scholar] [CrossRef] [PubMed]
  58. Kimura, M.; Chan, R.W. Viscoelastic properties of human aryepiglottic fold and ventricular fold tissues at phonatory frequencies. Laryngoscope 2018, 128, E296–E301. [Google Scholar] [CrossRef]
  59. Wang, J.; Xi, J.; Han, P.; Wongwiset, N.; Pontius, J.; Dong, H. Computational analysis of a flapping uvula on aerodynamics and pharyngeal wall collapsibility in sleep apnea. J. Biomech. 2019, 94, 88–98. [Google Scholar] [CrossRef]
  60. Xi, J.; Wang, J.; Si, X.A.; Zheng, S.; Donepudi, R.; Dong, H. Extracting signature responses from respiratory flows: Low-dimensional analyses on Direct Numerical Simulation-predicted wakes of a flapping uvula. Int. J. Numer. Meth. Biomed. Eng. 2020, 36, e3406. [Google Scholar] [CrossRef]
  61. Xue, Q.; Mittal, R.; Zheng, X.; Bielamowicz, S. A computational study of the effect of vocal-fold asymmetry on phonation. J. Acoust. Soc. Am. 2010, 128, 818–827. [Google Scholar] [CrossRef] [Green Version]
  62. de Vries, M.P.; Schutte, H.K.; Veldman, A.E.; Verkerke, G.J. Glottal flow through a two-mass model: Comparison of Navier-Stokes solutions with simplified models. J. Acoust. Soc. Am. 2002, 111, 1847–1853. [Google Scholar] [CrossRef] [PubMed]
  63. Eysholdt, U.; Rosanowski, F.; Hoppe, U. Vocal fold vibration irregularities caused by different types of laryngeal asymmetry. Eur. Arch. Otorhinolaryngol. 2003, 260, 412–417. [Google Scholar] [CrossRef]
  64. Ibrahim, W.H.; Gheriani, H.A.; Almohamed, A.A.; Raza, T. Paradoxical vocal cord motion disorder: Past, present and future. Postgrad. Med. J. 2007, 83, 164–172. [Google Scholar] [CrossRef] [Green Version]
  65. Sadeghi, H.; Döllinger, M.; Kaltenbacher, M.; Kniesburges, S. Aerodynamic impact of the ventricular folds in computational larynx models. J. Acoust. Soc. Am. 2019, 145, 2376. [Google Scholar] [CrossRef]
  66. Birk, V.; Sutor, A.; Döllinger, M.; Bohr, C.; Kniesburges, S. Acoustic impact of ventricular folds on phonation studied in ex vivo human larynx models. Acta Acust. United Acust. 2016, 102, 244–256. [Google Scholar] [CrossRef]
  67. Schoder, S.; Maurerlehner, P.; Wurzinger, A.; Hauser, A.; Falk, S.; Kniesburges, S.; Döllinger, M.; Kaltenbacher, M. Aeroacoustic sound source characterization of the human voice production-perturbed convective wave equation. Appl. Sci. 2021, 11, 2614. [Google Scholar] [CrossRef]
Figure 1. Computational airway model and validation against in vitro experiments: (a) Upper respiratory airway model with a rhythmically contracting/expanding glottis, (b) model validation against the experimental measurement of pressure in the airway cast with three glottal apertures.
Acoustics 04 00056 g001
Figure 2. Respiratory flow dynamics in the upper airway with different glottal vibration frequencies (f0): (a) 10 Hz, (b) 20 Hz, (c) 50 Hz, and (d) 200 Hz.
Acoustics 04 00056 g002
Figure 3. Flow evolution during a glottal vibration cycle at f0 = 200 Hz: (a) contraction, (b) expansion, and (c) time evolution of the flow rate at different slices in comparison to the sinusoidal waveform. There was a phase advance of the flow during expansion and a phase lag during contraction relative to the glottal sinusoidal waveform.
Acoustics 04 00056 g003
Figure 4. Dynamics of glottal flow at different vibration frequencies: (a) glottal flow rate increases with the vibration frequency, and (b) normalized glottal flow rate relative to the frequency.
Acoustics 04 00056 g004
Figure 5. Pressure forces acting on the glottal walls: (a) diagram of the normal forces acting on the right and left lateral walls, (b) the pressure force in the first and third quartiles of a vibration cycle facilitates the glottis motion (self-sustaining), while that in the second and third quartiles work against the motion (anti-self-sustaining). (c) The pressure force has a nonlinear relationship with the vibration frequency (f0 1.85).
Acoustics 04 00056 g005
Figure 6. Shear forces acting on the glottal walls: (a) the variation in the shear force acting on the glottal walls in one vibration cycle, with the shear force visualized at three instants (arrows) of the 200 Hz case. The shear force, τ does not obey a continuous relationship with the glottal vibration frequency, (b) with a very weak τ dependence on f when f ≤ 50 Hz (f0 0.1) and (c) a much higher dependence on f0 when f ≥ 100 Hz (f0 0.14).
Acoustics 04 00056 g006
Figure 7. Pressure signals (blue line) at 0.3 m from the mouth opening computed using the FW-H model: (a) 10 Hz, (b) 20 Hz, (c) 50 Hz, (d) 100 Hz, (e) 200 Hz, and (f) 500 Hz. The red line is the sinusoidal motion of the glottis.
Acoustics 04 00056 g007
Figure 8. Phase space based on Hilbert transform of the sound signals at 0.3 m from the mouth opening with different glottal vibration frequencies: (a) 10 Hz, (b) 20 Hz, (c) 50 Hz, (d) 100 Hz, (e) 200 Hz, and (f) 500 Hz. The red ellipse in (a) is the sinusoidal waveform.
Acoustics 04 00056 g008
Figure 9. Multifractal analyses of the pressure signals for varying glottal vibration frequencies: (a) multifractal spectrum and (b) distribution of scaling exponents.
Acoustics 04 00056 g009
Figure 10. Waterfall spectrogram of the sound pressure signals at different glottal vibration frequencies: (a) 10 Hz, (b) 20 Hz, (c) 50Hz, and (d) 100 Hz.
Acoustics 04 00056 g010
Figure 11. Sound pressure level (SPL) of the pressure signals at different glottal vibration frequencies: (a) 10 Hz, (b) 20 Hz, (c) 50 Hz, (d) 100 Hz, (e) 200 Hz, and (f) 500 Hz.
Acoustics 04 00056 g011
Figure 12. Sound pressure level (upper panel) and power spectral density (lower panel) in the low-frequency range at different glottal vibration frequencies: (a) 20 Hz, (b) 100 Hz, and (c) 500 Hz.
Acoustics 04 00056 g012
Figure 13. A-weighted sound power level (unit: dBA) of the sound signals generated at different glottal vibration frequencies at (a) normal scale and (b) logarithmical scale.
Acoustics 04 00056 g013
Figure 14. Frequency localization of the acoustic signals generated at the glottal vibration frequency of 20 Hz: f-localized signals that are 2, 3, and 4 times that of the forcing frequency at (a) normal scale and (b) logarithmical scale, and those that are 50, 100, and 200 times that of the forcing frequency at (c) normal and (d) logarithmical scale. The amplitude of the first harmonic (f/f0 = 2) is higher than all other f-localized signals.
Acoustics 04 00056 g014
Figure 15. Responses of the glottal flow rate and intra-glottal pressure (Pg) to one cycle of the glottal vibration at f0 = 200 Hz.
Acoustics 04 00056 g015
Publisher’s Note: MDPI stays neutral with regard to jurisdictional claims in published maps and institutional affiliations.

