Article

Numerical Analysis of the Main Wave Propagation Characteristics in a Steel-CFRP Laminate Including Model Order Reduction

by
Andrey Mikhaylenko
1,
Natalie Rauter
1,*,
Nanda Kishore Bellam Muralidhar
2,
Tilmann Barth
1,
Dirk A. Lorenz
2 and
Rolf Lammering
1
1
Institute of Mechanics, Helmut-Schmidt-University/University of the Federal Armed Forces Hamburg, Holstenhofweg 85, 22043 Hamburg, Germany
2
Institute of Analysis and Algebra, Technische Universität Braunschweig, Universitätsplatz 2, 38106 Braunschweig, Germany
*
Author to whom correspondence should be addressed.
Acoustics 2022, 4(3), 517-537; https://doi.org/10.3390/acoustics4030032
Submission received: 1 June 2022 / Revised: 15 June 2022 / Accepted: 22 June 2022 / Published: 25 June 2022

Abstract

:
Guided ultrasonic waves are suitable for use in the context of structural health monitoring of thin-walled, plate-like structures. Hence, observing the wave propagation in the plates can provide an indication of whether damage has occurred in the structure. In this work, the wave propagation in fiber metal laminate consisting of thin steel foils and layers of carbon fiber-reinforced polymer is studied, focusing on the main propagation characteristics like dispersion diagrams and displacement fields. For this purpose, the dispersion diagrams derived from the analytical framework and numerical simulations are first determined and compared to each other. Next, the displacement fields are computed using the global matrix method for two excitation frequencies. The results derived from the analytical framework is used to validate the numerically determined displacement fields based on a 2D and a 3D modeling approach. For both investigations the results of the analytical treatment and the numerical simulation show good agreement. Furthermore, the displacement field reveals the typical and well-known characteristics of the propagation of guided waves in thin-walled structures. Since the use of full 3D models involves a very high computational cost, this work also successfully investigates the possibility for model order reduction to decrease the computational time and costs of the simulation without the loss of accuracy.

1. Introduction

It is only natural that the use of structures made of different materials is automatically associated with the fact that the defects in the material occur at different life cycles of these structures. Furthermore, not every defect is easily detectable by means of visual inspection. This is especially the case when dealing with composite materials and layered structures, which are increasingly being used in the aeronautical industry. One recent approach in the development of composite materials are fiber metal laminates (FML). They are of great interest because they combine the advantages of high ductility, often found in metals, with the high specific stiffness of fiber-reinforced polymers (FRP) [1,2]. However, this comes with the high risk of low-velocity impact induced internal damage like delaminations [3,4]. Therefore, it is of great importance to detect such hidden defects to ensure a safe operation of the component.
One technique here is the use of guided ultrasonic wave (GUW) based structural health monitoring (SHM) [5,6], which has been profoundly analyzed over the last decades for isotropic materials as well as thin-walled structures made from FRP. In both cases the stiffness and density are constant over the thickness. The complex multi-modal nature of Lamb waves, first described by Horace Lamb [7], derived by the solution of the analytical framework is discussed in Refs. [8,9,10,11] for isotropic materials. The adaption to single transversely-isotropic layers, orthotropic layers, and layered structures is provided in Refs. [12,13,14,15]. Since GUW propagation is not only of multi-modal nature but also strongly dispersive, the phase and group velocities are a function of the frequency [6]. A common way to depict the propagation characteristics are dispersion diagrams.
Besides their dispersive nature, the displacement fields are of great interest, because they are crucial for the interaction of the propagating wave with damage hidden in the structure. The displacement fields of different propagating modes are discussed in Refs. [5,11] for isotropic materials and [16,17] for wave guides made of FRP. It is shown that the constant material properties over the thickness lead to a displacement field covering the whole thickness of the component without a phase shift between the upper and lower surface. In contrast to these findings, the wave propagation in sandwich structures behaves significantly different [18]. It is shown that the impedance differences between the layers in sandwich structures lead to frequency-dependent wave propagation phenomena. Until a certain wavelength to thickness ratio is reached, the so called global Lamb waves propagate acting like the well-known Lamb wave propagation by covering the whole thickness without a phase shift [19,20]. This changes when the frequency is increased and hence, the wave length to thickness ratio passes a threshold value. In this case one speaks of true modes [21,22] propagating in the skin layers only and leaky Lamb waves [21]. In this case, large attenuation occurs due to waves propagating in the thickness direction, causing an energy dissipation into the core. It is shown in Ref. [23], that the leakage effect is strongly affected by geometry and acoustic impedance as well as wave mode and frequency. For more details about the leakage effects, the reader is kindly referred to [20,22,23,24].
Due to the high impedance changes between the metal and FRP perpendicular to the fiber orientation, this might also be an issue for the wave propagation in FML. First investigations reveal that in structures formed of aluminum and glass fiber-reinforced polymer (GFRP) layers, the wave propagation meets the framework of GUW in thin-walled structures [25,26,27,28]. However, no further material combination is analyzed. In this work, the approach is extended to FML consisting of carbon fiber-reinforced polymers (CFRP) paired with thin steel foils. In contrast to aluminum-GFRP, which has a stiffness ratio of approximately 15, steel CFRP exhibits a stiffness ratio of up to 20 with respect to the Young’s modulus. Based on the shear modulus, the ratios are 10 and 15, respectively. Therefore, the first objective of this work presented here is the analysis of the wave propagation characteristics in FML consisting of steel and CFRP layers by solving the analytical framework with respect to the well-known boundary conditions for the GUW propagation in thin-walled structures and numerical simulations. Subsequently, dispersion diagrams and the displacement field are obtained based on the analytical framework and numerical simulations before comparing the results.
The numerical models are used to calculate displacement fields in the wave propagation direction of the GUW’s and in the thickness direction. Interlayer boundary conditions were considered by the use of the global matrix method [17,29]. The method used here for numerical determination of dispersion diagrams has been successfully applied in the evaluation of experimental data [30,31]. It is based on the evaluation of displacement fields along the wave propagation direction using a discrete 2D Fourier transform [32] and specially tuned excitation signals. Similar evaluations can also be found in Refs. [33,34,35].
To profoundly understand the propagation of GUW in the FML as well as to quantify the uncertainties of the material properties, it is required to solve the forward model several times with input parameter variations. As the multiple queries of the underlying high-fidelity system is associated with high computational cost, it is of great interest to investigate whether an order reduction of the numerical models can significantly reduce the computational effort. Model order reduction (MOR) seeks to swiftly capture the essential features of a higher order complex dynamical system by approximating it to a lower dimension without losing the accuracy of the system response. Depending on the nature of the system, reduced order modeling can be accomplished by any of the existing techniques that are classified into Krylov and singular value decomposition (SVD) methods [36]. The former methods are based on iterative approaches while the latter depends on the idea of expanding the high-dimensional solution into a sequence of orthonormal basis functions, describing the most important features of spatial and temporal variation of the state of the system. One of the most renowned techniques in SVD methods is the proper orthogonal decomposition (POD) method [37]. The POD method has been successfully applied in several fields like geophysical fluid dynamics [38,39,40], meteorology, signal analysis, and pattern recognition [41,42]. Based on this, the second objective of the work is the application of POD based MOR on the wave propagation in undamaged FML to analyze the possibility of runtime reduction.
Following these two objectives presented above, Section 2 deals with the analytical framework of GUW in thin-walled structures. In Section 3, we define the material and models that are used in Section 4 and Section 5 to analyze the main wave propagation characteristics of GUW in FML. Subsequently, Section 6 covers the application of MOR on the wave propagation in undamaged FML. Finally, Section 7 gives a summary and conclusion of the presented work.

2. Analytical Dispersion Relation in Fiber Metal Laminates

This section covers the analytical framework of GUW in layered structures. Hence, it first gives a brief description of the dispersion relation of transversely-isotropic layers and then a description of the layered structures. This is followed by the computation of displacement fields.

2.1. Dispersion Relation of a Single Layer

This work focuses on GUW in FML consisting of thin steel foils and CFRP layers. Since the analysis is limited to the wave propagation in fiber direction and perpendicular to it, it is sufficient to assume transversely-isotropic material symmetry. For this case, a detailed implementation can be found in Refs. [17,29,43]. The analytical consideration of the dynamic behavior of a solid is provided by the balance of momentum
div σ + ρ b = ρ u ¨ .
here, σ is the Cauchy stress tensor, ρ is the density, b are the volume forces, u represents the displacement field, and the dots indicate the second derivative with respect to the time. Furthermore, to derive the equation of motion, linear strains are considered
E = 1 2 ( grad u + grad T u ) ,
and the material behavior is described by Hooke’s law
σ = C : E .
In Equations (2) and (3), E denotes the linear Green Lagrange strain tensor and C is the elasticity tensor. Substituting the linear strain and Hooke’s law into Equation (1) and neglecting the volume forces yields
div ( C : grad u ) = ρ u ¨ .
To solve Equation (4), a plane harmonic approach is used for the displacement field given by
u = U 0 e i ( k j x j ω t ) ,
where k j is the wavenumber vector, the angular frequency is given by ω = k c p , c p is the phase velocity, and t stands for the time. Without loss of generality the wave propagation can be described in the x 1 x 3 plane, with x 3 being perpendicular to the plate surface, see Figure 1. In this case, the wavenumber vector is k j = k x ( 1 , 0 , α ) T = k n j . Introducing the harmonic approach in Equation (5) with the angular frequency and the provided wavenumber definition into the equation of motion in Equation (4) leads to
Λ i l p l = ( δ i l ρ c p 2 λ i l ) p l = 0 ,
with
λ i l = C i j k l n k n j ,
which is also known as the Christoffel equation [6]. Here, p l is the polarization vector, holding the information about the particle motion direction, and δ i l is the Kronecker-delta. In the case of isotropic and transversely-isotropic material behavior, the displacement fields of Lamb and shear horizontal waves are decoupled, which is indicated by the separation of the Christoffel equation into two independent systems of equations. Here, the analysis based on the existence of Lamb waves in FML is of interest. Therefore, we focus on the description in the x 1 x 3 plane. To obtain the non-trivial solution the determinant of the matrix Λ i l must be equal to zero
det ( δ i l ρ c p 2 λ i l ) = 0 .
This condition leads to a biquadratic equation for Lamb waves providing solutions for the parameter α
α 1 L = α 3 L , α 2 L = α 4 L .
Each individual solution of α corresponds to a partial wave. In order to describe the propagation of Lamb waves accurately, all these partial waves must be superimposed. Thus, the displacement field of Lamb waves is described by the following equations
u 1 = e i ( k x 1 ω t ) j = 1 4 U 0 j e i k α j L x 3 = e i ( k x 1 ω t ) U 1 ( x 3 ) ,
and
u 3 = e i ( k x 1 ω t ) j = 1 4 S j U 0 j e i k α j L x 3 = e i ( k x 1 ω t ) U 3 ( x 3 ) ,
where S j = ρ c p 2 C 11 C 55 ( α j L ) 2 ( C 55 + C 12 ) α j L .
By combining Equations (10) and (11) with (4), we get the following expressions describing the stress components result
σ 33 = i k e i ( k x 1 ω t ) j = 1 4 U 0 j H 1 j e i k α j L x 3 ,
σ 13 = i k e i ( k x 1 ω t ) j = 1 4 S j U 0 j H 3 j e i k α j L x 3 .
Here, H 1 j and H 3 j are defined as follows
H 1 j = C 13 + C 33 S j α j L ,
H 3 j = C 55 ( α j L + S j ) .
Finally, the dispersion relation is determined by assuming stress-free boundary conditions at the top and bottom surfaces of the plate. Summarizing the solution in matrix form yields
u 1 u 3 σ 33 σ 13 = e i ( k x 1 ω t ) 1 1 1 1 S 1 S 2 S 1 S 2 H 11 H 12 H 11 H 12 H 31 H 32 H 31 H 32 U 0 1 e i k α 1 L x 3 U 0 2 e i k α 2 L x 3 U 0 3 e i k α 3 L x 3 U 0 4 e i k α 4 L x 3 ,
with σ 33 = σ 33 i k , σ 13 = σ 13 i k . It is also often given in compact form
U UD = G UD H UD U 0 UD e i ( k x 1 ω t ) .
Here the abbreviation UD stands for a unidirectional layer. The detailed consideration of the solution of the dispersion relation is described and discussed in Refs. [17,29].

2.2. Wave Propagation in Layered Structures

In this work, the dispersion relation for a layered plate is established utilizing the global matrix method [17,29]. In this method, a continuity condition for the stresses and displacements at the layer boundaries is introduced to describe the wave propagation in a layered structure. This condition is expressed by
U n + = U n 1 ,
where “+” indicates an association with the top edge and “−” with the bottom edge of the layer, respectively. For materials with a symmetric stacking sequence, it is possible to formulate separate dispersion relations for the symmetric and antisymmetric wave mode, respectively. Therefore, only one half of the plate is described, which enables one to introduce new boundary conditions at the symmetry plane. For the symmetric wave modes the boundary conditions at the symmetry plane are given by
u 3 = 0 and σ 23 = σ 13 = 0 .
For the antisymmetric wave modes, the boundary conditions read
u 1 = u 2 = 0 and σ 33 = 0 .
With these boundary conditions and the continuity condition, the following expression for the symmetric wave modes is obtained
[ G N H N + ] 2 , 4 0 G N H N G N 1 H N 1 + 0 G n + 1 H n + 1 G n H n + 0 G 2 H 2 G 1 H 1 + 0 [ G 1 H 1 ] 3 , 4 = 0 .
In the formulation of the dispersion relation of the antisymmetric modes, the indices in the symmetry plane are changed from 2 and 4 to 1 and 3 in Equation (21).

2.3. Displacement Fields

For each solution of the dispersion relation characterized by a frequency–phase velocity pair, the corresponding displacement field can be calculated by inserting the solution into the provided framework to determine the still missing amplitude. For this, the vector U 0 in Equation (5) is split into the amplitude A and the polarization vector p . In order to be able to determine the displacement field, first these two still unknown quantities are calculated. This is done by introducing the phase velocities, which is a solution of Equation (21), into Equation (6). The result is an eigenvalue problem. Hence, the eigenmodes are arbitrarily scalable. Therefore, to be able to determine the polarization vector, the component p 1 of the polarization vector is set to 1.
After the polarization vector is known, the last unknown quantity, the amplitude A of the displacement field is obtained by solving GHU 0 = 0 . Again, one component is arbitrary. Following this procedure, the system of equations for the determination of the amplitude is given by
[ G N H N + ] 2 , 4 0 G N H N G N 1 H N 1 + 0 G n + 1 H n + 1 G n H n + 0 G 2 H 2 G 1 H 1 + 0 [ G 1 H 1 ] 3 , 4 A 1 A n = 0 .
The displacement field is finally obtained by introducing the polarization vector and the amplitude components into Equation (10). By doing so, the displacement field, which is of complex nature, can be derived at a certain position and a defined point in time. The real-valued solution is given by
u ( x 1 , x 3 , t ) = Re ( U ( x 3 ) ) cos ( w t k x 1 ) + Im ( U ( x 3 ) ) sin ( w t k x 1 ) .

3. Material and Model Definition

In this section, the numerical models are defined, which are used in this work for the analysis of the main wave propagation characteristics in FML. The section covers the specimen’s layout and the numerical models used to compute dispersion diagrams and displacement fields, respectively. Furthermore, a model order reduction method is applied to the numerical model.

3.1. Material Layout

The FML plate analyzed here combines CFRP layers with thin steel foils. The stacking sequence is [ steel / 0 4 / steel / 0 2 ] s , where the steel layers have a thickness of 0.12   m m each and the CFRP layers of 0.125   m m each. Thus, the total thickness of the plate is 1.98   m m . The material layout is depicted in Figure 1, including a coordinate system definition that is valid for all simulations. The x 1 -axis coincides with the fiber orientation, the x 2 -axis is perpendicular to it, and the x 3 -axis indicates the thickness direction of the specimen.
The corresponding material properties of the two constituents that are used throughout this work are provided in Table 1.

3.2. Model Definition

The numerical simulations provided in this work cover the determination of dispersion diagrams and displacement fields. Furthermore, a model order reduction algorithm is applied. All investigations are based on a two-dimensional model in two different directions, one coincides with the fiber direction, the second is perpendicular to it. Hence, the numerical model in fiber direction represents the x 1 x 3 -cross section defined in Figure 1. Vice versa, the x 2 x 3 plane is used to analyze the wave propagation perpendicular to the fiber orientation.
In addition to these simulations, the displacement field is also computed based on a full three-dimensional representation of the FML laminate to investigate any influences induced by the reduction from 3D to a 2D modeling approach.

4. Analysis of the Dispersion Diagram

This section covers the analysis of the dispersion diagram derived from the theoretical framework provided in Section 2 and computed by numerical simulations. The results are compared and discussed.

4.1. Analytical Treatment

There is no closed solution of the analytical framework provided in Section 2. Hence, to obtain the frequency-phase velocity pairs that fulfill the dispersion relation in Equation (21), numerical algorithms are used. In this case, the dispersion relation is solved by an iterative approach incorporating the bisection procedure up to a frequency of 250 k Hz . Furthermore, only the fundamental S 0 and A 0 wave mode are of interest.

4.2. Numerical Simulations

In order to derive the dispersion diagrams from the numerical data, a method of the authors is used, which has already been successfully applied in the evaluation of experimental data [30,31]. The method is based on the evaluation of the displacement fields along the propagation direction of the waves, seen in Equation (10), using a discrete 2D-DFT [32]. Thereby, the property that the propagating part of the displacement field behaves sinusoidal in both time and spatial domain [10] is exploited. Similar evaluation methods can also be found in Refs. [33,34,35]. By transferring the data into the frequency-wavenumber domain, a separation of the multifrequency signal components succeeds. Frequency-wavenumber pairs can be detected for each frequency, which describe the dispersion relations of the individual modes over the course of the frequency range.
The numerical simulations are performed using the finite element method within the commercial software COMSOL Multiphysics®. The two-dimensional numerical model and the corresponding boundary conditions used are depicted in Figure 2. The total length of the model is 1 m and the discretization is realized by second-order Lagrangian elements under plane strain assumption. Subsequently, a structured mesh of rectangular elements with quadratic shape functions is generated. For the excitation of the wave field, a multifrequency signal is used, see Ref. [31]. It is tuned to be able to generate dispersion diagrams over a predefined frequency range and hence, to avoid multiple simulations. The same signal is used for both directions, covering a frequency range from 25 k Hz to 245 k Hz in the steps of 10 k Hz . The signal is applied by a force boundary condition at a distance of 4 m m from the left edge at the upper surface of the plate. Subsequently, both fundamental A 0 - and S 0 -modes are excited. A mode-selective excitation is not necessary, because the evaluation is done at the center line of the plate. Due to the theoretical displacement field characteristics, the S 0 -mode shows only an in-plane displacement component at the center line, whereas the A 0 -mode is limited to an out-of-plane motion. Therefore, with the help of the displacement component u 1 the S 0 -mode and with the help of the component u 3 , the A 0 -mode can be evaluated separately. Details about the model size and the discretization are provided in Table 2.
To evaluate the required frequency range with the help of the 2D-DFT, the numerical model must fulfill requirements to the spatial and temporal resolution as well as simulation time and propagation distance. The choice of the model parameters ensures that the wave bodies can be clearly detected and the individual contained frequencies can be separated from each other during the evaluation. The specific model parameters are shown in Table 2.

4.3. Results and Comparison

In this subsection, the dispersion curves of GUW in FML are compared, which are obtained firstly from analyses based on the analytical framework and secondly, from finite element simulations. The corresponding results are collected in two diagrams, one holding the information of the phase velocity-frequency pairs for the wave propagation in fiber direction, see Figure 3, left, and the other one for the wave propagation perpendicular to the fiber direction (right).
In addition, Figure 4 gives the deviations between the results of the analytical and numerical approach. The comparison shows that the maximum deviation of the phase velocity is about 0.6%. Thus, the results prove that the numerical and analytical models provide almost identical results for the dispersion behavior over a larger frequency range. This agreement is valid for the fiber direction as well as perpendicular to it.
The dispersion diagrams reveal that the propagation of GUW in FML is still of multi-modal and dispersive nature. At least two modes are generated even at low frequencies. While the fundamental symmetric mode ( S 0 ) shows almost a constant phase velocity over the frequency range of up to 250 k Hz , the phase velocity of the fundamental antisymmetric mode ( A 0 ) increases with increasing frequency. This meets the main characteristics of the wave propagation behavior in unidirectional composite [6]. In addition to this, the phase velocity of the S 0 -mode in the fiber direction is much higher than perpendicular to it. This is also observed for the wave propagation in FRP and can be assigned to the lower Young’s modulus of the CFPR layer perpendicular to the fiber orientation.

5. Displacement Field Analysis

The analysis of the displacement field again comprises the solution of the analytical framework and two-dimensional numerical simulations. Furthermore, full 3D simulations are conducted to analyze the effect of the domain reduction on the numerical solution. The analysis focuses on a frequency of 120 k Hz . In addition, although the dispersion plots in Figure 3 do not suggest significantly different findings, computations were performed at 80 k Hz . The results are shown in the Appendix A.

5.1. Analytical Treatment

Based on the solution of the dispersion relation at a frequency of 80 k Hz and 120 k Hz the analytical results are determined by evaluating the displacement field given in Equation (15). Since the calculation of the analytical displacement fields involves solving an eigenvalue problem, the normalized displacements are computed.

5.2. Numerical Simulations

For the numerical simulations, 2D and a 3D modeling approaches are utilized. The 2D model with the corresponding boundary conditions is shown in Figure 5. In comparison to the dispersion diagram investigation, this model has a length of 0.3   m and the displacement field over the thickness is extracted only at one position. Furthermore, at this point, a mode selective excitation is realized to be able to analyze the displacement fields of the fundamental A 0 and S 0 -mode separately. Therefore, the excitation is implemented by a five cycle Hanning windowed sine burst at the upper and lower left corner of the wave guide. For the generation of the A 0 -mode, the displacements at these two points is oriented in the same direction. In contrast to this, they point in opposite directions for the excitation of the S 0 -mode. The signal is captured at a distance of 0.1   m from the excitation point. Again the model is discretized with second-order Lagrange elements by assuming a plane strain state.
For the full 3D numerical simulations, only a quarter of the steel CFRP plate is modeled to reduce the computational cost. A schematic of the model is provided in Figure 6. The model reduction requires the introduction of the symmetry boundary conditions at the sides marked in gray. Beside the adaption to the third dimension, the modeling approach is not changed. All parameters of the models and simulations for the two cases are summarized in Table 3.

5.3. Results and Comparison

Since the calculation of the analytical displacement fields involves solving an eigenvalue problem, the normalized displacements are evaluated and compared. First, the results for the wave propagation in fiber orientation for a frequency of 120 k Hz are presented in Figure 7. Here, excellent agreement can be seen between the numerically and analytically determined results. In the first row the displacement fields for the symmetric wave mode are shown, where also the typical features of the displacement fields of the axial symmetry of the in-plane component (left) and the point symmetry for out-of-plane component (right) can be observed. The x-axis of the diagrams was strongly refined for the in-plane component in order to be able to represent the deviations. The second row shows the in-plane and out-of-plane components of the displacement field for the antisymmetric wave mode. Again, the already-known behavior of the displacement field can be seen. In contrast to the symmetric wave mode, the in-plane component is point symmetric and the out-of-plane component is axisymmetric.
Subsequently, Figure 8 shows the components of the displacement fields when considering the wave propagation perpendicular to the fiber orientation at 120 k Hz . Here, the typical features such as point symmetry and axis symmetry can again be observed. Among other things, the analytical and numerical results also agree excellently.
In order to quantify the small observable deviations between the solution of the analytical framework and the numerical simulations, Table 4 and Table 5 hold the mean error for each component and wave mode obtained by the 2D and 3D simulations at 120 k Hz . Following these results, a 2D modeling approach for the wave propagation in FML is still sufficient to capture the main wave propagation characteristics adequately. The results are also confirmed for the wave propagation at 80 k Hz . Here, Figure 9 holds the results for the displacement field of the S 0 -mode for the wave propagation perpendicular to the fiber orientation. All remaining results are summarized in Appendix A.

6. Parametric Model Order Reduction of Numerical Model

6.1. Fundamentals

We performed several numerical simulations in Section 4.2 and Section 5.2, by utilizing a finite element discretized undamped linear dynamic structural model as expressed in the following equation
M u ¨ + Ku = f .
Equation (24) follows from the balance of momentum in Equation (1) by applying variational calculus and subsequent discretization of the equilibrium in its weak form, where M ( θ ) R N × N denotes the global mass matrix, K ( θ ) R N × N represents the global stiffness matrix, f R N × m the load matrix, and u ( θ ) R N × m the displacement matrix. The vector θ D R N p contains N p parameters that define the system from parametric domain D and t [ 0 , t m a x ] is the time variable. The total number of degrees of freedom in the system is given by N and the number of discretized time steps is indicated by m. The adapted model order reduction method is as described in Ref. [44] and summarized below.
The projection of basis functions, using a projection matrix Φ ( θ ) R N × n with n < < N , from high-dimensional space R N allows the order reduction of the high-fidelity model to its lower dimensional space R n
u Φ u r , u ¨ Φ u ¨ r .
Substituting Equation (25) in Equation (24) and projecting them on the reduced order space results in the following equations
Φ T M Φ u ¨ r + Φ T K Φ u r = Φ T f , M r u ¨ r + K r u r = f r .
In Equation (26), M r , K r R n × n and f r R n × m denote the reduced system matrices. The projection matrix Φ can be obtained by the POD method. This involves the collection of observations from the HiFi model into a snapshot matrix Ψ ( θ )
Ψ = [ u ( θ , t 1 ) , u ( θ , t 2 ) , , u ( θ , t m ) ] , = [ u 1 , u 2 , , u m ] ,
and decomposing it by thin singular value decomposition method as follows:
Ψ = W Σ V T .
in Equation (28), the left and right-singular matrices are given by W ( θ ) = [ w 1 , w 2 , , w m ] R N × m and V , respectively. The right-singular matrix V serves no interest in this context, while the left-singular matrix W contains orthogonal basis functions also known as proper orthogonal models (POMs) of the system. The diagonal matrix Σ = d i a g ( σ 1 , σ 2 , , σ m ) R m × m contains singular values σ k k = 1 m with σ 1 σ 1 σ m > 0 . The relative energy measure Ξ , which is used to determine the number of most influential modes and its approximation error ε are obtained as follows
Ξ = k = 1 n σ k k = 1 m σ k , ε = k = n + 1 m σ k k = 1 m σ k .
As the projection matrix Φ = [ w 1 , w 2 , , w n ] R N × n is computed, the reduced order Equation (26) can be deduced and solved for u r and u ¨ r . Eventually, the solution for the HiFi system can be evaluated using Equation (25). The choice of the observations extracted in the snapshot matrix largely influence the accuracy of the reduced-order model. As the reduced-order models produced through this technique are based on a certain parameter, their application at off-design parameters often fails to accurately predict the solution. In other words, whenever the system parameters changes, the reduced order basis should be rebuilt again. This is practically intractable in inverse problem analysis wherein the system should be solved for several thousand times. Therefore, a more sophisticated robust reduced-order modeling technique that preserves the parametric dependence of the system has to be developed. PMOR methods precisely satisfy this requirement. PMOR involves the extraction of global proper orthogonal modes (POMs) that accurately define the behavior of the underlying system for any given parameter set within the parametric domain.
The parameterized elliptic and parabolic PDE models are well approximated by POD-based global reduced-order models. However, the PMOR of a wide range of hyperbolic problems with non-linearity and discontinuity still remain a challenge. Therefore, the researchers within the MOR community are intensively seeking methodologies to reduce the Kolmogorov n-width of the solution manifold [45,46]. Boncoraglio et al. [47] efficiently solved multidisciplinary design optimization problem, which blends both linear and nonlinear constraints in aerodynamics using projection-based MOR along with an active manifold. The authors utilized a deep convolutional autoencoder to discover the relevant active manifold for dimensionality reduction of a high-dimensional design parameter space. An efficient adaptive algorithm was implemented by Bui-Thanh et al. [48] to achieve MOR for design optimization of a heat conduction fin to determine appropriate sample points over a large input parametric space. Based on Refs. [49,50] McBane et al. proposed a component-wise reduced-order model to optimize the topology of a lattice-type structure [51]. Moreover, they simplified the model to increase the speedup of the optimization process. A space-time MOR method built on least-squares Petrov–Galerkin projection was presented by Kim et al. to solve linear dynamical systems [52]. The approach was well demonstrated on 2D diffusion and 2D convection diffusion problems. Further contributions on PMOR span across the domains of contact in multibody nonlinear dynamics [53], nonlinear fluid–structure interaction problems [54], uncertainty quantification [55,56], and contact mechanics [57].

6.2. Application

In this research work, a POD-based adaptive parametric model order reduction technique along with a surrogate model for estimating the error indicator, based on the work of Paul-Dubois-Taine et al. [58], was employed to produce the global POMs. The adaptive sampling of the parameters was achieved in a greedy sense, wherein the locally best solution in a particular iteration was sampled, assuming it to be the global optimal solution. The training phase resulted in global reduced-order basis, which could approximate the HiFi solution with a very high accuracy. A detailed description of the procedure along with its algorithms can be found in Ref. [44], wherein the authors have applied the proposed PMOR method to approximate the GUW propagation in FML containing a damage. In this paper, the analysis is restricted to the GUW propagation in an intact plate. Since the PMOR method employed in this research is a model-intrusive approach, the Newmark’s time integration technique is utilized to solve Equation (24). This required the excitation of the specimen to be applied in a force-controlled manner and the other boundary conditions are consistent with those from the study of the displacement fields on the 2D model. The discretization is realized by quadratic Lagrangian elements with a size of 0.5 mm in the length direction and one element over the thickness for each layer. The evaluation was performed at a distance of 57.5 mm from the excitation points in the center of the upper CFRP layer package.
The comparison plot of the out-of-plane displacement of FML over time obtained using the HiFi model and the reduced-order model, produced using the proposed method of adaptive PMOR approach with Galerkin projection, is shown in Figure 10. The displacement field was measured at 57.5 mm away from the left end of the laminate and 1.49 mm through the thickness from the bottom of the laminate.
It can be seen that a precise approximation of the solution was achieved by the reduced-order model. The global reduced-order basis has gathered 250 modes to attain this accuracy of approximation of GUW propagation in an intact FML. This numerical experiment was conducted on a 4-core Intel(R) Core(TM) i7-10510U CPU @ 1.80   G Hz processor with 16 GB RAM. Table 6 summarizes the computational costs of HiFi solution and its reduced-order solution. The application of a POD-based adaptive PMOR approach, which employed the surrogate model for estimating error indicators, resulted in a speedup factor of 45.72, corresponding to the setting mentioned in this research paper. This essential reduction of computation time affords an opportunity to conduct several parametric studies and analyze the GUW propagation in FML.

7. Conclusions

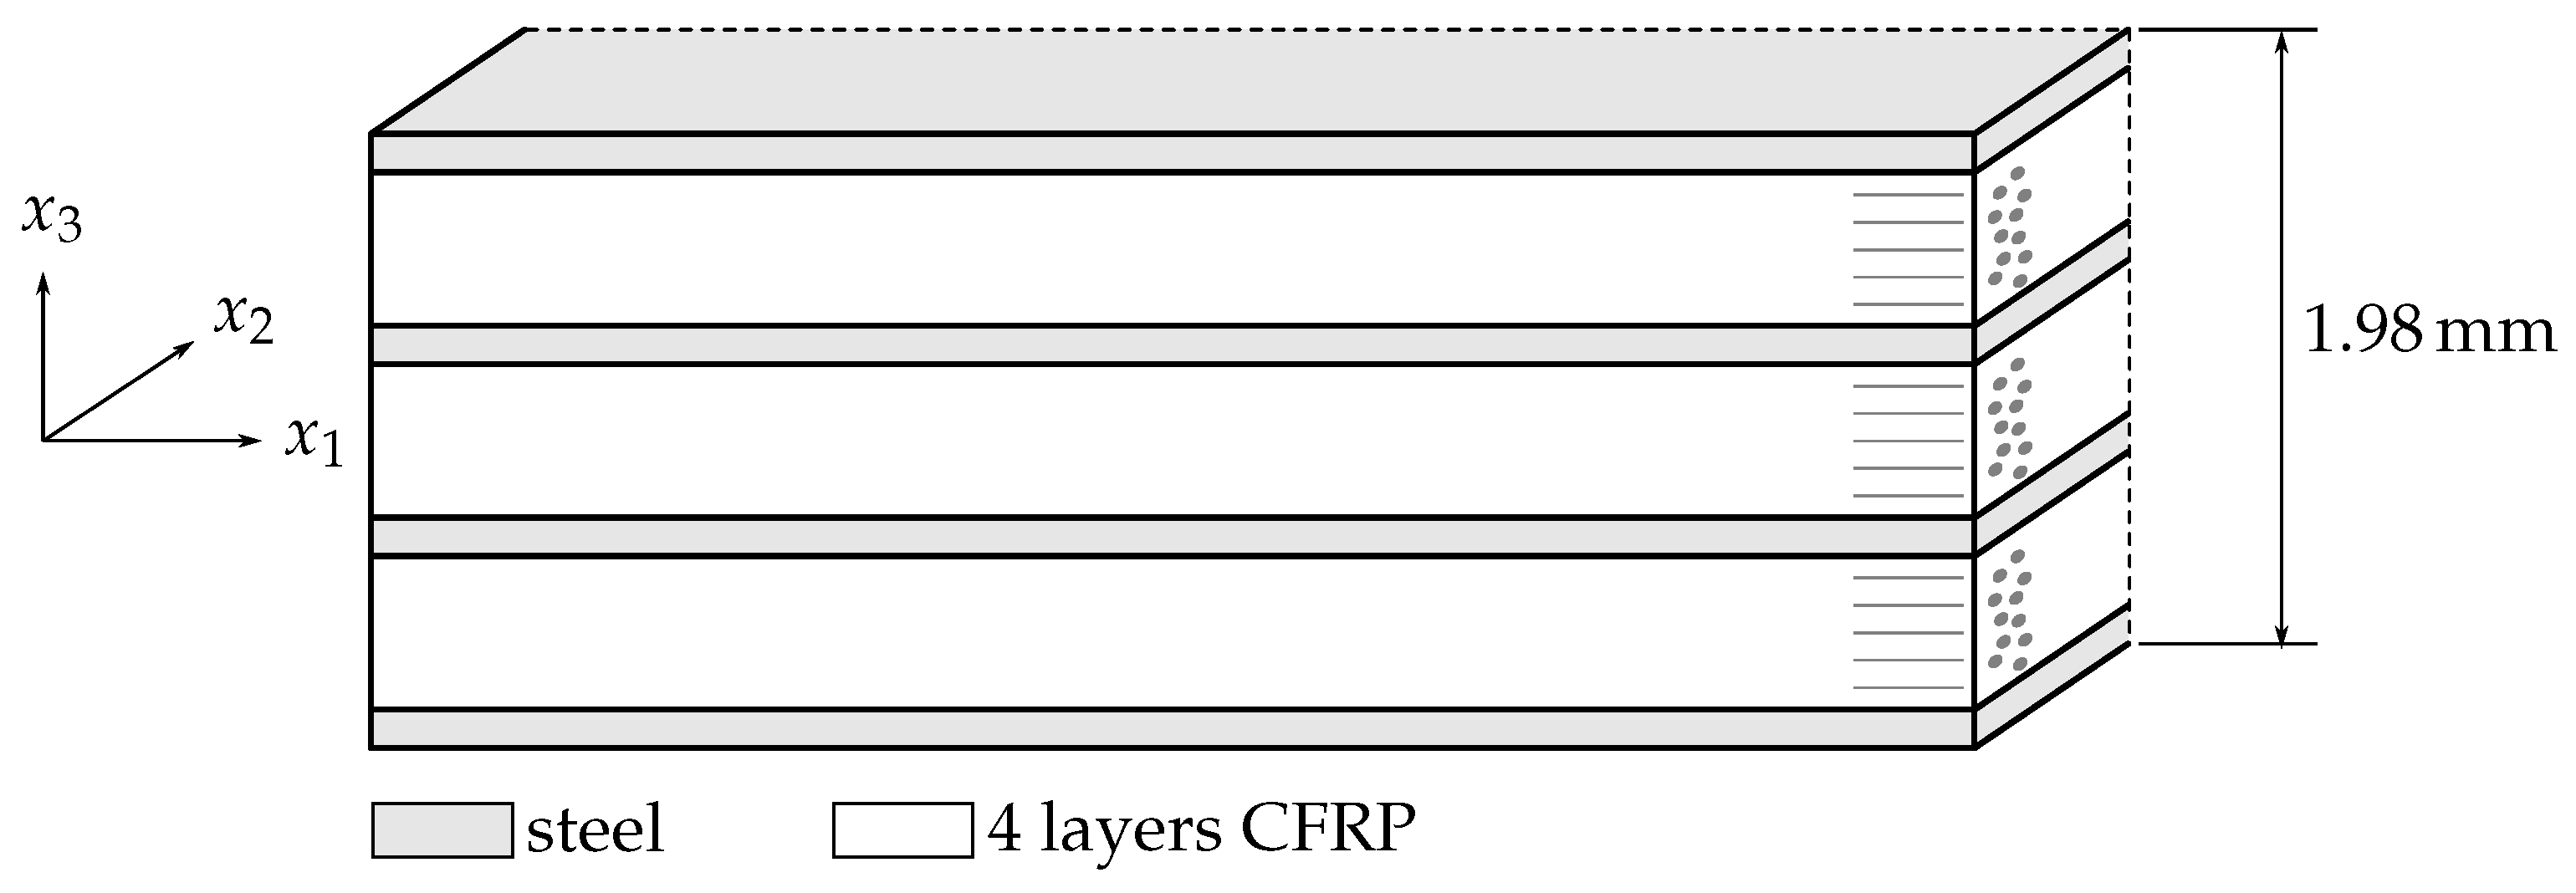
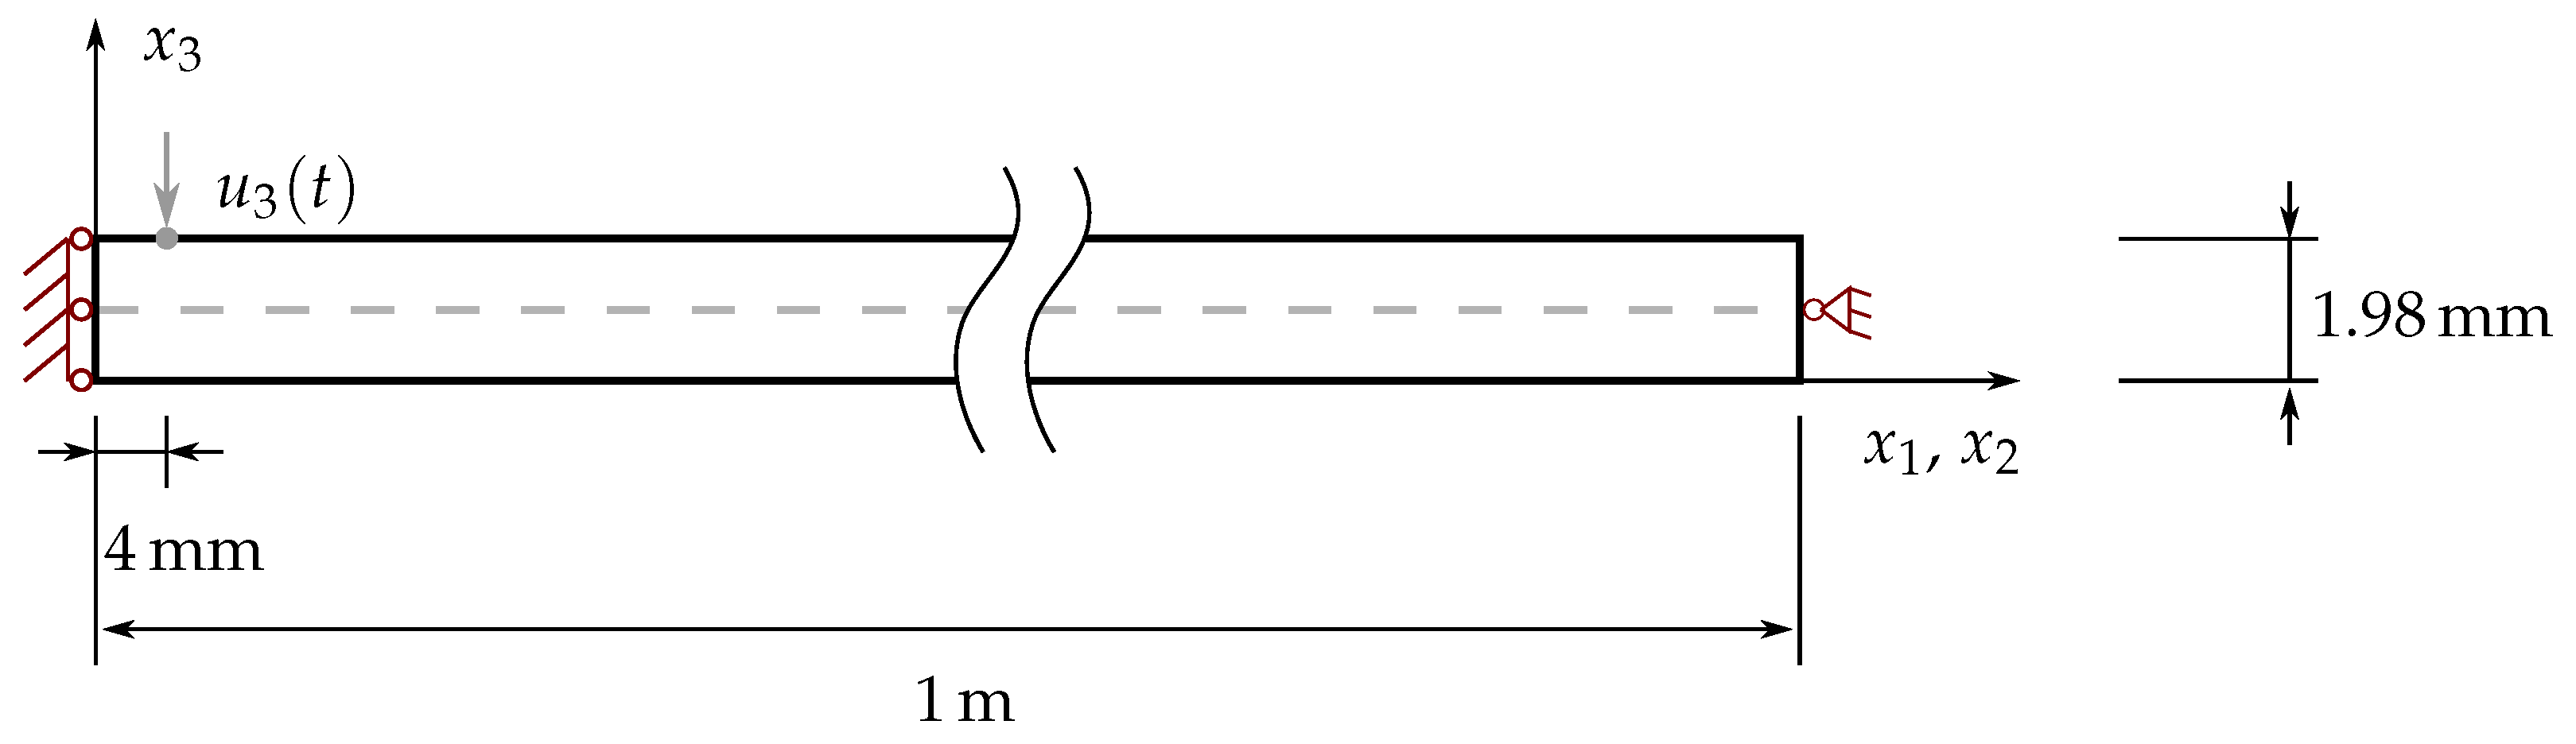
The investigations presented here are based on an FML plate with the stacking sequence [ steel / 0 4 / steel / 0 2 ] s 
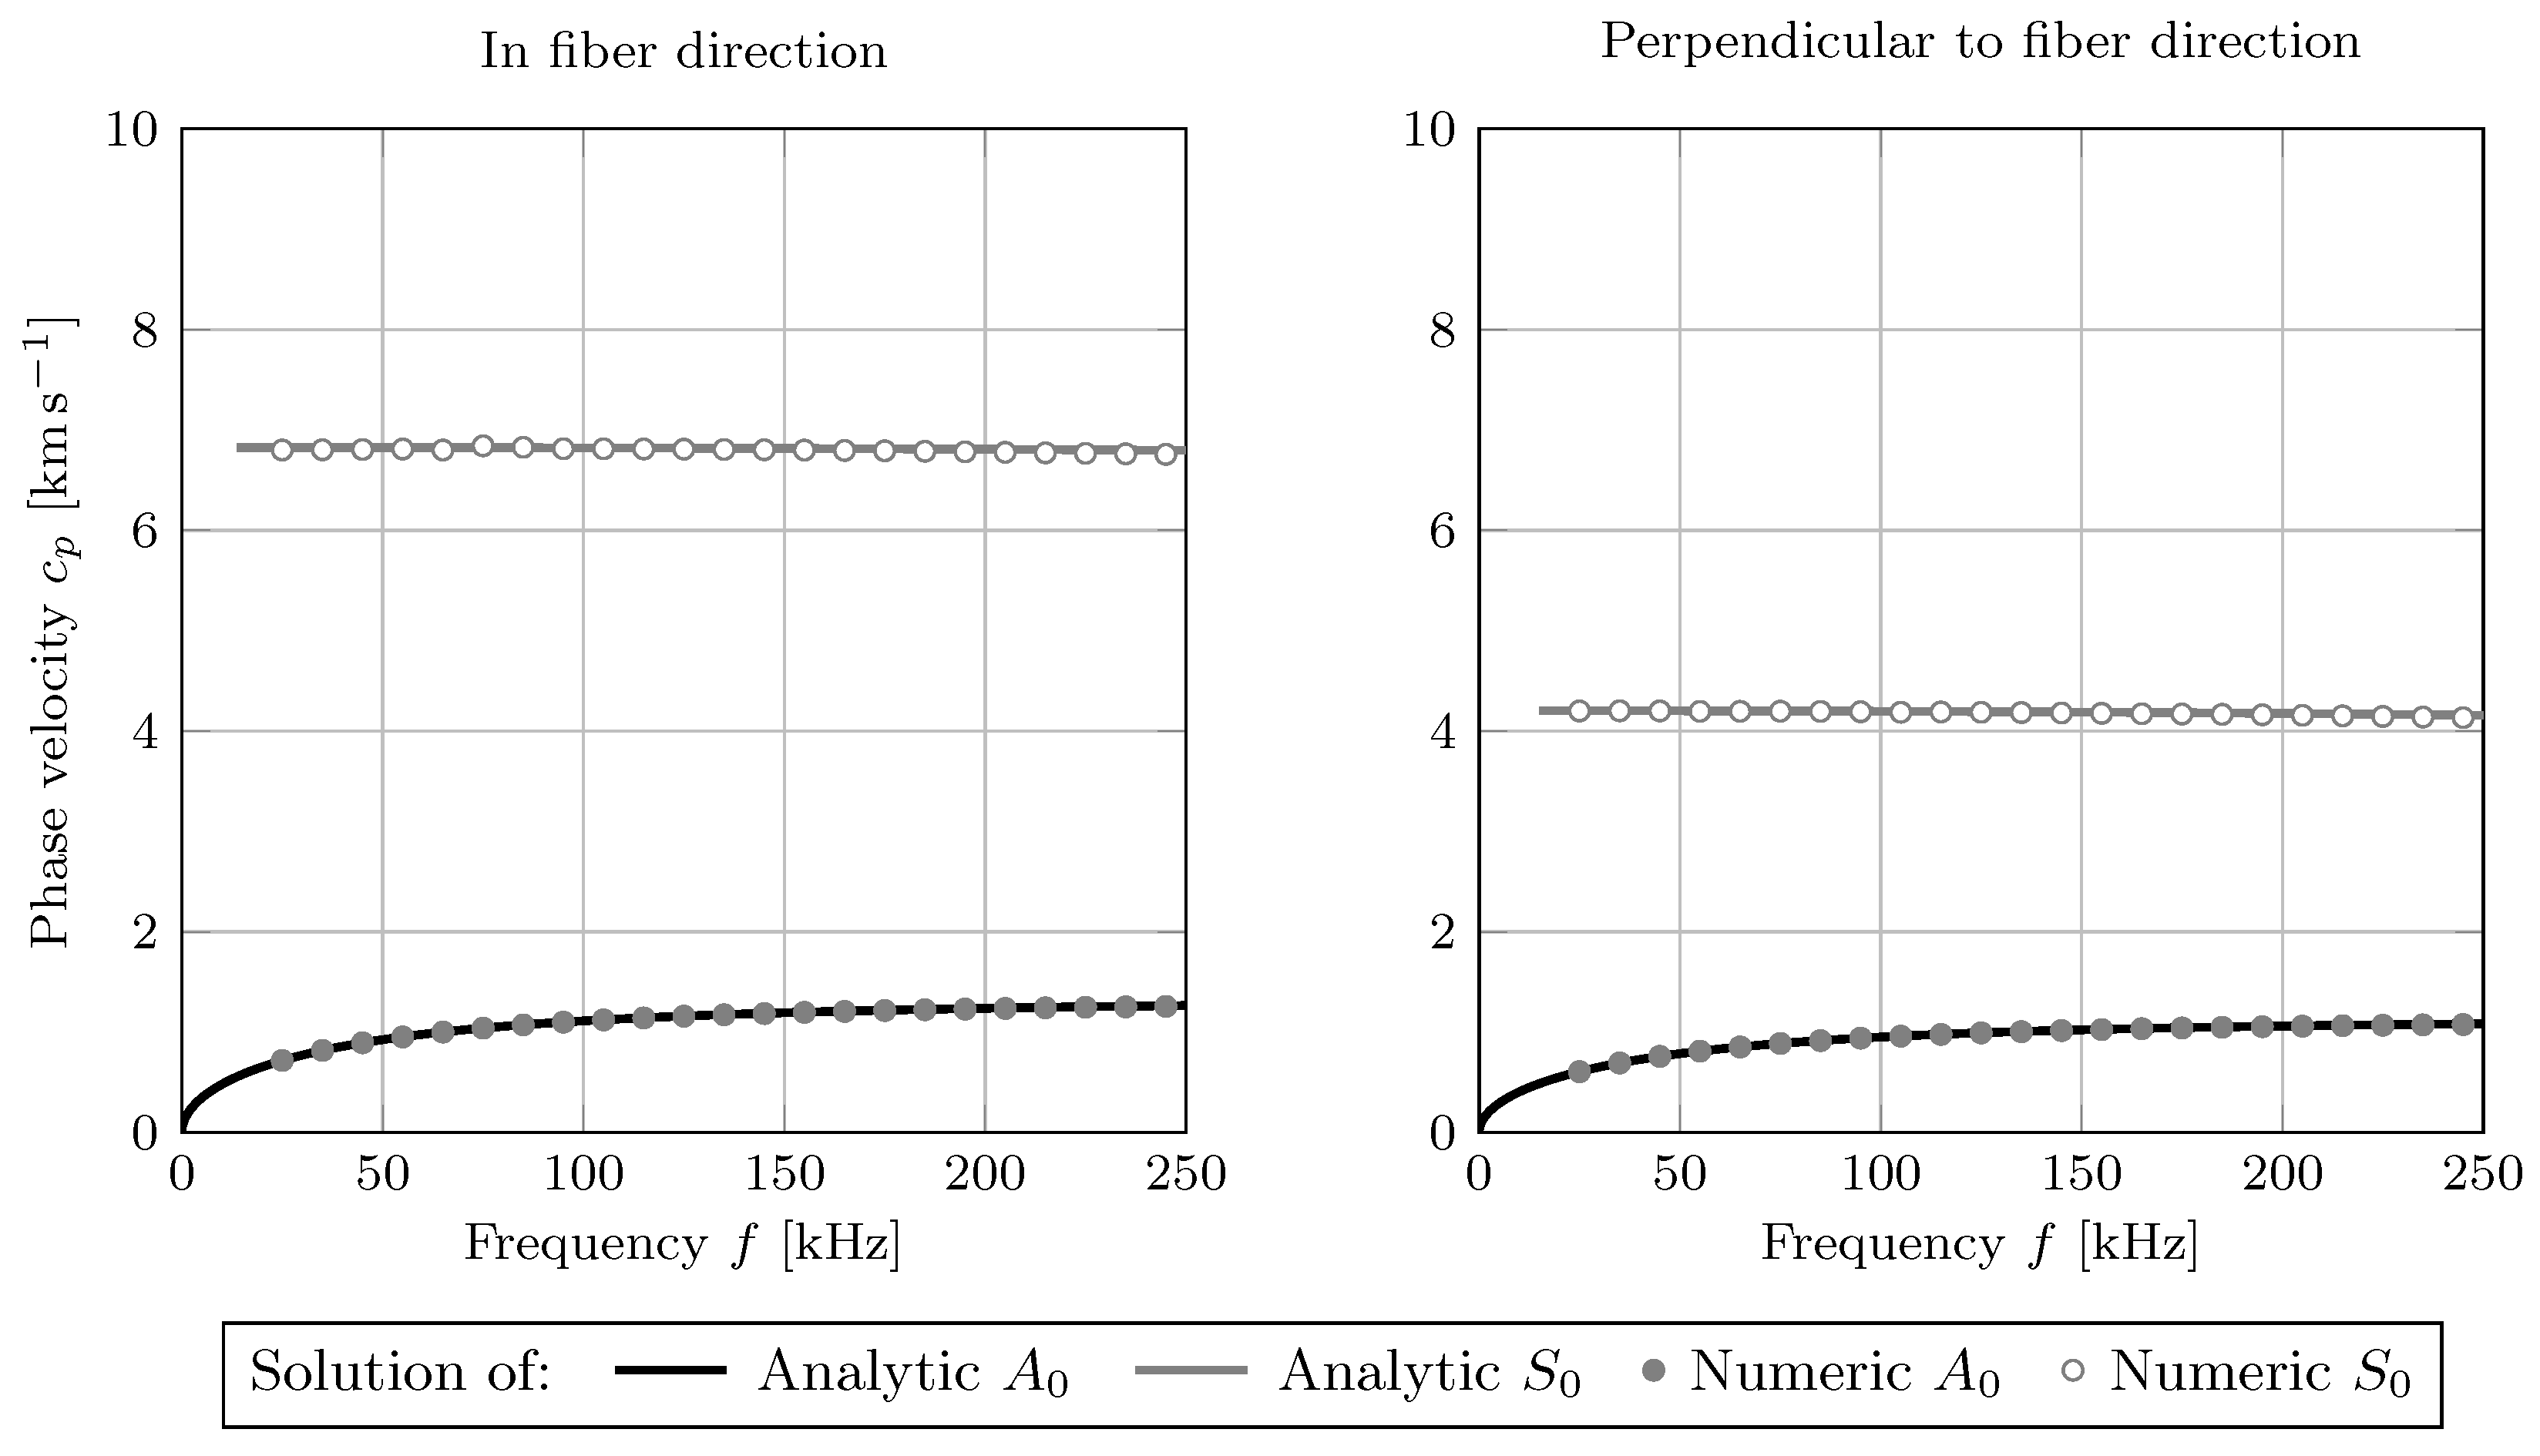
. As the first step, the dispersive nature of GUW in a steel-CFRP laminate was analyzed by computing the dispersion diagrams for the wave propagation in the fiber direction and perpendicular to it. This was done by utilizing the analytical framework and numerical 2D simulations. The analytically and numerically obtained dispersion diagrams for a frequency range up to 250 k Hz 
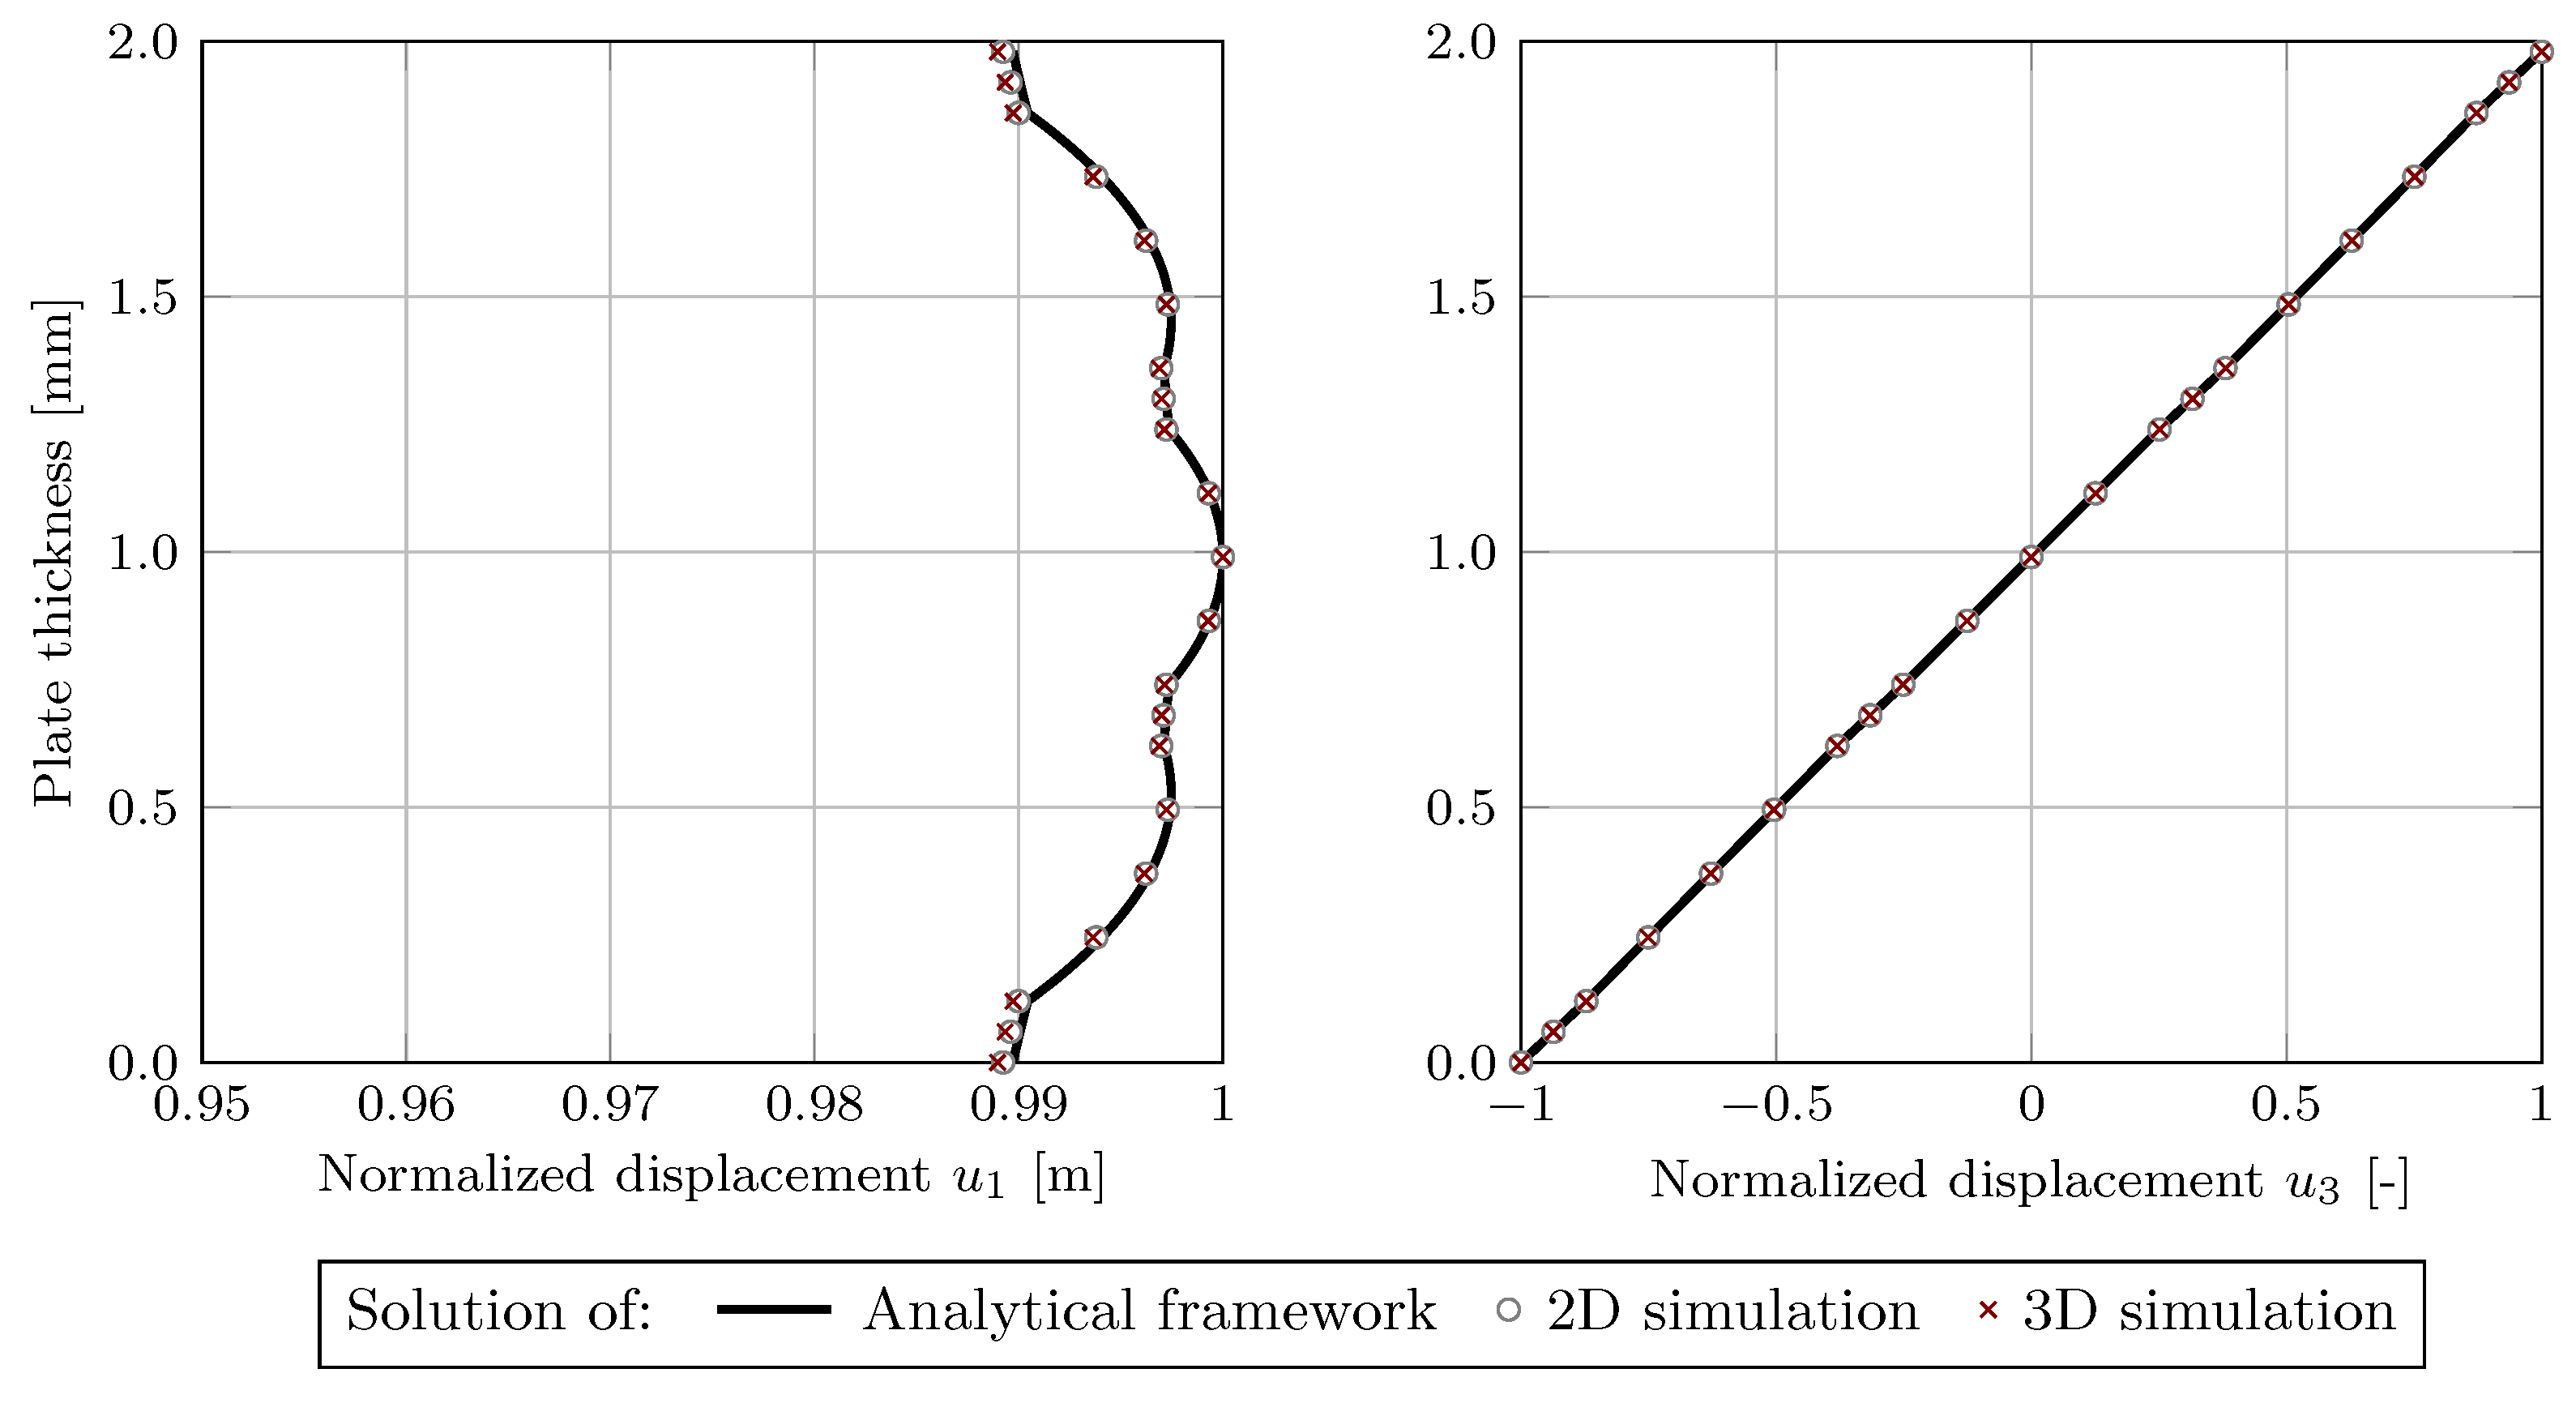
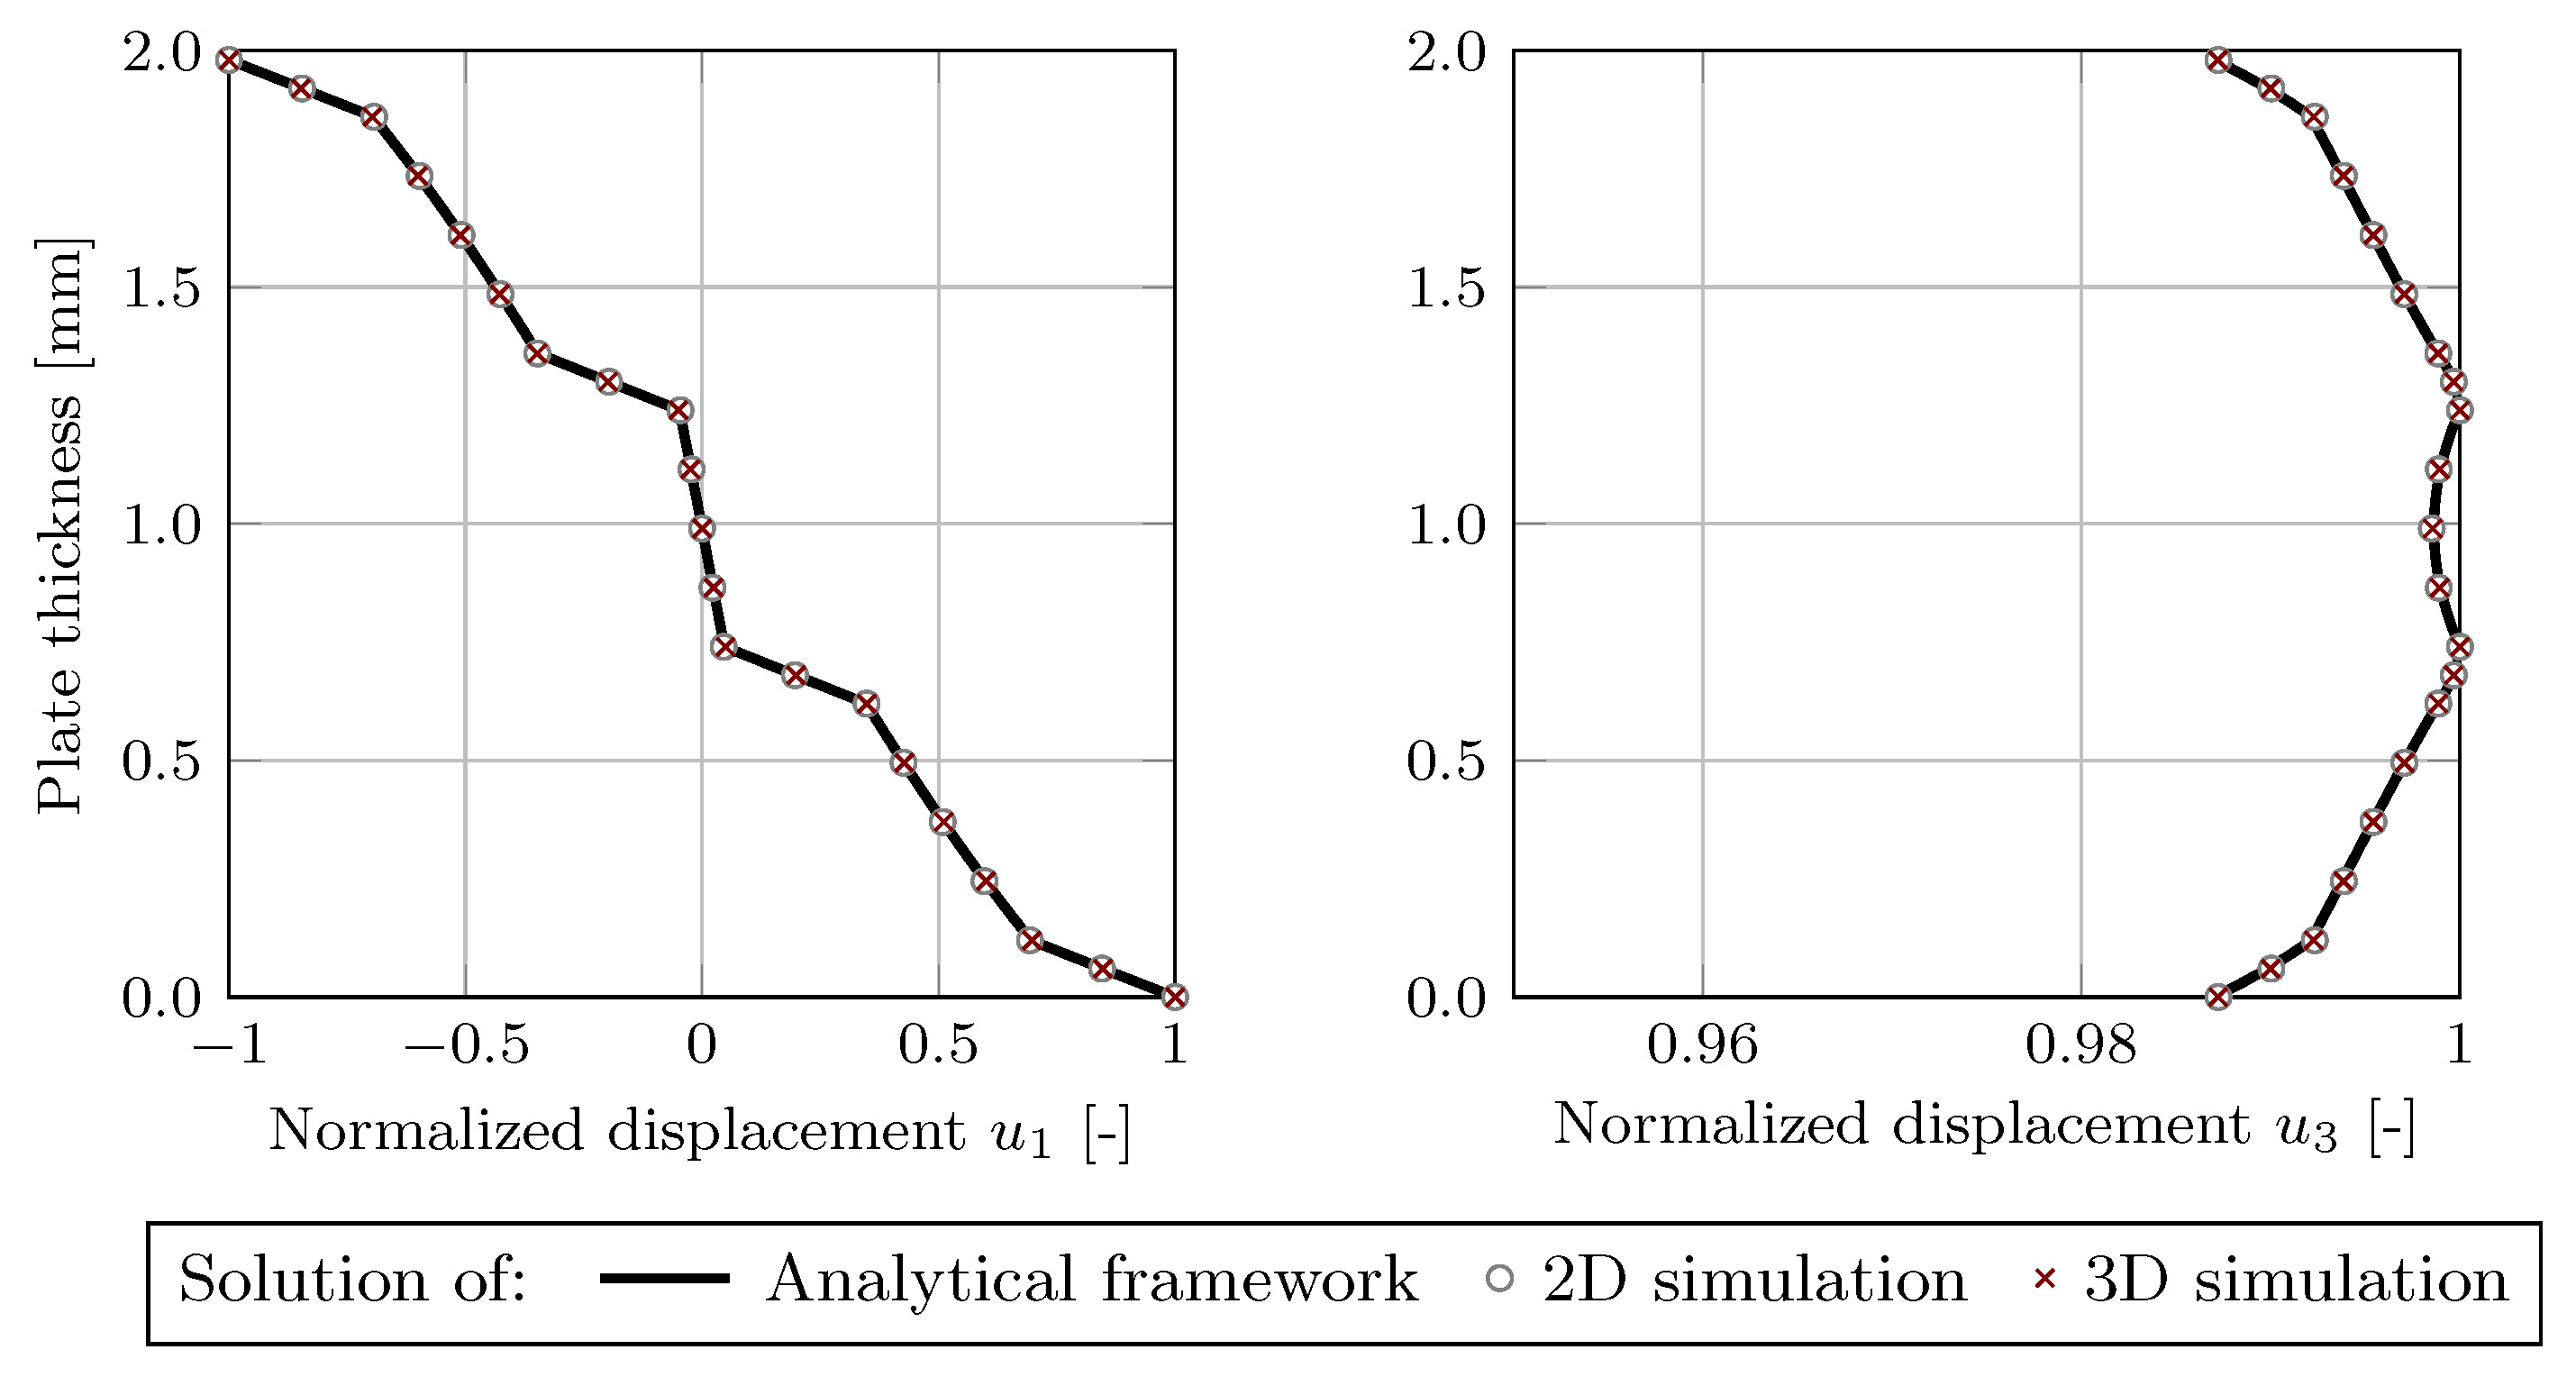
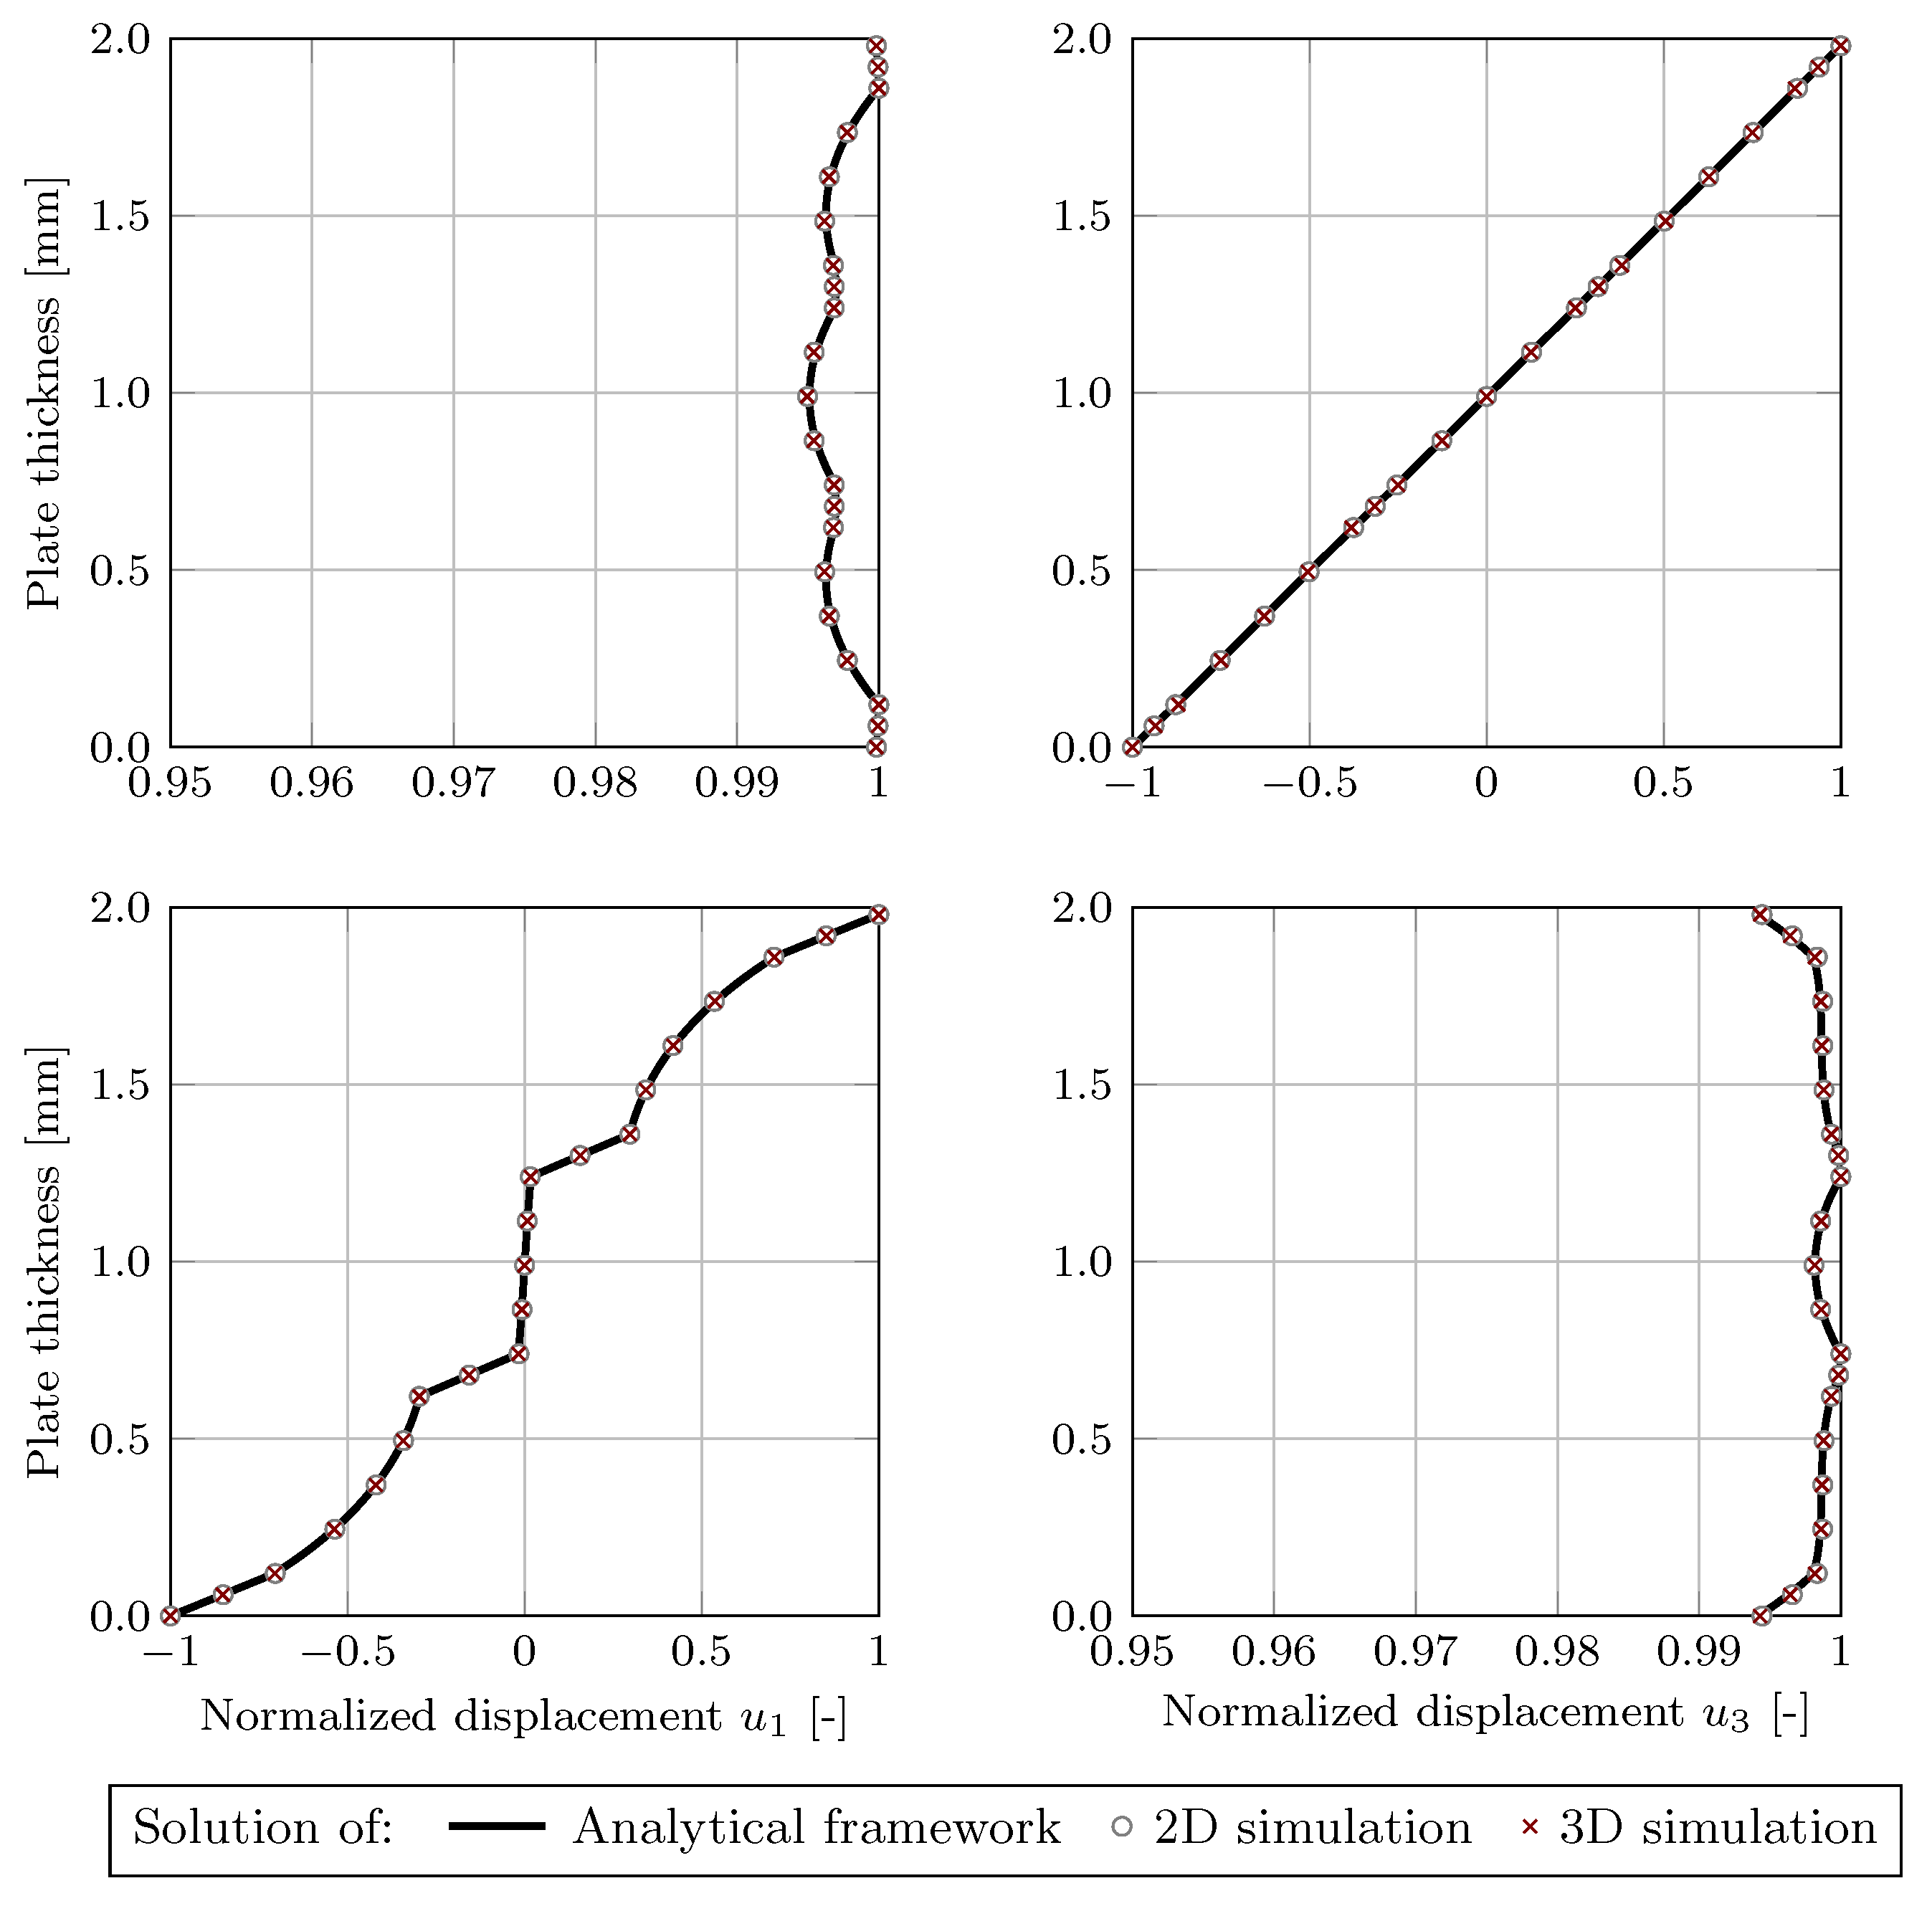
coincide very well. Furthermore, it was found that the dispersive nature is similar to the propagation characteristics in FRP. In the following step, the phase velocity derived from the dispersion diagram for two excitation frequencies (80 k Hz and 120 k Hz 
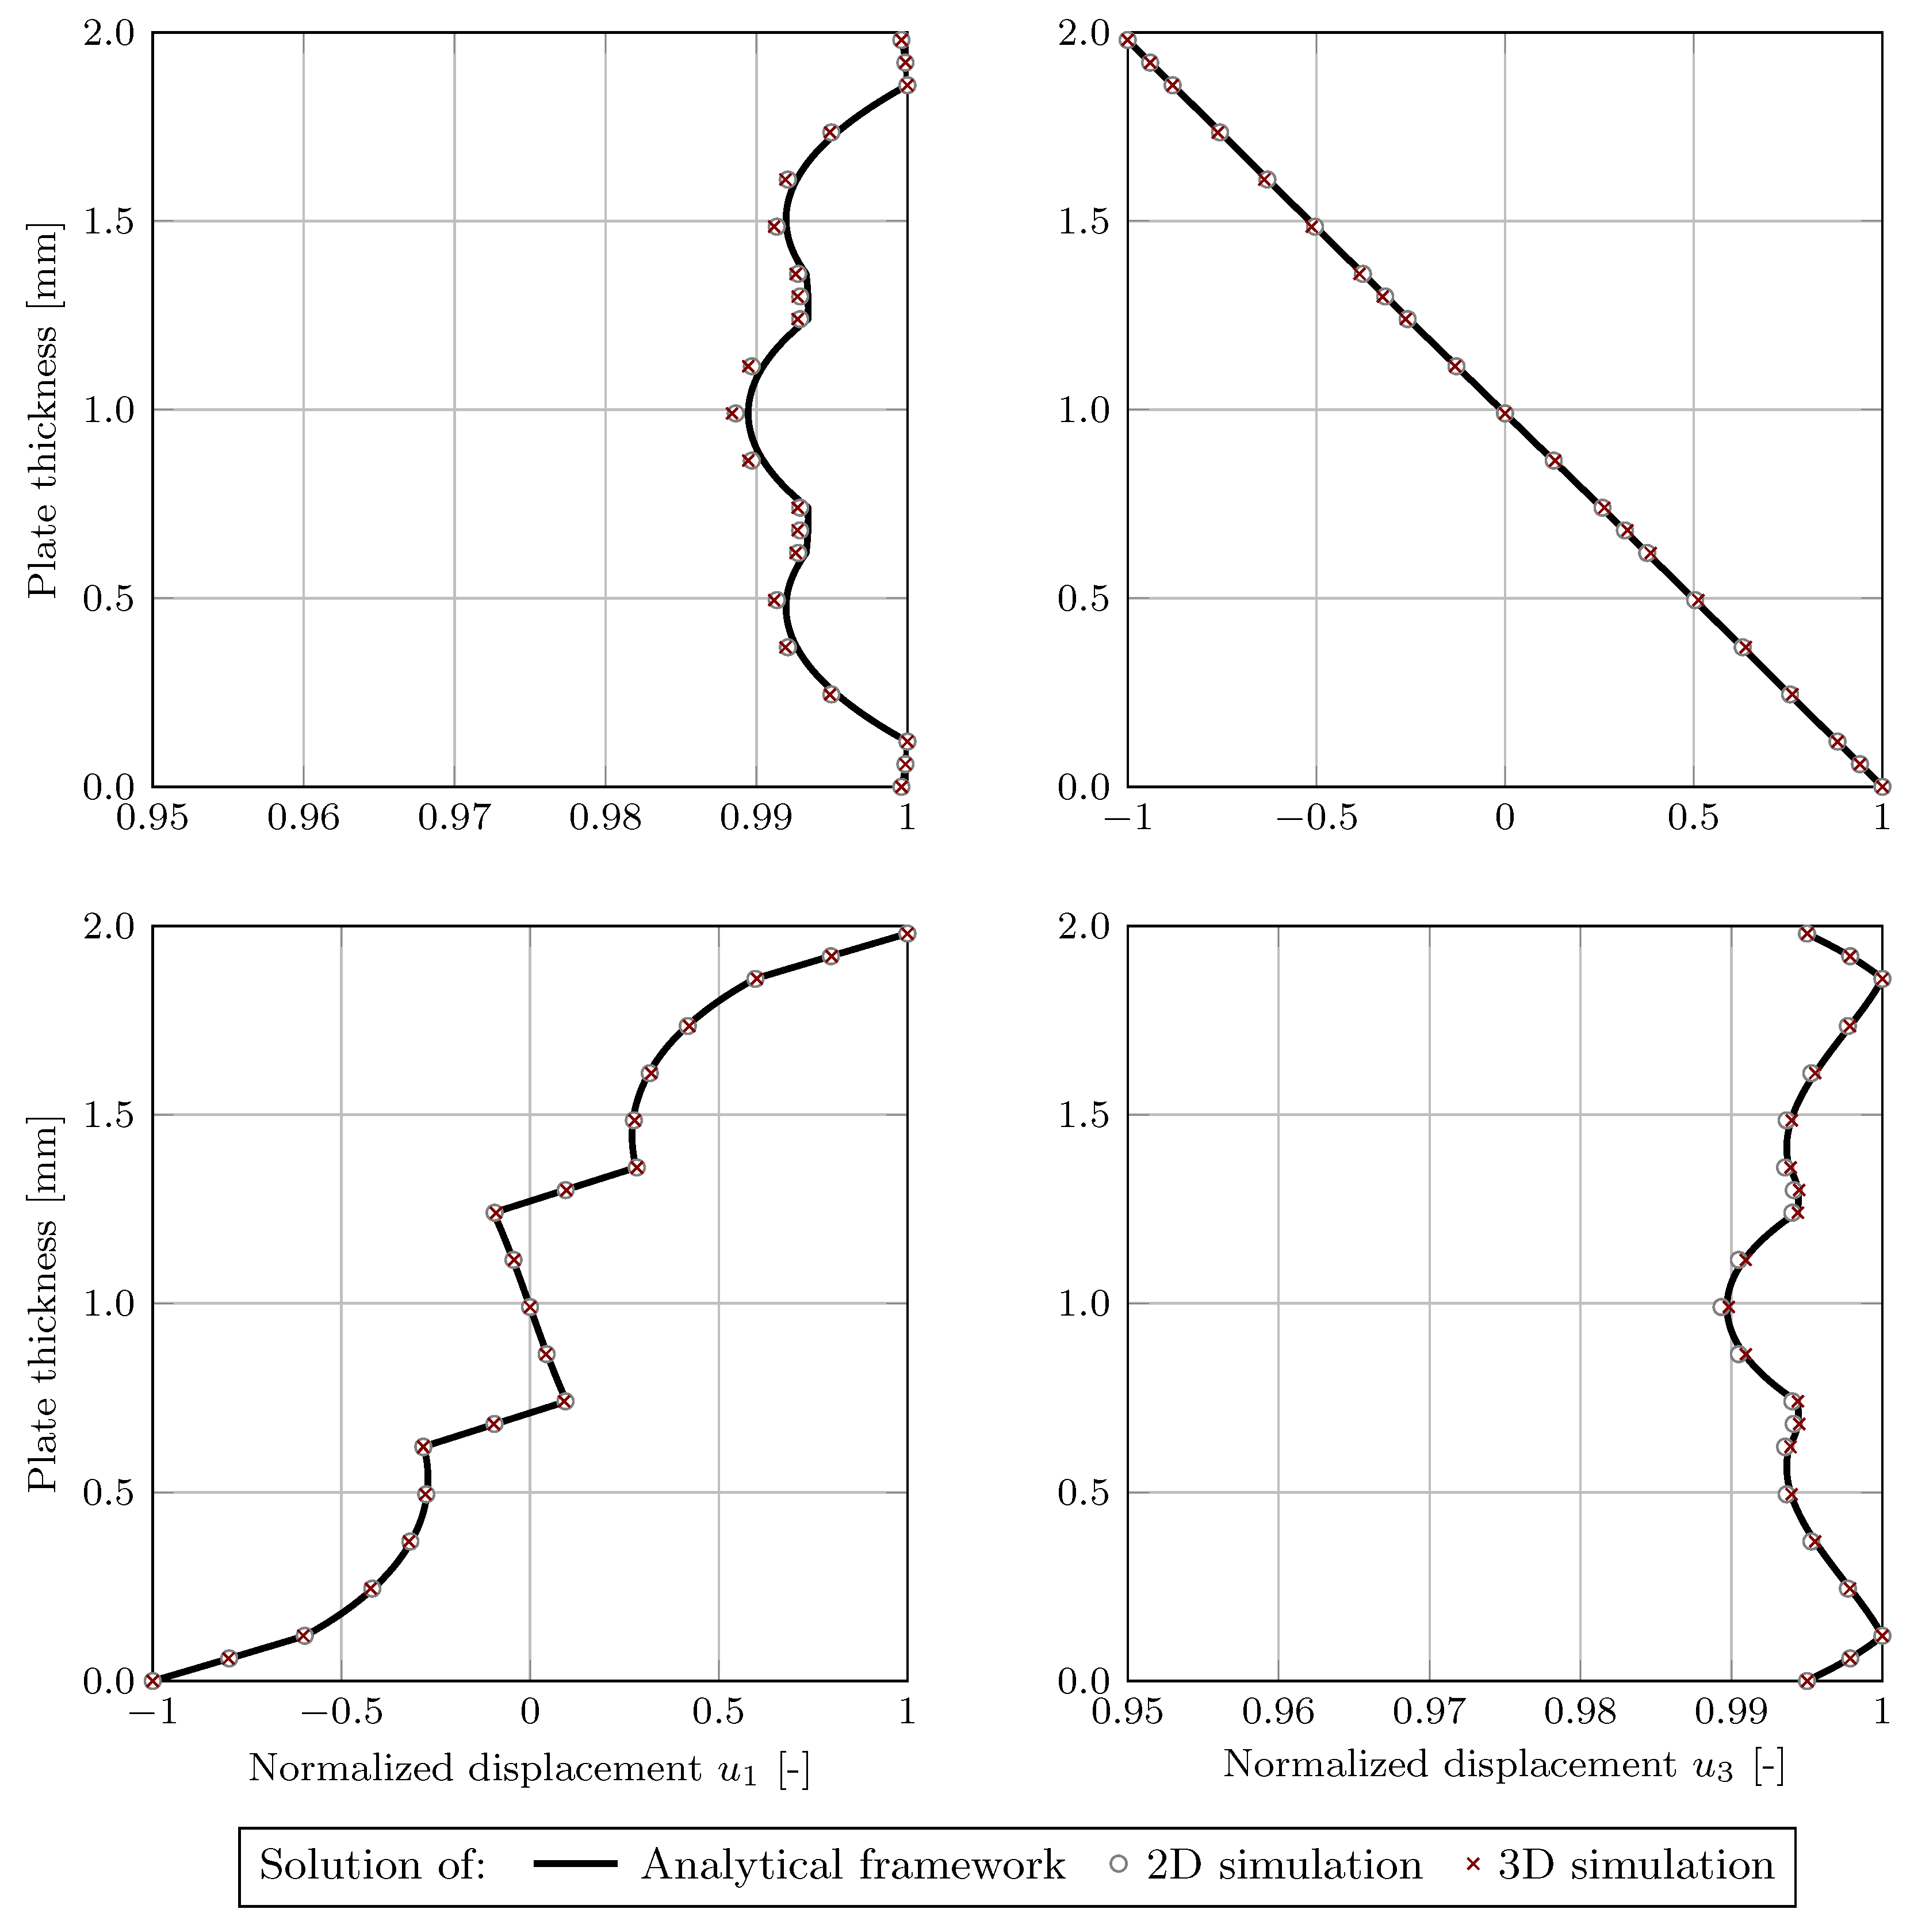
) was used to compute the displacement field following the analytical framework. Furthermore, numerical 2D and 3D simulations were conducted to obtain the displacement field components for the wave propagation in the fiber direction and perpendicular to it. The resulting displacement fields show identical properties, as described in the literature for the GUW propagation in isotropic, transversely-isotropic, and orthotropic materials [16,17,29]. For the wave propagation in the fiber orientation as well as perpendicular to it, the in-plane component of the S 0 -wave mode showed an axisymmetric shape and the out-of-plane component showed a point-symmetric shape. For the A 0 -wave mode, the opposite features were observed—point symmetry for the in-plane component and axisymmetry for the out-of-plane component. The agreement between the qualitative analytical and numerical results both in the direction and perpendicular to the fiber orientation is excellent, and the deviations are difficult to detect, which was also shown by the overview of the percentage deviations of the displacement fields in Table 4 and Table 5. The complex shape of the displacement fields indicate that finite shell elements are not suitable for modeling and 3D continuum elements should be used to accurately represent the displacement fields when a full 3D simulation is required.
Since the investigations presented here involve high computational effort, the possibility of model reduction is also investigated using a 2D model as an example. For this purpose, a PMOR method is applied to approximate the GUW propagation in an FML plate. In Figure 10 it can be seen that in the context of this model reduction, no disadvantages in the accuracy of the model occurred, and also a speed-up factor of the model of 45.72 was achieved.
In conclusion, the numerical investigation of the main wave propagation characteristics in a steel-CFRP laminate reveal the well-known wave propagation properties of GUW in thin-walled structures. As already shown for isotropic, transversely-isotropic, and orthotropic materials, the modeling approach can successfully be reduced to 2D for the wave propagation along a symmetry axis. Furthermore, the computation time can be significantly reduced by a PMOR method with a minimal loss of information regarding the wave propagation. In further investigations, the displacement fields on other FML plate configurations with different metal-UD layer ratios will be investigated.

Author Contributions

Conceptualization, A.M. and N.R.; methodology, A.M., T.B. and N.K.B.M.; validation, A.M., T.B., N.R. and N.K.B.M.; formal analysis, A.M., N.R., T.B. and N.K.B.M.; investigation, A.M., T.B. and N.K.B.M.; data curation, A.M., N.K.B.M., N.R. and T.B.; writing—original draft preparation, A.M., T.B., N.R. and N.K.B.M.; writing—review and editing, All; visualization, A.M.; supervision, R.L., N.R. and D.A.L.; project administration, R.L., N.R. and D.A.L.; funding acquisition, R.L., N.R. and D.A.L. All authors have read and agreed to the published version of the manuscript.

Funding

The financial support within the Research Unit 3022 “Ultrasonic Monitoring of Fibre Metal Laminates Using Integrated Sensors” (project number: 418311604) by the Deutsche Forschungsgemeinschaft (DFG) is gratefully acknowledged.

Institutional Review Board Statement

Not applicable.

Informed Consent Statement

Not applicable.

Data Availability Statement

Not applicable.

Conflicts of Interest

The authors declare no conflict of interest. The funders had no role in the design of the study; in the collection, analyses, or interpretation of data; in the writing of the manuscript, or in the decision to publish the results.

Abbreviations

The following abbreviations are used in this manuscript:
2Dtwo dimensional
2D-DFTdiscrete two dimensional Fourier transformation
3Dthree dimensional
CFRPcarbon fiber-reinforced plastic
FMLfiber metal laminate
FRPfiber-reinforced polymer
GFRPglass fiber-reinforced plastic
GUWguided ultrasonic wave
HiFihigh fidelity
MORmodel order reduction
PMORparametric model order reduction
PODproper orthogonal decomposition
POMproper orthogonal modes
SHMstructural health monitoring
SVDsingular value decomposition
UDunidirectional

Appendix A

Below, we summarize the results of the displacement field analysis at 80 k Hz . Therefore, Figure A1 and Figure A2 hold the results of the displacement field components of the A 0 -mode perpendicular to the fiber direction and the components of the displacement fields in fiber direction for both the A 0 - and S 0 -modes. The corresponding results of the mean error calculation are collected in Table A1 for the 2D simulation results and in Table A2 for the 3D simulation results.
Figure A1. In-plane (left) and out-of-plane (right) components of a normalized displacement field for A 0 wave mode perpendicular to the fiber orientation at 80 k Hz derived from the analytical framework and numerical 2D- and 3D-simulations.
Acoustics 04 00032 g0a1
Figure A2. In-plane (left) and out-of-plane (right) components of a normalized displacement field for S 0 (top) and A 0 (bottom) wave modes in the fiber orientation at 80 k Hz derived from the analytical framework and numerical 2D- and 3D-simulations.
Acoustics 04 00032 g0a2
Table A1. Calculated mean error for the 2D model at 80 k Hz .
A 0 A 0 S 0 S 0
in-PlaneOut-of-Planein-PlaneOut-of-Plane
In fiber direction 2.01 % 0.01 % 0.007 % 0.035 %
Perpendicular 1.02 % 0.006 % 0.023 % 0.092 %
Table A2. Calculated mean error for 3D model at 80 k Hz .
A 0 A 0 S 0 S 0
in-PlaneOut-of-Planein-PlaneOut-of-Plane
In fiber direction 0.33 % 0.004 % 0.008 % 0.055 %
Perpendicular 1.06 % 0.006 % 0.036 % 0.19 %

References

  1. Alderliesten, R.C.; Hagenbeek, M.; Homan, J.J.; Hooijmeijer, P.A.; de Vries, T.J.; Vermeeren, C.A.J.R. Fatigue and Damage Tolerance of Glare. Appl. Compos. Mater. 2003, 10, 223–242. [Google Scholar] [CrossRef]
  2. Vlot, A.; Gunnink, J.W. (Eds.) Fibre Metal Laminates: An Introduction; Springer eBook Collection; Springer: Dordrecht, The Netherlands, 2001. [Google Scholar] [CrossRef]
  3. Chai, G.B.; Manikandan, P. Low velocity impact response of fibre-metal laminates—A review. Compos. Struct. 2014, 107, 363–381. [Google Scholar] [CrossRef]
  4. Morinière, F.; Alderliesten, R.; Tooski, M.; Benedictus, R. Damage evolution in GLARE fibre-metal laminate under repeated low-velocity impact tests. Open Eng. 2012, 2, 603–611. [Google Scholar] [CrossRef]
  5. Giurgiutiu, V. Structural Health Monitoring with Piezoelectric Wafer Active Sensors; Academic Press: Cambridge, MA, USA; Elsevier: Amsterdam, The Netherlands, 2008. [Google Scholar]
  6. Lammering, R.; Gabbert, U.; Sinapius, M.; Schuster, T.; Wierach, P. (Eds.) Lamb-Wave Based Structural Health Monitoring in Polymer Composites; Research Topics in Aerospace; Springer: Cham, Switzerland, 2018. [Google Scholar] [CrossRef]
  7. Lamb, H. On waves in an elastic plate. Proc. R. Soc. London. Ser. A Contain. Pap. A Math. Phys. Character 1917, 93, 114–128. [Google Scholar] [CrossRef] [Green Version]
  8. Viktorov, I.A. Rayleigh and Lamb Waves: Physical Theory and Applications; Ultrasonic technology; Springer: New York, NY, USA, 2013. [Google Scholar]
  9. Achenbach, J.D. Wave Propagation in Elastic Solids; North-Holland Series in Applied Mathematics and Mechanics; North-Holland Publishing Co.: Amsterdam, The Netherlands, 1973; Volume 16. [Google Scholar]
  10. Graff, K.F. Wave Motion in Elastic Solids; Dover Publications: New York, NY, USA, 1991. [Google Scholar]
  11. Rose, J.L. Ultrasonic Guided Waves in Solid Media; Cambridge Univercity Press: New York, NY, USA, 2014. [Google Scholar]
  12. Nayfeh, A.H. The general problem of elastic wave propagation in multilayered anisotropic media. J. Acoust. Soc. Am. 1991, 89, 1521–1531. [Google Scholar] [CrossRef]
  13. Nayfeh, A.H. Wave Propagation in Layered Anisotropic Media: With Applications to Composites; North-Holland series in applied mathematics and mechanics; Elsevier: New York, NY, USA, 1995; Volume 39. [Google Scholar]
  14. Rokhlin, S.I.; Wang, L. Ultrasonic waves in layered anisotropic media: Characterization of multidirectional composites. Int. J. Solids Struct. 2002, 39, 4133–4149. [Google Scholar] [CrossRef]
  15. Wang, L.; Rokhlin, S.I. Ultrasonic wave interaction with multidirectional composites: Modeling and experiment. J. Acoust. Soc. Am. 2003, 114, 2582–2595. [Google Scholar] [CrossRef] [PubMed]
  16. Nandyala, A.R.; Darpe, A.K.; Singh, S.P. Effective stiffness matrix method for predicting the dispersion curves in general anisotropic composites. Arch. Appl. Mech. 2019, 89, 1923–1938. [Google Scholar] [CrossRef]
  17. Ngoc Nguyen, V. Zur Wellenausbreitung in Geschichteten Faserverbundstrukturen Unter Verwendung Nichtlinearer Stoffgesetze. Ph.D. Dissertation, Helmut Schmidt University/University of the Federal Armed Forces Hamburg, Hamburg, Germany, 2020. [Google Scholar]
  18. Hosseini, S.M.H.; Kharaghani, A.; Kirsch, C.; Gabbert, U. Numerical simulation of Lamb wave propagation in metallic foam sandwich structures: A parametric study. Compos. Struct. 2013, 97, 387–400. [Google Scholar] [CrossRef]
  19. Thwaites, S.; Clark, N.H. Non-destructive Testing of Honeycomb Sandwich Structures Using Elastic Waves. J. Sound Vib. 1995, 187, 253–269. [Google Scholar] [CrossRef]
  20. Song, F.; Huang, G.L.; Hu, G.K. Online Guided Wave-Based Debonding Detection in Honeycomb Sandwich Structures. AIAA J. 2012, 50, 284–293. [Google Scholar] [CrossRef] [Green Version]
  21. Bertoni, H.L.; Park, S.K. Propagation of elastic waves in honeycomb panels for application to rapid inspection techniques. J. Nondestruct. Eval. 1981, 2, 209–217. [Google Scholar] [CrossRef]
  22. Lowe, M.J.S.; Cawley, P. The applicability of plate wave techniques for the inspection of adhesive and diffusion bonded joints. J. Nondestruct. Eval. 1994, 13, 185–200. [Google Scholar] [CrossRef]
  23. Guo, N.; Lim, M.K. Lamb Waves Propagation in Aluminum Honeycomb Structures. In Review of Progress in Quantitative Nondestructive Evaluation; Thompson, D.O., Chimenti, D.E., Eds.; Springer: Boston, MA, USA, 1996; pp. 323–330. [Google Scholar] [CrossRef] [Green Version]
  24. Fujita, T.; Toda, K. Operational Performance of A 0 -mode Lamb Wave Interdigital Transducers Under Water-Loaded Condition. Jpn. J. Appl. Phys. 2004, 43, 5577–5581. [Google Scholar] [CrossRef]
  25. Maghsoodi, A.; Ohadi, A.; Sadighi, M.; Amindavar, H. Damage detection in multilayered fiber–metal laminates using guided-wave phased array. J. Mech. Sci. Technol. 2016, 30, 2113–2120. [Google Scholar] [CrossRef]
  26. Gao, J.; Lyu, Y.; Zheng, M.; Liu, M.; Liu, H.; Wu, B.; He, C. Modeling guided wave propagation in multi-layered anisotropic composite laminates by state-vector formalism and the Legendre polynomials. Compos. Struct. 2019, 228, 111319. [Google Scholar] [CrossRef]
  27. Tai, S.; Kotobuki, F.; Wang, L.; Mal, A. Modeling Ultrasonic Elastic Waves in Fiber-Metal Laminate Structures in Presence of Sources and Defects. J. Nondestruct. Eval. Diagn. Progn. Eng. Syst. 2020, 3, 041102. [Google Scholar] [CrossRef]
  28. Muc, A.; Barski, M.; Stawiarski, A.; Chwał, M.; Augustyn, M. Dispersion curves and identification of elastic wave modes for fiber metal laminates. Compos. Struct. 2021, 255, 112930. [Google Scholar] [CrossRef]
  29. Wang, L. Elastic Wave Propagation in Composites and Least-Squares Damage Localization Technique. Master’s Thesis, North Carolina State University, Raleigh, NC, USA, 2004. [Google Scholar]
  30. Barth, T.; Lammering, R. Experimental Approach on Lamb Wave Dispersion Diagrams Using 2D Fourier Transformation and Laser Vibrometry. PAMM 2021, 21, e202100060. [Google Scholar] [CrossRef]
  31. Barth, T.; Rauter, N.; Lammering, R. Experimental Determination of Lamb Wave Dispersion Diagrams Using 2D Fourier Transform and Laser Vibrometry. Preprint 2022. [Google Scholar] [CrossRef]
  32. Bracewell, R.N.; Bracewell, R.N. The Fourier Transform and Its Applications, 3rd ed.; McGraw-Hill series in electrical and computer engineering; McGraw Hill: Boston, MA, USA, 2000. [Google Scholar]
  33. Alleyne, D.; Cawley, P. A two-dimensional Fourier transform method for the measurement of propagating multimode signals. J. Acoust. Soc. Am. 1991, 89, 1159–1168. [Google Scholar] [CrossRef]
  34. Su, Z.; Ye, L. Identification of Damage Using Lamb Waves: From Fundamentals to Applications; Springer: London, UK, 2009; Volume 48. [Google Scholar] [CrossRef]
  35. Hora, P.; Červená, O. Determination of Lamb wave dispersion curves by means of Fourier transform. Appl. Comput. Mech. 2012, 6, 5–16. [Google Scholar]
  36. Antoulas, A.C. Approximation of Large-Scale Dynamical Systems; Advances in design and control; SIAM Society for Industrial and Applied Mathematics: Philadelphia, PA, USA, 2005; Volume 6. [Google Scholar]
  37. Pearson, K. LIII. On lines and planes of closest fit to systems of points in space. London Edinburgh Dublin Philos. Mag. J. Sci. 1901, 2, 559–572. [Google Scholar] [CrossRef] [Green Version]
  38. Ahlman, D.; Söderlund, F.; Jackson, J.; Kurdila, A.; Shyy, W. Proper Orthogonal Decomposition for Time-Dependent Lid-Driven Cavity Flows. Numer. Heat Transf. Part B Fundam. 2002, 42, 285–306. [Google Scholar] [CrossRef]
  39. Berkooz, G.; Holmes, P.; Lumley, J.L. The Proper Orthogonal Decomposition in the Analysis of Turbulent Flows. Annu. Rev. Fluid Mech. 1993, 25, 539–575. [Google Scholar] [CrossRef]
  40. Holmes, P.; Lumley, J.L.; Berkooz, G.; Rowley, C.W. Turbulence, Coherent Structures, Dynamical Systems and Symmetry; Cambridge University Press: Cambridge, UK, 2012. [Google Scholar] [CrossRef]
  41. Ly, H.V.; Tran, H.T. Modeling and control of physical processes using proper orthogonal decomposition. Math. Comput. Model. 2001, 33, 223–236. [Google Scholar] [CrossRef] [Green Version]
  42. Kirby, M.; Sirovich, L. Application of the Karhunen-Loeve procedure for the characterization of human faces. IEEE Trans. Pattern Anal. Mach. Intell. 1990, 12, 103–108. [Google Scholar] [CrossRef] [Green Version]
  43. Han, S.; Palazotto, A.N.; Leakeas, C.L. Finite-Element Analysis of Lamb Wave Propagation in a Thin Aluminum Plate. J. Aerosp. Eng. 2009, 22, 185–197. [Google Scholar] [CrossRef]
  44. Bellam Muralidhar, N.K.; Rauter, N.; Mikhaylenko, A.; Lammering, R.; Lorenz, D.A. Parametric Model Order Reduction of Guided Ultrasonic Wave Propagation in Fiber Metal Laminates with Damage. Modelling 2021, 2, 591–608. [Google Scholar] [CrossRef]
  45. Cagniart, N.; Crisovan, R.; Maday, Y.; Abgrall, R. Model Order Reduction for Hyperbolic Problems: A New Framework. HAL 2017, hal-01583224. [Google Scholar]
  46. Mirhoseini, M.A.; Zahr, M.J. Model reduction of convection-dominated partial differential equations via optimization-based implicit feature tracking. arXiv 2021, arXiv:2109.14694. [Google Scholar]
  47. Boncoraglio, G.; Farhat, C. Active Manifold and Model-Order Reduction to Accelerate Multidisciplinary Analysis and Optimization. AIAA J. 2021, 59, 4739–4753. [Google Scholar] [CrossRef]
  48. Bui-Thanh, T.; Willcox, K.; Ghattas, O. Model Reduction for Large-Scale Systems with High-Dimensional Parametric Input Space. SIAM J. Sci. Comput. 2008, 30, 3270–3288. [Google Scholar] [CrossRef]
  49. Phuong Huynh, D.B.; Knezevic, D.J.; Patera, A.T. A Static condensation Reduced Basis Element method: Approximation and a posteriori error estimation. ESAIM Math. Model. Numer. Anal. 2013, 47, 213–251. [Google Scholar] [CrossRef] [Green Version]
  50. Eftang, J.L.; Patera, A.T. Port reduction in parametrized component static condensation: Approximation and a posteriori error estimation. Int. J. Numer. Methods Eng. 2013, 96, 269–302. [Google Scholar] [CrossRef] [Green Version]
  51. McBane, S.; Choi, Y. Component-wise reduced order model lattice-type structure design. Comput. Methods Appl. Mech. Eng. 2021, 381, 113813. [Google Scholar] [CrossRef]
  52. Kim, Y.; Wang, K.; Choi, Y. Efficient Space–Time Reduced Order Model for Linear Dynamical Systems in Python Using Less than 120 Lines of Code. Mathematics 2021, 9, 1690. [Google Scholar] [CrossRef]
  53. Blockmans, B.; Tamarozzi, T.; Naets, F.; Desmet, W. A nonlinear parametric model reduction method for efficient gear contact simulations. Int. J. Numer. Methods Eng. 2015, 102, 1162–1191. [Google Scholar] [CrossRef]
  54. Balajewicz, M.; Farhat, C. Reduction of nonlinear embedded boundary models for problems with evolving interfaces. J. Comput. Phys. 2014, 274, 489–504. [Google Scholar] [CrossRef] [Green Version]
  55. Galbally, D.; Fidkowski, K.; Willcox, K.; Ghattas, O. Non-linear model reduction for uncertainty quantification in large-scale inverse problems. Int. J. Numer. Methods Eng. 2010, 81, 1581–1608. [Google Scholar] [CrossRef] [Green Version]
  56. Chen, P.; Schwab, C. Model Order Reduction Methods in Computational Uncertainty Quantification. In Handbook of Uncertainty Quantification; Ghanem, R., Higdon, D., Owhadi, H., Eds.; Springer: Cham, Switzerland, 2016; pp. 1–53. [Google Scholar] [CrossRef]
  57. Balajewicz, M.; Amsallem, D.; Farhat, C. Projection–based model reduction for contact problems. Int. J. Numer. Methods Eng. 2016, 106, 644–663. [Google Scholar] [CrossRef] [Green Version]
  58. Zahr, M.J.; Avery, P.; Farhat, C. A multilevel projection-based model order reduction framework for nonlinear dynamic multiscale problems in structural and solid mechanics. Int. J. Numer. Methods Eng. 2017, 112, 855–881. [Google Scholar] [CrossRef]
Figure 1. Material layout of the FML plate.
Acoustics 04 00032 g001
Figure 2. Numerical model for the computation of the dispersion diagrams including the boundary conditions.
Acoustics 04 00032 g002
Figure 3. Comparison of numerically and analytically determined dispersion diagrams in fiber direction (left) and perpendicular (right) to the fiber orientation.
Acoustics 04 00032 g003
Figure 4. Deviation of the numerically and analytically determined dispersion diagrams in fiber direction (left) and perpendicular (right) to the fiber orientation.
Acoustics 04 00032 g004
Figure 5. Numerical 2D model for the computation of the displacement fields including the boundary conditions.
Acoustics 04 00032 g005
Figure 6. Numerical 3D model for the computation of displacement fields including the boundary conditions.
Acoustics 04 00032 g006
Figure 7. In-plane (left) and out-of-plane (right) components of normalized displacement field for S 0 (top) and A 0 (bottom) wave modes in the fiber orientation at 120 k Hz from analytical treatment and numerical 2D- and 3D-simulations.
Acoustics 04 00032 g007
Figure 8. In-plane (left) and out-of-plane (right) components of normalized displacement field for S 0 (top) and A 0 (bottom) wave modes perpendicular to the fiber orientation at 120 k Hz from analytical treatment and numerical 2D- and 3D-simulations.
Acoustics 04 00032 g008
Figure 9. In-plane (left) and out-of-plane (right) components of normalized displacement field for S 0 wave modes perpendicular to the fiber orientation at 80 k Hz from analytical treatment and numerical 2D- and 3D-simulations.
Acoustics 04 00032 g009
Figure 10. Comparison of high-fidelity and reduced-order solution of GUW propagation in FML.
Acoustics 04 00032 g010
Table 1. Material properties of the CFRP layer and steel foil.
E 11 E 22 G 12 ν 12 ν 23 ρ
[GPa][GPa][GPa][-][-][kg/m3]
Steel18018069.20.300.307900
CFRP1279.244.830.300.371580
Table 2. Parameters of the numerical 2D model for the computation of dispersion diagrams.
ParameterValueUnit
Thickness1.98 m m
Length1000 m m
Element size CFRP 0.2 × 0.25 m m 2
Element size steel 0.2 × 0.12 m m 2
Nodes per element9-
Propagation length1000 m m
Simulation time10 m s
Sampling frequency6 MHz
Min. excitation frequency25 kHz
Max. excitation frequency245 kHz
Table 3. Parameters of the numerical models and simulations for the computation of displacement fields.
ParameterValueUnit
Thickness1.98 m m
Length0.3 m
2D modelElement size CFRP 0.75 × 0.25 m m 2
Element size steel 0.75 × 0.12 m m 2
Nodes per element9-
Thickness1.98 m m
Length0.3 m
3D modelWidth0.15 m
Element size CFRP 0.75 × 0.75 × 0.25 m m 3
Element size steel 0.75 × 0.75 × 0.12 m m 3
Nodes per element27-
Excitation frequency80 k Hz
Analysis at 80 kHz Sampling frequency1.6 MHz
Simulation time0.3 m s
Excitation frequency120 kHz
Analysis at 120 kHz Sampling frequency2.4 MHz
Simulation time0.21 m s
Table 4. Calculated mean error for the 2D model at 120 k Hz .
A 0 A 0 S 0 S 0
in-PlaneOut-of-Planein-PlaneOut-of-Plane
In fiber direction 0.072 % 0.019 % 0.042 % 0.22 %
Perpendicular 0.57 % 0.016 % 0.06 % 0.28 %
Table 5. Calculated mean error for the 3D model at 120 k Hz .
A 0 A 0 S 0 S 0
in-PlaneOut-of-Planein-PlaneOut-of-Plane
In fiber direction 0.22 % 0.055 % 0.054 % 1.53 %
Perpendicular 1.02 % 0.01 % 0.074 % 0.31 %
Table 6. Computation time for high-dimensional and reduced-order models.
ModelTraining TimeComputational Time
High-dimensional-66.29 s
Reduced-order17.6 h1.45 s
Publisher’s Note: MDPI stays neutral with regard to jurisdictional claims in published maps and institutional affiliations.

