Article

Environmental Noise Evolution during COVID-19 State of Emergency: Evidence of Peru’s Need for Action Plans

by
Rubén Rodríguez
1,
María Machimbarrena
2,* and
Ana I. Tarrero
3
1
Faculty of Environmental Engineering and Natural Resources, National University of Callao, Bellavista 07011, Peru
2
Department of Applied Physics, Architecture School, University of Valladolid, 47014 Valladolid, Spain
3
Department of Applied Physics, School of Industrial Engineering, University of Valladolid, 47011 Valladolid, Spain
*
Author to whom correspondence should be addressed.
Acoustics 2022, 4(2), 479-491; https://doi.org/10.3390/acoustics4020030
Submission received: 30 April 2022 / Revised: 24 May 2022 / Accepted: 25 May 2022 / Published: 2 June 2022
(This article belongs to the Special Issue Noise Control for Healthy and Enhanced Acoustic Environments)

Abstract

:
In Peru, as in many countries worldwide, varying degrees of restrictions have been established on the movement of the population after the World Health Organization (WHO) declared the condition of pandemic by COVID-19. In Lima, there have been different degrees of compulsory social immobilization (CSI), and the resumption of activities was planned in three consecutive phases. To analyse and evaluate the influence of such restrictions on the evolution of environmental noise, an investigation was carried out in one of the main avenues in the city of Lima during various successive mobility restriction conditions. The sound pressure level was measured, and the traffic flow was also registered. Considering that in Peru there is no environmental noise monitoring system whatsoever, in situ data are extremely valuable and allow the environmental noise problem to be depicted, even if in a limited area of the big city. The results show that in spite of the strongly restrictive social immobilization conditions, the measured noise levels have remained above the WHO recommendations and often above the Peruvian environmental noise quality standards. The results highlight the need to properly assess the environmental noise and noise sources in the city of Lima as well as the number of people exposed in order to adequately implement effective and cost-efficient noise mitigation action plans.

1. Introduction

The worldwide spread of the new coronavirus, SARS-CoV-2 (COVID-19), since the end of 2019 was declared a pandemic by the World Health Organization (WHO) on 11 March 2020 [1]. In Peru, the first case of coronavirus was confirmed on 6 March 2020, by the Ministry of Health [2]. The rapid spread of the disease led most countries to implement rules or recommendations on social distancing and to restrict many human activities. The scope of these restrictions, such as blocking or closing borders, varied considerably between countries, and many governments introduced a proactive response to control its spread [3,4,5,6].
The unusual reduction in human activity as a result of the containment measures to control the advance of the COVID-19 pandemic has made it possible to study the impact of such restrictions on society [7]. One direct impact has been the decrease in the use of public and private transport. Asdrubali et al. [8] provide an overview of many relevant findings related to how the noise climate was affected during the COVID-19 pandemic. Some studies observed a reduction in anthropogenic emissions, as for example, in the cities of Barcelona (Spain) [9], Almaty (Kazakhstan) [10], Rio de Janeiro (Brazil) [11], or Milan (Italy) [12], while others observed a reduction in environmental noise levels, as was the case in the city of Dublin (Ireland) [13] and in Stockholm (Sweden) [14,15]. In Muscat airport (Oman) [16], the values of LAeq and Lmax in June 2020 were 32% and 35% lower than the corresponding values in April–May 2019. Caniato et al. [17] studied the influence of the lockdown situation on environmental noise in a northern Italian city and its effects on people’s reactions. For this, in situ environmental noise was measured at four different points, and an international survey was carried out. The results showed, on the one hand, a significant reduction in noise levels and, on the other hand, that people clearly perceived these noise variations, both outdoors and indoors. From the survey, it was found that people had a positive reaction to the noise reduction with no significant differences at the international level.
Some unexpected results were found when studying the effect of the lockdown in three urban protected areas in Boston (USA) [18]. In two of these areas, the sound levels during the lockdown were lower than before, but in one of these areas, the sound levels were 4–6 dB higher during the time of the pandemic, most likely because reduced traffic allowed vehicles to travel faster and create more noise.
Noise pollution due to road traffic is an important environmental problem that affects urban residents and affects their quality of life since it causes a series of adverse health effects [19]. In fact, the WHO estimates the amount of healthy life years lost in western Europe due to environmental noise to be 1.0 to 1.6 million disability-adjusted life years (DALYs). Furthermore, the WHO has classified the noise generated by road, rail, and air traffic as the second most important health contaminant in Western Europe, only behind the air pollution caused by very fine particles [20]. Besides, environmental noise may also alter the natural conditions of ecosystems [21].
As a general rule, the environmental noise level increases with the number of vehicles and with their speed [22]. Therefore, it is interesting to study the effect of the mobility restrictions on environmental noise, especially due to local transport systems. There are some such studies, for example, in the cities of Beijing, Enshi, Mudanjiang, and Hainan (China) [23], Tokyo (Japan) [24], Kanpur (India) [25], Milan (Italy) [26], Madrid (Spain) [27], Boston (USA) [18], Rio de Janeiro (Brazil) [28], Santiago (Chile) [29], or Buenos Aires (Argentina) [30].
In Peru, the Ministry of the Environment has established environmental quality standards for environmental noise according to the different areas of interest (DS N° 085-2003-PCM [31]), as can be seen in Table 1. Notice that the measurement periods are only two: day from 7:01 to 22:00 and night from 22:01 to 7:00. Comparisons to typical and recommended Lden and Lnight values are not straightforward since the time period of evaluation and/or calculations are not the same.
Few studies have been carried out in the city of Lima related to environmental noise within the city. In this context, in 2013 and 2015, the Directorate for Environmental Assessment (DEAM) of the Environmental Assessment and Enforcement Agency (Organismo de Evaluación y Fiscalización Ambiental, OEFA) carried out two environmental noise measurement campaigns on a specific daytime basis (during the hours of greatest vehicular traffic) and for a single period of 60 min per point. There were 250 monitoring points, with distributed 224 in Metropolitan Lima Province and 26 in the Constitutional Province of Callao. Eight of the ten highest SPL measurement points in Metropolitan Lima were located in a commercial area similar to the one under study in this paper, where the maximum SPL allowed is 70 dBA. In this commercial area, the SPL values varied between 81.8 dBA and 84.9 dBA. The other two higher SPL points were located in a special protection zone where the maximum SPL allowed is 50 dBA. At these two points, the measured SPL values were 81.6 dBA and 84.5 dBA [32]. In 2018, Garcia et al. [33] measured the 8:00 to 22:00 environmental noise levels on the perimeter of four hospitals in the city of Lima both during working days and non-working days. For each hour, the corresponding Leq was calculated as the average of three five minute periods They found that in all cases, all times, and all situations, the calculated Leq exceeded not only the corresponding ENQS of 50 dBA (special protected area) but also the less restrictive limits for residential (60 dBA) and commercial areas (70 dBA).
When the State of Health Emergency for COVID-19 was established in Peru in March 2020 (DS N° 008-2020-SA, of 11 March 2020), various legal provisions were established, including compulsory social immobilization (CSI). In the city of Lima, like in any other big city, these provisions modified behavioural patterns and the corresponding environmental noise. The main purpose of this paper is to study how the CSI has affected the environmental noise in a specific area of the city of Lima and to compare these environmental noise values to the values prior to the CSI, to the Peruvian environmental noise quality standards (ENQS), and to the WHO recommendations.
Secondary objectives are to create awareness concerning the need for further research in this field and to properly define noise mitigation action plans in Lima. According to the Peruvian Normative [31], in the areas where the measured LAeq values are above ENQS, it is mandatory to adopt an action plan for the prevention and control of noise pollution that includes the policies and actions necessary to achieve the standards corresponding to its area within a maximum period of five (5) years. Considering that 78.3% of the population of Peru lived in a urban environment in 2020 [34] and that 29.9% of the population of Peru lives in Lima province [35], developing such action plans requires, first of all, a detailed and precise identification of the noise sources and a good estimation of the number of people affected by noise. Concerning how to estimate the population affected by high noise levels, Licitra et al. [36] point out the differences between models and the importance of making proper estimations of both the noise levels in the façades and of the affected population in order to properly define effective and cost-efficient action plans. Recently, a study in the city of Athens [37] compared in situ measured noise levels on two façades to the values predicted by the CRTN model, concluding that the results were rather consistent, although the model had a tendency to slightly underestimate the façade noise levels.

2. Methodology

The details concerning the methodology are presented here. First, the measurement area is characterized, then the different mobility restrictions over a period of 105 days are defined, and lastly, the measurement procedure and different measurement campaigns are described.

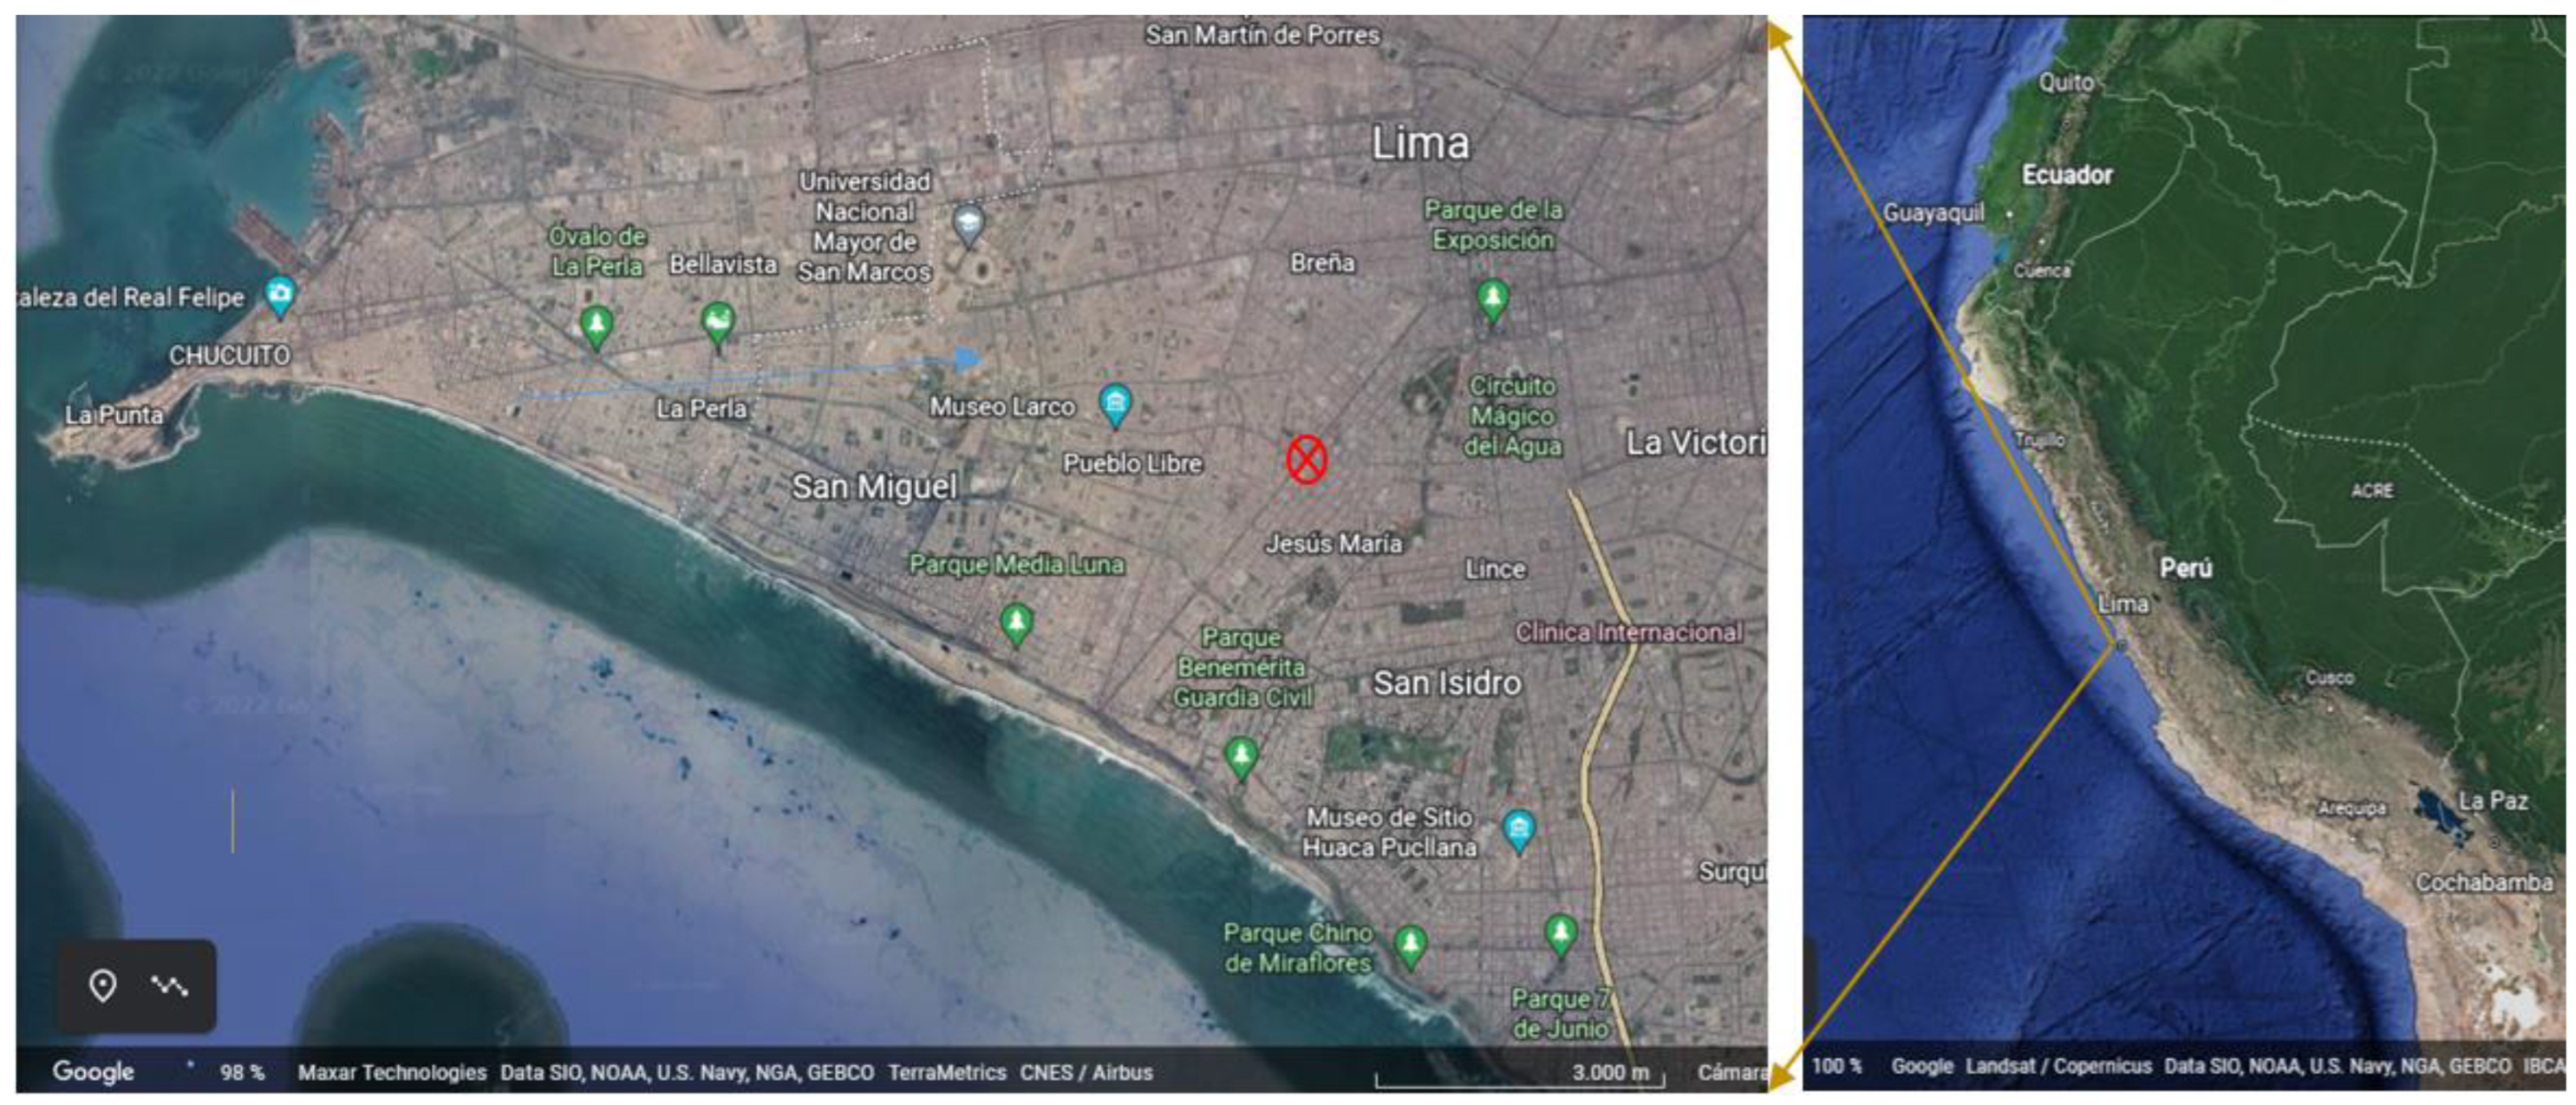
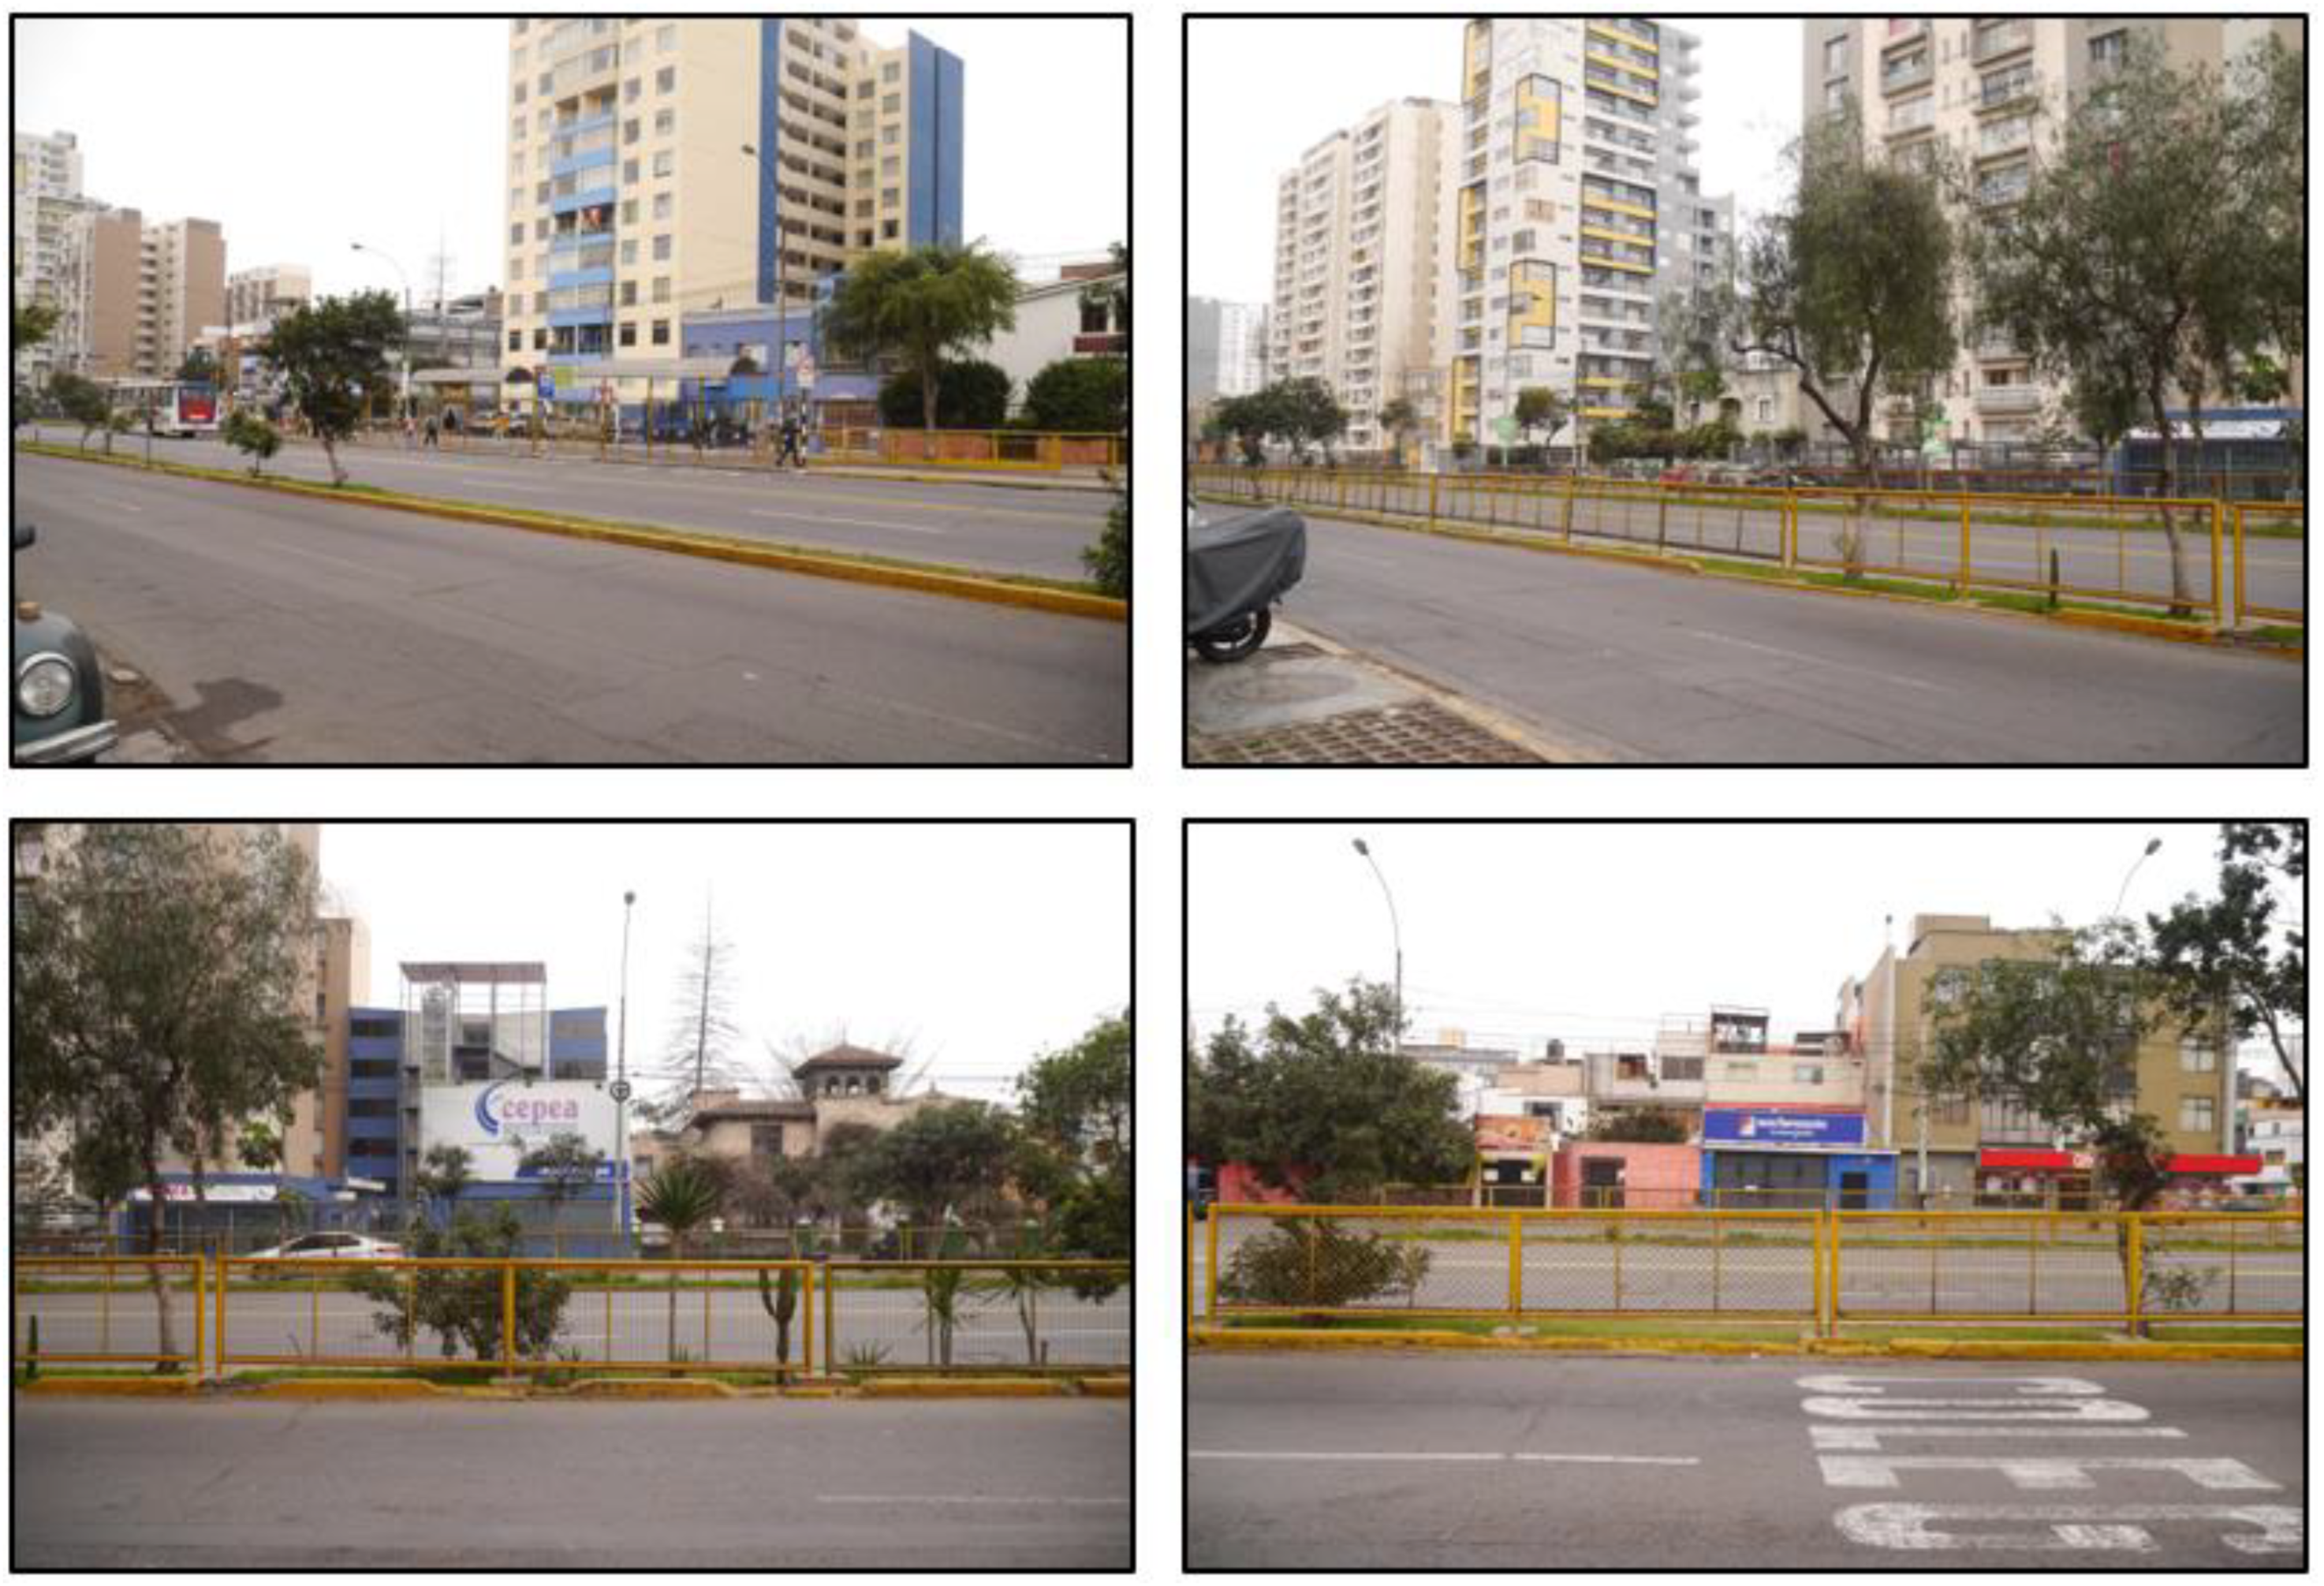
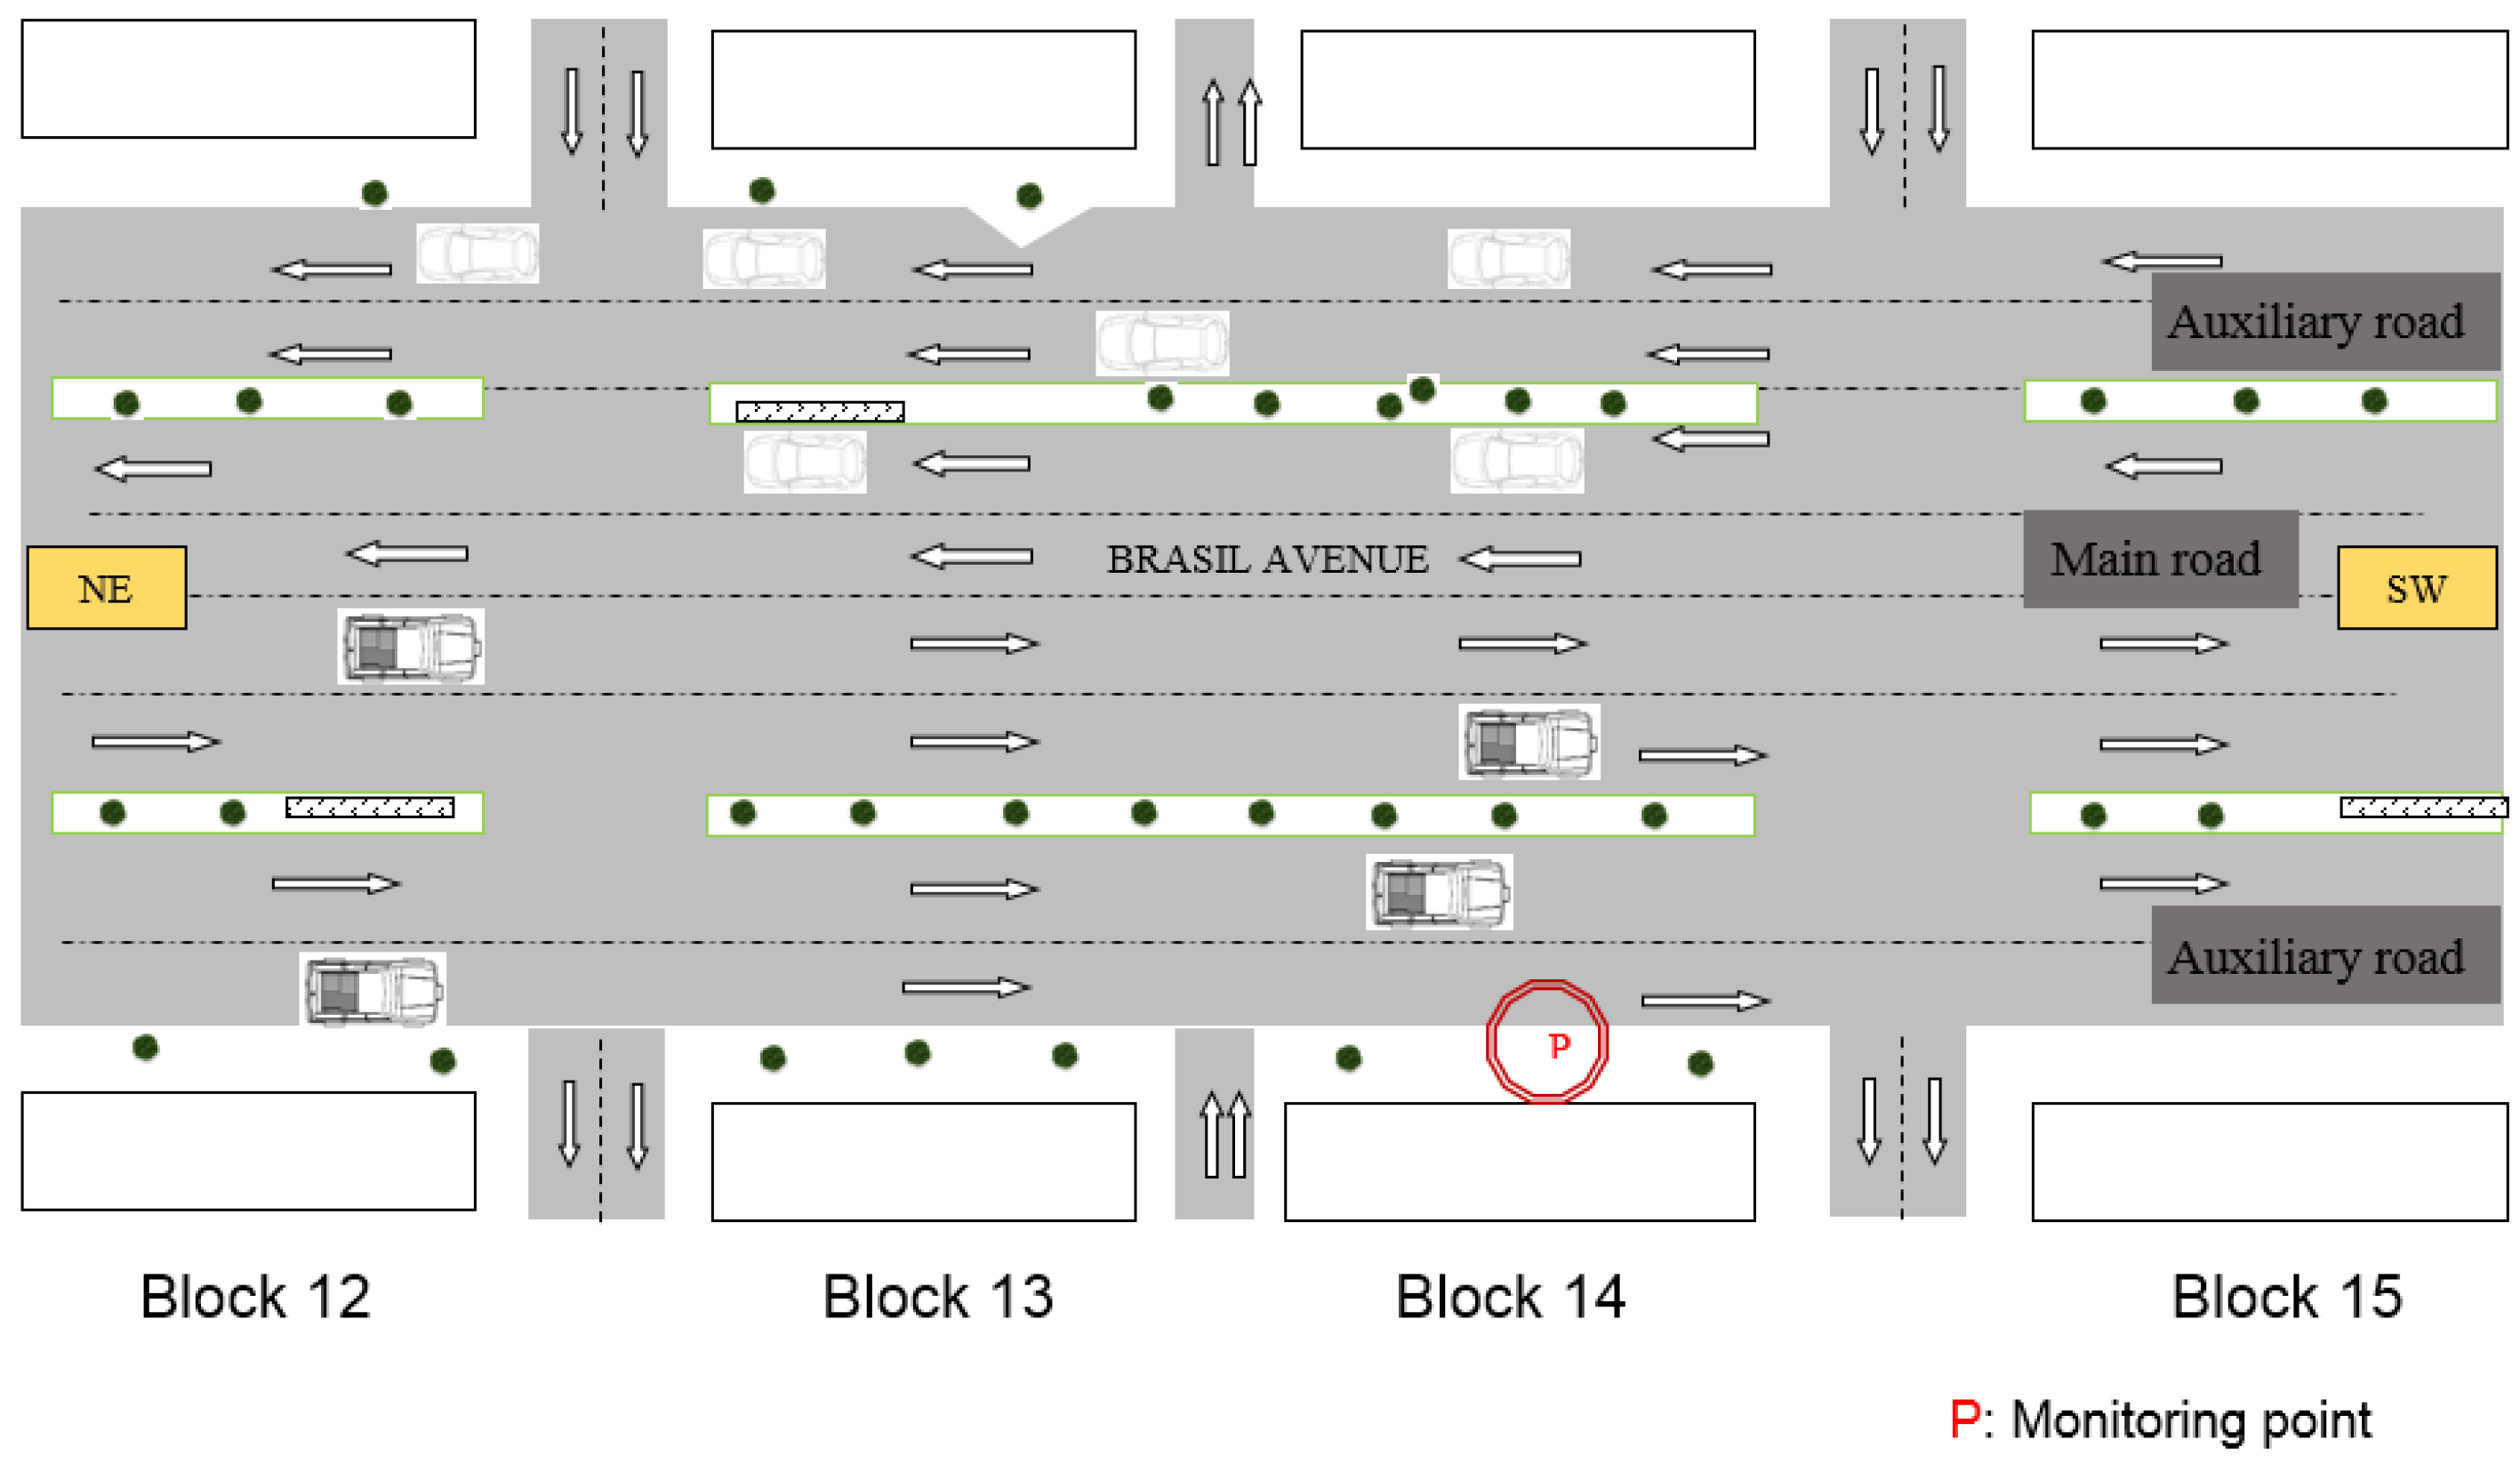
2.1. Measurement Area

During the CSI, only essential workers were allowed to move more than 500 m from the residence point, and there was a district surveillance service enforcing this measure. When this research was planned, it was agreed with the corresponding district surveillance service to allow making SPL measurements but just at one point within the allowed distance from the residence of one of the authors.
Figure 1 shows the situation of the measurement point within the city of Lima.
In Lima, there are different types of roads, as indicated by ordinance No. 341 that approves the plan of the metropolitan road system of Lima [38]. Among all the different types of roads, arterial roads are those that carry appreciable volumes of traffic between main traffic generation areas and where traffic flows at medium/high traffic speeds. There are few “at level” crossing points and, in most cases, there are under/over passes to guarantee a good speed of circulation, at least in the lanes reserved for public transport.
Brasil Avenue is a 4.7 km long arterial road that runs along 42 blocks and communicates six different districts: Lima, Breña, Jesús María, Pueblo Libre, and Magdalena del Mar, which together gather 572,633 inhabitants, representing 6.7% of the population of Metropolitan Lima according to the census of the Statistics and Computing National Institute (INEI) [35]. It has four central lanes for authorized high-capacity public transport (two in each direction) and four external lanes (two on each side) for private vehicles, taxis, cargo vehicles, and motorcycles. These outer lanes are separated from the central lanes by a narrow space covered with grass, a few trees, and a hollow metal fence, as shown in Figure 2.
Concerning the environmental noise requirements shown in Table 1, the area is considered commercial, although there are many residential buildings up to 20 stories high, as shown in Figure 2, besides the existing commercial activities (supermarkets, restaurants, mini-markets, shopping centre, polyclinic, etc.).
The measurement point (Figure 3) was located in front of block 14 on Brasil Avenue, close to the lateral auxiliary lane (traffic from NE to SW. On block 14 there are approximately 219 residential apartments overlooking Brasil Avenue, which represent 95.2% of the dwellings in the block. The microphone was placed 1.5 m high and 3 m from the façade of an 18-story residential building. In fact, it was placed over 1 m from a hollow fence and 2 more meters from the façade itself, as shown in Figure 4. This is in accordance with the Peruvian Protocol for Environmental Noise Monitoring [39], which allows for a minimum height of 1.5 m and minimum distances from façades of 3 m to avoid screening and/or reflection effects. Smaller façade/microphone distances are allowed if the corresponding corrections are calculated.

2.2. Mobility Restriction Stages during the Research Period

During the research period, various legal provisions were issued, including six different conditions of compulsory social immobilization (CSI). Simultaneously, the resumption of economic activities was gradually adopted in three different phases, as shown in Table 2.
These mobility restrictions obviously affected the day/night periods included in the calculation of Leq day and Leq night differently. For example, during immobilizations 2 and 3, there was a period of four hours of immobilization during “day time”, whereas for immobilization 6 all the hours included in the Leq day calculation had no mobility restrictions.

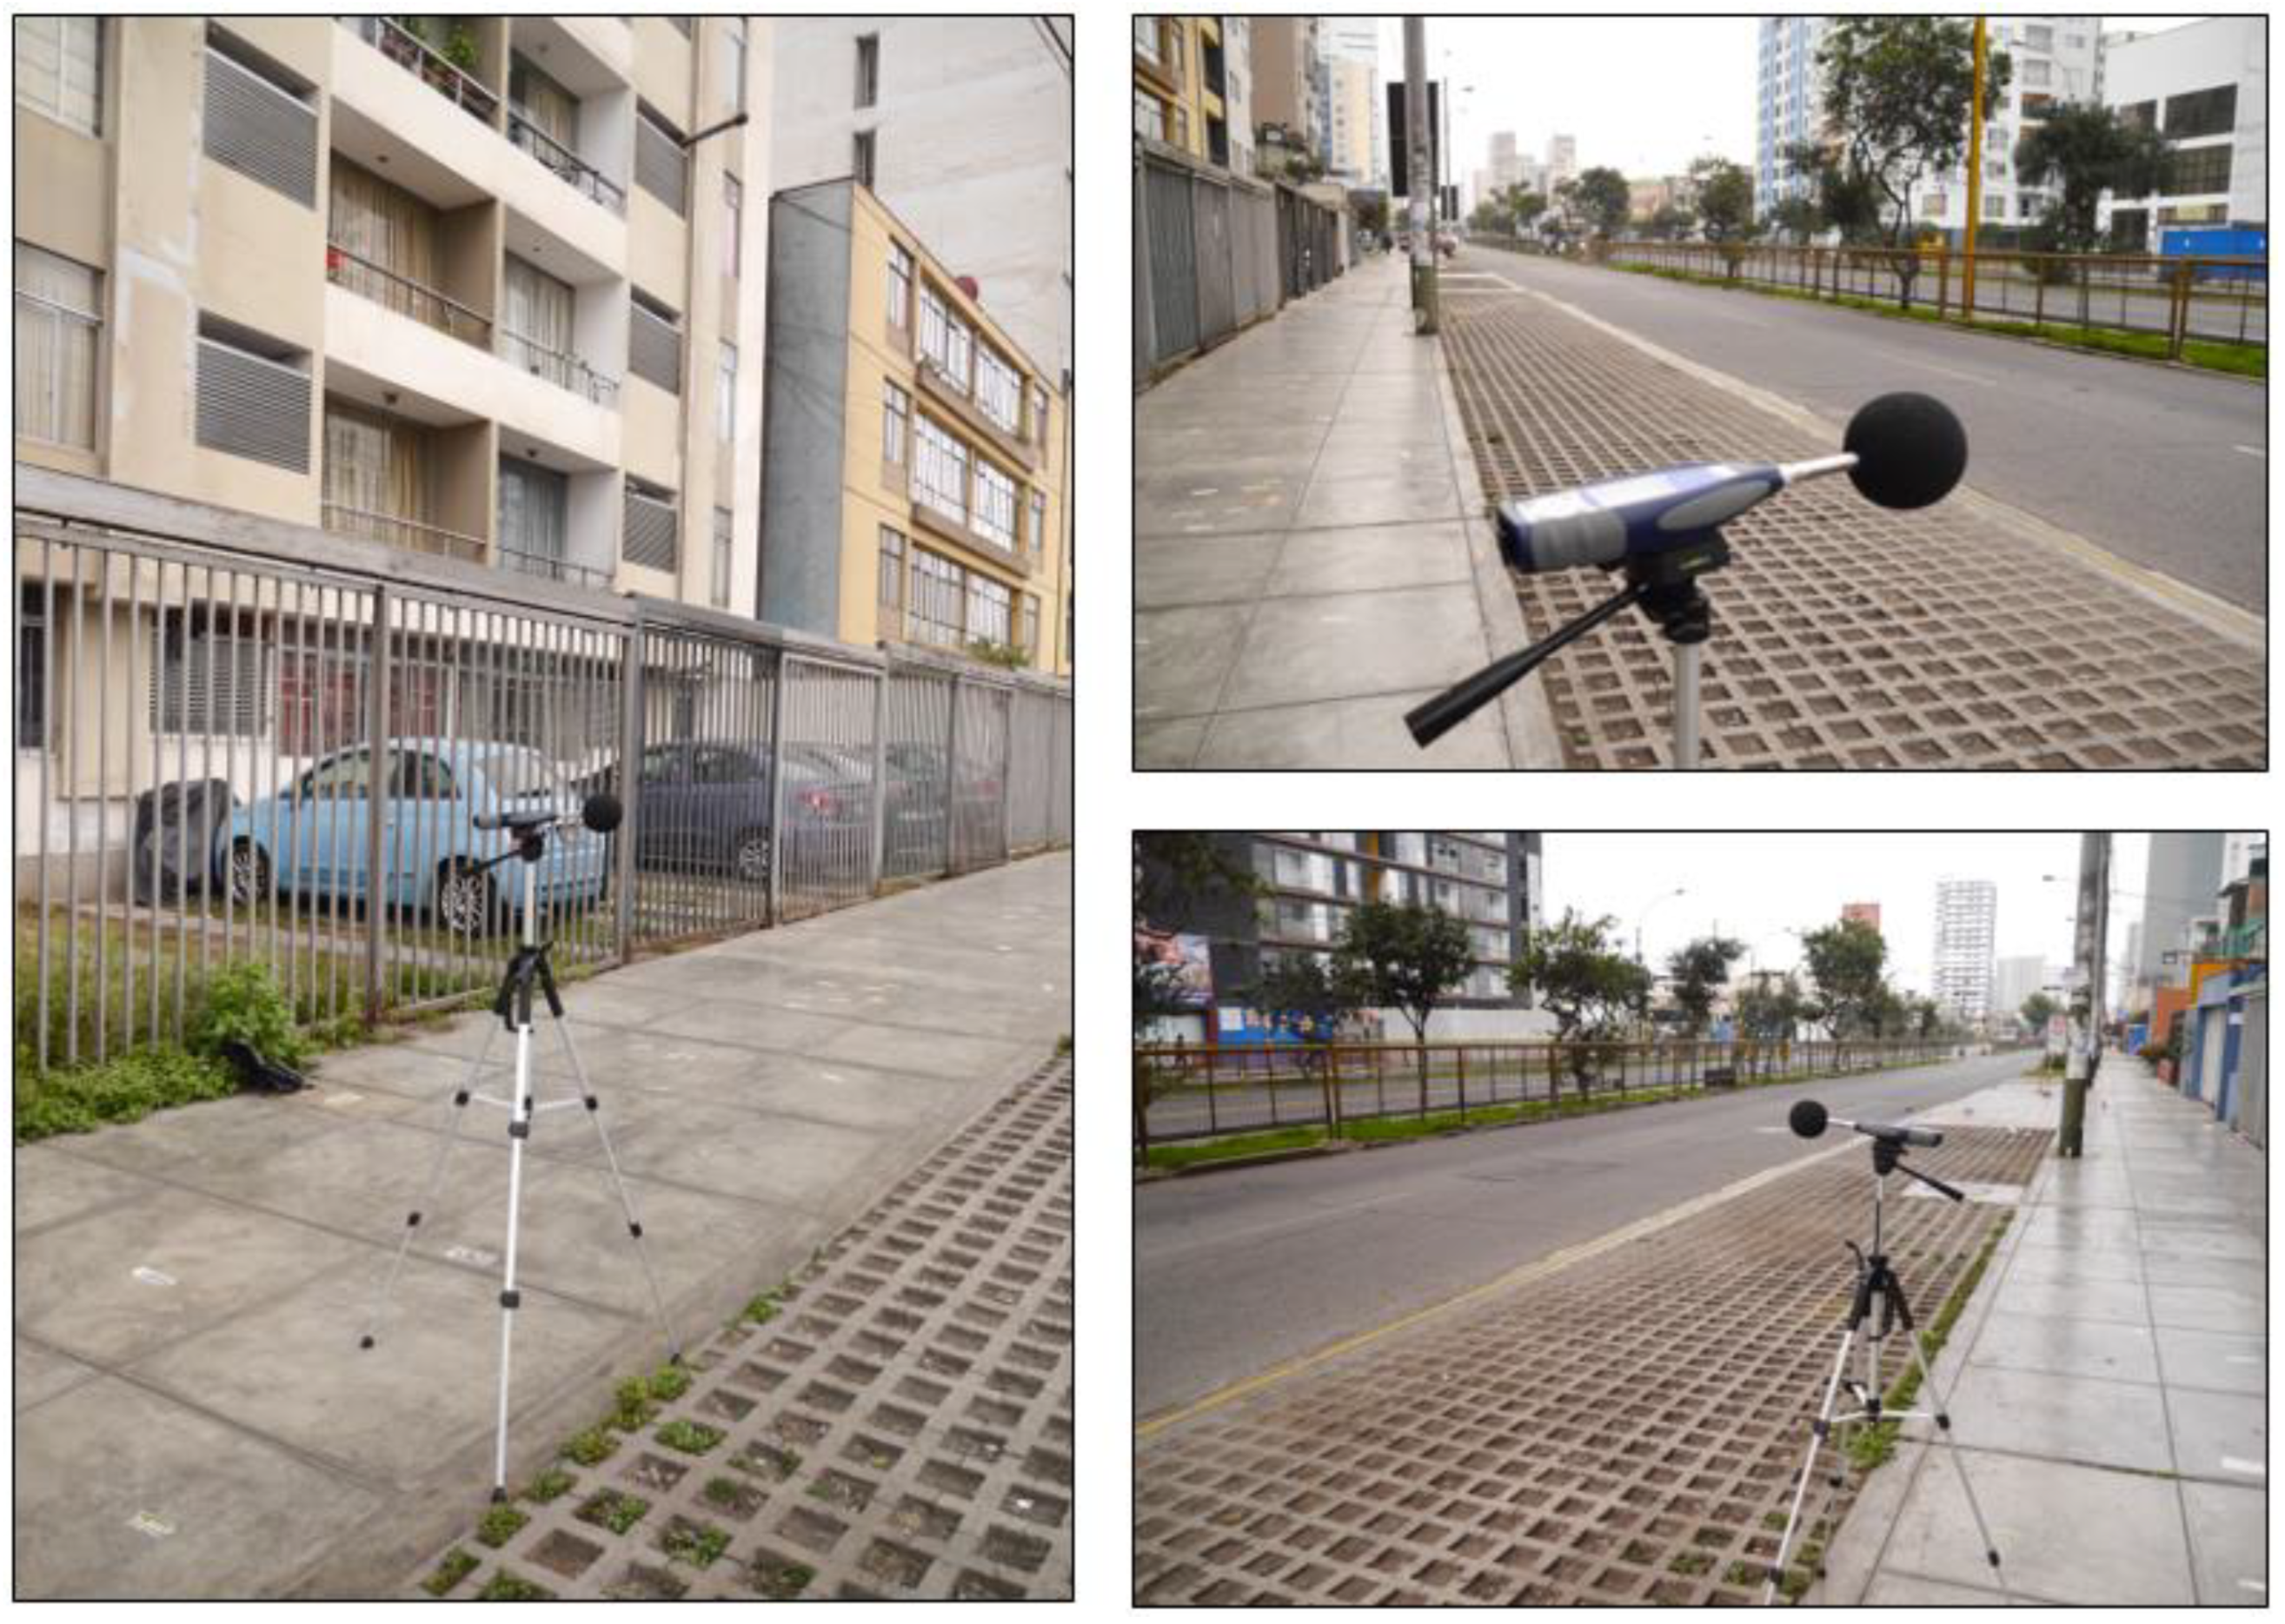
2.3. Measurement Method
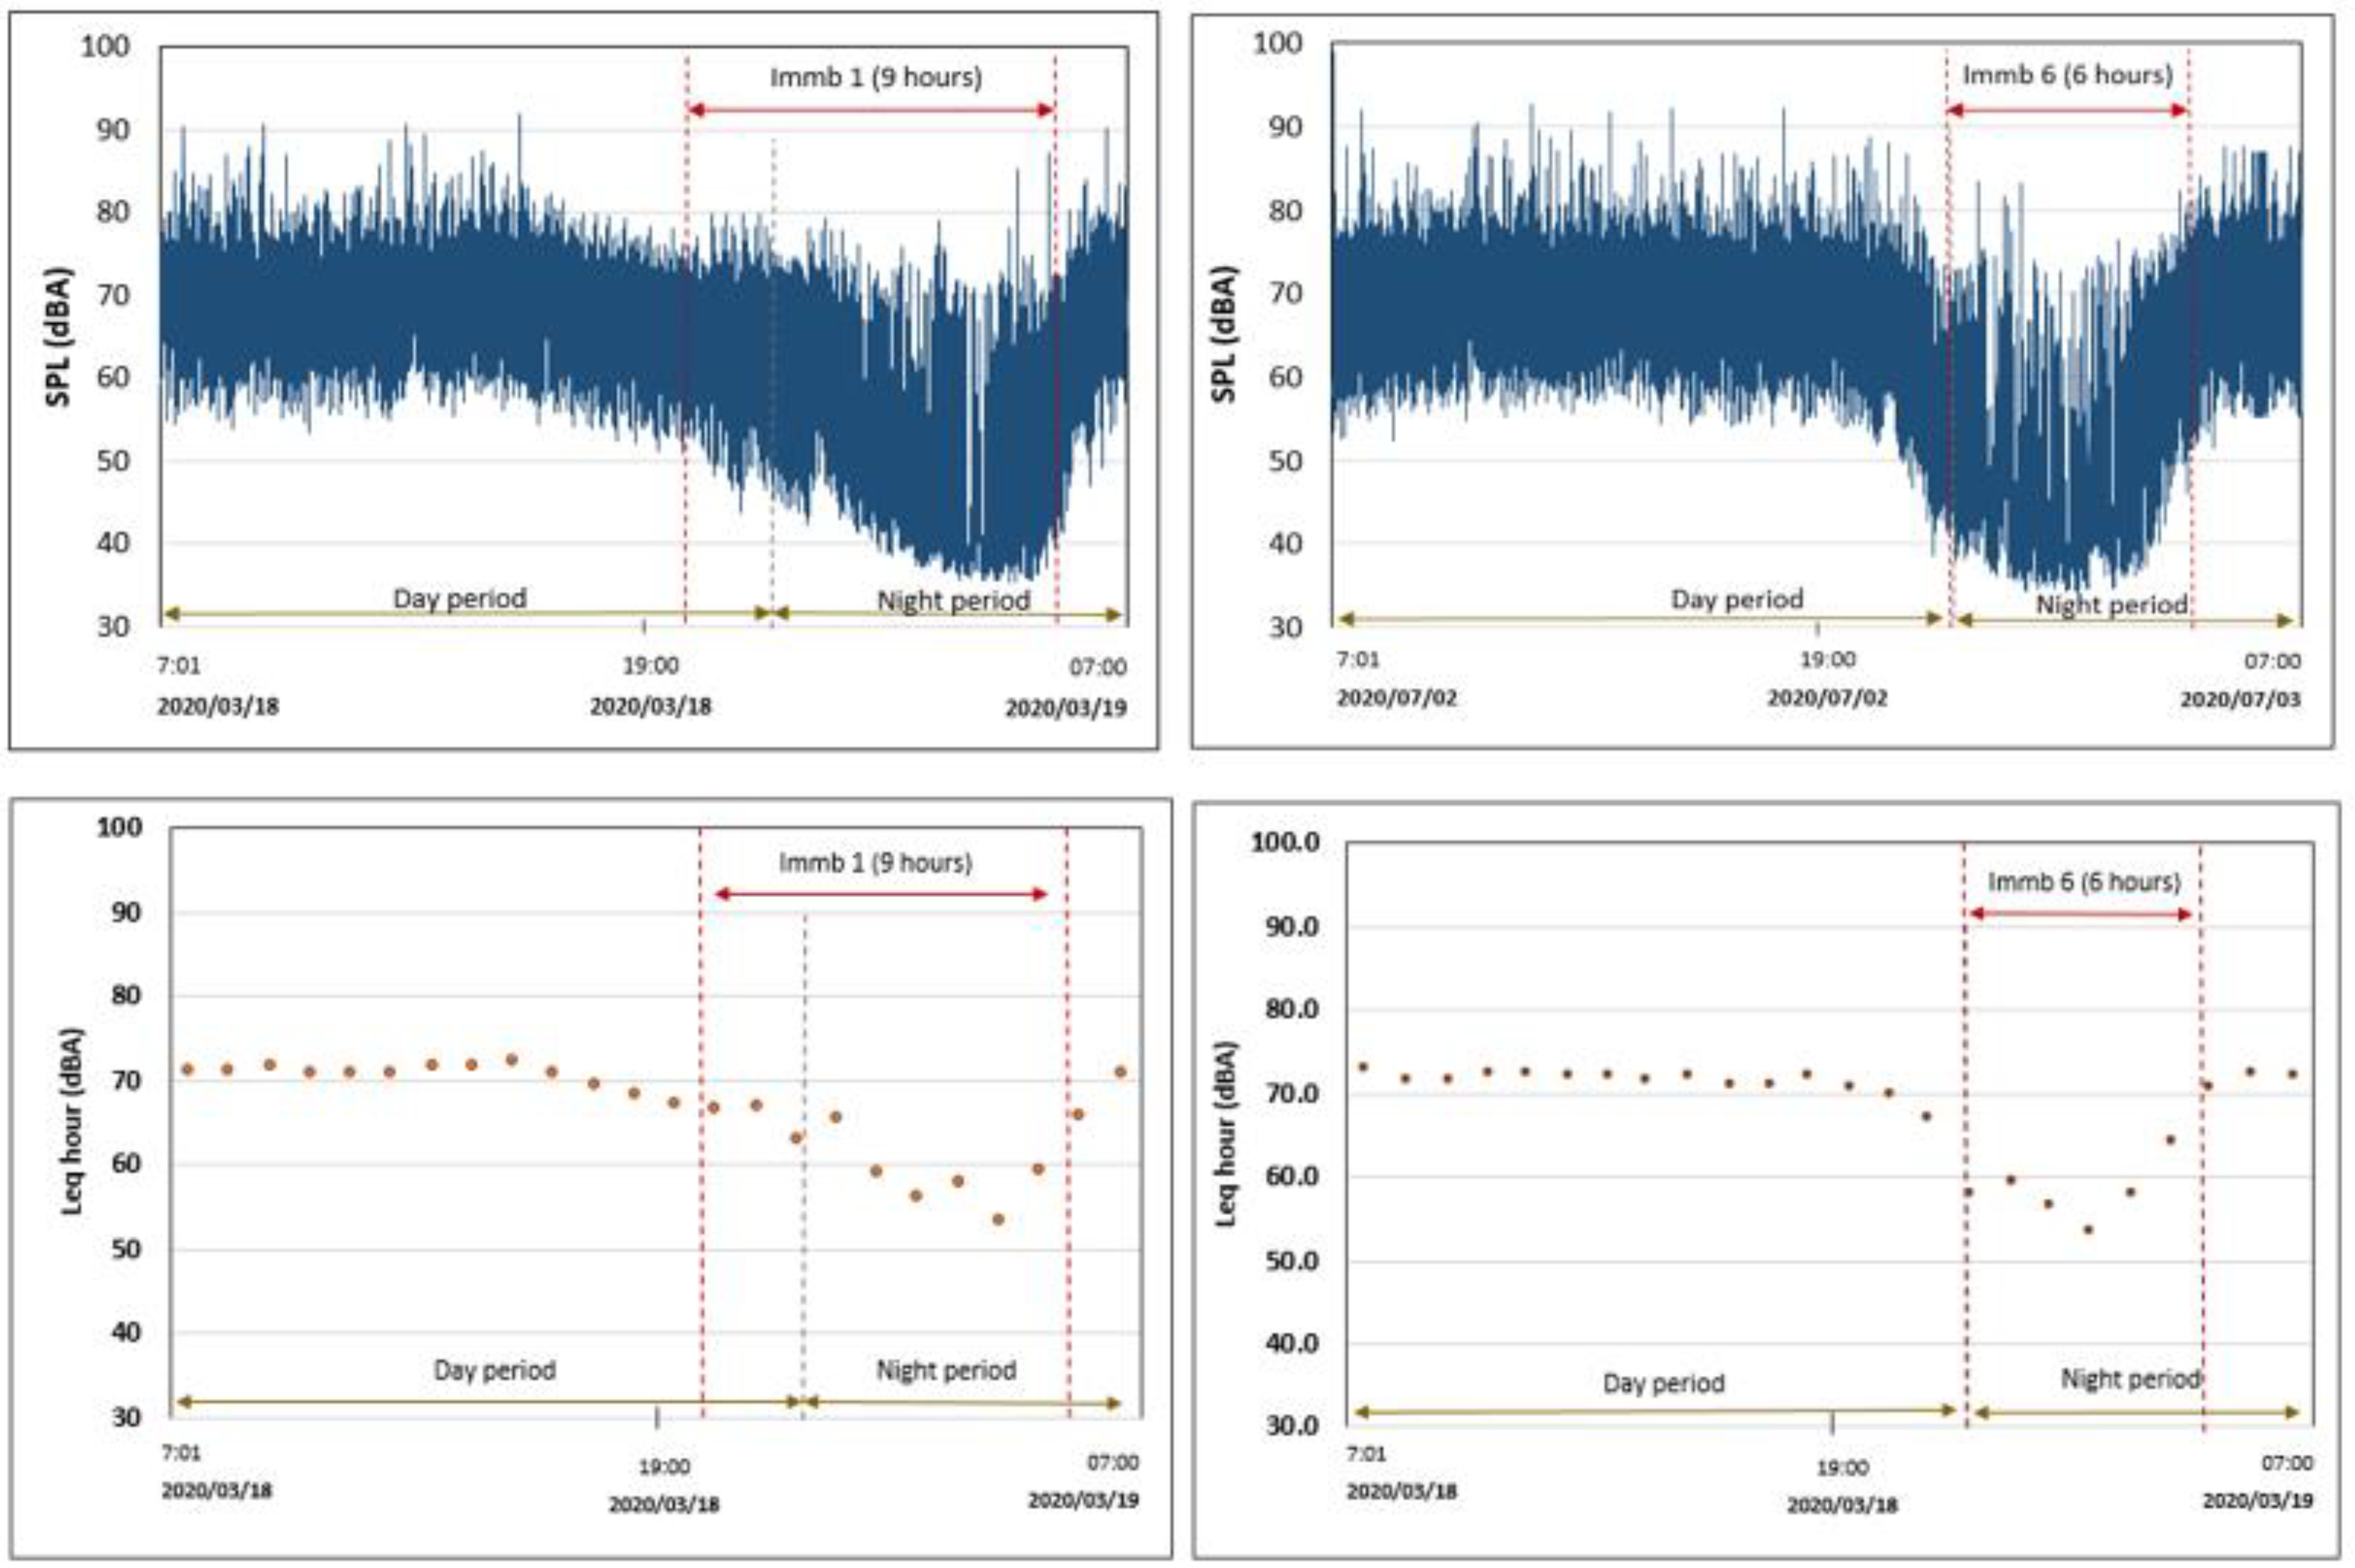
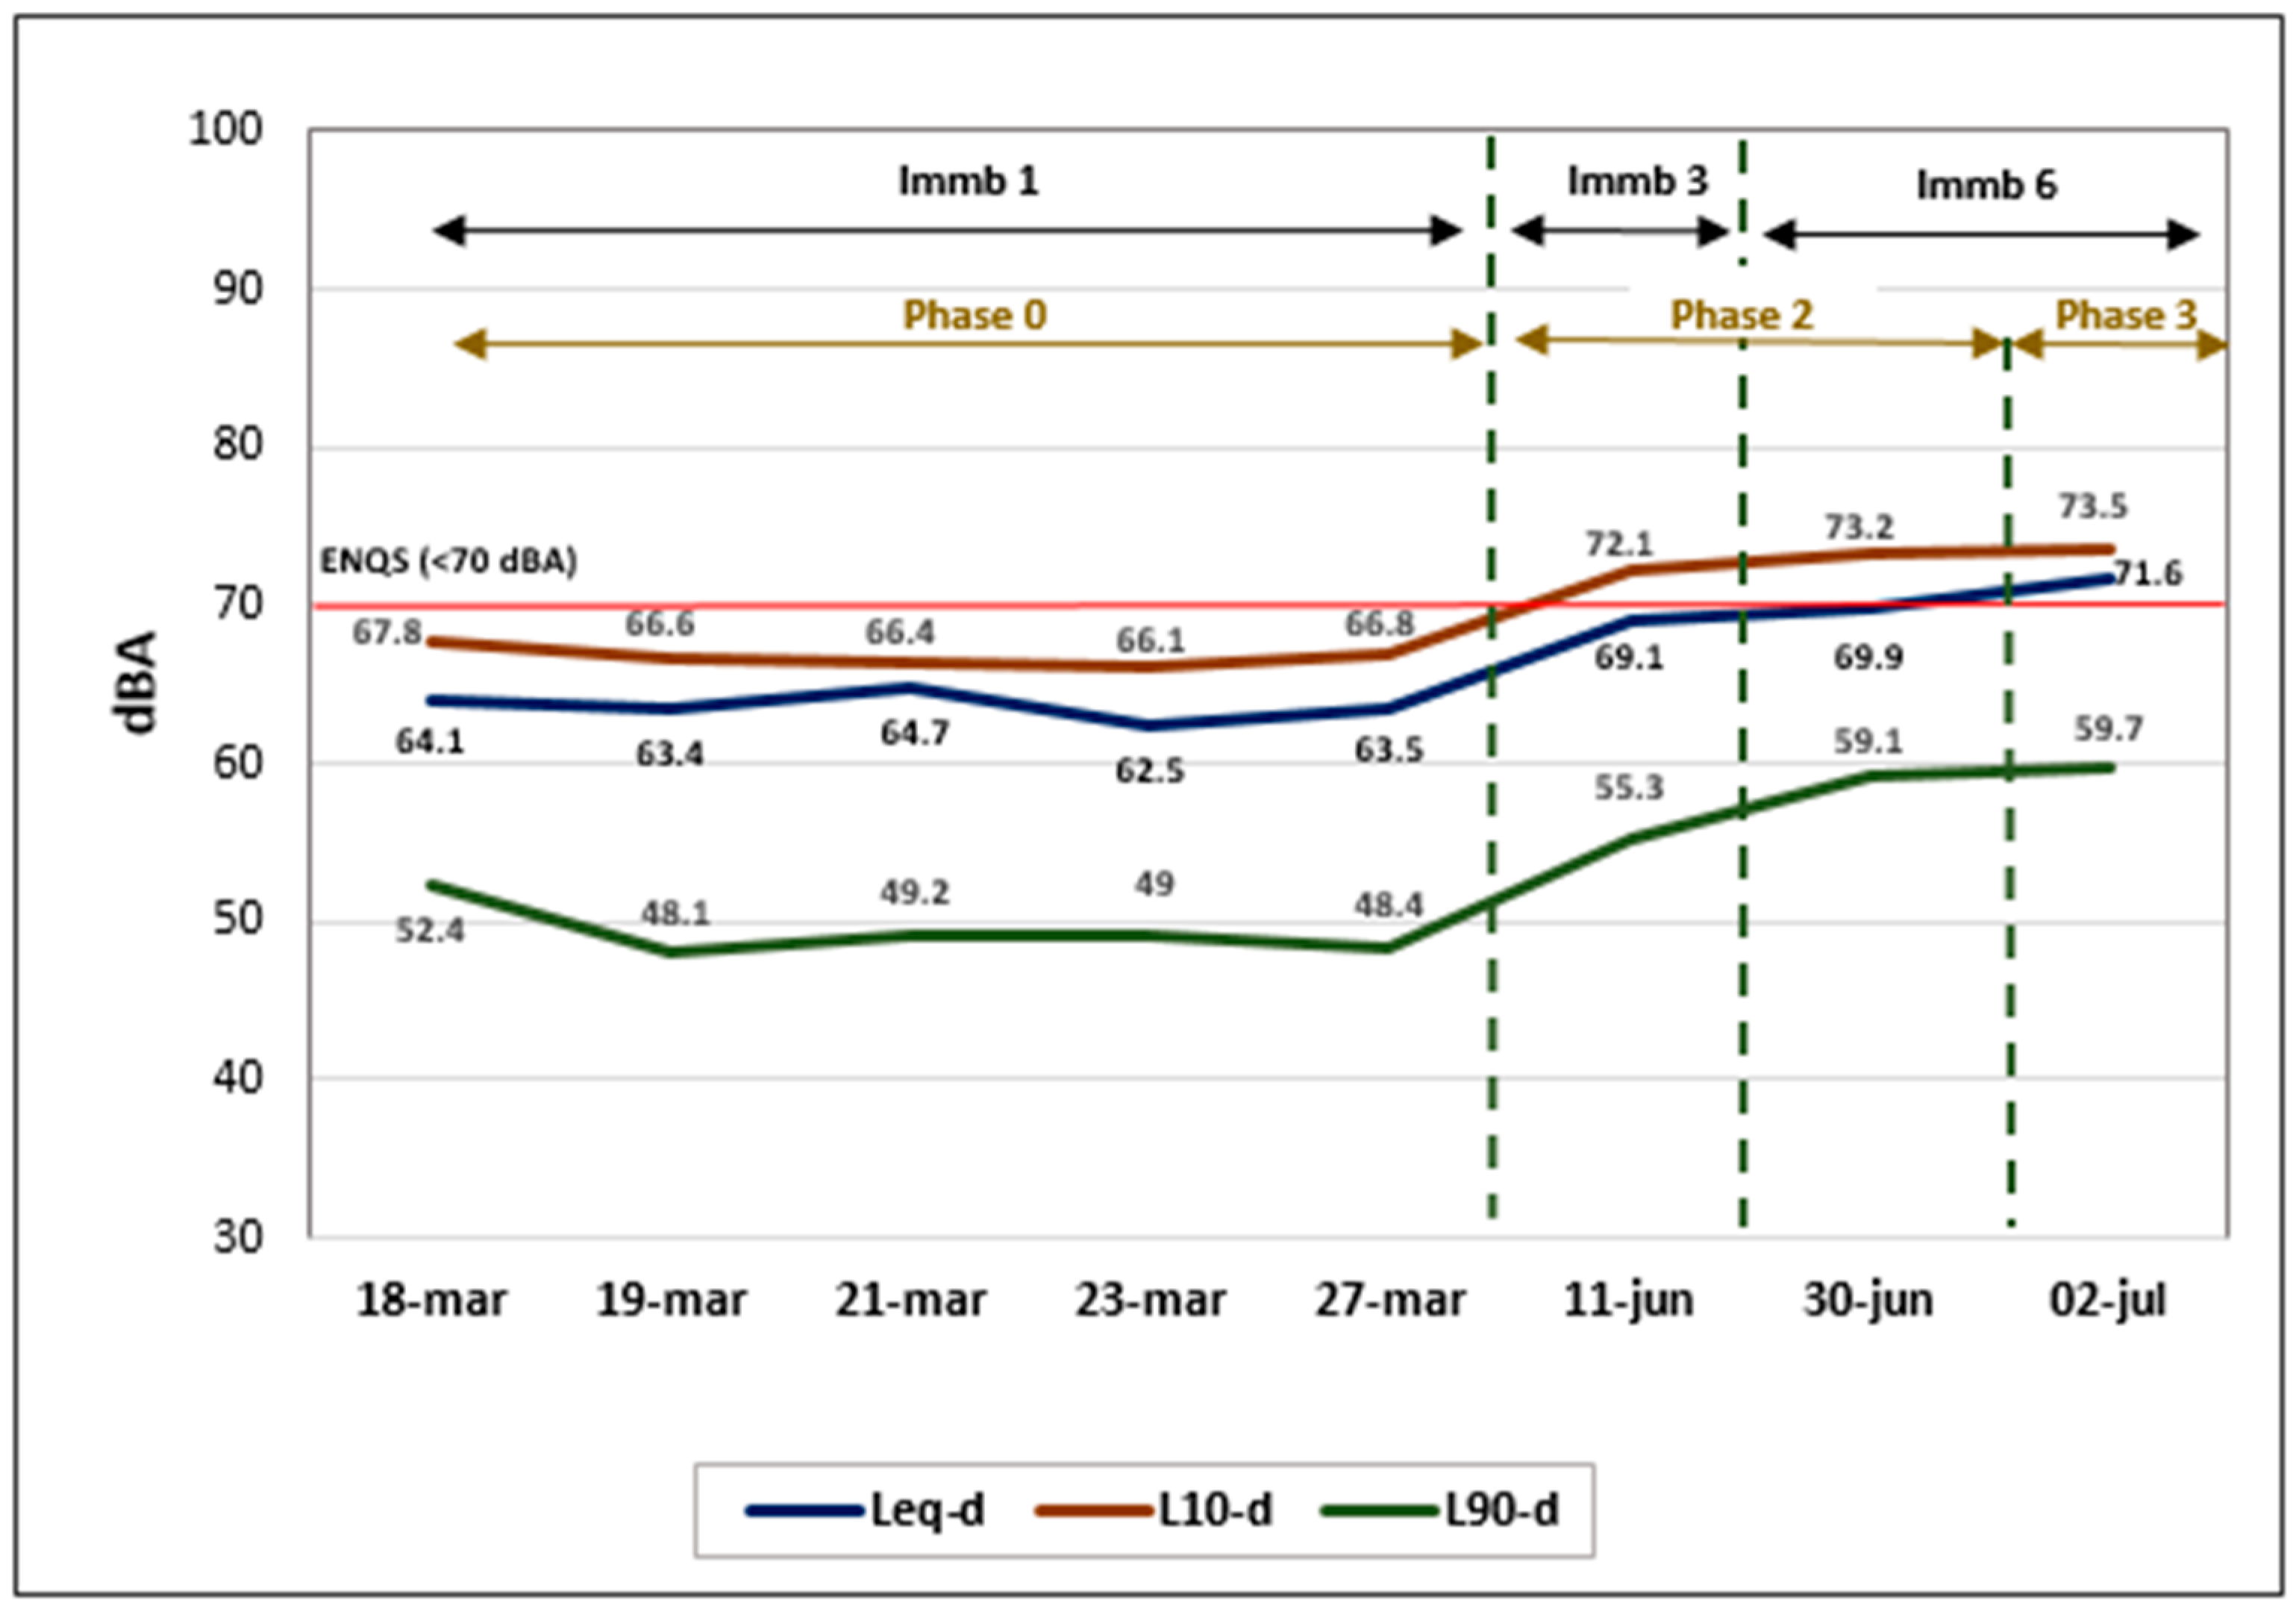
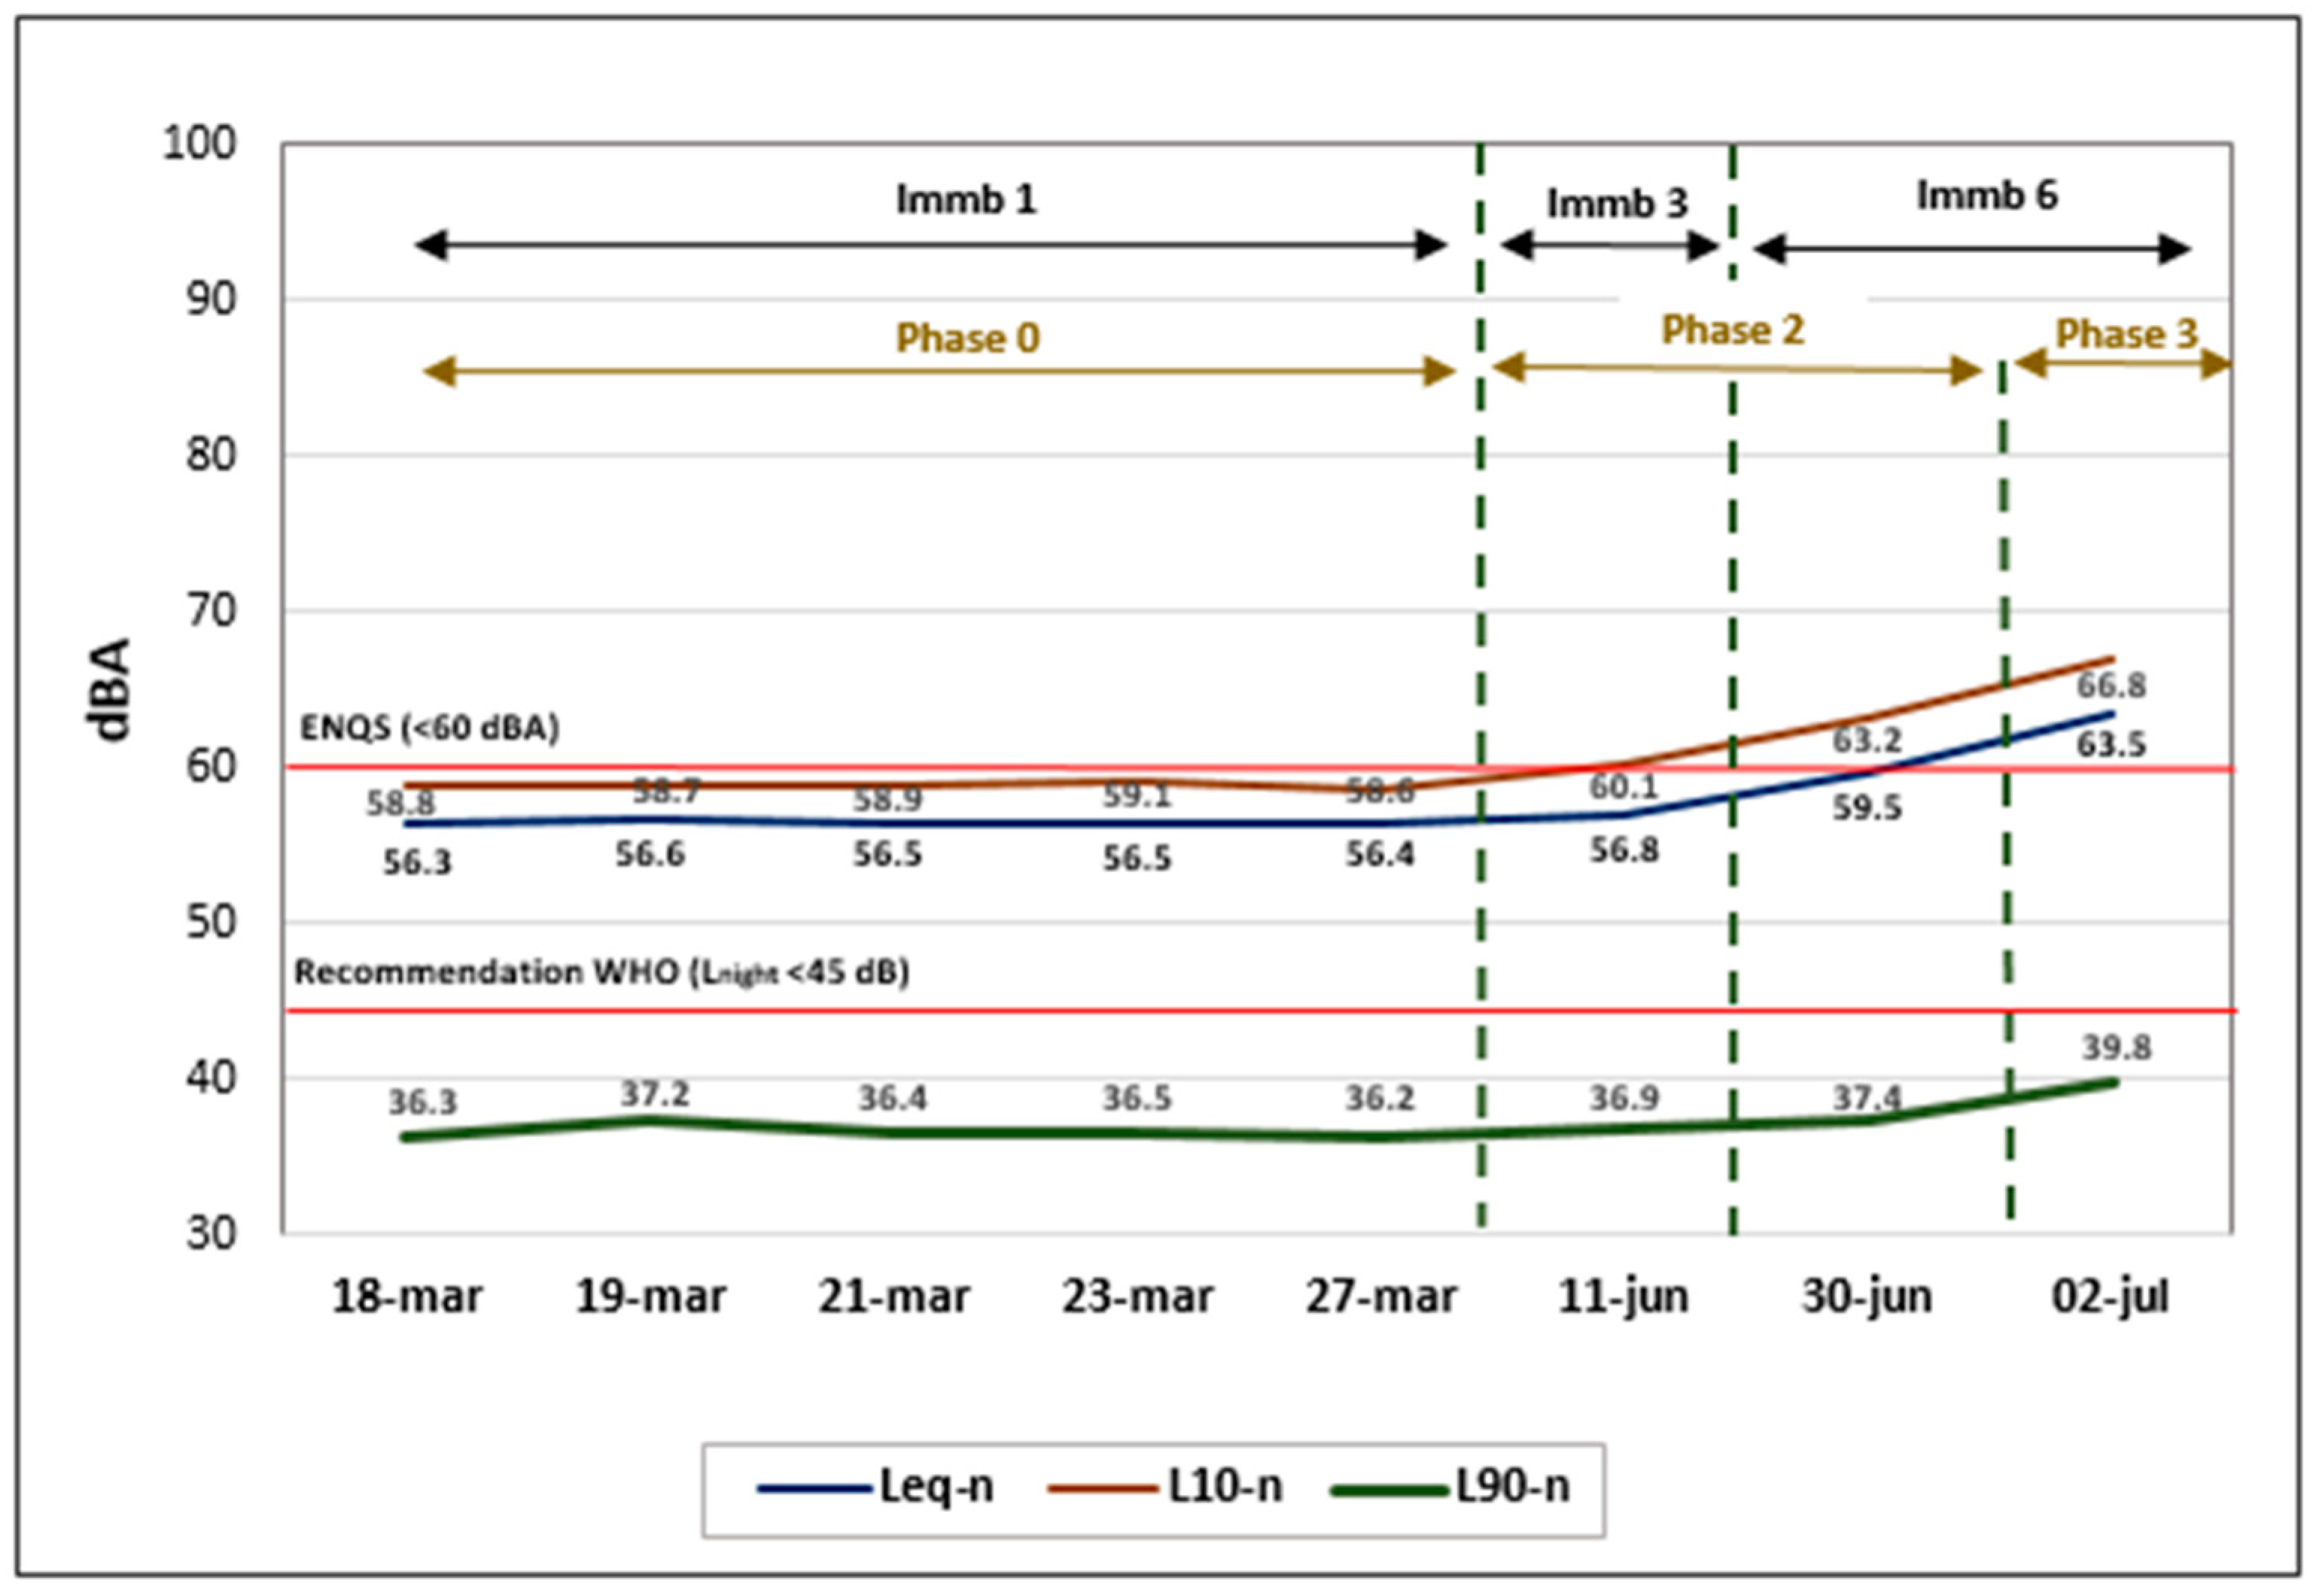
To carry out the measurements, a class 1 sound level meter, model BSWA 308, was used. The SPL was measured every second according to the procedure indicated in the National Noise Monitoring Protocol [39] (which is based on the Peruvian Technical Standards NTP-ISO 1996-1 and NTP-ISO 1996-2) during a 24 h period (daytime and at night-time), as established in Supreme Decree No. 085-2003-PCM [31]. For each measurement, the corresponding day/night Leq, Lmax, Lmin, L10, and L90 were calculated. As previously mentioned, the sound level meter was placed at a height of 1.50 m and more than a 3 m distance from the building façade to avoid shielding and/or reflection by nearby surfaces.
The full measurement campaign consisted of eight measurements, each of them at different stages of the compulsory social immobilization. The first five measurements were conducted during the first two weeks, which correspond to the first immobilization (Immb 1) condition. In this case, the immobilization period was 9 h long. The sixth measurement was carried out in week 13 under the influence of the third immobilization (Immb 3), which was 10 h long. Finally, the last two measurements were performed during week 16 under the influence of the sixth immobilization (Immb 6), which was only 6 h long. See Table 3.
On each of the monitoring days, the traffic flow was recorded using a manual meter. The flow was counted during three different time periods: T-1: rush hour (07:00–8:00 h); T-2: regular period (12:00–13:00), and T-3: social immobilization period (22:00–23:00). Additionally, the corresponding hourly Leq was also calculated (Leq 7–8, Leq 12–13, and Leq 22–23).

3. Results

After the measurement campaign, all the data were processed and duly analysed. First, the evolution the different SPL descriptors along the different CSI periods are presented. Secondly, the results are compared to the existing regulations/recommendations and to some results obtained under no-restriction conditions. Lastly, the effect of traffic flow reduction on the SPL during the CSI is studied.

3.1. SPL Evolution. Comparison to Existing Regulations and to Values Prior to the CSI

Figure 5 (top) shows the registered SPL over a 24 h period, both on the first day of the CSI (18th March—Figure 5 (left)) and 105 days later (2nd July—Figure 5 (right). Figure 5 (bottom) shows the corresponding calculated LAeq 1hour. In Figure 5 (bottom left), a decrease in hourly LAeq can be seen approximately 4 h before the start of the immobilization (Immb 1), while in Figure 5 (bottom right) this LAeq decrease appears only 1 h before the start of the immobilization (Immb 6) despite the fact that, in this case, the immobilization started later and was considerably shorter (6 h compared to 9 h). This result is coherent with the fact that on the first day of immobilization the population was very concerned and worried about the upcoming uncertain scenario. People locked themselves in their homes much before the start of the immobilization, whereas after several months of mobilization restrictions, the population remained active (commerce, transport, social life, etc.) until almost the beginning of the restriction time.
Table 4 shows the global Leq values, Lmax and Lmin, over the day (7:01 to 22:00) and night (22:01 to 7:00) periods for the eight different measurement days. On the first day of social immobilization, global Leq values (64.1 dBA day /56.3 dBA night) remained below the limits indicated by the Peruvian environmental noise quality standards (ENQS) for a commercial area (70 dBA day /60 dBA night). These limits were not exceeded in the successive measurements, except for the last measurement day, when the economic activity had increased considerably and the immobilization period was just 6 h.
On 2nd August 2017, Rodríguez R. [41] conducted a similar study in the same area (block 14) with one single measurement from 07:00 to 11:30 and with no restrictions whatsoever. His result was Leq = 76.6 dBA. Additionally, as mentioned in the Introduction Section, in 2018 García Rivero et al. [33] performed an environmental noise study in the surroundings of four Lima hospitals. One of the hospitals under study (H3) is also located on Brasil Avenue, approximately eight blocks away from block 14 but next to the crossroad with Av. 28 de Julio, which is a collector type of road with high traffic density. In this case, the calculated Leq (16 h) values were 88.54 dBA for working days (Monday to Friday) and 85.35 dBA for non-working days (Saturday and Sunday). These results are higher than the ones found by Rodríguez in 2017, which is a logical result considering that the measurement points are considerably different, one located along a large Avenue (Rodríguez) and another one at the junction of the same large avenue with another important collector road (García Rivero). In fact, the 15 min traffic flow for Rivero was 713 and 477 (working/non-working day), which is considerably higher than that observed by Rodríguez in front of block 14 on Brasil Avenue. Both of these studies were also performed according to the Peruvian Protocol [39], and in both cases the height of the microphone was 1.5 m.
If the results found prior to the lockdown are compared to the ones in Table 4, it can be concluded that, in spite of a gradual increase in Leq day as the CSI became less strict and the economic activities were gradually resumed, the environmental noise did not reach the “typical” level prior to the CSI due to the COVID-19 pandemic. This means that, for a period of four consecutive months and for the area around block 14 in Brasil Avenue, the population enjoyed a quieter environment, which undoubtedly was one of the few positive outcomes of the CSI. This result cannot be directly extended to all Metropolitan Lima, but most likely a similar effect would have been observed on most of the arterial roads in the city.
Figure 6 and Figure 7 show, for the day and night periods, respectively, the evolution of Leq, L10, and L90 as well as the corresponding Peruvian environmental noise quality standards (ENQS) and WHO recommendation for the night period.
As can be seen, for the same measurement conditions (first four measurements during immobilization 1, phase 0), the values of Leq, L10, and L90 (day/night) had very little variation. When the CSI conditions became less severe and economic activities were gradually resumed, all three parameters increased gradually but not equally. The L10 increased +5,7 dBA during the daytime period and +8 dBA for the nighttime period, whereas L90 increased +7,3 dBA during daytime period and +3.5 dBA for the nighttime period. These results are consistent with the fact that in all cases there was at least 6 h of CSI during the night period, and thus the night background level did not increase as much as the day background level.
The most relevant result, nevertheless, is to realize that, on the last measurement day, in a typical commercial/residential area in Lima and in spite of having a 6 h lockdown (from 22:00 to 4:00) and having most commercial activities in the area limited to 50–40% of their typical capacities, the day and night noise levels were above the national recommendations. Furthermore, during the night period, which considers only one more hour (22:01 to 7:00) than the standard night period (23:00 to 7:00), noise levels were way above WHO recommendations (Lnight ≤ 45 dB) [20] from the first day of CSI. Concerning the day period, it is not straightforward to compare the results to WHO’s recommendations (Lden ≤ 53 dB [20]), but in light of Figure 6 and Figure 7, it is easy to infer that the Lden at the measurement point would also be much above WHO’s recommendations, even under strict immobilization conditions (the three last measurement days during immobilizations 3 and 6).

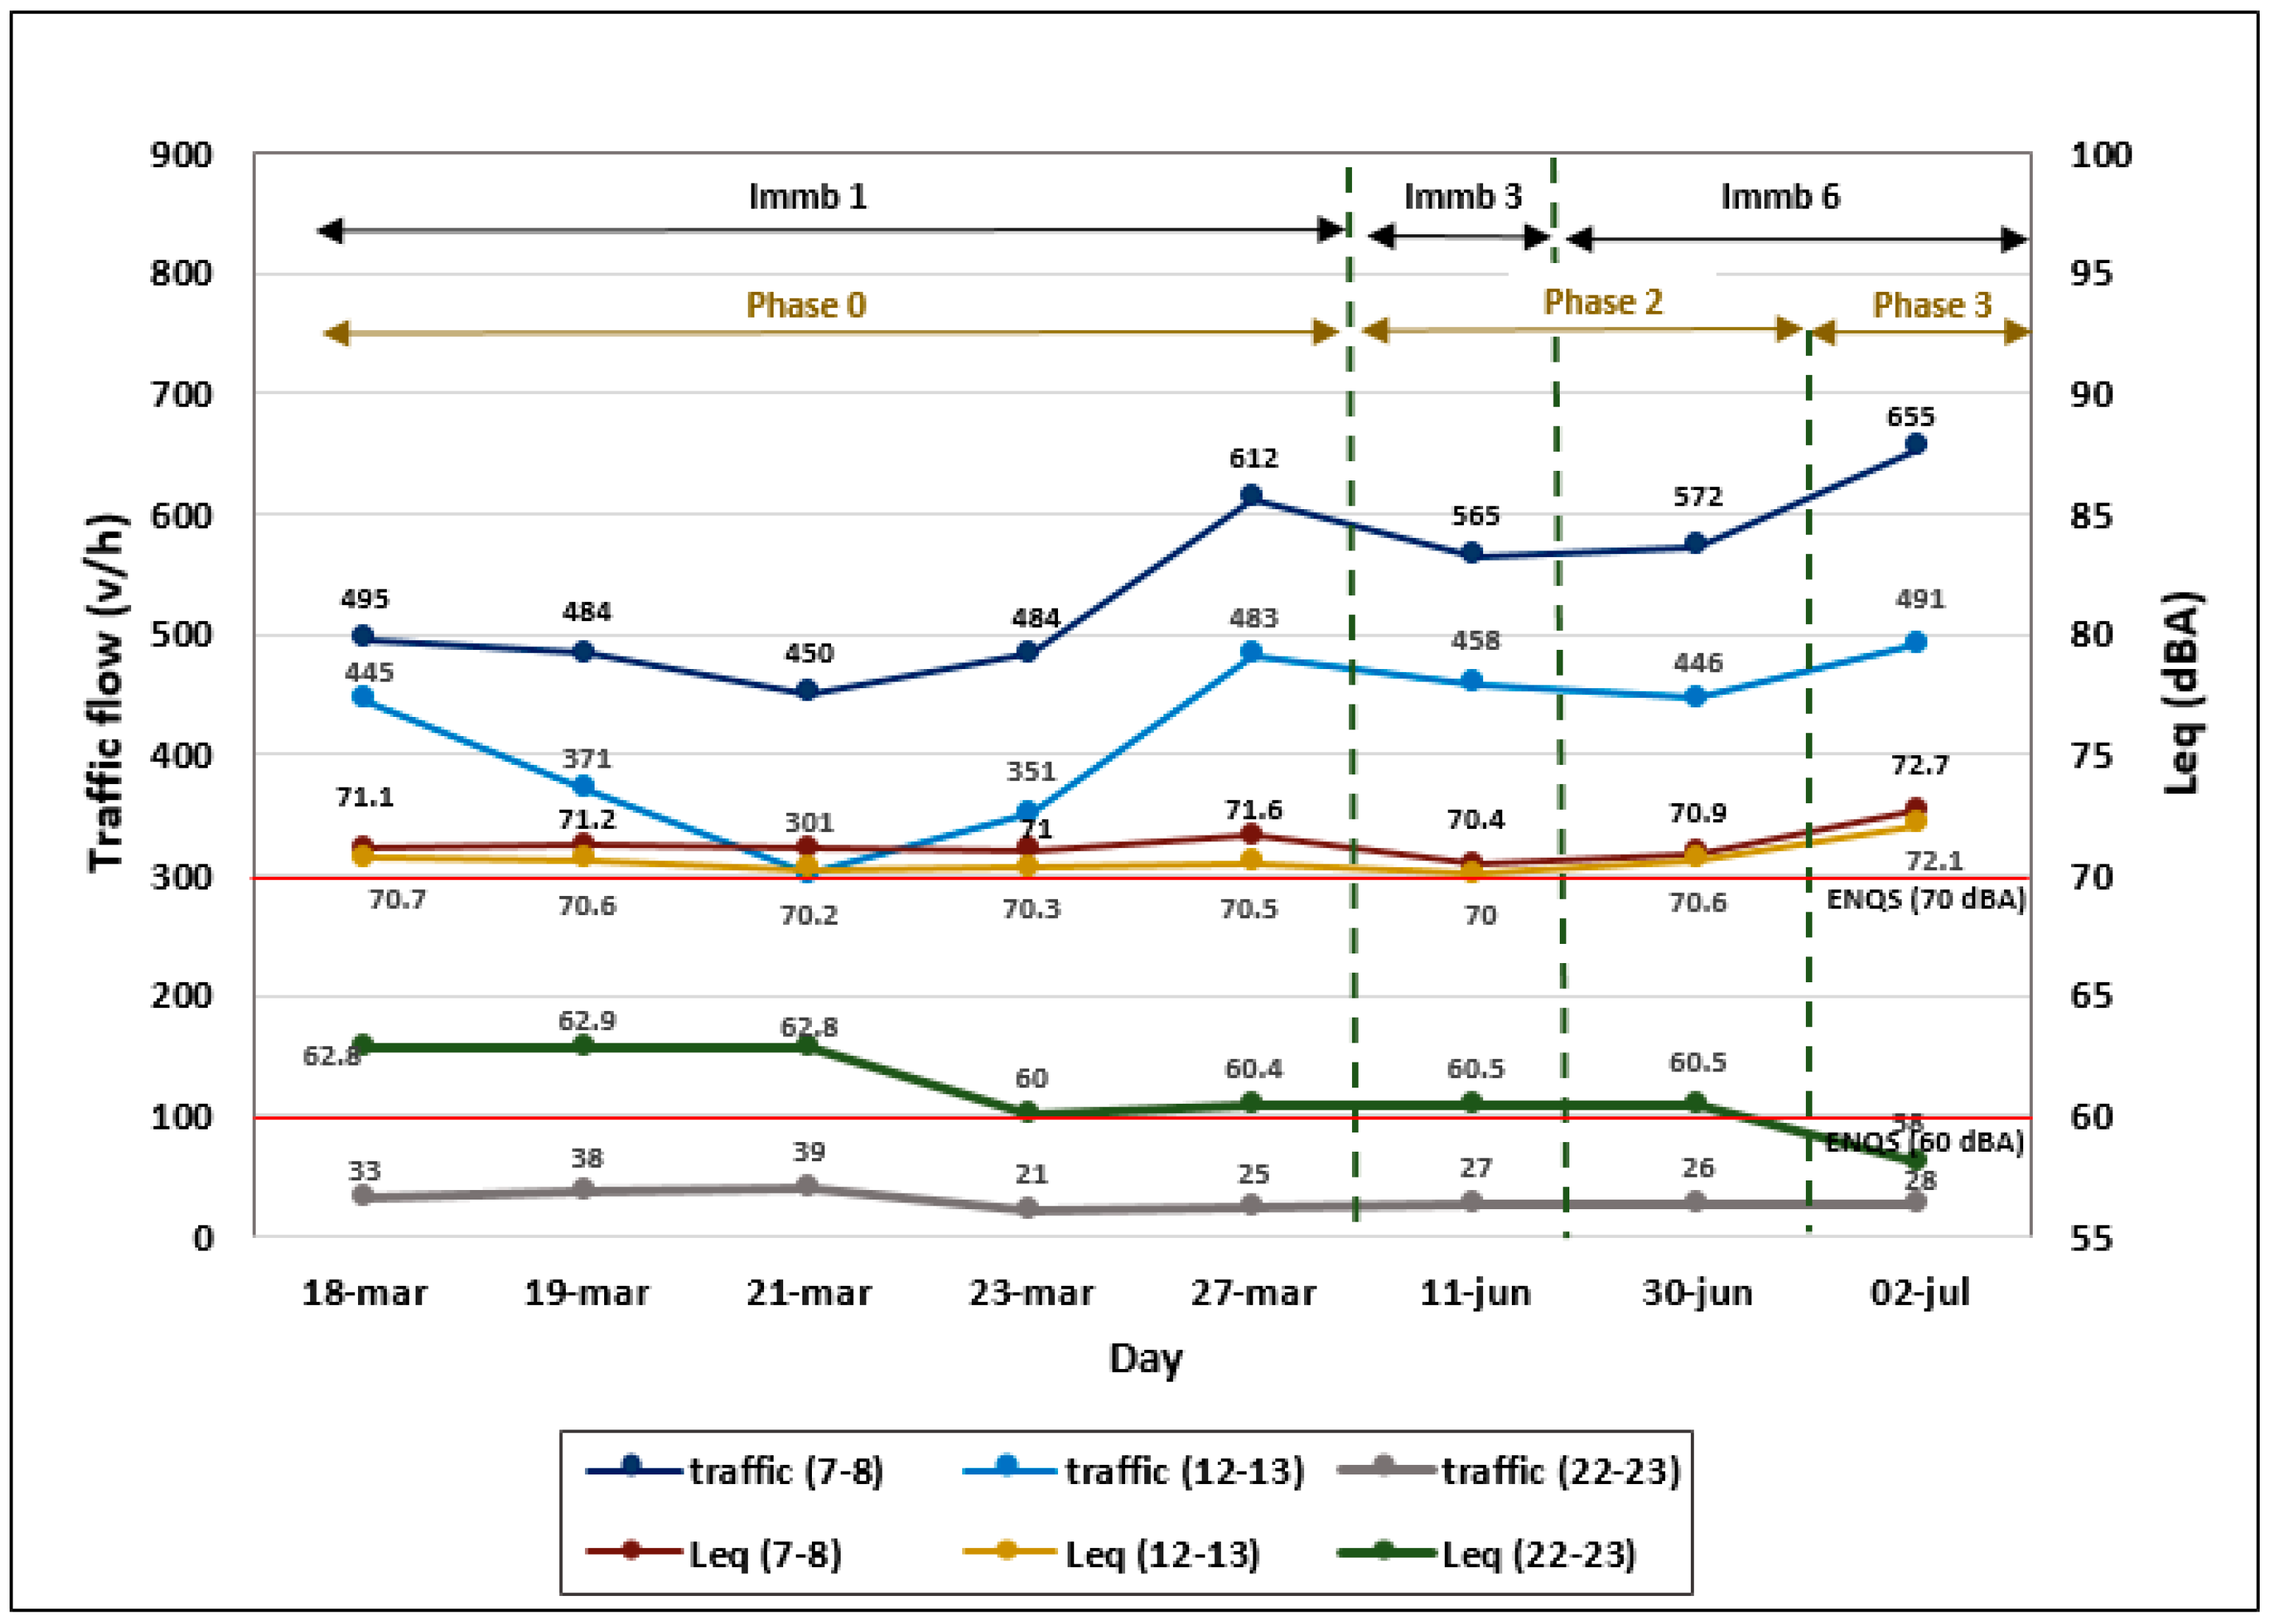
3.2. Impact of Traffic Flow Evolution on the SPL

Although it is well known that traffic flow is directly related to environmental noise, it was interesting to compare the traffic flow evolution along the different stages of the CSI to the values before the pandemic and evaluate its effect on the measured Leq.
According to Rodriguez, R. [41], in 2017 the measured traffic flow at the same position on Brasil Avenue during rush hour (7:00 to 8:00 am) was 845 v/h, of which 567 could be considered light transport vehicles and 278 corresponded to heavy transport vehicles (buses, trucks, etc.). These values are much higher than the ones found during any of the immobilization conditions under study. In fact, on the last day of this study, during rush hour, the traffic flow was 655 v/h, which is an approximately 23% reduction in the traffic flow compared to the normal traffic in 2017.
Although Peruvian ENQS should be calculated using measured data from the full day/night period, Lima’s environmental noise data found in the literature [32,33,41] provide results from shorter periods of time. Taking this into account, Figure 8 represents the traffic flow and the corresponding calculated Leq during three different time periods: rush hour (7:00–8:00), normal traffic (12:00–13:00), and night (22:00–23:00). The different immobilization conditions and day/night ENQS limits for commercial areas are also represented in Figure 8 for comparative purposes.
During rush hour, the traffic flow varied from 495 v/h on the first measurement day to 612 v/h on the fifth measurement day (that is a 23.6% increase) and to 655 v/h on the last measurement day (a 32.3% increase compared to the first day). This variation was not followed by the corresponding Leq, which remained quite constant over the entire measurement period. A similar effect was observed during normal traffic conditions. The traffic flow showed a decrease/increase pattern, varying from 450 v/h to a minimum of 300 v/h and back to a maximum of almost 500 v/h, while the Leq also remained constant over the eight measurement days.
These results do not correspond to what was expected to be found since, as a general rule, environmental noise increases with traffic flow. The author responsible for the in situ measurements reported “special circumstances” in the lateral lanes and sidewalks. These “special circumstances” were mainly street sales of cooked products and deliveries of food and consumer products in general. Citizens could not move away from their area, but they could go down to buy from these improvised supply services. It seems that there was a noisy street atmosphere regardless of the traffic flow, which was much lower than prior to the lockdown. No traffic congestion was observed during the different measurement campaigns. It seems that the reported traffic flow increased as the CSI became less restrictive but was not enough to stand out from the already existing noise sources around the measurement point. This result is in consonance with the approach made by Caniato et al. [17] where urban outdoor noise levels are considered to be produced not only by traffic noise but also by other sources of anthropic noise. It can be concluded that, at the measurement point, the “immobilization Leq level” is more related to “other anthropic sources of noise” than to traffic flow increase. This trend seems to change if one looks at the last measurement day. Unfortunately, the authors do not have updated environmental noise values, but the traffic flow at the measurement point has been monitored periodically and has been steadily increasing, reaching 2000 vehicles/h as of May 2022. It is expected that under a normal mobility situation the expected correlation between traffic flow, traffic speed, and noise levels will be found in future studies.
On the other hand, during the night period (22–23) there was a better correspondence between the traffic flow curve (grey) and the Leq curve (green). This result agrees with the fact that, in this period where no other activities are present and no other sources of anthropic noise are present, the environmental noise is highly correlated to the traffic noise. The only noise was due to authorized vehicles, such as police, ambulances, cleaning services, etc., and the traffic flow remained extremely low during the full measurement campaign (between 21 and 39 v/h).

4. Conclusions

As mentioned in the introduction section, the main purpose of this research was to study how the CSI affected the environmental noise in a commercial area in the city of Lima and to compare such environmental noise values to the values prior to the CSI, to the Peruvian environmental noise quality standards (ENQS), and to the WHO recommendations. The most relevant findings and conclusions are summarized here.
On the first day of social immobilization, the global Leq values (64.1 dBA day/56.3 dBA night) remained below the limits indicated by the Peruvian environmental noise quality standards (ENQS) for a commercial area (70 dBA day/60 dBA night). These limits were not exceeded in the successive measurements, except for the last measurement day, when the commercial activities in the area where still limited to 50–40% of their typical capacities and the immobilization period was 6 h (lockdown from 22:00 to 4:00). If there were no restrictions, the environmental noise in this type of commercial/arterial road in Lima would be above the corresponding ENQS. A similar result is expected in most commercial areas in the city of Lima and in other similar urban spaces. Besides, if the results are compared to the WHO recommendations, it is observed that the recommendation Lnight ≤ 45 dB was never met, not even on the quietest night of CSI. The compliance of the recommendation Lden ≤ 53 dB cannot directly be assessed, but from the data it can be inferred that at least on the three last measurement days (lighter CSI) it was not met.
Furthermore, although the area is defined as commercial, it could be considered a mixture of residential/commercial areas due to the high number of high-rise residential buildings. There are no studies considering the amount of population affected by high noise levels in the city of Lima, but these results point to the need for such studies in order to adequately develop the required action plans.
Another finding is that in spite of a gradual increase in Leq day as the CSI became less strict and the economic activities were gradually resumed, by the end of the period of study, the environmental noise had not yet reached the “typical” levels prior to CSI due to the COVID-19 pandemic. Unfortunately, it is expected that the environmental noise will not only reach the values prior to the CSI but will most likely exceed them due to the increase in noisy motorcycle-based vehicles.
Lastly, observing the traffic flow and the calculated Leq during three different one-hour time periods, rush hour (7:00–8:00), normal traffic (12:00–13:00), and night (22:00–23:00), it can be concluded that in the measurement area and during the CSI periods under study, the correlation between the traffic flow and the environmental noise parameters is not as expected. The hypothesis for this unexpected result is that other sources of local anthropic noise (street sellers, deliveries, people, etc.) were predominant near the measurement point, and the small increase in traffic flow could not overcome these anthropic sources of noise. In the case of future action plan development, these results should be re-evaluated since they have been found under very exclusive circumstances.
As a summary, the main conclusion is that the different stages of the CSI indeed affected and reduced the environmental noise at the measurement point. In spite of the strongly restrictive social immobilization conditions, the measured noise levels remained above the WHO recommendations and were often above Peruvian ENQS. The results highlight the need to launch a program to properly assess the environmental noise and noise sources in the city of Lima as well as the number of people exposed to a given noise level in order to adequately implement effective and cost-efficient action plans to reduce the noise in the city.

Author Contributions

Conceptualization: R.R., A.I.T. and M.M.; Methodology: R.R.; Field investigation: R.R.; Formal analysis: R.R., M.M. and A.I.T.; Writing—original draft: R.R. and M.M.; Writing—review and editing: R.R., M.M. and A.I.T.; Visualization: R.R. All authors have read and agreed to the published version of the manuscript.

Funding

This research received no external funding.

Conflicts of Interest

The authors declare no conflict of interest.

References

  1. WHO. WHO Director-General’s Opening Remarks at the Media Briefing on COVID-19–11 March 2020. Available online: https://www.who.int/director-general/speeches/detail/who-director-general-s-opening-remarks-at-the-media-briefing-on-covid-19 (accessed on 11 March 2020).
  2. MINSA. Coronavirus en el Perú: Casos Confirmados Gobierno del Perú. Available online: https://www.gob.pe/8662-coronavirus-en-el-peru-casos-confirmados (accessed on 20 September 2021).
  3. Chinazzi, M.; Davis, J.T.; Ajelli, M.; Gioannini, C.; Litvinova, M.; Merler, S.; Pastore, A.; Rossi, L.; Sun, K.; Xiong, X.; et al. The Effect of Travel Restrictions on the Spread of the 2019 Novel Coronavirus (2019-NCoV) Outbreak. Science 2020, 368, 1–12. [Google Scholar] [CrossRef] [PubMed] [Green Version]
  4. Fang, H.; Wangb, L.; Yangc, Y. Human Mobility Restrictions and the Spread of the Novel Coronavirus (2019-NCoV) in China. J. Public Econ. 2020, 191, 104272. [Google Scholar] [CrossRef] [PubMed]
  5. Kraemer, M.U.G.; Yang, C.; Gutierrez, B.; Wu, C.; Klein, B.; Pigott, D.M.; Data, O.C.-; Group, W.; Plessis, L.; Faria, N.R.; et al. The Effect of Human Mobility and Control Measures on the COVID-19 Epidemic in China. Sci. First Release 2020, 1–29, 493–497. [Google Scholar] [CrossRef] [PubMed] [Green Version]
  6. Tian, H.; Liu, Y.; Li, Y.; Wu, C.; Chen, B.; Kraemer, M.U.G.; Li, B.; Cai, J.; Xu, B.; Yang, Q.; et al. An Investigation of Transmission Control Measures during the First 50 Days of the COVID-19 Epidemic in China. Science 2020, 642, 638–642. [Google Scholar] [CrossRef] [PubMed] [Green Version]
  7. Zambrano-Monserrate, M.A.; Ruano, M.A.; Sanchez-Alcalde, L. Indirect Effects of COVID-19 on the Environment. Sci. Total Environ. 2020, 728, 138813. [Google Scholar] [CrossRef]
  8. Asdrubali, F.; Brambilla, G. Noise Mapping Special Issue: The Noise Climate at the Time of SARS-CoV-2 Virus/COVID-19 Disease. Noise Mapp. 2021, 8, 204–206. [Google Scholar] [CrossRef]
  9. Tobías, A. Evaluation of the Lockdowns for the SARS-CoV-2 Epidemic in Italy and Spain after One Month Follow Up. Sci. Total Environ. 2020, 725, 138539. [Google Scholar] [CrossRef]
  10. Kerimray, A.; Baimatova, N.; Ibragimova, O.; Bukenov, B.; Kenessov, B.; Plotitsyn, P.; Karaca, F. Assessing air quality changes in large cities during COVID-19 lockdowns: The impacts of traffic-free urban conditions in Almaty, Kazakhstan. Sci. Total Environ. 2020, 730, 139179. [Google Scholar] [CrossRef]
  11. Dantas, G.; Siciliano, B.; França, B.B.; da Silva, C.M.; Arbilla, G. The Impact of COVID-19 Partial Lockdown on the Air Quality of the City of Rio de Janeiro, Brazil. Sci. Total Environ. 2020, 729, 139085. [Google Scholar] [CrossRef]
  12. Collivignarelli, M.C.; Abbà, A.; Bertanza, G.; Pedrazzani, R.; Ricciardi, P.; Carnevale Miino, M. Lockdown for COVID-2019 in Milan: What Are the Effects on Air Quality? Sci. Total Environ. 2020, 732, 139280. [Google Scholar] [CrossRef]
  13. Basu, B.; Murphy, E.; Molter, A.; Basu, A.S.; Sannigrahi, S.; Belmonte, M.; Pilla, F. Investigating changes in noise pollution due to the COVID-19 lockdown: The case of Dublin, Ireland. Sustain. Cities Soc. 2020, 65, 102597. [Google Scholar] [CrossRef]
  14. Andersen, A.L.; Hansen, E.T.; Johannesen, N.; Sheridan, A. Pandemic, Shutdown and Consumer Spending: Lessons from Scandinavian Policy Responses to COVID-19. Gen. Econ. 2020, 2005, 04630. [Google Scholar] [CrossRef]
  15. Rumpler, R.; Venkataraman, S.; Göransson, P. An observation of the impact of CoViD-19 recommendation measures monitored through urban noise levels in central Stockholm, Sweden. Sustain. Cities Soc. 2020, 63, 102469. [Google Scholar] [CrossRef] [PubMed]
  16. Amoatey, P.; Al-Harthy, I.; Al-Jabri, K.; Al-Mamun, A.; Baawain, M.S.; Al-Mayahi, A. Impact of COVID-19 Pandemic on Aircraft Noise Levels, Annoyance, and Health Effects in an Urban Area in Oman. Environ. Sci. Pollut. Res. 2022, 29, 23407–23418. [Google Scholar] [CrossRef] [PubMed]
  17. Caniato, M.; Bettarello, F.; Gasparella, A. Indoor and Outdoor Noise Changes Due to the COVID-19 Lockdown and Their Effects on Individuals’ Expectations and Preferences. Sci. Rep. 2021, 11, 16533. [Google Scholar] [CrossRef]
  18. Terry, C.; Rothendler, M.; Zipf, L.; Dietze, M.C.; Primack, R.B. Effects of the COVID-19 pandemic on noise pollution in three protected areas in metropolitan Boston (USA). Biol. Conserv. 2021, 256, 109039. [Google Scholar] [CrossRef]
  19. Yang, W.; Kang, J. Acoustic comfort evaluation in urban open public spaces. Appl. Acoust. 2005, 66, 211–229. [Google Scholar] [CrossRef]
  20. WHO. WHO Environmental Noise Guidelines for the European Region; WHO Regional Office for Europe, Ed.; WHO Regional Office for Europe: Marmorvej, Denmark, 2018. [Google Scholar]
  21. Zambrano-Monserrate, M.A.; Ruano, M.A. Does environmental noise affect housing rental prices in developing countries? Evidence from Ecuador. Land Use Policy 2019, 87, 104059. [Google Scholar] [CrossRef]
  22. Bendtsen, H. The Nordic Prediction Method for Road Traffic Noise. Sci. Total Environ. 1999, 235, 331–338. [Google Scholar] [CrossRef]
  23. Xiao, H.; Eilon, Z.C.; Ji, C.; Tanimoto, T. COVID-19 Societal Response Captured by Seismic Noise in China and Italy. Seism. Res. Lett. 2020, 91, 2757–2768. [Google Scholar] [CrossRef]
  24. Yabe, S.; Imanishi, K.; Nishida, K. Two-step seismic noise reduction caused by COVID-19 induced reduction in social activity in metropolitan Tokyo, Japan. Earth Planets Space 2020, 72, 1–11. [Google Scholar] [CrossRef] [PubMed]
  25. Mishra, A.; Das, S.; Singh, D.; Maurya, A.K. Effect of COVID-19 lockdown on noise pollution levels in an Indian city: A case study of Kanpur. Environ. Sci. Pollut. Res. 2021, 28, 46007–46019. [Google Scholar] [CrossRef] [PubMed]
  26. Zambon, G.; Confalonieri, C.; Angelini, F.; Benocci, R. Effects of COVID-19 outbreak on the sound environment of the city of Milan, Italy. Noise Mapp. 2021, 8, 116–128. [Google Scholar] [CrossRef]
  27. Asensio, C.; Pavón, I.; de Arcas, G. Changes in noise levels in the city of Madrid during COVID-19 lockdown in 2020. J. Acoust. Soc. Am. 2020, 148, 1748–1755. [Google Scholar] [CrossRef]
  28. Gevú, N.; Carvalho, B.; Fagerlande, G.C.; Niemeyer, M.L.; Cortês, M.M.; Torres, J.C.B. Rio de Janeiro noise mapping during the COVID-19 pandemic period. Noise Mapp. 2021, 8, 162–171. [Google Scholar] [CrossRef]
  29. Ojeda, J.; Ruiz, S. Seismic noise variability as an indicator of urban mobility during the COVID-19 pandemic in the Santiago metropolitan region, Chile. Solid Earth 2021, 12, 1075–1085. [Google Scholar] [CrossRef]
  30. Said, G.; Arias, A.; Carilli, L.; Stasi, A. Urban noise measurements in the City of Buenos Aires during the mandatory quarantine. J. Acoust. Soc. Am. 2020, 148, 3149–3152. [Google Scholar] [CrossRef]
  31. DECRETO SUPREMO N 085-2003-PCM: Reglamento de Estándares Nacionales de Calidad Ambiental para Ruido. Available online: https://sinia.minam.gob.pe/normas/reglamento-estandares-nacionales-calidad-ambiental-ruido (accessed on 20 May 2022).
  32. OEFA. La Contaminación Sonora En Lima y Callao; OEFA: Nyon, Switzerland, 2016; pp. 148–162. [Google Scholar]
  33. García-Rivero, A.E.; Yuli-Posadas, R.; Romero, W.R.; Sánchez-Ccoyllo, O.; Bulege-Gutierrez, W.; Tasayco, H.G.G.; Fernández-Gusmán, V. Daytime perimeter environmental noise in the vicinity of four hospitals in the city of Lima, Peru. Noise Mapp. 2020, 7, 239–247. [Google Scholar] [CrossRef]
  34. Urban Population (% of Total Population)–Peru Data. Available online: https://data.worldbank.org/indicator/SP.URB.TOTL.IN.ZS?locations=PE (accessed on 17 February 2022).
  35. INEI. Instituto Nacional de Estadistica e Informatica. Available online: https://m.inei.gob.pe/estadisticas/indice-tematico/poblacion-y-vivienda/ (accessed on 16 February 2022).
  36. Licitra, G.; Ascari, E.; Brambilla, G. Comparative Analysis of Methods to Estimate Urban Noise Exposure of Inhabitants. Acta Acust. United Acust. 2012, 98, 659–666. [Google Scholar] [CrossRef]
  37. Sotiropoulou, A.; Karagiannis, I.; Vougioukas, E.; Ballis, A.; Bouki, A. Measurements and Prediction of Road Traffic Noise along High-Rise Building Facądes in Athens. Noise Mapp. 2020, 7, 1–13. [Google Scholar] [CrossRef]
  38. Municipalidad Metropolitana Lima. Ordenanza 341. El Peruano, 2001; 213501–213512.
  39. MINAM. Protocolo Nacional de Monitoreo de Ruido Ambiental. 2013. Available online: https://www.minam.gob.pe/wp-content/uploads/2014/02/RM-N%C2%BA-227-2013-MINAM.pdf (accessed on 20 September 2021).
  40. El Peruano. Diario Oficial El Peruano. Available online: https://diariooficial.elperuano.pe/Normas (accessed on 20 September 2021).
  41. Rodríguez Flores, R.G. Aplicación Del Modelo TNM (Trafic Noise Model) Para La Predicción Del Nivel de Ruido En La Avenida Brasil; Universidad Nacional del Callao: Lima, Peru, 2018. [Google Scholar]
Figure 1. Measurement position (×) within the city of Lima.
Acoustics 04 00030 g001
Figure 2. Overview of Brasil Avenue near the measurement point. High- and low-rise buildings.
Acoustics 04 00030 g002
Figure 3. Measurement position (P) and Brasil Avenue schematic description.
Acoustics 04 00030 g003
Figure 4. Microphone situation with respect to potential reflection surfaces.
Acoustics 04 00030 g004
Figure 5. Environmental noise at measurement point: Left, The first day of CSI; Right, 105 days after the start of CSI.
Acoustics 04 00030 g005
Figure 6. Leq, L10, and L90 evolution within different CSI stages. Day period.
Acoustics 04 00030 g006
Figure 7. Leq, L10, and L90 evolution within different CSI stages. Night period.
Acoustics 04 00030 g007
Figure 8. Traffic flow and Leq at different immobilization periods: rush hour (7:00–8:00), normal traffic (12:00–13:00), and night (22:00–23:00).
Acoustics 04 00030 g008
Table 1. Environmental noise quality standards (ENQS) in Peru. Source: Adapted from Supreme Decree No. 085-2003-PCM [31].
ZonesValues in LAeq, T * (dBA)
DayNight
(07:01 a.m.–10:00 p.m.)(10:01 p.m.–07:00 a.m.)
Special Protected5040
Residential6050
Commercial7060
Industrial8070
* The decree is not clear concerning the integration time period. Most existing studies use measurement periods of 15 or 60 min within the corresponding day/night period.
Table 2. Chronology and detail of the different CSI conditions and resumption of activity phases.
DateCompulsory Social ImmobilizationEconomic Activity Resumption
I-ReferenceSchedule (h)Total HoursStarting DateE-Reference
18 March 2020Immb 120:00 a 5:00 *918 March 2020Phase 0
30 March 2020Immb 218:00 a 5:00 *11
10 April 2020Immb 318:00 a 4:00 *10
4 May 2020Phase 1
10 May 2020Immb 420:00 a 4:00 *8
23 May 2020Immb 521:00 a 4:00 *7
4 June 2020Phase 2
26 June 2020Immb 622:00 a 4:00 *6
1 July 2020Phase 3
Phase 0:Authorisation only for essential activities (hospitals, pharmacies, markets, supermarkets, fire brigades, police, waste collection, night watching, electricity sector, etc.).
Phase 1:Large mining, industrial fishing, projects in the transport sector, industry sector, restaurant delivery services, building maintenance, and household goods commerce.
Phase 2:Medium and small mining, beverage and related industry, sale and maintenance of vehicles, professional, scientific, and technical services.
Phase 3:Remaining activities in the mining and construction sector, stores with a capacity of 50%, restaurants with a capacity of 40%, other business activities with a capacity of 50%
* The following day. Source: Author (based on the official newspaper El Peruano) [40].
Table 3. Type of compulsory social immobilization during the monitoring days.
Measurement NumberDateSocial Immobilization Evolution
DaysWeekI-Reference
118 March11Immb 1
219 March21Immb 1
321 March41Immb 1
423 March62Immb 1
527 March102Immb 1
611 June8613Immb 3
730 June10516Immb 6
802 July107 16Immb 6
Table 4. Day/night environmental noise parameters over the measurement campaign.
DateLeq day (07:01—22:00 h) dBALeq night (22:01—07:00 h) dBAImmobilization and Economic Activity References
LeqLmaxLminLeqLmaxLmin
18 March64.192.043.756.390.135.3Immb1-Ph0
19 March63.493.340.956.691.236.2Immb1-Ph0
21 March64.795.239.856.589.736.0Immb1-Ph0
23 March62.596.140.456.589.935.8Immb1-Ph0
27 March63.597.641.356.490.336.0Immb1-Ph0
11 June69.196.040.056.889.835.8Immb3-Ph2
30 June69.998.439.559.588.635.9Immb6-Ph2
02 June71.699.038.663.587.734.1Immb6-Ph3
Publisher’s Note: MDPI stays neutral with regard to jurisdictional claims in published maps and institutional affiliations.

