
A Preliminary Investigation on Frequency Dependant Cues for Human Emotions


Audio & Acoustic Signal Processing Group, School of Engineering, The Australian National University, Canberra 2601, Australia
*
Authors to whom correspondence should be addressed.
†
These authors contributed equally to this work.
Acoustics 2022, 4(2), 460-468; https://doi.org/10.3390/acoustics4020028
Submission received: 8 April 2022
/
Revised: 14 May 2022
/
Accepted: 18 May 2022
/
Published: 22 May 2022
(This article belongs to the Special Issue Human's Psychological and Physiological Responses to Sound Environment)
Abstract
:The recent advances in Human-Computer Interaction and Artificial Intelligence have significantly increased the importance of identifying human emotions from different sensory cues. Hence, understanding the underlying relationships between emotions and sensory cues have become a subject of study in many fields including Acoustics, Psychology, Psychiatry, Neuroscience and Biochemistry. This work is a preliminary step towards investigating cues for human emotion on a fundamental level by aiming to establish relationships between tonal frequencies of sound and emotions. For that, an online perception test is conducted, in which participants are asked to rate the perceived emotions corresponding to each tone. The results show that a crossover point for four primary emotions lies in the frequency range of 417–440 Hz, thus consolidating the hypothesis that the frequency range of 432–440 Hz is neutral from human emotion perspective. It is also observed that the frequency dependant relationships between emotion pairs Happy—Sad, and Anger—Calm are approximately mirrored symmetric in nature.
1. Introduction
Our emotions play a crucial role in modulating our experiences and the way we interact with others, along with driving our perception and cognitive processes. Hence, endowing machines to replicate basic sensing capabilities like humans has remained the long-pursued goal for various biomedical, engineering, and computer science disciplines [1,2,3,4]. Ideally, we expect our machines or computing devices to be smart enough to rapidly sense their immediate surroundings and develop the most appropriate response for a given operational environment [5,6]. For this quest, various approaches using different senses such as visuals, audio, and physiological senses have been used in the past [7,8,9,10,11]. However, the two basic senses that are primarily used in developing automatic emotion recognition models are audio and visuals, out of which audio senses are well known for stimulating emotion cues [12,13,14,15] since audio signals have higher augment for emotion cues with less computational power requirements than visual signals [13,16]. Further, detecting emotions from visual data has ethical challenges in comparison to audio signals. For example, placing a camera to collect visual data can rise ethical and privacy concerns, while microphones are more socially accepted.
Nevertheless, enabling computing devices to detect emotion cues from acoustic signals is always a daunting task because of reasons like [7,12],
- diverse nature of possible audio inputs and their application scenarios,
- presence of simultaneous sound sources of highly diverse nature (be a natural or artificial origin),
- presence of high background noise, and
- poor performance of source localization and separation algorithms.
Hence, in order to sense acoustic environment and develop emotion recognition model, this research investigates cues for human emotions on a very fundamental level by focusing on identifying physical sound determinants of emotional responses.
2. Related Work
This section provides a brief overview of related work on psychoacoustic parameters based auditory emotion recognition and discusses how psychoacoustic parameters can be vital in developing multi-modal emotion recognition algorithms.
To date, studies on emotion recognition have been predominantly based on identifying cues from facial expression data [9,17], voice and speech data [18], audio-visual data [9,10], and physiological data [9,19,20]. Among these, the area of research involving sound without verbal information as the stimulus for emotion recognition is classified as psychoacoustics [21,22]. It has the potential to be established as a distinct field of emotion recognition, as sound plays an important role in detecting cues for various primary emotions. Also, it is possible to accurately detect other’s emotions from the tone of their voice without actually understanding/ listening to speech [23,24]. Furthermore, the accuracy of emotion recognition algorithms improve with multi-modality (i.e., two or more sensory) inputs in comparison to uni-modality inputs [25,26,27].
However, most of the emotion recognition studies are conducted either by extracting specific parameters that become apparent when emotion is evoked (e.g., facial, voice or physiological indicators) [28,29], or by training the data to predict an emotion by applying mathematical algorithms [11,30]. Also, it is important to understand that non-verbal sound is processed differently than verbal sound/ speech in the brain and is relatively natural and universal means of human communication with higher cues for emotional responses [31,32]. Hence, it is important to identify physical sound determinants of emotional responses through non-verbal sound, as the chances of emotional responses being convoluted with other factors will be minimal and will only be the result of present stimuli.
In the past, there have been few research studies to establish perceptual determinants for physical parameters in non-verbal sound such as mapping emotional reactions to auditory events onto a pleasantness-unpleasantness (Lust-Unlust) dimension [33], and identifying Valence and potency/control cues in the vocal expression of emotion [34]. Also, in a recent research Erkin Austy and Daniel mapped everyday emotional reactions to both sound characteristics, and the appraisal of sound/sound source [35]. In another research, Paul C. Vitz identified preferred tones as an inverted function of frequency and intensity [36]. Apart from that, other noteworthy researches in the field of psychoacoustics are the development of an auditory emotion recognition function using psychoacoustic parameters based on IADS [21], and emotional reactions to sounds without meaning [37].
However, to the best of our knowledge, there has been no research in the past aiming to establish a relationship between frequency (one of the most important physical parameters of sound) and perceived human emotions. Establishing such a relationship between physical parameters of sound and emotional responses can be important for various applications such as emotion induction with sound, development of new sound abatement approaches, sound and auditory interface design, and prediction and assessment of subjective noise experiences [38,39,40]. The findings of this research can also be helpful in establishing perceptual determinants for physical parameters in sound, along with setting directions for other research in emotion recognition such as detecting emotion cues from non-musical, and non-vocal sounds.
3. Materials and Methods
This study intends to establish a relationship between pure tone frequencies and perceived human emotions. For that, an online (Qualtrics software-based) perception test is conducted, with approval from ANU Human Research Ethics Committee (Protocol 2021/418). Here, the participants are asked to rate 12 different pure tones (frequency range 110–963 Hz) on a scale of 1 to 10, corresponding to each emotion class.
3.1. Participants
Thirty-seven adults in the age group of 20–55 years from Canberra, Australia participated in the research voluntarily. The gender distribution among participants is 20:17 (i.e., 20 male and 17 female), with median age of 27 years (SD 6.5987). All participants had normal hearing and technical acumen required for understanding basic acoustic signal processing terminologies such as spatial audio, pure tones, and frequencies. Also, the test did not have any specific requirements for participants to represent the general population. Instead, it favored those having prior experience in critically listening to audio.
3.2. Stimuli
The Solfeggio frequencies (174 Hz, 285 Hz, 396 Hz, 417 Hz, 528 Hz, 639 Hz, 741 Hz, 852 Hz, and 963 Hz), and the standard tuning frequency along with its harmonics (110 Hz, 220 Hz, and 440 Hz) are used to generate pure tones (using MATLAB). The main reason for choosing Solfeggio frequencies are their claimed capability to balance our energy and keep our body, mind, and spirit in perfect harmony [4,41]. Also, using pure tones as stimuli allowed us to identify a direct relationship between frequency, and the perceived emotion class since emotions are typically very complex conscious mental responses that may depend upon various factors such as previous emotional state, past experiences, personal biases, and other socio-geographic factors [1,42]. However, with pure tones as stimuli, the chances of emotional responses being convoluted with other factors will be minimal, and will only be the result of present stimuli.
3.3. Emotion Rating Mechanism
Each participant must listen to all 12 Solfeggio frequencies for the duration of 20 s each. For each primary emotion class (Happy, Sad, Calm, and Anger), the participants are required to rate these pure tones on a scale of 1 to 10 by using a comparative analysis. Here 1 represents “least significant emotion” and 10 represents “most significant emotion”. The detailed instructions for completing the emotion rating test are as follows:
- For each emotion category, participants must listen to all 12 pure tones, perform a comparative analysis, and rate the significance of highlighted emotion on a scale of 1 to 10. Here, the rule of thumb for rating a particular tone is based on performing the comparative analysis of the previous and next tone, as they are in ascending order of frequency.
- For an effective and consistent perception test, participants are asked to use headphones of good frequency responses.
- Before starting the perception test, participants must adjust their speaker/headphone sound level to a comfortable level (Recommended level: 15 to 20%).
3.4. Perception Test Setup
The emotion rating test is conducted online via Qualtrics software as a survey tool. The main reason for opting online emotion rating test instead of in-person is COVID-related safety measures. Here, each participant received an email-based invitation with a secured link and a password to participate.
4. Results and Discussions
One of the main intentions of this study is to establish a frequency-dependent inter-relationship amongst different emotion classes. For that, we only considered primary emotions—Happy, Sad, Anger, and Calm, as they almost cover the entire human emotion spectrum [43,44]. Also, considering only the primary emotions will allow our results to be more generic and broadly applicable.
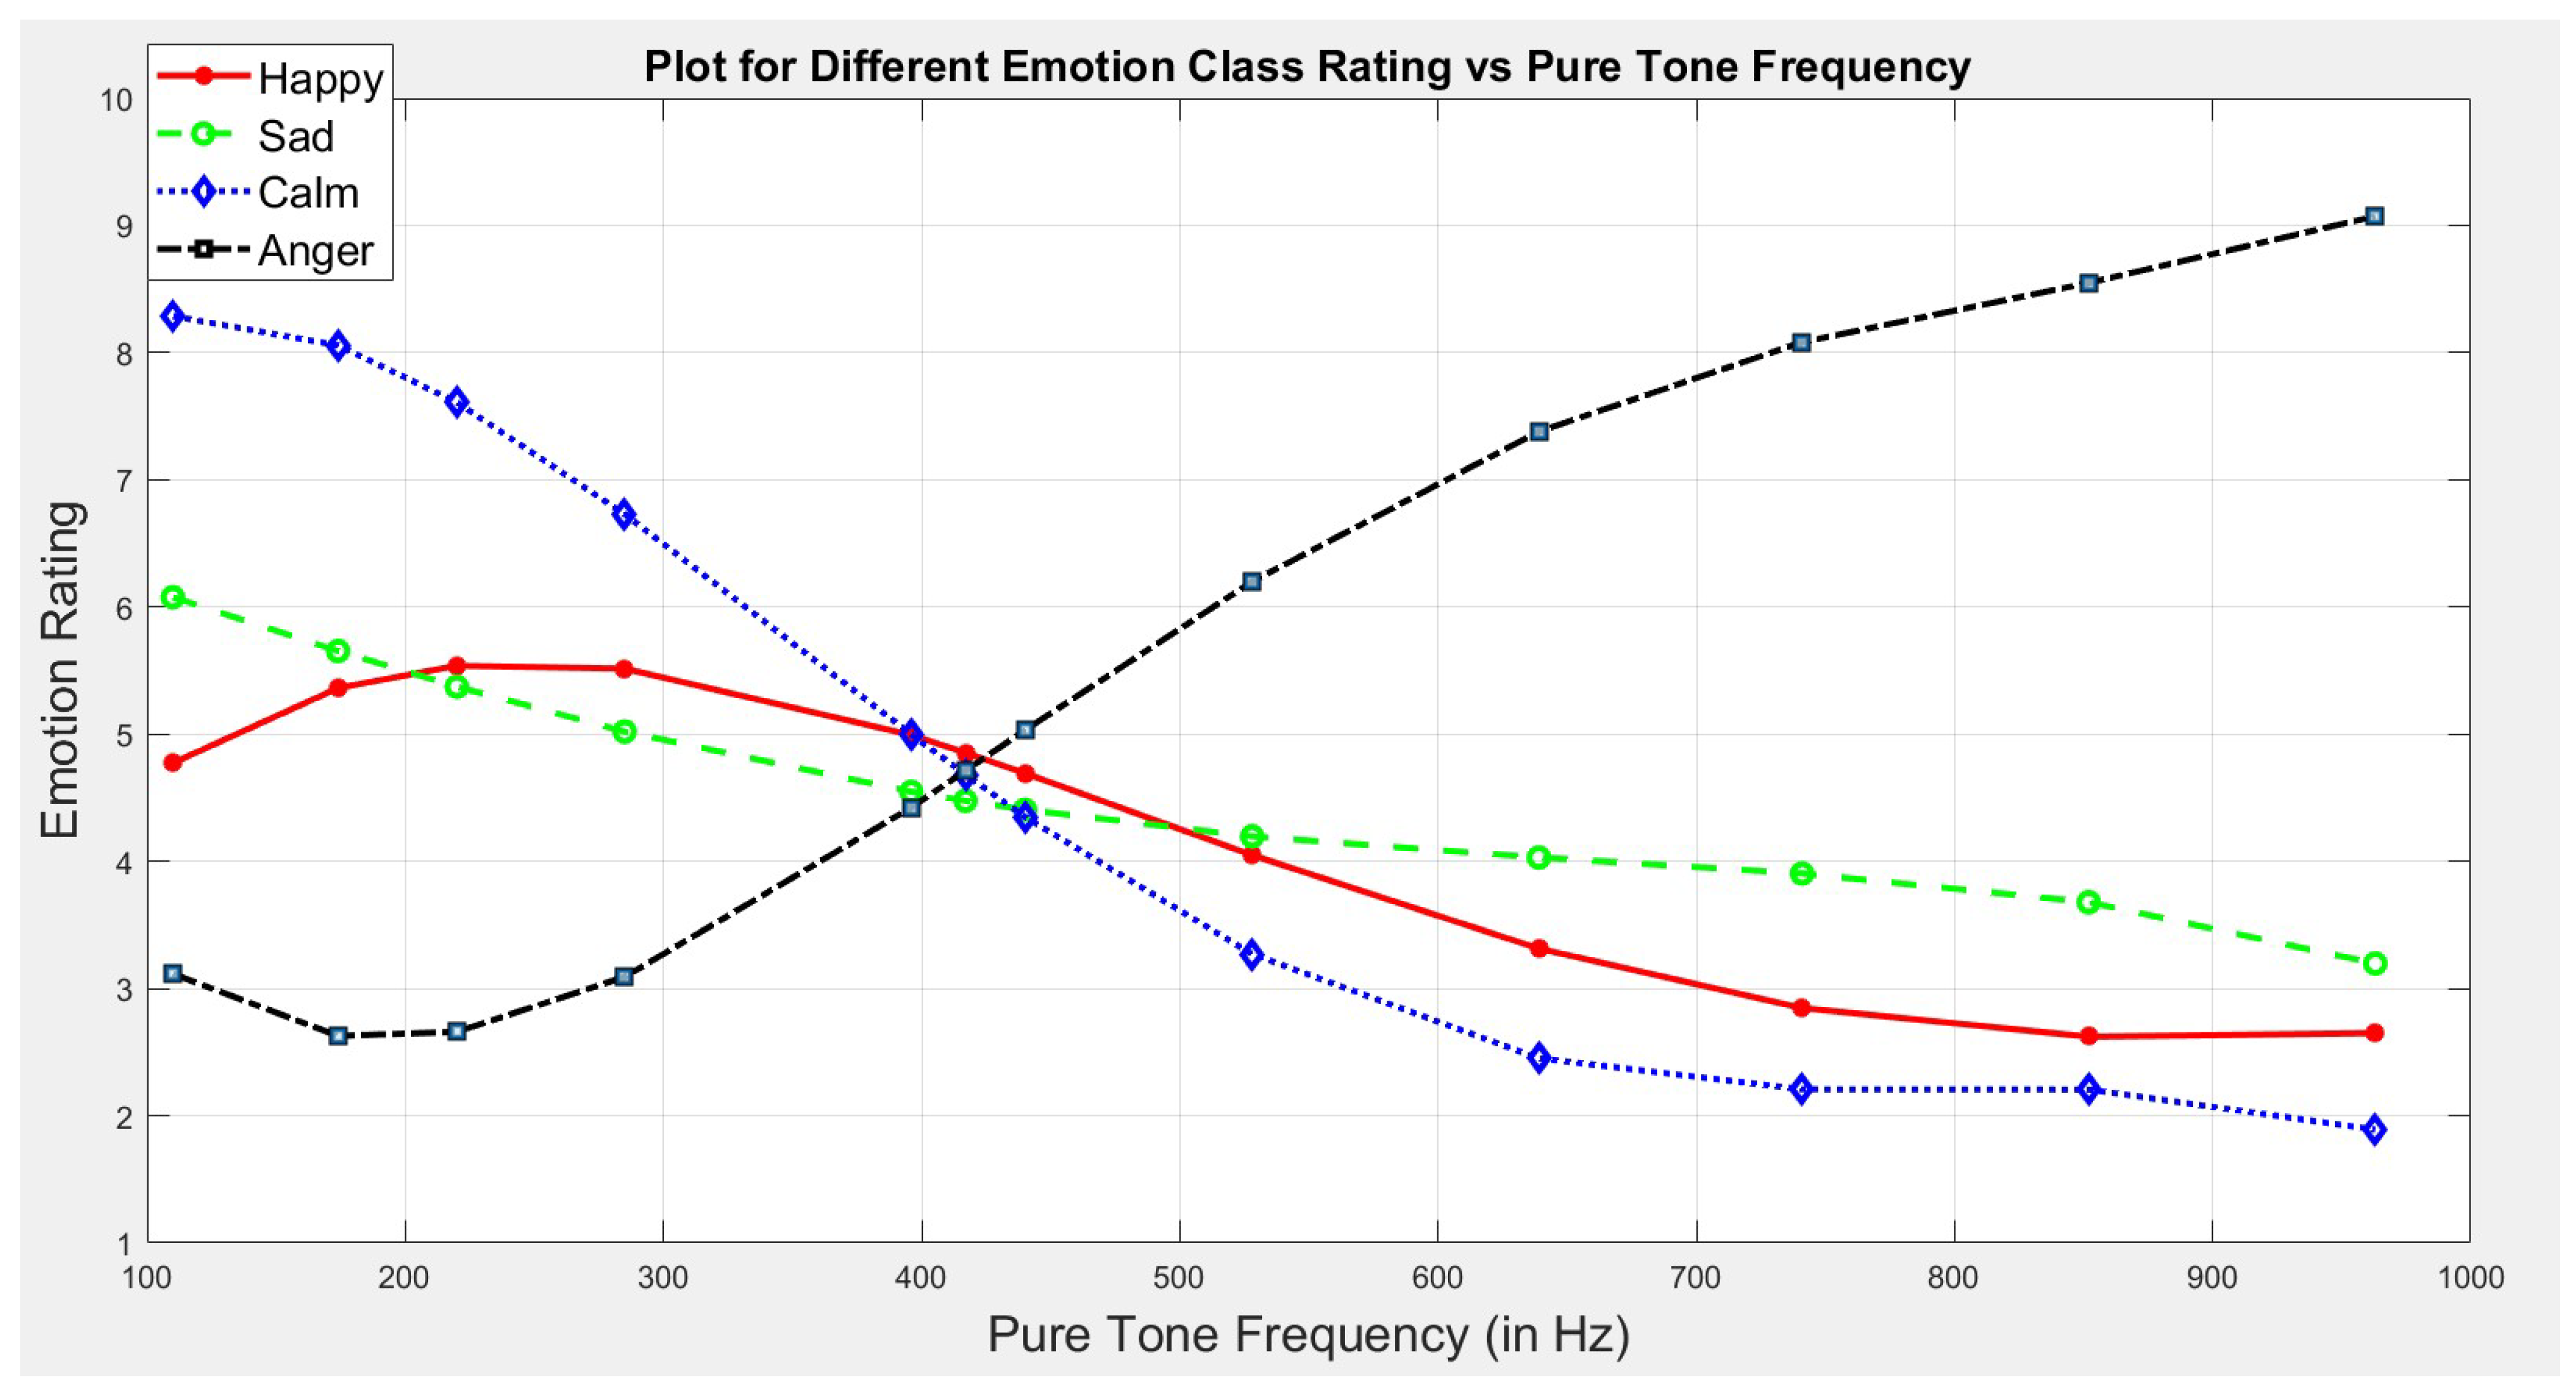
To establish the required relationship, emotion ratings from all 37 participants corresponding to each emotion class are analyzed by using various statistical tools including mean, median, mode, standard deviation, and box-plots. This analysis is represented through the line graph in Figure 1. The key finding is that, the crossover points for all four primary emotion lies in the frequency range of 417–440 Hz. This clearly depicts that the frequency range 417–440 Hz is neutral, and hence supports the claim of using 432–440 Hz as a universal tuning standard [45].
Also, from Figure 1, we conclude that the plot for emotion pairs Happy—Sad, and Angry—Calm are approximately mirror-symmetric in nature. This also supports the Circumplex model-based dimensional approach for emotion annotation where the primary emotion pairs Happy—Sad, and Anger—Calm are represented in diagonally opposite quadrants [44].
Apart from that, for higher frequencies (≥440 Hz),the emotion rating tends to dampen continuously for three primary emotions happy, sad, and calm. However, for emotion class—anger, the rating gradually increases with an increase in pure tone frequency (≥440 Hz). This clearly reflects the dominance of anger emotion class in the higher frequency range. Also, it is noteworthy that the emotion class anger is triggered in a frequency range starting from 440 Hz to 528 Hz.
This study also attempts to identify frequency-dependent cues for various emotion classes. For that, a box-plot analysis corresponding to each emotion is thoroughly discussed in the latter part of the paper. The prime reason for choosing box-plot as a statistical tool for analysis is its capability to visually summarise and convey the level, spread, outliers, and symmetry of data distribution [46].
4.1. Happy
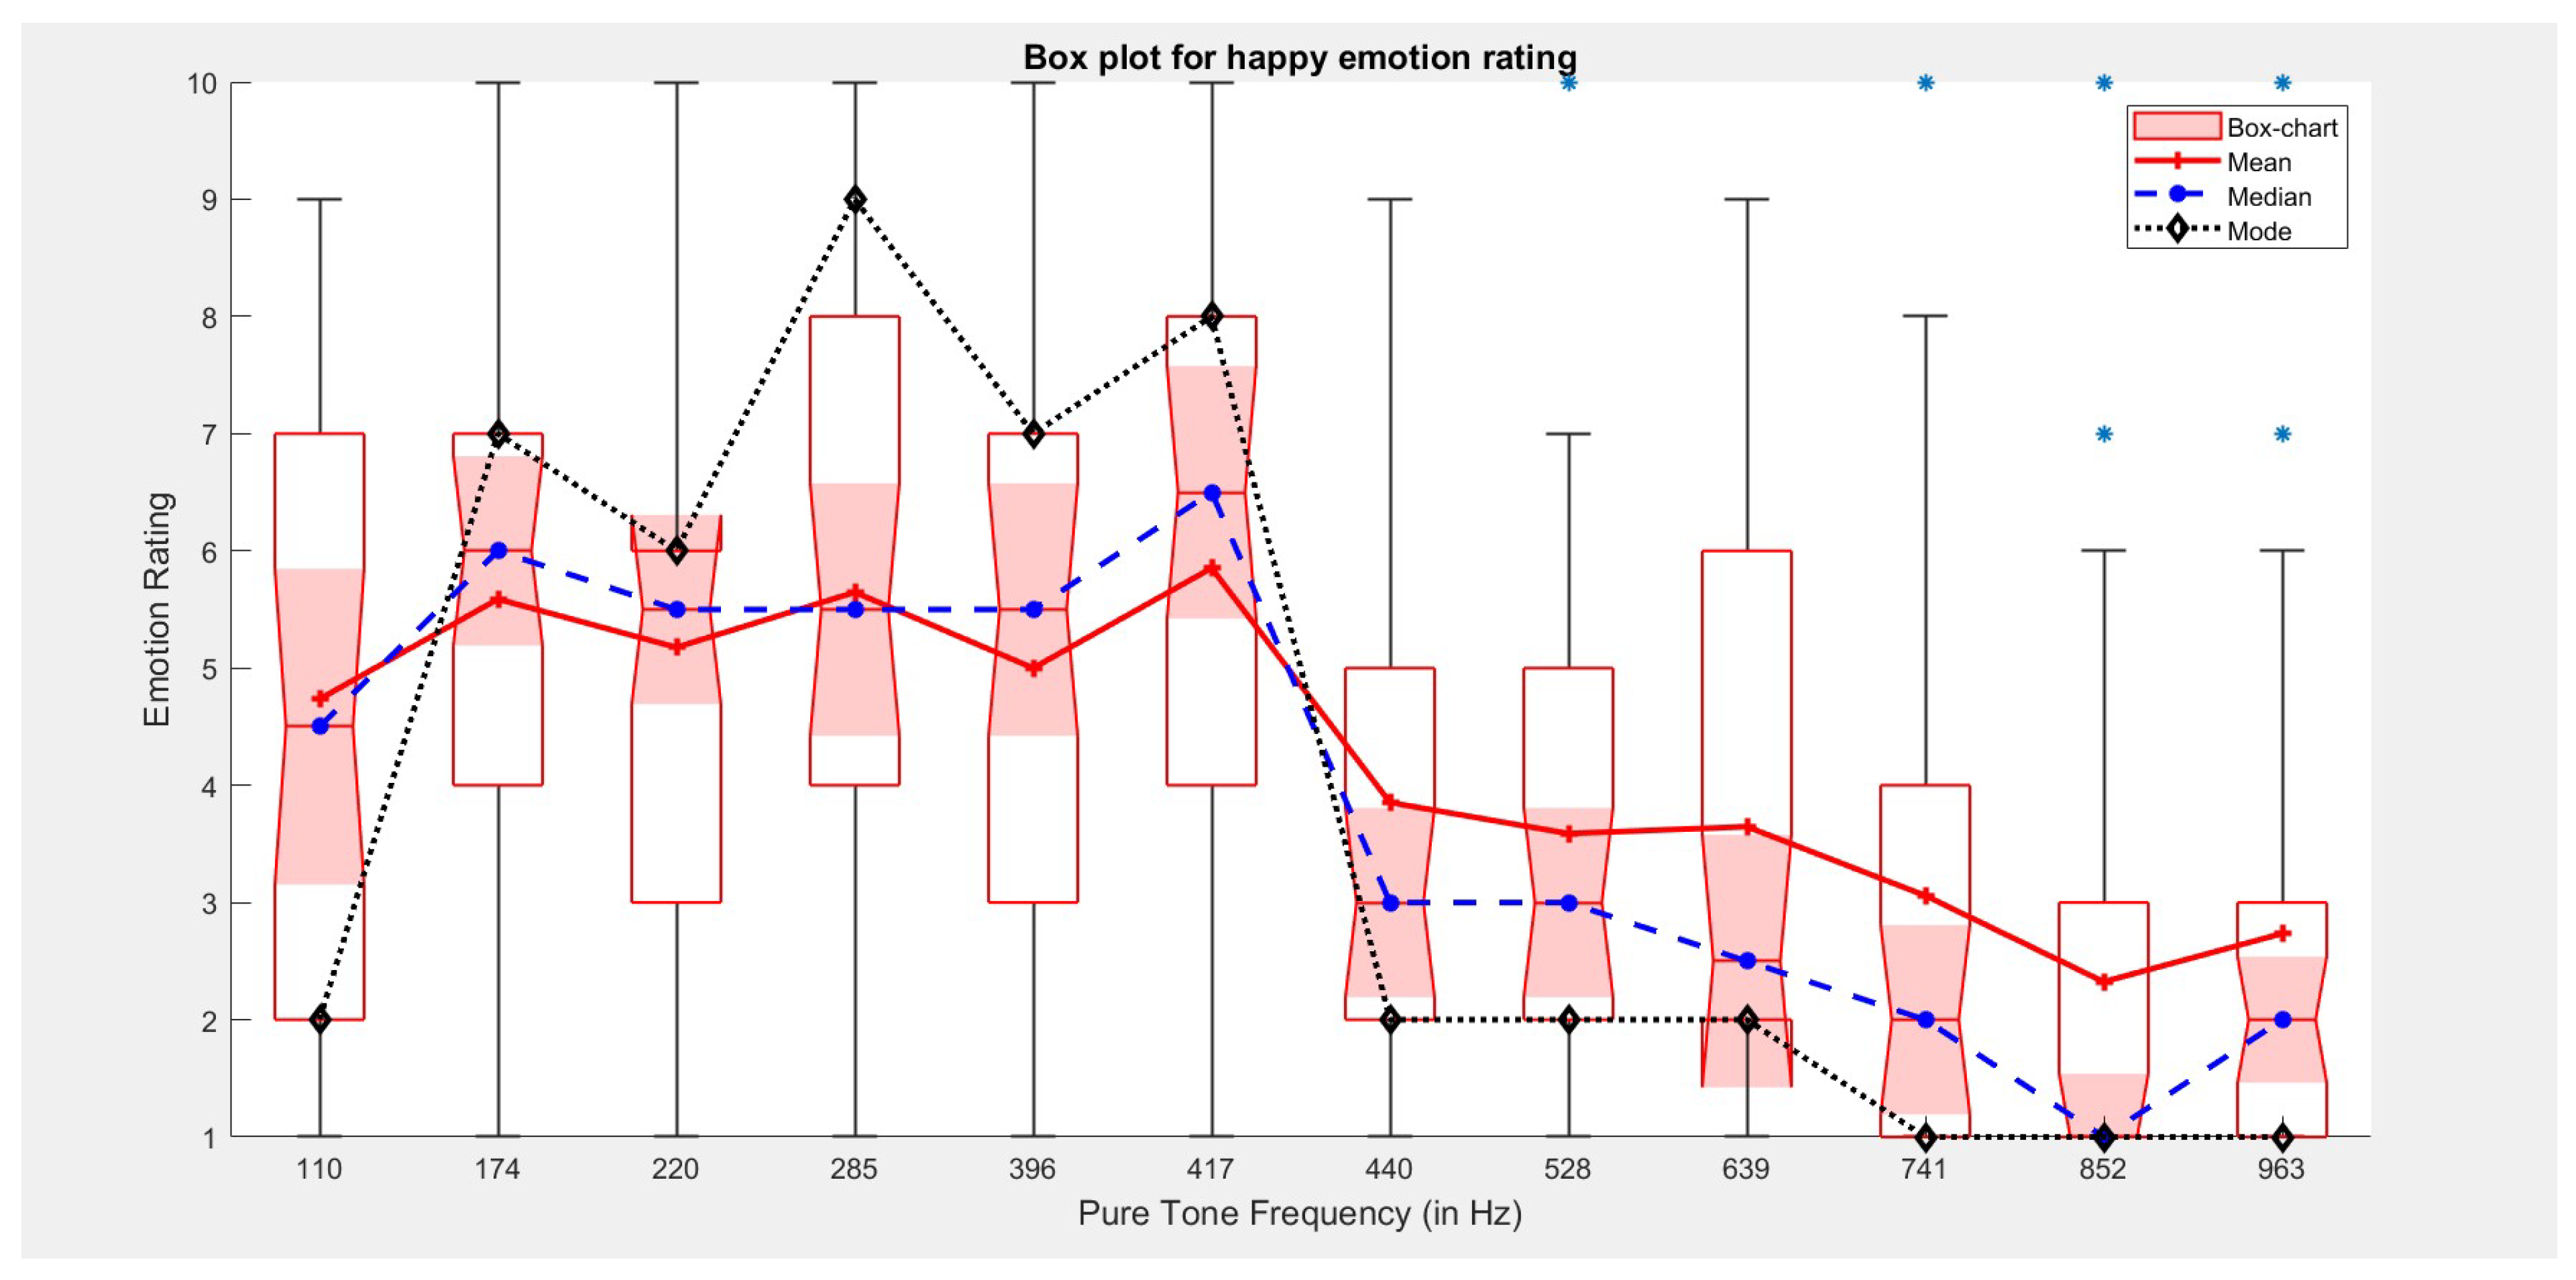
From the happy emotion rating plot (Figure 2), it can be concluded that the preferred pure tone lies in the frequency range of 210–528 Hz. This result also supports the findings of [36]. Apart from that, it can also be concluded that the perception of happy emotion corresponding to higher frequencies is quite contrasting, and hence the appearance of several outliers.
4.2. Sad
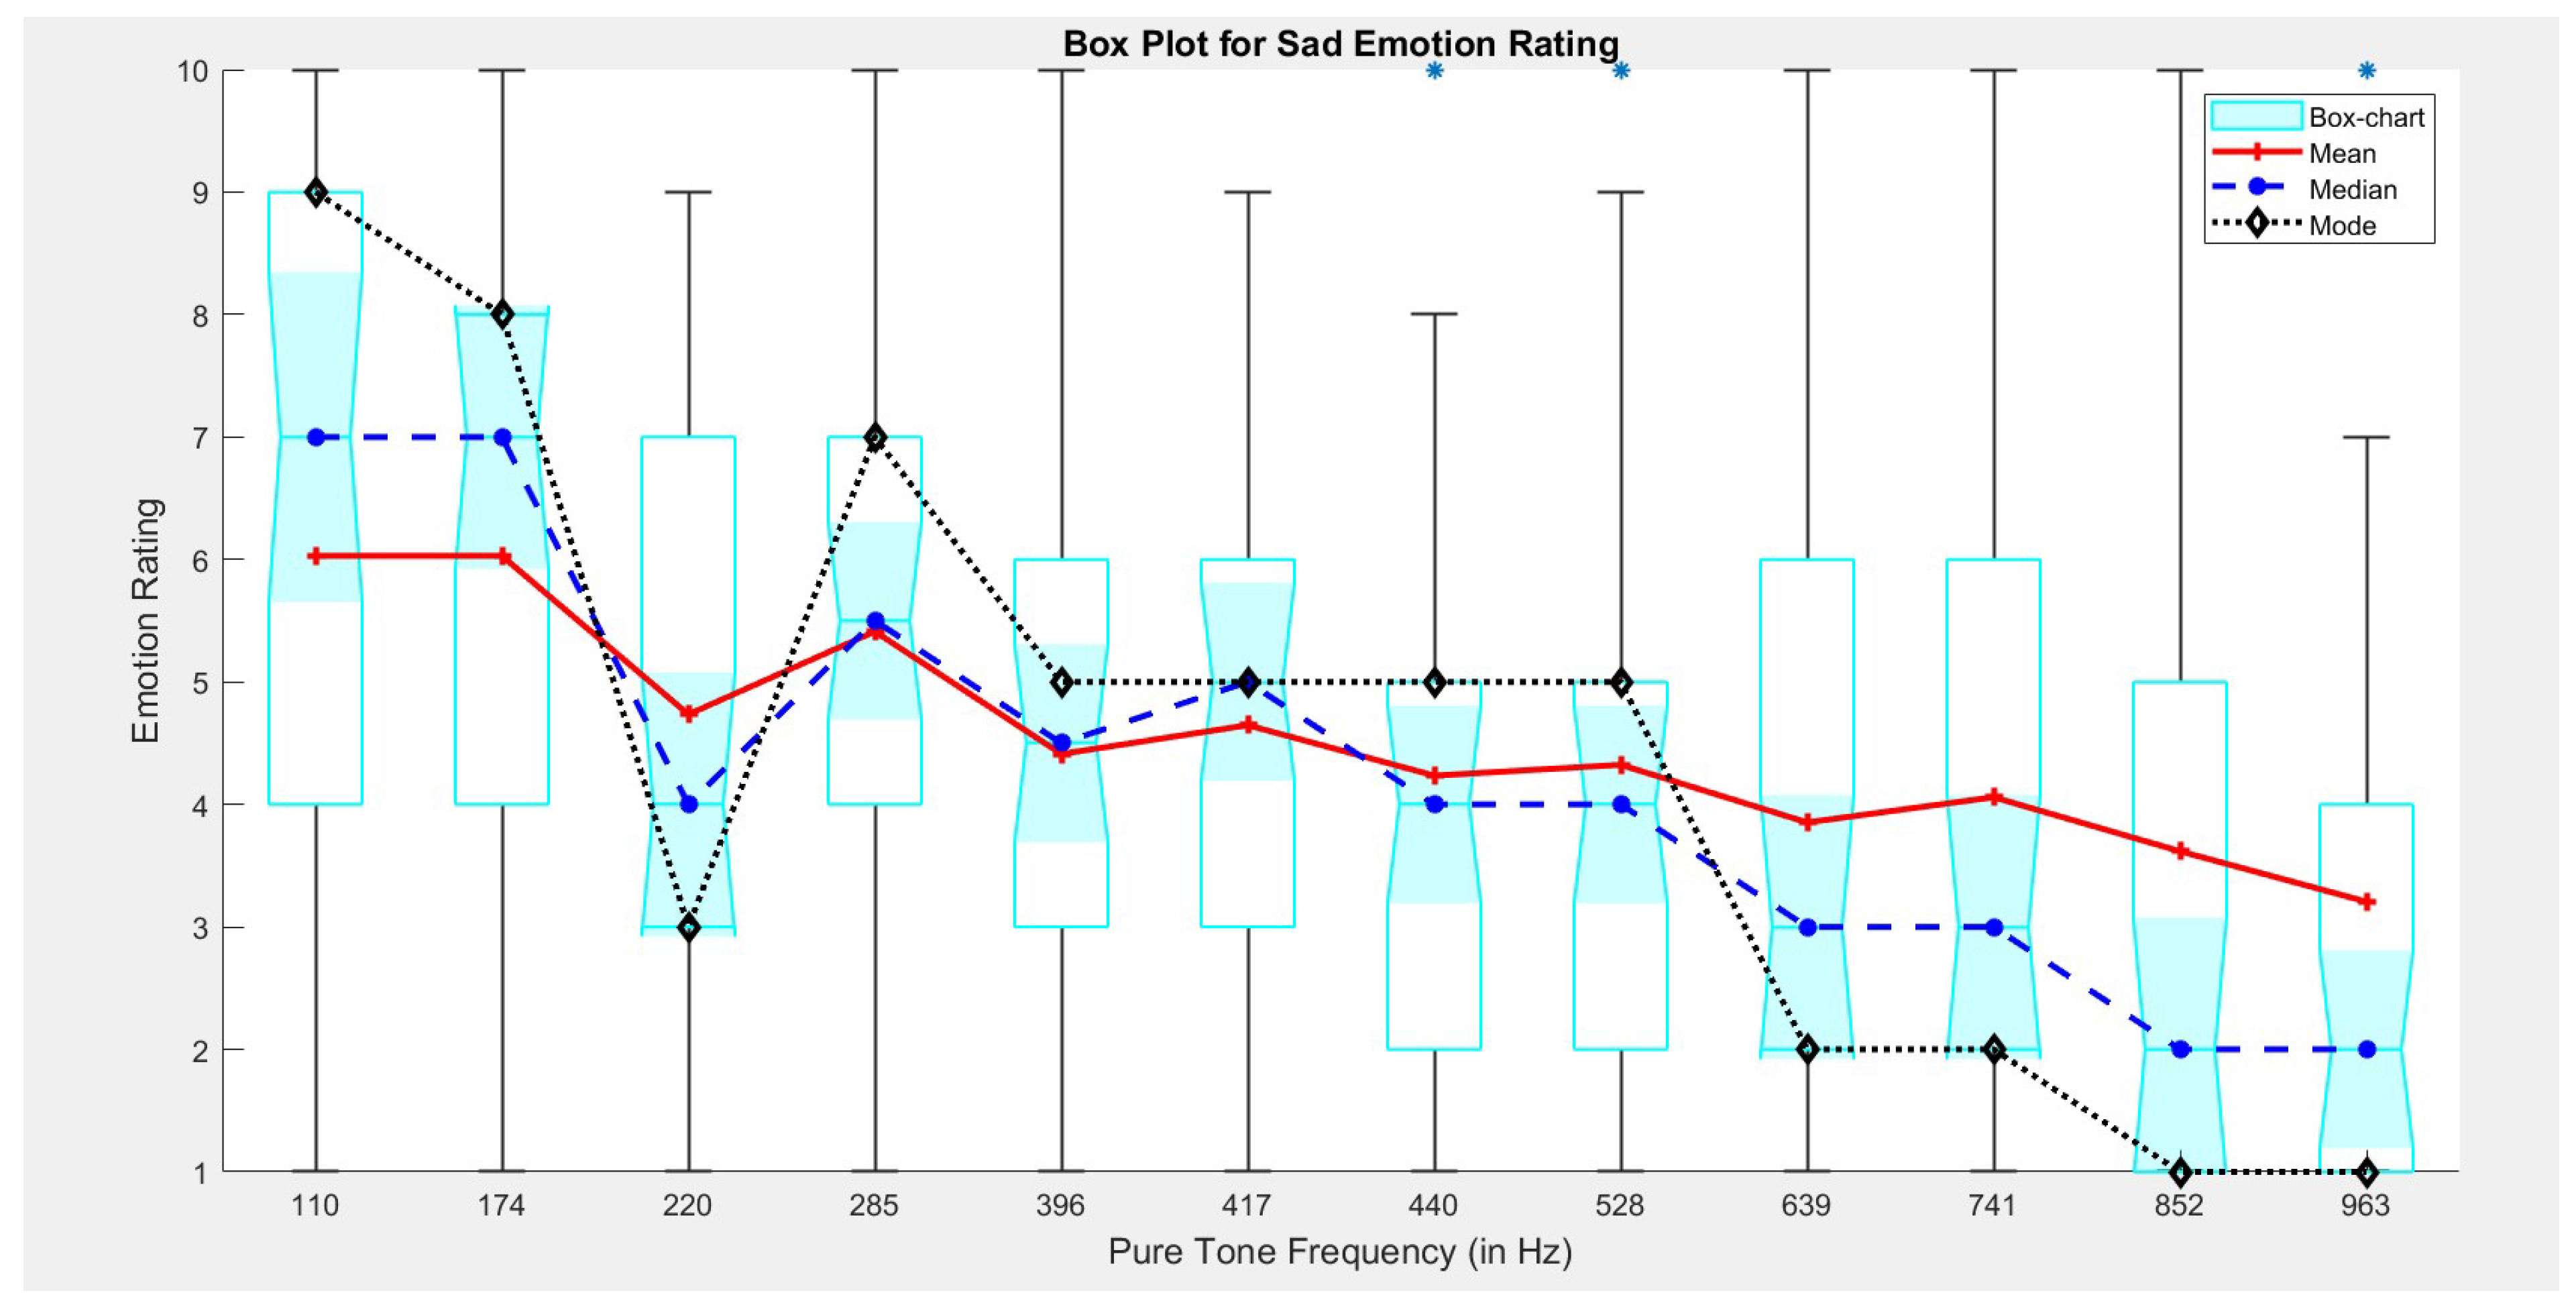
The sad emotion rating plot (Figure 3) clearly depicts that the low frequency range corresponds to a higher emotion rating and vice-versa. Also, it can be concluded that the emotion rating corresponding to sad emotion class decreases exponentially with increase in pure tone frequency, and thus reflects the Negative Valence—Low Arousal nature of the sad emotion [44].
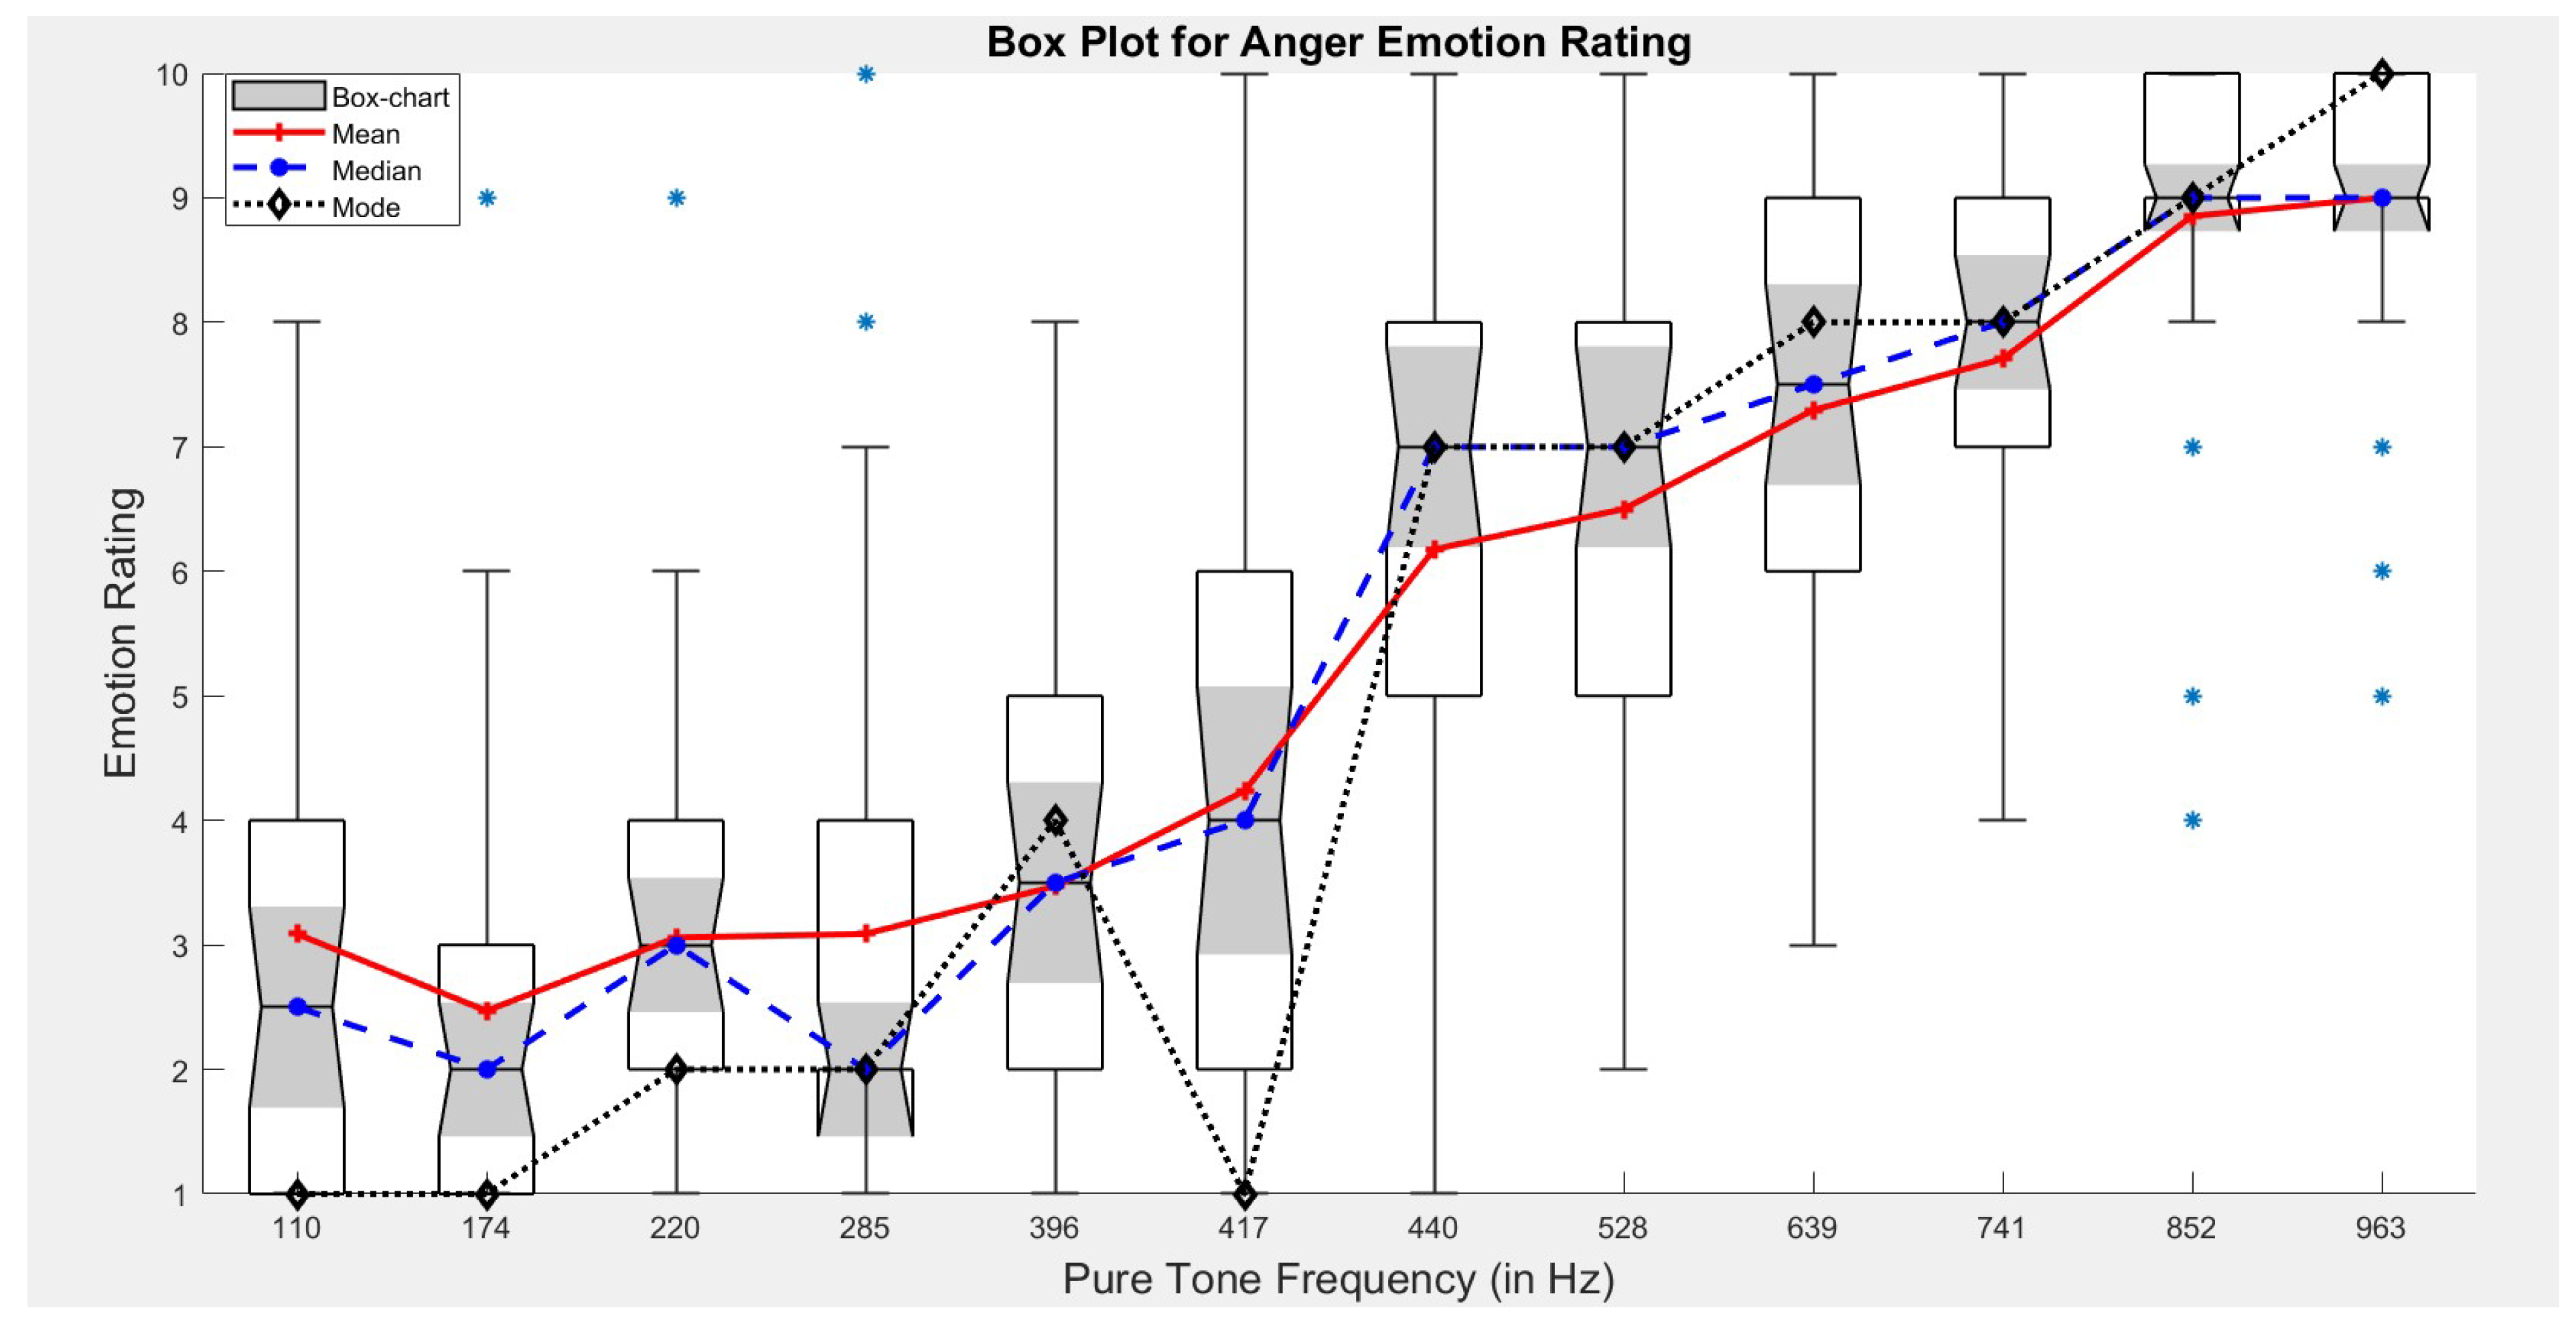
4.3. Anger
4.4. Calm
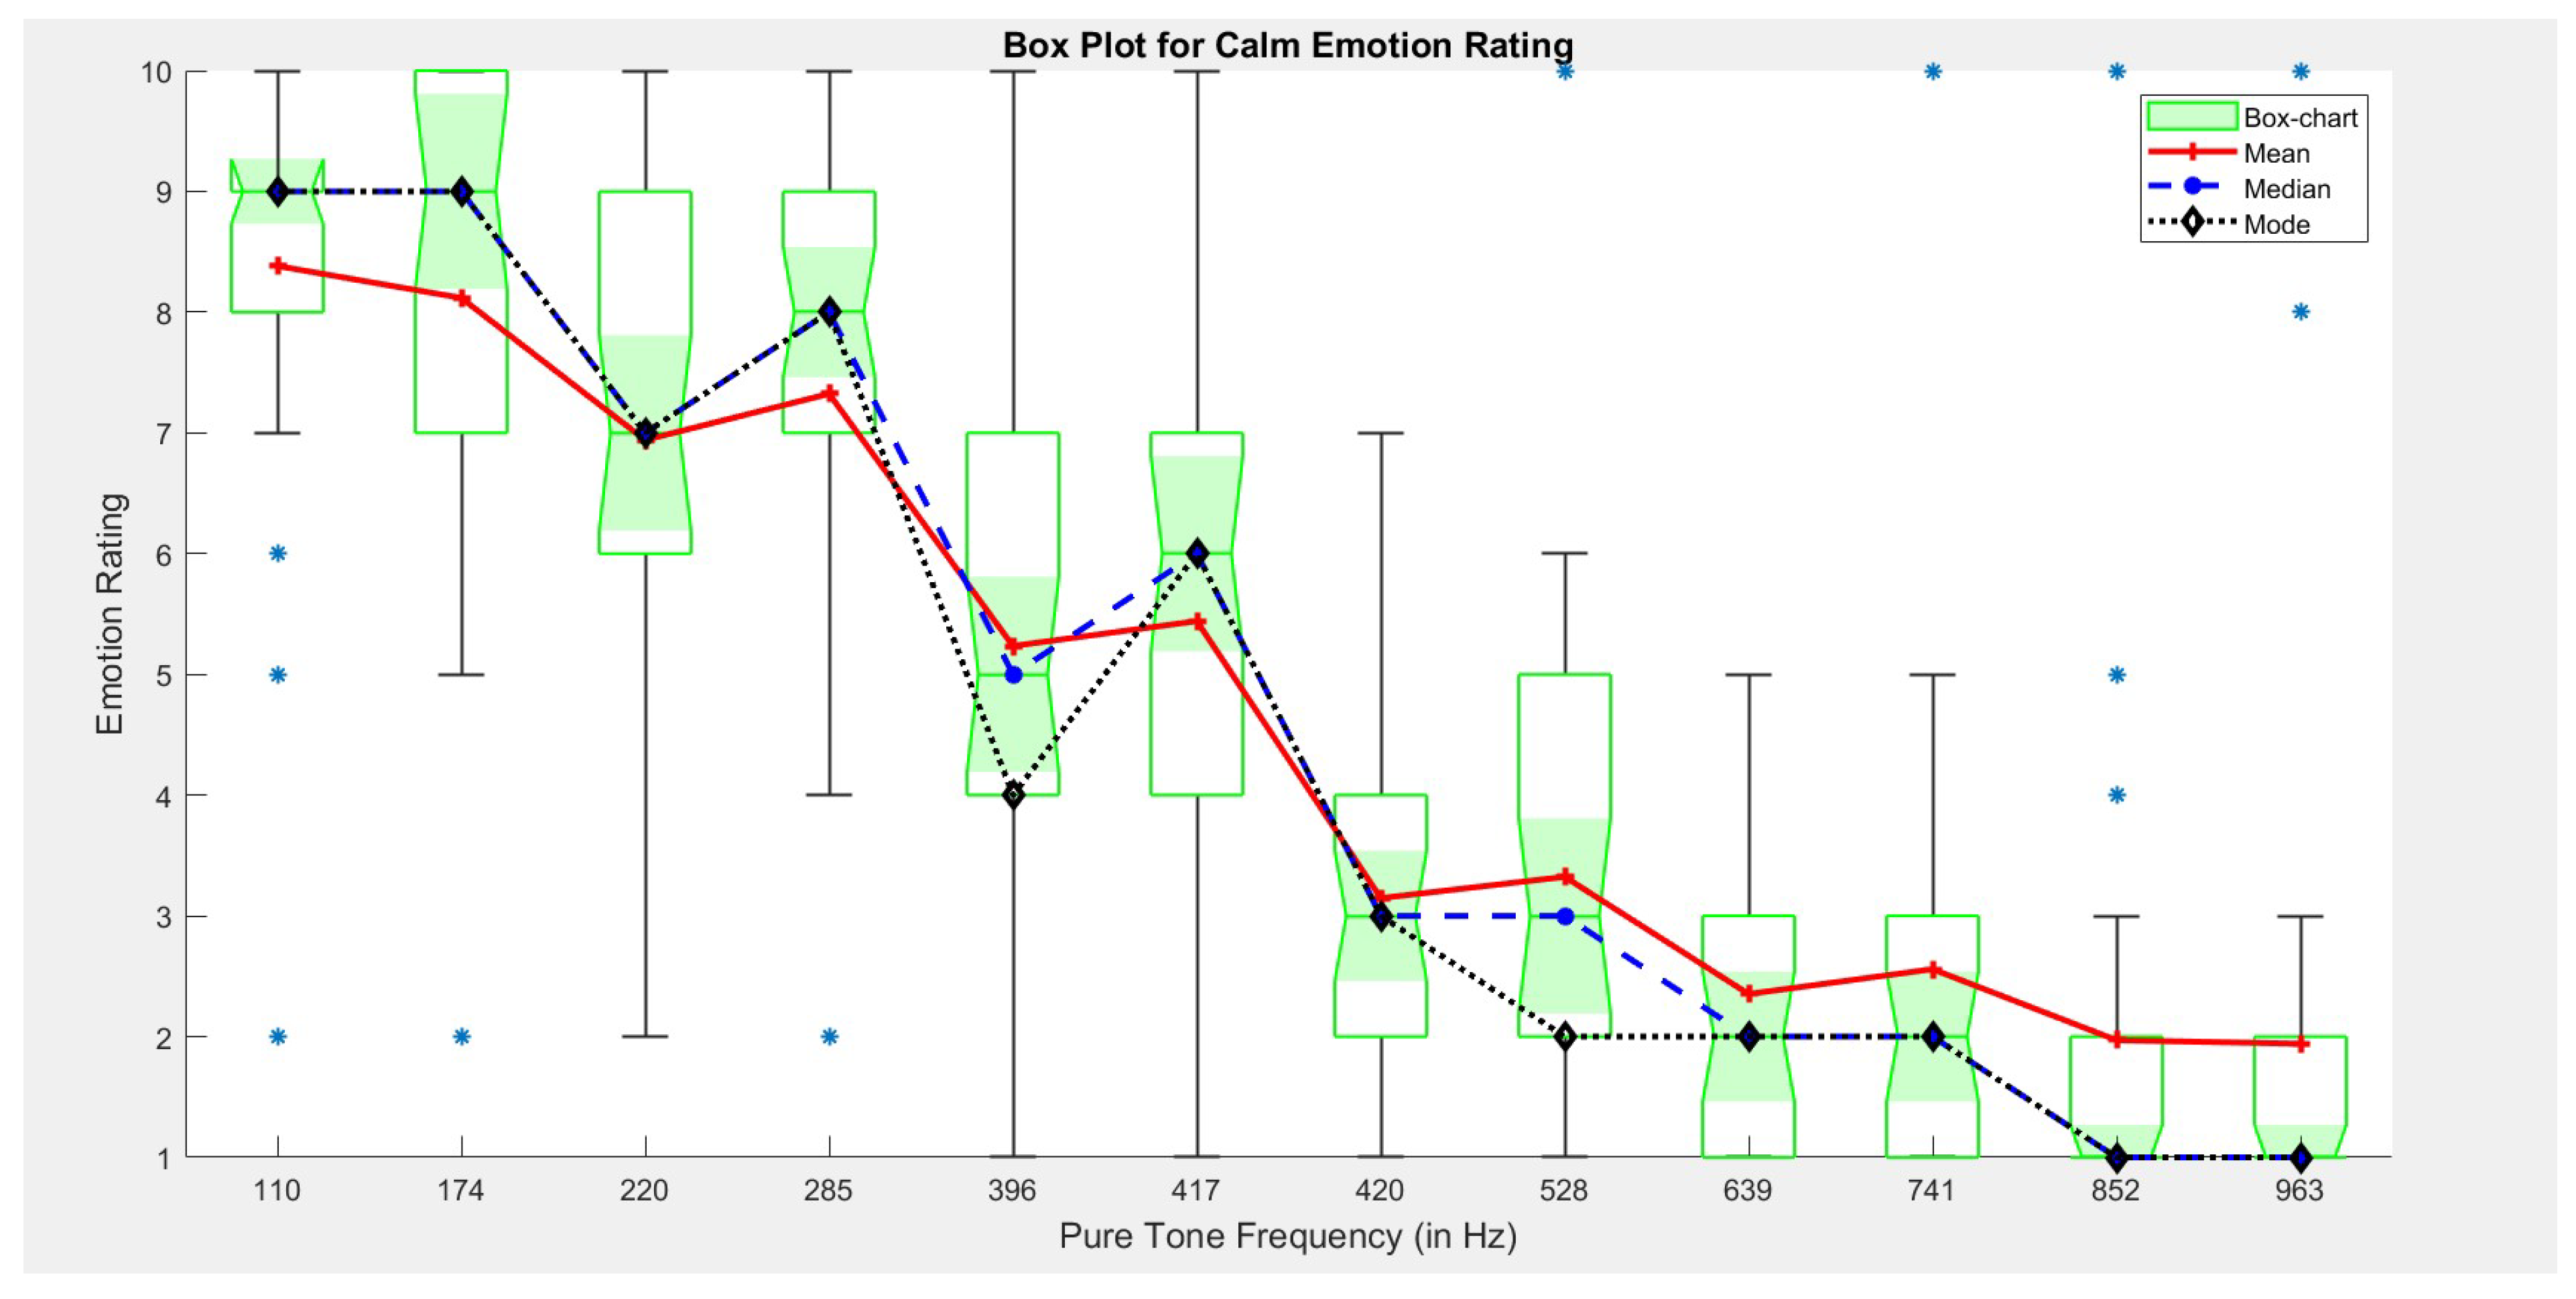
For emotion class—Calm, the rating plot (Figure 5) depicts an interesting relationship between pure tone frequencies and emotion rating. As the emotion rating remained almost constant for both lower and higher frequencies, within the frequency range from 285–528 Hz, the rating dips sharply.
Since, the emotion rating test is conducted online via Qualtrics software as a survey tool, there is a possibility that differences in testing conditions (i.e., ambiance noise, head-phone response, and quality) may affect the true stimuli to the listener. To minimize the influence of these variations on the final observation, box-plots are used as a statistical tool that is capable of visually summarising and conveying the level, spread, outliers, and symmetry of data distribution [46]. Also, mean, median, and mode of emotion rating data is plotted along with box-plot to visualise the overall trend. Apart from that, the sample is dominated by a young age group (the average age of participants is 27 years) which may lead to some bias in the perception of different pure tones in the specified frequency range.
5. Conclusions and Future work
Overall, the findings of this research are interesting and establish the relationship between pure tone frequencies (in Hz) and perceived emotions. Specifically, the crossover points for all four primary emotions Happy, Sad, Anger, and calm lies in the frequency range of 417–440 Hz. The results also consolidated several hypotheses with regards to human emotion perception:
- Frequency range 432–440 Hz is neutral from human emotion perspective;
- Primary emotion pairs such as Happy—Sad, and Angry—Calm are mirror-symmetric in nature;
- Preferred tones (i.e., listener’s most liked tone—no affiliation to a particular emotion) lie in the frequency range of 210–540 Hz.
Also, given a rather simple stimuli such as pure tones, the results are still promising thus this work deserves further attention. From a future perspective, the findings of this research can lay the pathway for further investigation into how pure tone based human emotion perception can vary with respect to other physical parameters such as rate of change in sound intensity, change in direction, and other spatial features.
Author Contributions
Conceptualization: M.K., T.D.A. and P.S.; Methodology: T.D.A., P.S. and M.K.; Perception test designing: M.K. and P.S.; Validation: T.D.A. and P.S.; Formal analysis: M.K., T.D.A. and P.S.; Investigation: M.K., T.D.A. and P.S.; Resources: T.D.A. and P.S.; Data curation: M.K.; Writing—original draft preparation: M.K.; writing—review and editing: T.D.A., P.S. and M.K.; Visualization: M.K., T.D.A. and P.S.; Supervision: T.D.A. and P.S.; Project administration: T.D.A. and P.S.; Funding acquisition: T.D.A. All authors have read and agreed to the published version of the manuscript.
Funding
This research received no external findings.
Institutional Review Board Statement
The ethical aspects of this research have been approved by the ANU Human Research Ethics Committee (Protocol 2021/418).
Informed Consent Statement
Informed consent was obtained from all subjects involved in the study.
Data Availability Statement
Data will be securely stored on access restricted, password protected AASP’s data storage server within the Australian National University. The de-identified data will be available on request.
Conflicts of Interest
The authors declare no conflict of interest.
References
- Davidson, L.S. The effects of early acoustic hearing on speech perception, language, and literacy abilities of pediatric cochlear implant recipients. J. Acoust. Soc. Am. 2018, 143, 1721. [Google Scholar] [CrossRef]
- Luo, X. Talker variability effects on vocal emotion recognition in acoustic and simulated electric hearing. J. Acoust. Soc. Am. 2016, 140, EL497–EL503. [Google Scholar] [CrossRef] [PubMed] [Green Version]
- Liu, M.; Chen, H.; Li, Y.; Zhang, F. Emotional tone-based audio continuous emotion recognition. In Proceedings of the International Conference on Multimedia Modeling 2015, Sydney, NSW, Australia, 5–7 January 2015; Springer: Cham, Switzerland, 2015; pp. 470–480. [Google Scholar]
- Kao, F.C.; Wang, S.R.; Chang, Y.J. Brainwaves analysis of positive and negative emotions. ISAA 2015, 12, 1263–1266. [Google Scholar]
- Zieliński, S.K.; Lee, H. Automatic spatial audio scene classification in binaural recordings of music. Appl. Sci. 2019, 9, 1724. [Google Scholar] [CrossRef] [Green Version]
- Nordström, H.; Laukka, P. The time course of emotion recognition in speech and music. J. Acoust. Soc. Am. 2019, 145, 3058–3074. [Google Scholar] [CrossRef]
- Alías, F.; Socoró, J.C.; Sevillano, X. A review of physical and perceptual feature extraction techniques for speech, music and environmental sounds. Appl. Sci. 2016, 6, 143. [Google Scholar] [CrossRef] [Green Version]
- Shu, L.; Xie, J.; Yang, M.; Li, Z.; Li, Z.; Liao, D.; Xu, X.; Yang, X. A review of emotion recognition using physiological signals. Sensors 2018, 18, 2074. [Google Scholar] [CrossRef] [Green Version]
- Saganowski, S. Bringing Emotion Recognition Out of the Lab into Real Life: Recent Advances in Sensors and Machine Learning. Electronics 2022, 11, 496. [Google Scholar] [CrossRef]
- Ma, F.; Zhang, W.; Li, Y.; Huang, S.L.; Zhang, L. Learning better representations for audio-visual emotion recognition with common information. Appl. Sci. 2020, 10, 7239. [Google Scholar] [CrossRef]
- Ma, F.; Li, Y.; Ni, S.; Huang, S.; Zhang, L. Data Augmentation for Audio–Visual Emotion Recognition with an Efficient Multimodal Conditional GAN. Appl. Sci. 2022, 12, 527. [Google Scholar] [CrossRef]
- Anaya, E.M.; Pisoni, D.B.; Kronenberger, W.G. Long-term musical experience and auditory and visual perceptual abilities under adverse conditions. J. Acoust. Soc. Am. 2016, 140, 2074–2081. [Google Scholar] [CrossRef] [PubMed] [Green Version]
- Aouani, H.; Ayed, Y.B. Speech emotion recognition with deep learning. Procedia Comput. Sci. 2020, 176, 251–260. [Google Scholar] [CrossRef]
- Liu, S.; Zhang, M.; Fang, M.; Zhao, J.; Hou, K.; Hung, C.C. Speech emotion recognition based on transfer learning from the FaceNet framework. J. Acoust. Soc. Am. 2021, 149, 1338–1345. [Google Scholar] [CrossRef] [PubMed]
- Alm, M.; Behne, D. Age mitigates the correlation between cognitive processing speed and audio-visual asynchrony detection in speech. J. Acoust. Soc. Am. 2014, 136, 2816–2826. [Google Scholar] [CrossRef]
- Niu, Y.; Zou, D.; Niu, Y.; He, Z.; Tan, H. A breakthrough in speech emotion recognition using deep retinal convolution neural networks. arXiv 2017, arXiv:1707.09917. [Google Scholar]
- Zeng, Z.; Pantic, M.; Roisman, G.I.; Huang, T.S. A survey of affect recognition methods: Audio, visual, and spontaneous expressions. IEEE Trans. Pattern Anal. Mach. Intell. 2008, 31, 39–58. [Google Scholar] [CrossRef]
- Steidl, S.; Levit, M.; Batliner, A.; Noth, E.; Niemann, H. “Of all things the measure is man” automatic classification of emotions and inter-labeler consistency [speech-based emotion recognition]. In Proceedings of the (ICASSP’05) IEEE International Conference on Acoustics, Speech, and Signal Processing, Philadelphia, PA, USA, 18–23 March 2005; Volume 1, pp. I/317–I/320. [Google Scholar]
- Calvo, R.A.; D’Mello, S. Affect detection: An interdisciplinary review of models, methods, and their applications. IEEE Trans. Affect. Comput. 2010, 1, 18–37. [Google Scholar] [CrossRef]
- Wierciński, T.; Rock, M.; Zwierzycki, R.; Zawadzka, T.; Zawadzki, M. Emotion Recognition from Physiological Channels Using Graph Neural Network. Sensors 2022, 22, 2980. [Google Scholar] [CrossRef]
- Choi, Y.; Lee, S.; Jung, S.; Choi, I.M.; Park, Y.K.; Kim, C. Development of an auditory emotion recognition function using psychoacoustic parameters based on the International Affective Digitized Sounds. Behav. Res. Methods 2015, 47, 1076–1084. [Google Scholar] [CrossRef] [Green Version]
- Brumm, H.; Zollinger, S.A. The evolution of the Lombard effect: 100 years of psychoacoustic research. Behaviour 2011, 148, 1173–1198. [Google Scholar] [CrossRef] [Green Version]
- Adolphs, R.; Damasio, H.; Tranel, D. Neural systems for recognition of emotional prosody: A 3-D lesion study. Emotion 2002, 2, 23. [Google Scholar] [CrossRef] [PubMed]
- Juslin, P.N.; Laukka, P. Communication of emotions in vocal expression and music performance: Different channels, same code? Psychol. Bull. 2003, 129, 770. [Google Scholar] [CrossRef] [PubMed] [Green Version]
- Castellano, G.; Kessous, L.; Caridakis, G. Emotion recognition through multiple modalities: Face, body gesture, speech. In Affect and Emotion in Human-Computer Interaction; Springer: Berlin/Heidelberg, Germany, 2008; pp. 92–103. [Google Scholar]
- Scherer, K.R.; Ellgring, H. Multimodal expression of emotion: Affect programs or componential appraisal patterns? Emotion 2007, 7, 158. [Google Scholar] [CrossRef] [PubMed]
- Mittal, T.; Guhan, P.; Bhattacharya, U.; Chandra, R.; Bera, A.; Manocha, D. Emoticon: Context-aware multimodal emotion recognition using frege’s principle. In Proceedings of the IEEE/CVF Conference on Computer Vision and Pattern Recognition, Seattle, WA, USA, 13–19 June 2020; pp. 14234–14243. [Google Scholar]
- Ooi, C.S.; Seng, K.P.; Ang, L.M.; Chew, L.W. A new approach of audio emotion recognition. Expert Syst. Appl. 2014, 41, 5858–5869. [Google Scholar] [CrossRef]
- Liu, H.; Zhang, Y.; Li, Y.; Kong, X. Review on Emotion Recognition Based on Electroencephalography. Front. Comput. Neurosci. 2021, 15, 758212. [Google Scholar] [CrossRef]
- Zhu-Zhou, F.; Gil-Pita, R.; García-Gómez, J.; Rosa-Zurera, M. Robust Multi-Scenario Speech-Based Emotion Recognition System. Sensors 2022, 22, 2343. [Google Scholar] [CrossRef]
- Belin, P.; Fillion-Bilodeau, S.; Gosselin, F. The Montreal Affective Voices: A validated set of nonverbal affect bursts for research on auditory affective processing. Behav. Res. Methods 2008, 40, 531–539. [Google Scholar] [CrossRef] [Green Version]
- Paquette, S.; Peretz, I.; Belin, P. The “Musical Emotional Bursts”: A validated set of musical affect bursts to investigate auditory affective processing. Front. Psychol. 2013, 4, 509. [Google Scholar] [CrossRef] [Green Version]
- Hinkle, B.M.; Hinkle, M. The Re-Creating of the Individual: A Study of Psychological Types and Their Relation to Psychoanalysis; Harcourt, Brace: San Diego, CA, USA, 1923. [Google Scholar]
- Goudbeek, M.; Scherer, K. Beyond arousal: Valence and potency/control cues in the vocal expression of emotion. J. Acoust. Soc. Am. 2010, 128, 1322–1336. [Google Scholar] [CrossRef]
- Asutay, E.; Västfjäll, D.; Tajadura-Jimenez, A.; Genell, A.; Bergman, P.; Kleiner, M. Emoacoustics: A study of the psychoacoustical and psychological dimensions of emotional sound design. J. Audio Eng. Soc. 2012, 60, 21–28. [Google Scholar]
- Vitz, P.C. Preference for tones as a function of frequency (hertz) and intensity (decibels). Percept. Psychophys. 1972, 11, 84–88. [Google Scholar] [CrossRef] [Green Version]
- Västfjäll, D. Emotional reactions to sounds without meaning. Psychology 2012, 3, 606. [Google Scholar] [CrossRef] [Green Version]
- Desmet, P. Designing Emotions. Ph.D. Thesis, Delft University of Technology, Delft, The Netherlands, 2002. [Google Scholar]
- Picard, R.W. Affective Computing; MIT Press: Cambridge, MA, USA, 2000. [Google Scholar]
- Västfjäll, D. Emotion induction through music: A review of the musical mood induction procedure. Music. Sci. 2001, 5, 173–211. [Google Scholar] [CrossRef]
- Pereira, C. Frequencies of the Buddhist Meditative Chant–Om Mani Padme Hum. Int. J. Sci. Res. (IJSR) 2013, 5, 761–766. [Google Scholar]
- Gangemi, A.; Mancini, F.; Johnson-Laird, P.N. Emotion, reasoning, and psychopathology. In Emotion and Reasoning; Psychology Press: London, UK, 2013; pp. 44–83. [Google Scholar]
- Izard, C.E. Human Emotions; Springer Science & Business Media: Cham, Switzerland, 2013. [Google Scholar]
- Russell, J.A.; Lewicka, M.; Niit, T. A cross-cultural study of a circumplex model of affect. J. Personal. Soc. Psychol. 1989, 57, 848. [Google Scholar] [CrossRef]
- Palmblad, S. A = 432: A Superior Tuning or Just a Different Intonation? How Tuning Standards Affects Emotional Response, Timbre and Sound Quality in Music. Bachelor’s Thesis, Medya Sanatları, Estetik ve Anlatımı, Skövde Üniversitesi, Skövde, Sweden, 2018. [Google Scholar]
- Williamson, D.F.; Parker, R.A.; Kendrick, J.S. The box plot: A simple visual method to interpret data. Ann. Intern. Med. 1989, 110, 916–921. [Google Scholar] [CrossRef]
Figure 1.
Plot for different emotion class rating vs Pure tone frequency. Here, the line graph for all four primary emotions—Happy, Sad, Anger, and Calm are plotted w.r.t pure tone frequency (in Hz).
Figure 1.
Plot for different emotion class rating vs Pure tone frequency. Here, the line graph for all four primary emotions—Happy, Sad, Anger, and Calm are plotted w.r.t pure tone frequency (in Hz).

Figure 2.
Plot for Happy emotion rating v/s Pure tone frequency. Here, the shaded area (red in color) of box chart represents distribution for annotated emotion corresponding to each pure tone frequency.
Figure 2.
Plot for Happy emotion rating v/s Pure tone frequency. Here, the shaded area (red in color) of box chart represents distribution for annotated emotion corresponding to each pure tone frequency.

Figure 3.
Plot for Sad emotion rating v/s Pure tone frequency. Here, the shaded area (cyan in color) of box chart represents distribution for annotated emotion corresponding to each pure tone frequency.
Figure 3.
Plot for Sad emotion rating v/s Pure tone frequency. Here, the shaded area (cyan in color) of box chart represents distribution for annotated emotion corresponding to each pure tone frequency.

Figure 4.
Plot for Anger emotion rating v/s Pure tone frequency. Here, the shaded area (grey in color) of box chart represents distribution for annotated emotion corresponding to each pure tone frequency.
Figure 4.
Plot for Anger emotion rating v/s Pure tone frequency. Here, the shaded area (grey in color) of box chart represents distribution for annotated emotion corresponding to each pure tone frequency.

Figure 5.
Plot for Calm emotion rating v/s Pure tone frequency. Here, the shaded area (green in color) of box chart represents distribution for annotated emotion corresponding to each pure tone frequency.
Figure 5.
Plot for Calm emotion rating v/s Pure tone frequency. Here, the shaded area (green in color) of box chart represents distribution for annotated emotion corresponding to each pure tone frequency.

Publisher’s Note: MDPI stays neutral with regard to jurisdictional claims in published maps and institutional affiliations. |
© 2022 by the authors. Licensee MDPI, Basel, Switzerland. This article is an open access article distributed under the terms and conditions of the Creative Commons Attribution (CC BY) license (https://creativecommons.org/licenses/by/4.0/).
Share and Cite
MDPI and ACS Style
Kumar, M.; Abhayapala, T.D.; Samarasinghe, P. A Preliminary Investigation on Frequency Dependant Cues for Human Emotions. Acoustics 2022, 4, 460-468. https://doi.org/10.3390/acoustics4020028
AMA Style
Kumar M, Abhayapala TD, Samarasinghe P. A Preliminary Investigation on Frequency Dependant Cues for Human Emotions. Acoustics. 2022; 4(2):460-468. https://doi.org/10.3390/acoustics4020028
Chicago/Turabian StyleKumar, Manish, Thushara D. Abhayapala, and Prasanga Samarasinghe. 2022. "A Preliminary Investigation on Frequency Dependant Cues for Human Emotions" Acoustics 4, no. 2: 460-468. https://doi.org/10.3390/acoustics4020028