Article

Acoustic Attenuation of COVID-19 Face Masks: Correlation to Fibrous Material Porosity, Mask Breathability and Bacterial Filtration Efficiency

1
Dipartimento di Ingegneria Industriale e Scienze Matematiche, Università Politecnica delle Marche, Via Brecce Bianche, 60131 Ancona, Italy
2
LABC19 Centro di Ricerca e Servizio per l’Emergenza COVID-19, Università Politecnica delle Marche, 60131 Ancona, Italy
3
Dipartimento di Ingegneria Meccanica, Politecnico di Milano, Via La Masa 1, 20156 Milano, Italy
4
Dipartimento di Scienze della Vita e dell’Ambiente, Università Politecnica delle Marche, Via Brecce Bianche, 60131 Ancona, Italy
*
Author to whom correspondence should be addressed.
Acoustics 2022, 4(1), 123-138; https://doi.org/10.3390/acoustics4010009
Submission received: 11 December 2021 / Revised: 24 January 2022 / Accepted: 8 February 2022 / Published: 16 February 2022
(This article belongs to the Special Issue Acoustical Materials)

Abstract

:
This paper presents an experimental study on acoustic attenuation of different types of face masks in use by the general population during the COVID-19 pandemic. In particular, measurements are performed on ten samples of masks, of which four are medical masks, three are respirators, and three are community masks. Breathability and Bacterial Filtration Efficiency (BFE) tests, in compliance to the standard characterization process of medical masks, are also carried out. The porosity on each layer composing the masks is measured by processing their scanning electron microscopy (SEM) images. The analysis of the results aims to establish if acoustic attenuation is correlated to any of these parameters. It emerges that porosity and breathability are strongly correlated to acoustic attenuation, while bacterial filtration efficiency is not.

1. Introduction

The COVID-19 pandemic increased the interest in face masks as well as encouraged their broader use by the general population. The World Health Organization (WHO) declares [1] “Masks are a key measure to suppress transmission and save lives. Masks should be used as part of a comprehensive ‘Do it all!’ approach including physical distancing, avoiding crowded, closed and close-contact settings, good ventilation, cleaning hands, covering sneezes and coughs, and more. Depending on the type, masks can be used for either protection of healthy persons or to prevent onward transmission”.
Face masks are disposable devices whose main function is filtering droplets and particles. Indeed, masks are specifically designed to cover the nose and mouth and belong to two main classes: medical masks and respirators. Medical masks are designed to prevent the wearer from spreading droplets, while respirators act as a bidirectional barrier for airborne particles and droplets, being designed to protect the wearer from inhaling particles and droplets and to impede the wearer from spreading droplets. Regulations are quite clear towards these two types of face mask, given the existence of specific standards detailing performance requirements and test procedures to assess the compliance to requirements [2,3]. These standards prescribe minimum mask performance requirements with regard to filtering efficiency, as well as ergonomic characteristics such as breathability, mask fit and, finally, biocompatibility characteristics, to assure on one side efficacy and on the other the safety of use. The standards prescribe also the testing methods, which are rather complex, as discussed in [4]; in [5], an intercomparison between different laboratories is carried out, to highlight the main issues in mask testing, according to standard procedures, and the related uncertainty when assessing mask breathability and bacterial filtration efficiency.
During the pandemic, due to shortage of respirators and medical masks, so called community masks have also been put on the market and widely used by the population. However, community masks are not subject to any regulation; only recently have they been considered in a CEN document [6], issued in June 2020 as the result of a workshop organized to discuss this topic.
If on the one hand the topic of face masks performance is clear when related to disease prevention, on the other hand their acoustic performance was addressed only marginally before the COVID-19 pandemic and it is not subject to any specific requirement, according to existing standards, despite the huge impact that the acoustic performance of masks can have on people. This is the reason why the interest in acoustic performance of face masks has seen a rapid increase during the pandemic and several scientific papers on the subject have been and are being published in the last two years, addressing this topic from the many different perspectives it deserves.
Nowadays, the acoustic comfort is a hot topic in the automotive and buildings field.
In these fields, the internal noise is estimated, and an acoustic comfort class is assigned to the room/building (good → A-B-C-D-E → bad).
As an example of this trend, in [7] an indirect approach is proposed to estimate the internal acoustic comfort of a building (or single room).
This aspect opens a possible issue related to the combined contribution of masks and room acoustics, with some rooms with particular acoustic comfort classes being “incompatible” with the use of masks.
Very soon after the rise of the pandemic wave, Chodosh et al. [8] focused on the devastating effects of wearing face masks on hearing impaired subjects. In fact, the use of face masks can greatly hamper communication, given the complete cut-off of visual cues from lip reading and facial expressions. Asadi et al. [9] investigated several respiratory actions when wearing face masks and recorded the audio associated with these actions. They proved that people generally speak more loudly when wearing masks. Bandaru et al. [10] investigated acoustic effects on N95 masks (respirator) demonstrating a significant increase in speech reception threshold (mean of 12.4 dB) and a decrease in speech discrimination score, up to 7%difference with personal protective equipment (PPE)—vs. without PPE. In [11], Muzzi et al. demonstrated that wearing face personal protective equipment impairs the transmission of middle-to-high voice frequencies and affects speech intelligibility. More specifically, they proved that medical (surgical) masks are responsible for up to 23.3% loss of speech intelligibility in noisy environments, while PPE account for up to 69.0% reduction in speech intelligibility. Corey et al. [12] examined the acoustic attenuation caused by different face masks using a head-shaped loudspeaker and a live human talker. They demonstrated that all masks, even though great quantitative variability exists between mask types, attenuate frequencies above 1 kHz and that attenuation is greatest in front of the talker. Caniato M. et al. [13] focused on how much COVID-19 face protections influence speech intelligibility in classrooms. The same topic was addressed by Bottalico, P. [14], who carried out experiments in auralised classrooms. The issue of speech intelligibility, and the following listening effort, is also central in the paper [15], where Brown V.A. et al. described the effect of face masks on young persons and older adults. Pörschmann C. et al. [16] studied the impact of face masks on voice radiation.
This brief literature survey, which is not comprehensive, testifies the recent interest of the scientific community in acoustic effects of COVID-19 face masks.
Our paper aims to provide further insight into the topic of the acoustic performance of face masks, by searching for correlations between the acoustic attenuation induced by the masks and their properties, in particular the fibrous material porosity, and functional performance, in particular the mask breathability and its bacterial filtration efficiency.
The paper is organized as follows. The experimental methods are described in Part 2, which describes the types of masks tested, the set-up for acoustic measurement, the measurements of breathability and bacterial filtration efficiency (BFE), according to the standard for medical masks, and the measurement of porosity by image analysis at the scanning electron microscope. Part 3 reports the results and proposes the correlation between acoustic attenuation and the mask’s characteristics and leads to Part 4 which outlines the conclusions.

2. Experimental Methods

Several typologies of protective face masks have been considered and their performances in terms of acoustic attenuation and breathability have been estimated. Three community masks, four medical masks and three respirators have been tested, as reported in Table 1 together with their properties such as the number of layers and mass per unit area. Table 1 also shows the masks tested while worn by the mannequin. For medical masks and respirators only a mask for typology has been shown because the appearance of the masks are similar and they only belong to different brands.

2.1. Acoustic Measurement Set-Up

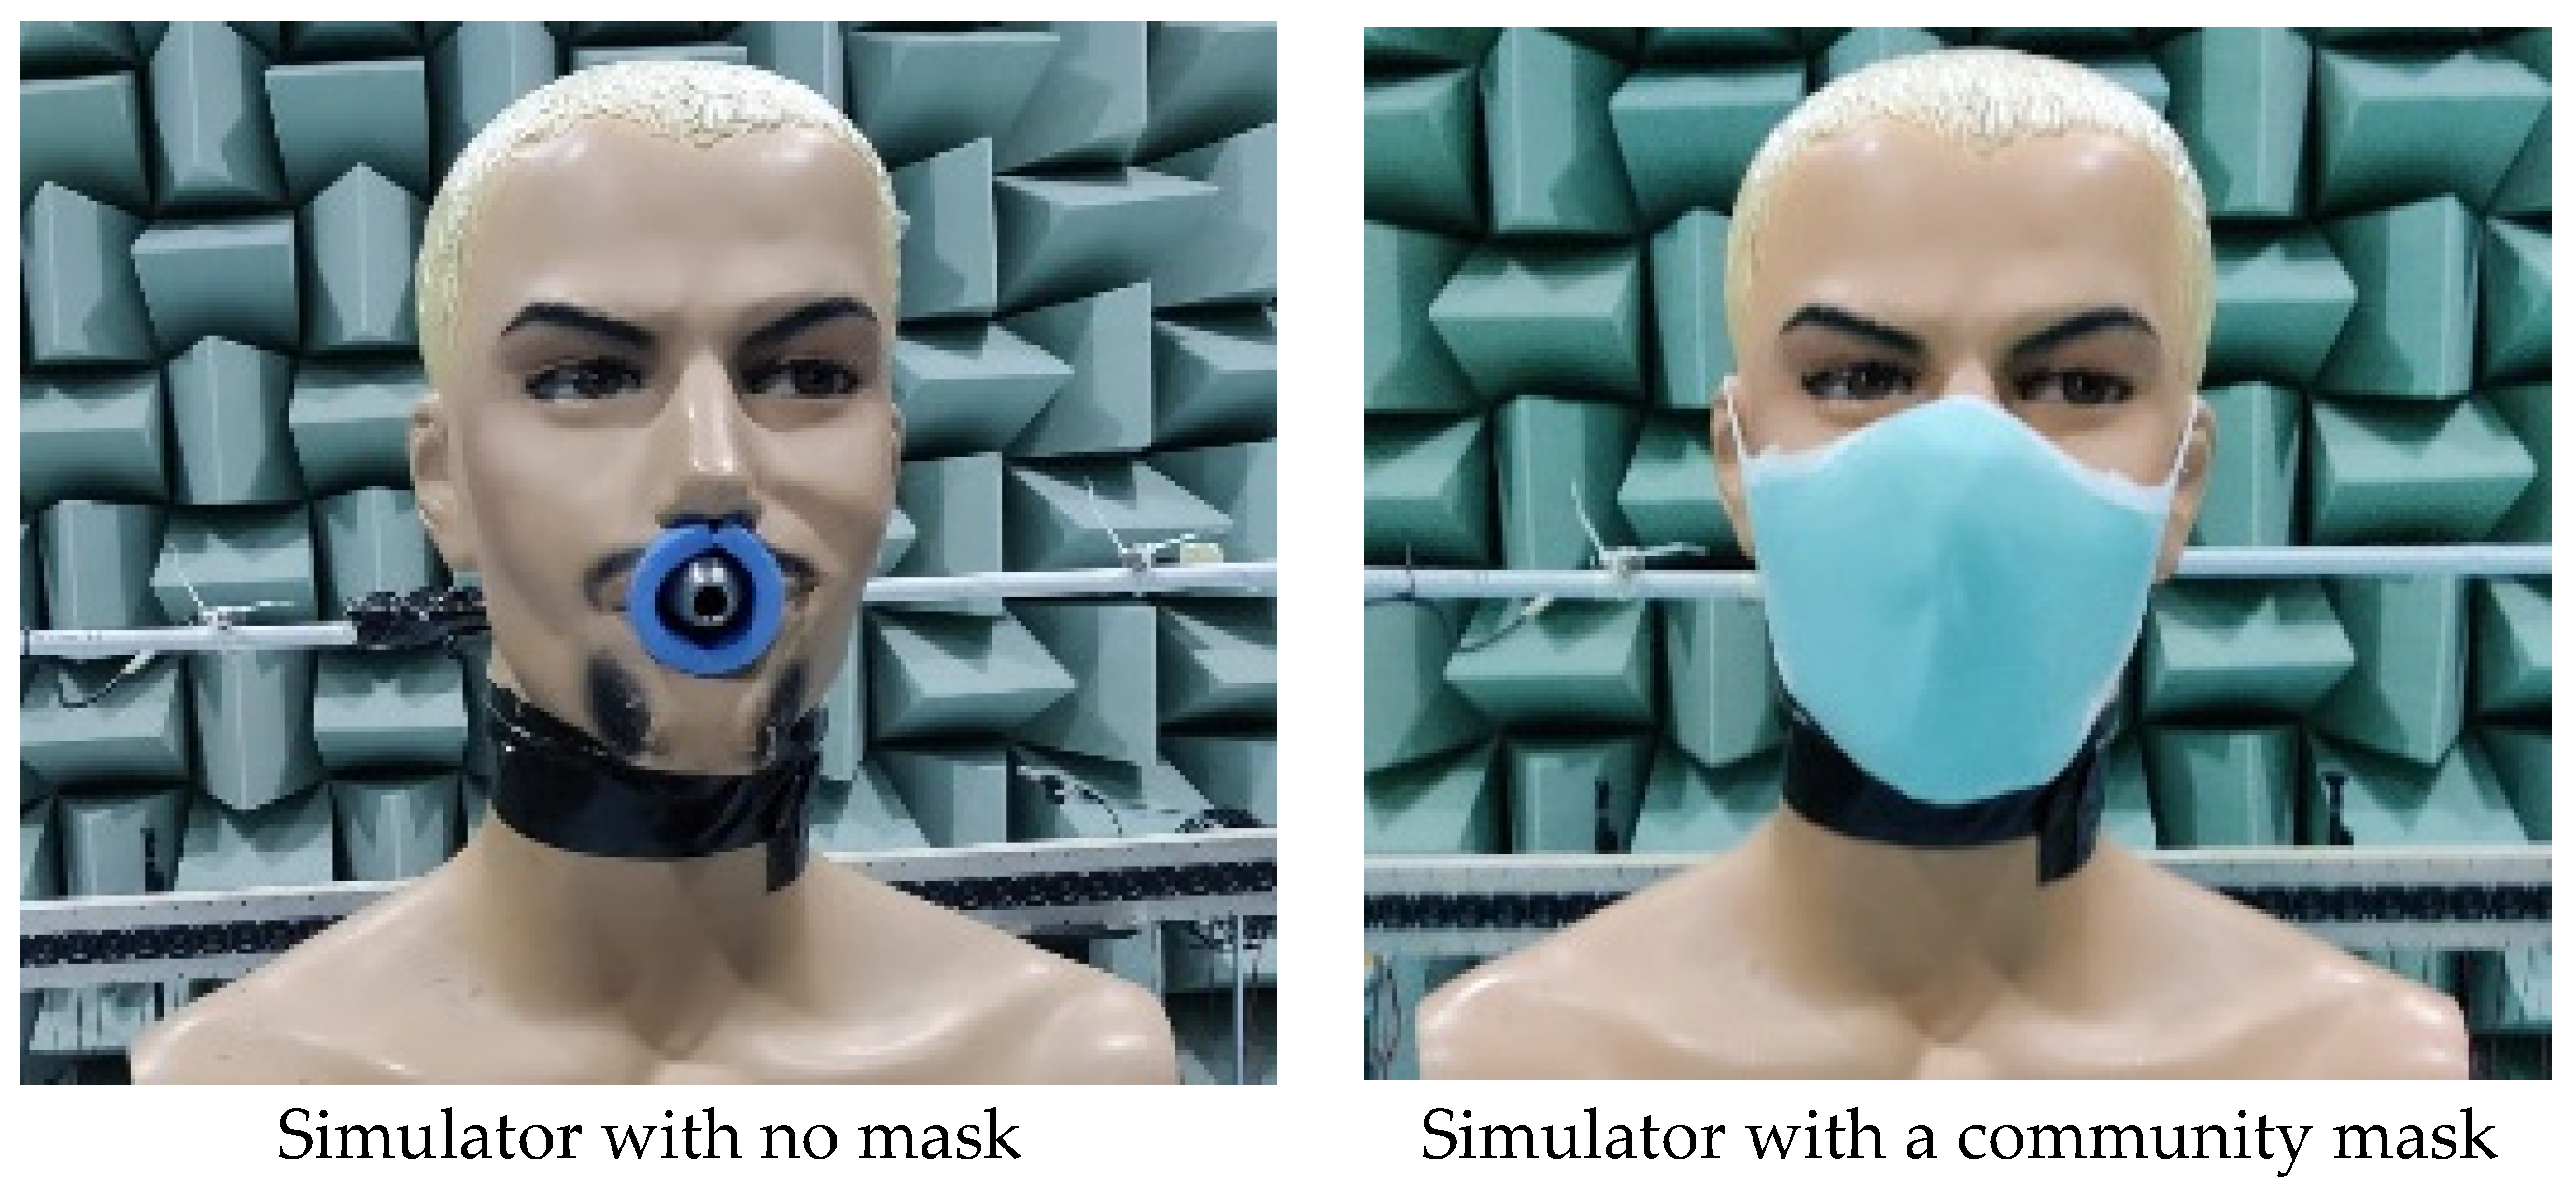
The acoustic attenuation of each mask has been measured by disposing the mask on a home-made head and torso mannequin, with a sound source (Simcenter Q-MHF) inserted in the mouth. The source is a volume acceleration source with internal reference sensors to measure the acoustic strength of the monopole source generated. It works in the medium and high frequency range, specifically between 200 Hz and 10 kHz, and it has a 30 mm diameter hose which was fixed inside the simulator mouth.
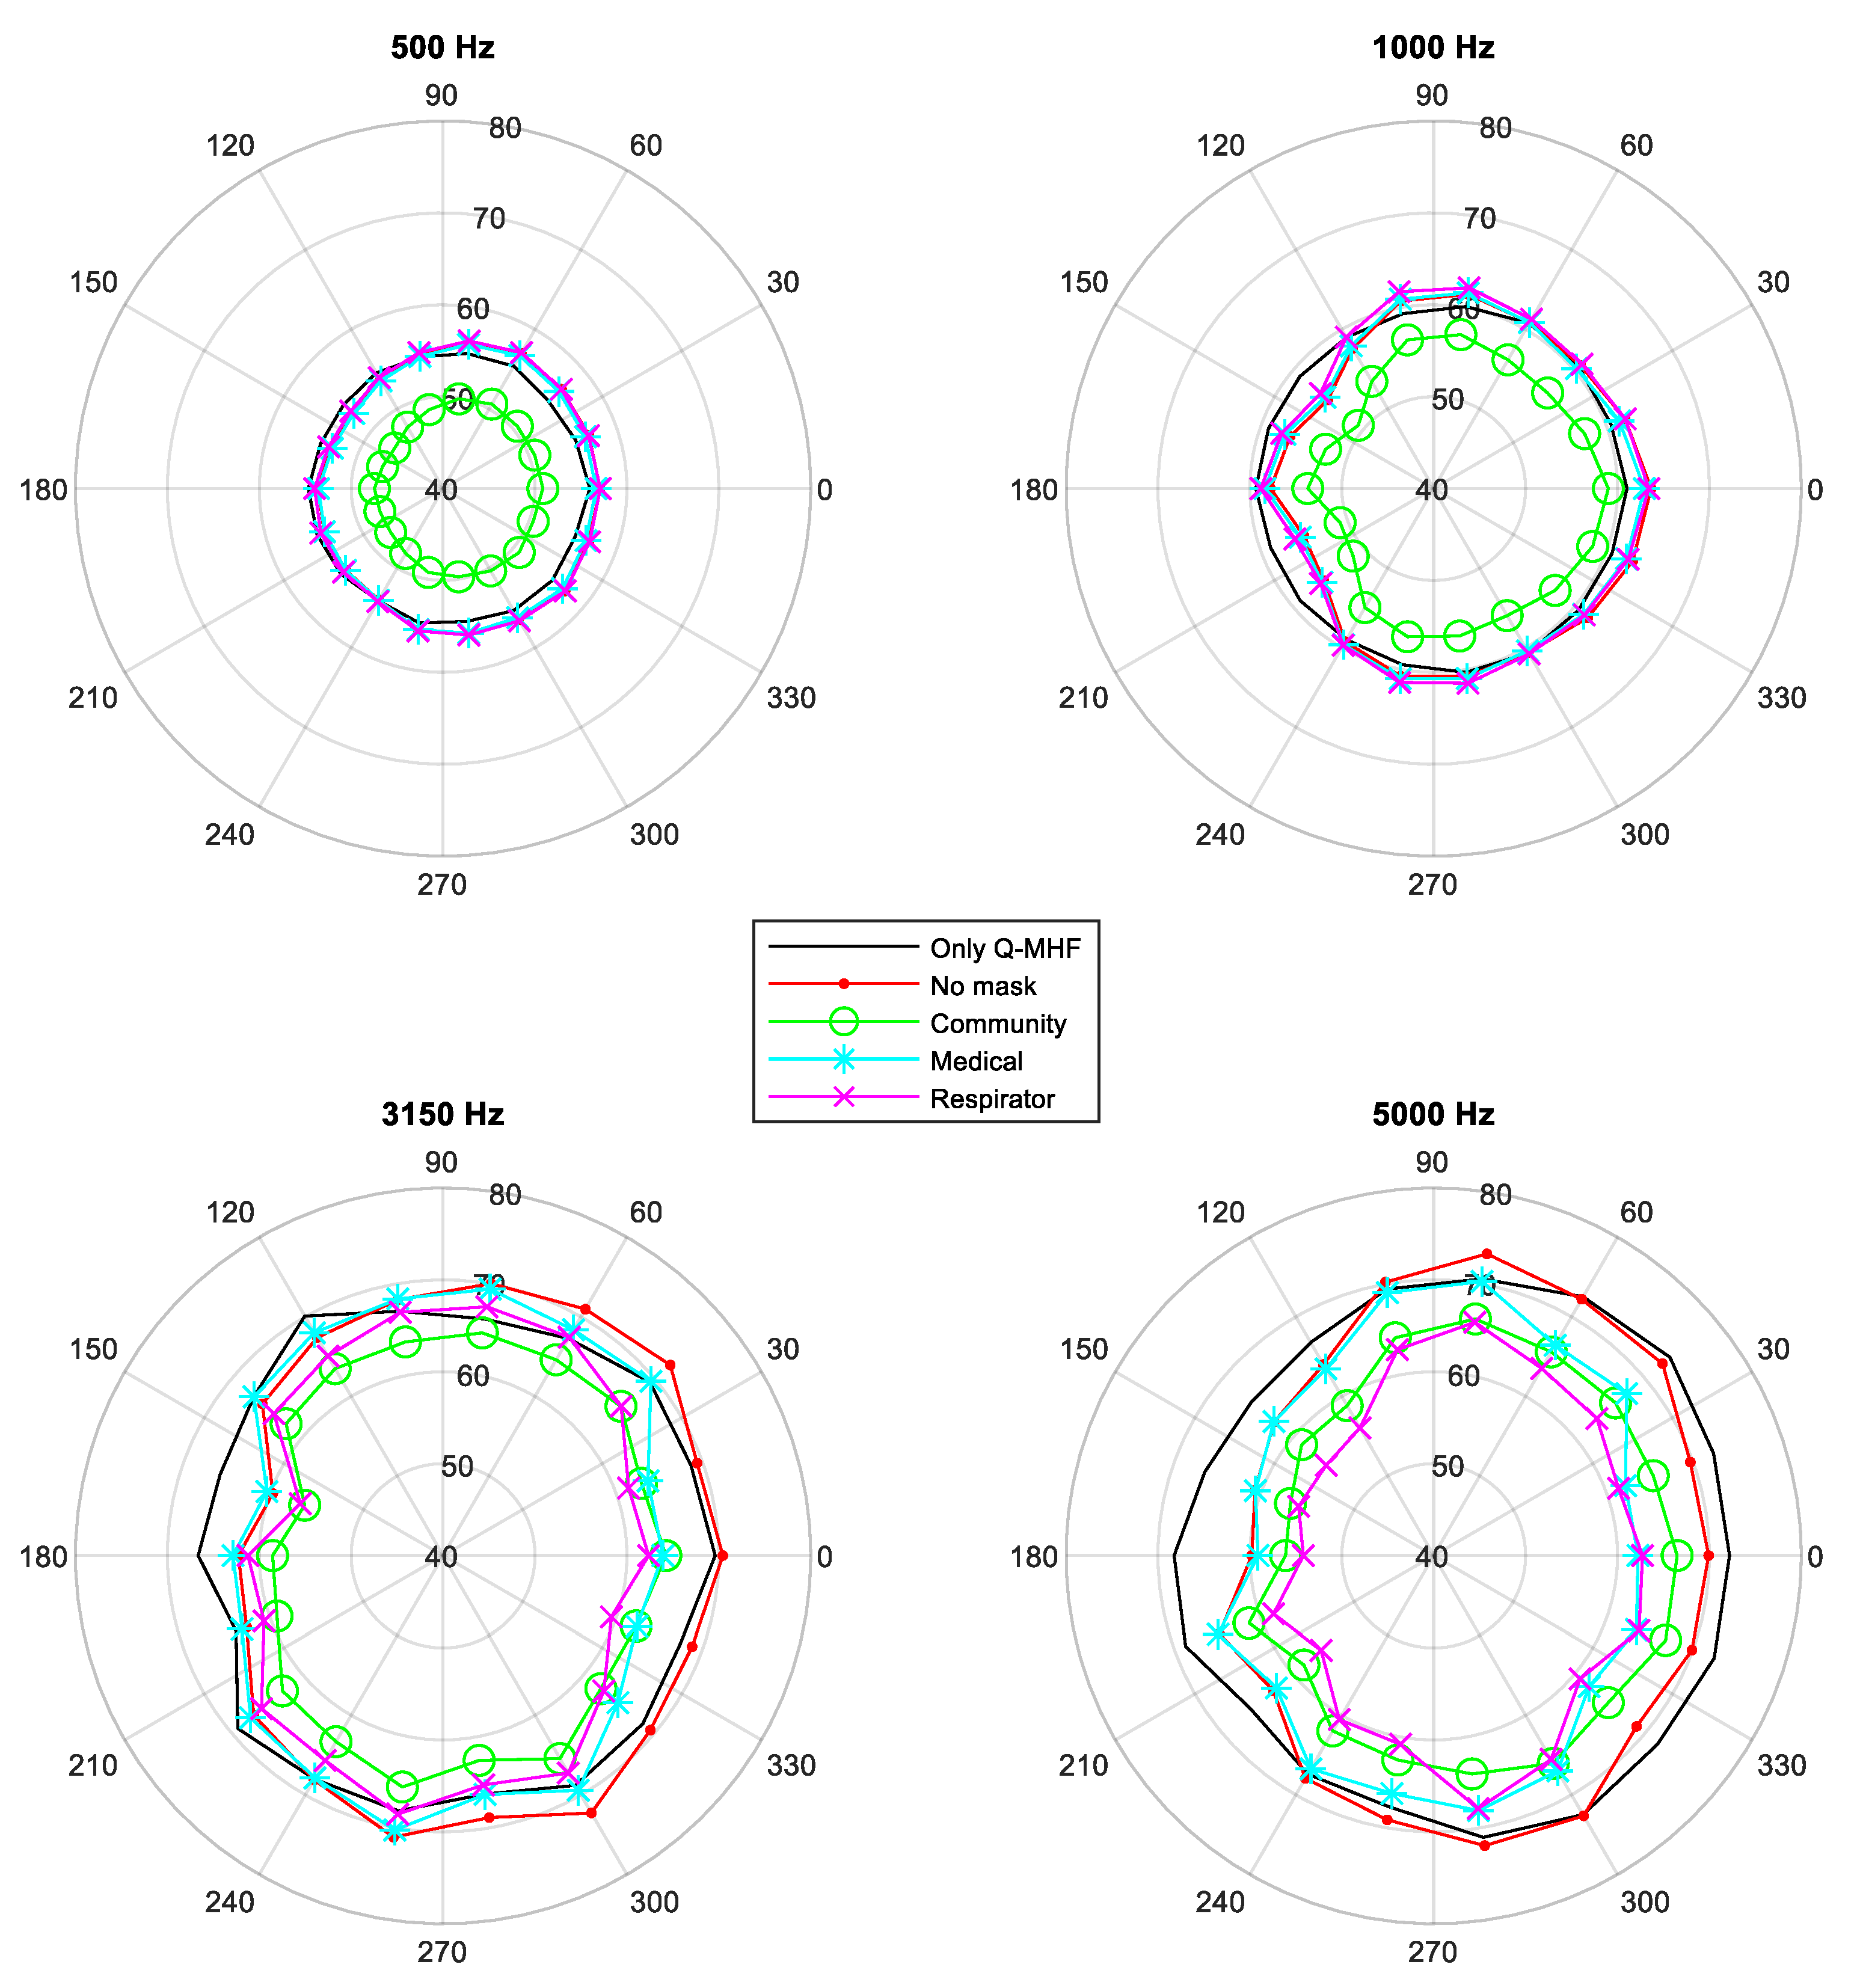
The acoustic pressure generated by the source was measured with 18 1/2” free-field, pre-polarized condenser microphones (PCB, model 377B02) located on a circumference of 1.2 m in radius and angularly spaced by 20 degrees. The plane containing the circumference was placed at the same height of the mouth of the mannequin and the center of the circumference coincided with the mannequin mouth. This configuration was adopted to characterize the directivity induced by the masks with respect to the reference monopole-like directivity of the source. As evidenced in [16], where the influence of the masks on voice radiation has been studied, the radiation of a dummy head and torso may be different from the human voice, because it depends on the mouth’s opening and nasal passage which impacts on the dynamic voice directivity. However, Halkosaari [17] demonstrated that, despite these differences, a dummy head behaves as a good approximation of the human voice radiation and, for the purpose of the work reported in the present paper, it allows one to objectivize the masks attenuation with respect to a common and reproducible acoustic source.
The test has been conducted in the semi-anechoic room of the DII department at Università Politecnica delle Marche. The head and torso mannequin and the microphones positioned in the circumference for the directivity measurement are illustrated in Figure 1. Figure 2 gives a close-up of the mannequin mouth where the Simcenter Q-MHF acoustic source is inserted with and without the mask.
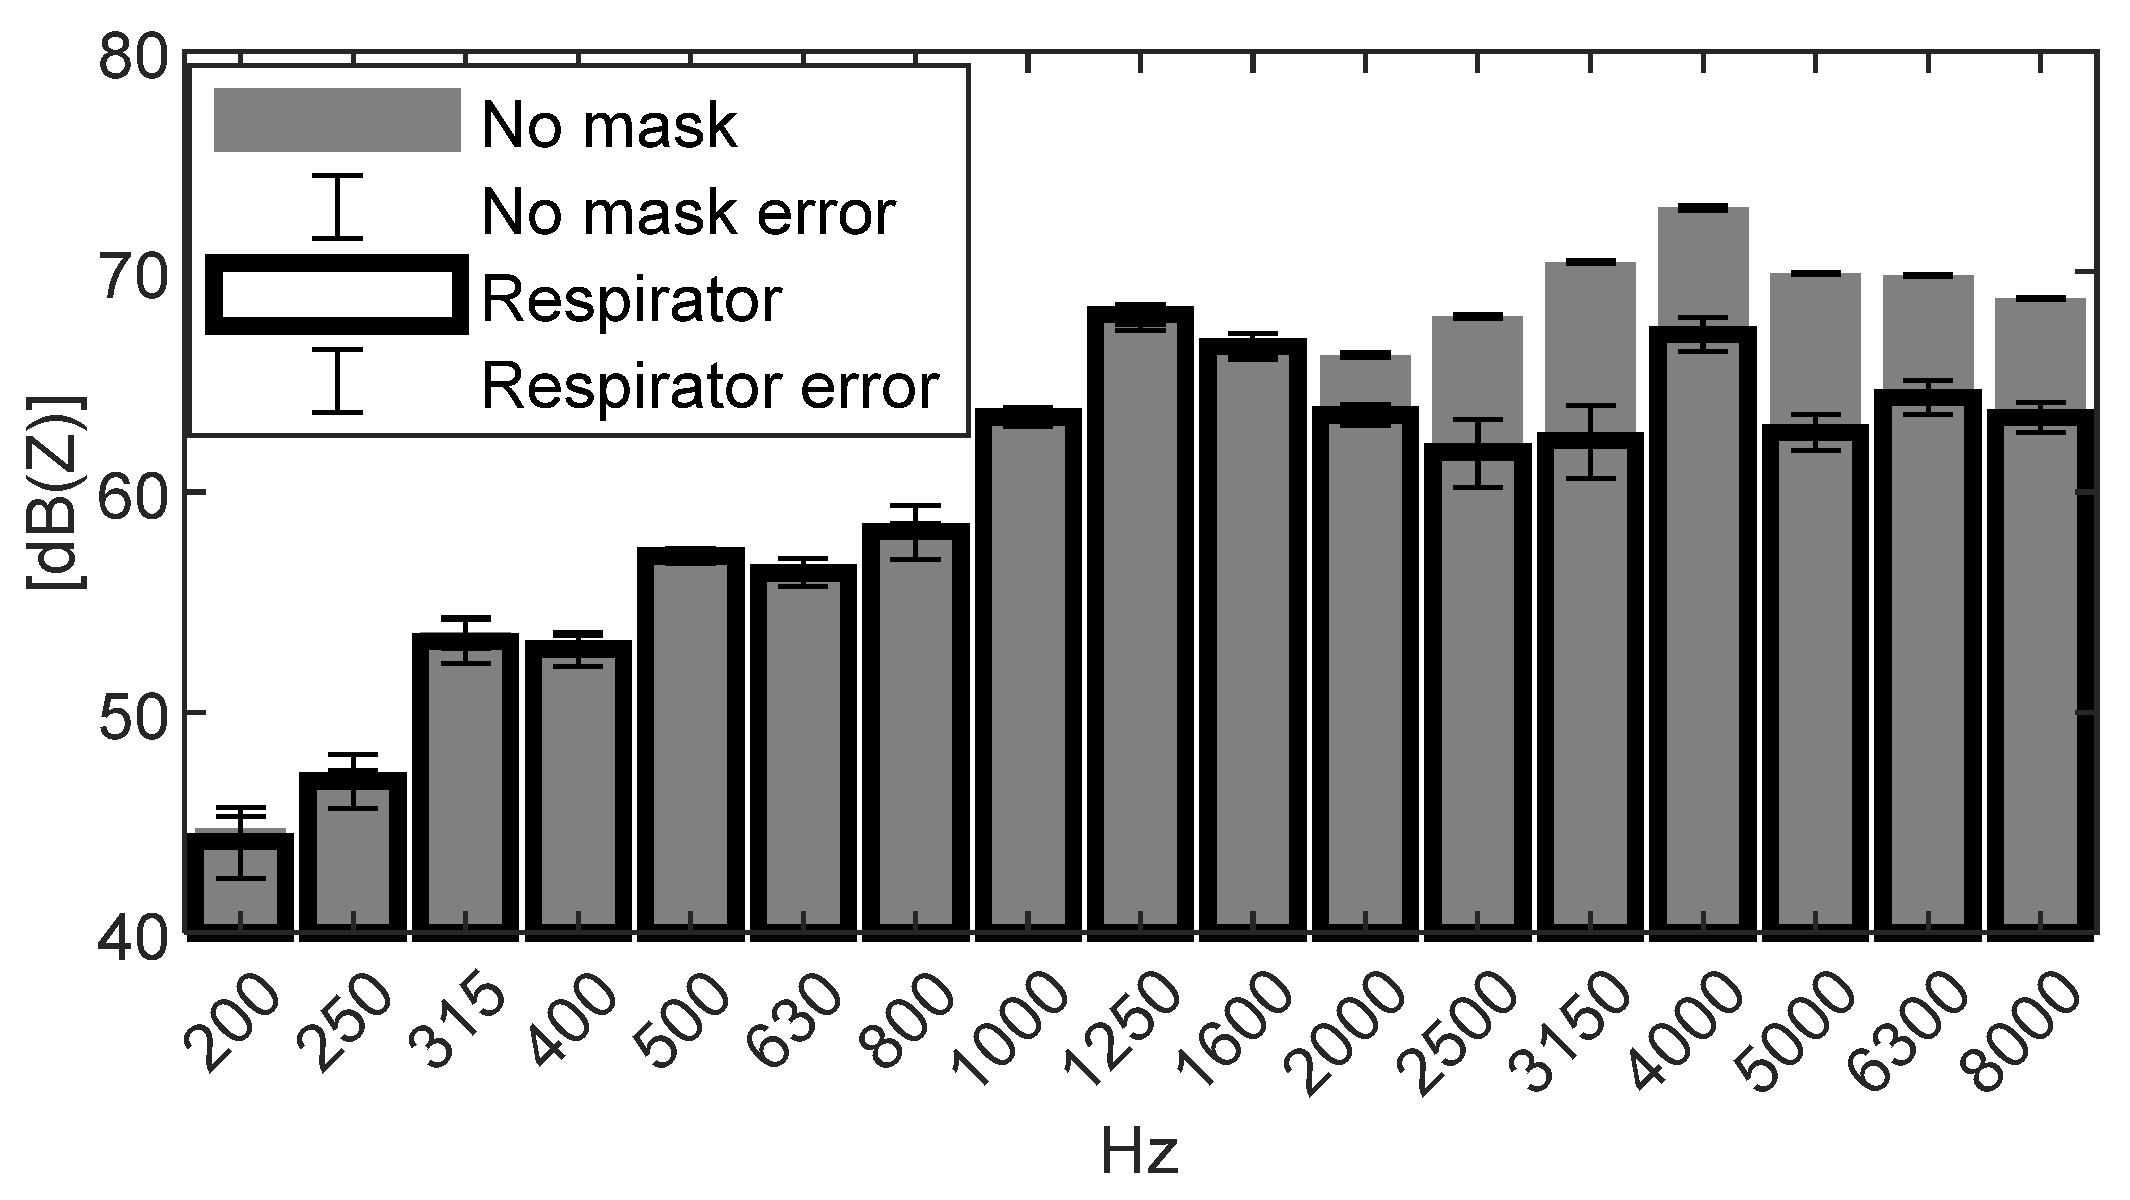
The measurement campaign has been performed opting for an acquisition frequency bandwidth of 25.602 kHz and an acquisition time of 20 s. The source was fed with band-limited random white noise in the range 200 Hz–10 kHz. For each mask, 5 measurements have been realized; this was carried out to assess test reproducibility by removing and replacing the mask on the simulator face each time. The removal and replacement of the mask in these tests also allows one to consider the variability induced by mask fit on the face of the wearer. Tests and results have been carried out considering un-weighted sound pressure levels (dB(Z))

2.2. Breathability Measurement Set-Up

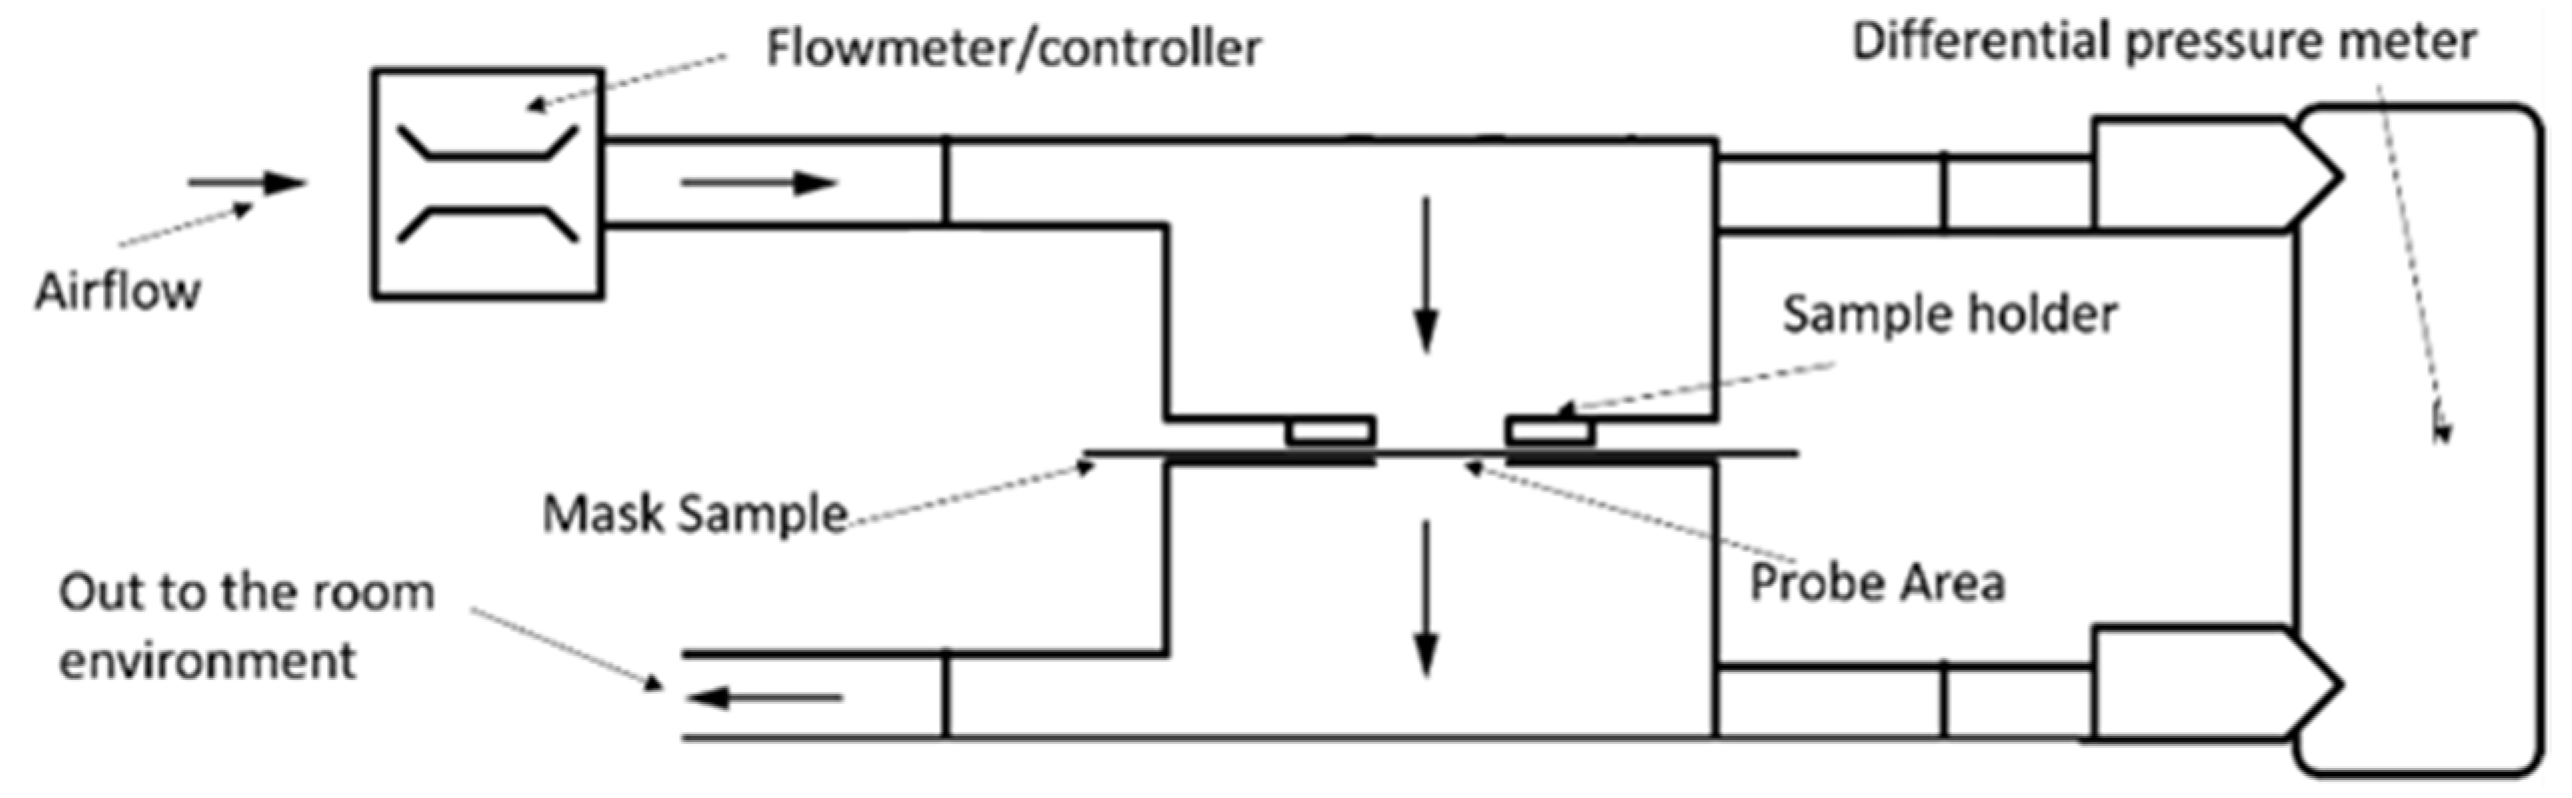
The breathability test aims at quantifying the breathing resistance while wearing the protection mask. This is evaluated by measuring the pressure drop across the mask, while a constant air flow is forced to flow through the specimen. We have set-up a test apparatus and operated procedures in compliance to the EN 14683 standard [3]. This standard strictly applies to medical masks; however, we have used the same procedure to measure breathability of the respirators and community masks, in order to have comparable data. Before taking the test, each sample is maintained under a controlled atmosphere for a period of four hours with a temperature and a relative humidity, respectively, of 21 ± 5 °C and 85 ± 5%: this allows one to simulate the thermal and hygrometric conditions of masks being worn by a person. The sample is then fixed by the sample holder to the airflow circuit acting as a diaphragm. A steady flow of 8 L/min is imposed, flowing across the probed area of the specimen for 10 s. The differential pressure (in Pa) between the upstream side and the downstream side of the mask is finally measured and related to the dimension of the probed surface, which is a 25 mm diameter disk. According to the standard, breathability is the pressure drop per unit area, therefore it is expressed in Pa/cm2. Due to the fact that mask material may be non-uniform, the standard prescribes to take measurements on five different circular areas spread over all the mask’s surface and compute the average; this averaged value of the differential pressure is considered as an indicator of the breathability of that mask. Tests have to be repeated on 5 samples. Overall, these repetitions allow one to account for sample-to-sample variations, for sample non-uniformities and for measurement uncertainty. Figure 3 describes the measurement set-up.

2.3. Bacterial Filtration Efficiency Measurement Set-Up

The standard EN-14683 (Annex B of the standard [3]) describes a test method for measuring bacterial filtration efficiency (BFE). Indeed, this is a complex measurement method, involving fluid dynamic and microbiological measurements, developed to test medical masks. We decided to exploit this test approach to refer correlations to this typical performance parameter normally reported in certified medical masks. Indeed, for the respirators a different standard applies [2] and the filtration efficiency for the respirators is measured in a different way; however, we decided to also measure BFE for the respirators, in order to have a consistent data set for comparison. For the same reason, the BFE performance was also measured for community masks, even if for these masks no standards exist; therefore, no specific method to measure filtration efficiency is prescribed.
To measure BFE, an aerosol stream containing a known charge of Staphylococcus aureus ATCC 6538 is forced to flow through the mask material and a six-stage Andersen cascade impactor [18]. The impactor is an aerodynamic particle sizer and separates the incoming aerosol droplets in six different size classes by impaction of the droplets. Each stage contains a petri dish with an agar medium on which droplets of a given size class impact; after the incubation of the petri dishes, a bacterial colony will form at the point of impact of each droplet. Counting the bacterial colonies allows one to measure the number of droplets which have impacted at each stage and the size distribution of the impacting droplets can therefore be inferred from the distribution of the colony counts in the six stages. By performing the test and counting the colonies forming units (CFU) with the mask sample CFUtest and without CFUcontrol (positive control), one can compute the BFE according to Equation (1). The bacterial filtration efficiency is therefore measured indirectly. The standard specifies the test conditions, the most relevant of which are a constant air flow rate of 28.3 L/min in a cylindrical test chamber having 80 mm diameter and 600 mm length, carrying an aerosol whose mean particle size (MPS) is in the range from 2.7 µm to 3.3 µm and providing an average number of CFUs in the positive control between 1700 and 3000.
BFE ( % ) = CFU control CFU test CFU control × 100
BFE has to be measured on at least 5 samples and the mean value is computed; this accounts for sample-to-sample variability, as well as for measurement uncertainty. Figure 4 illustrates the standard scheme of the Bacterial Filtration Test in compliance to the EN14683 standard.

2.4. Fibrous Material Porosity Measurement by Scanning Electron Microscope

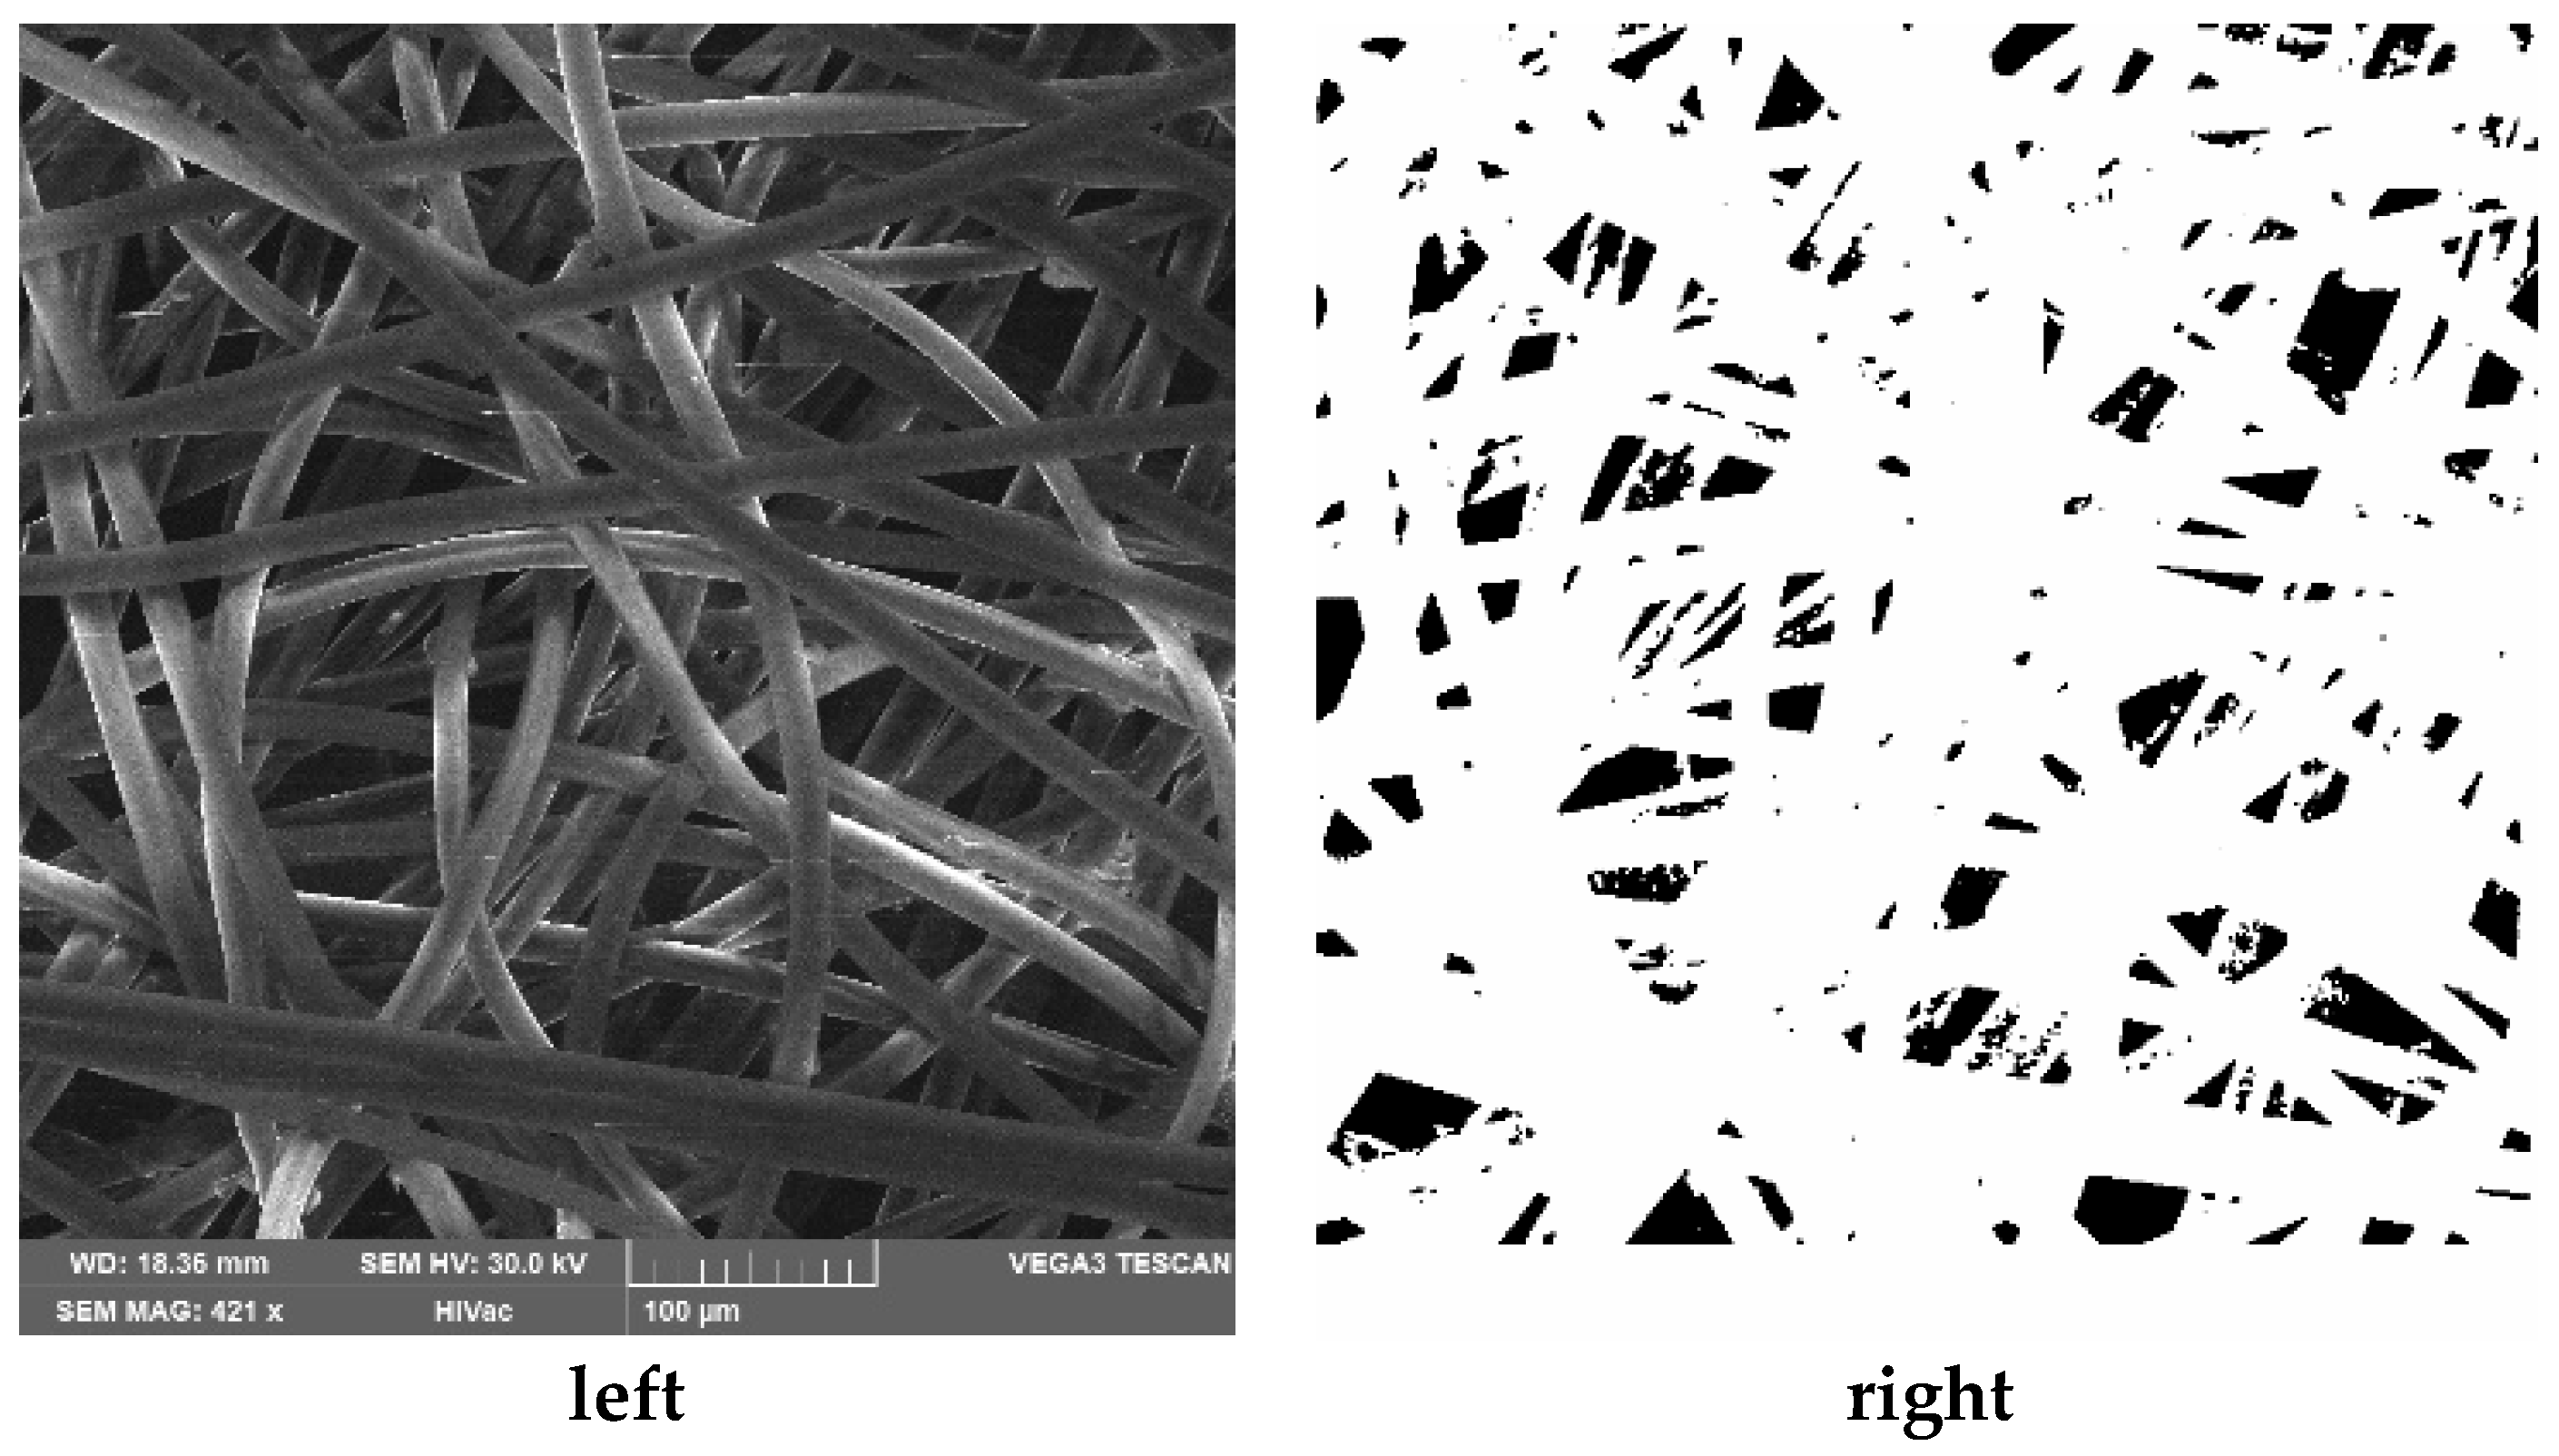
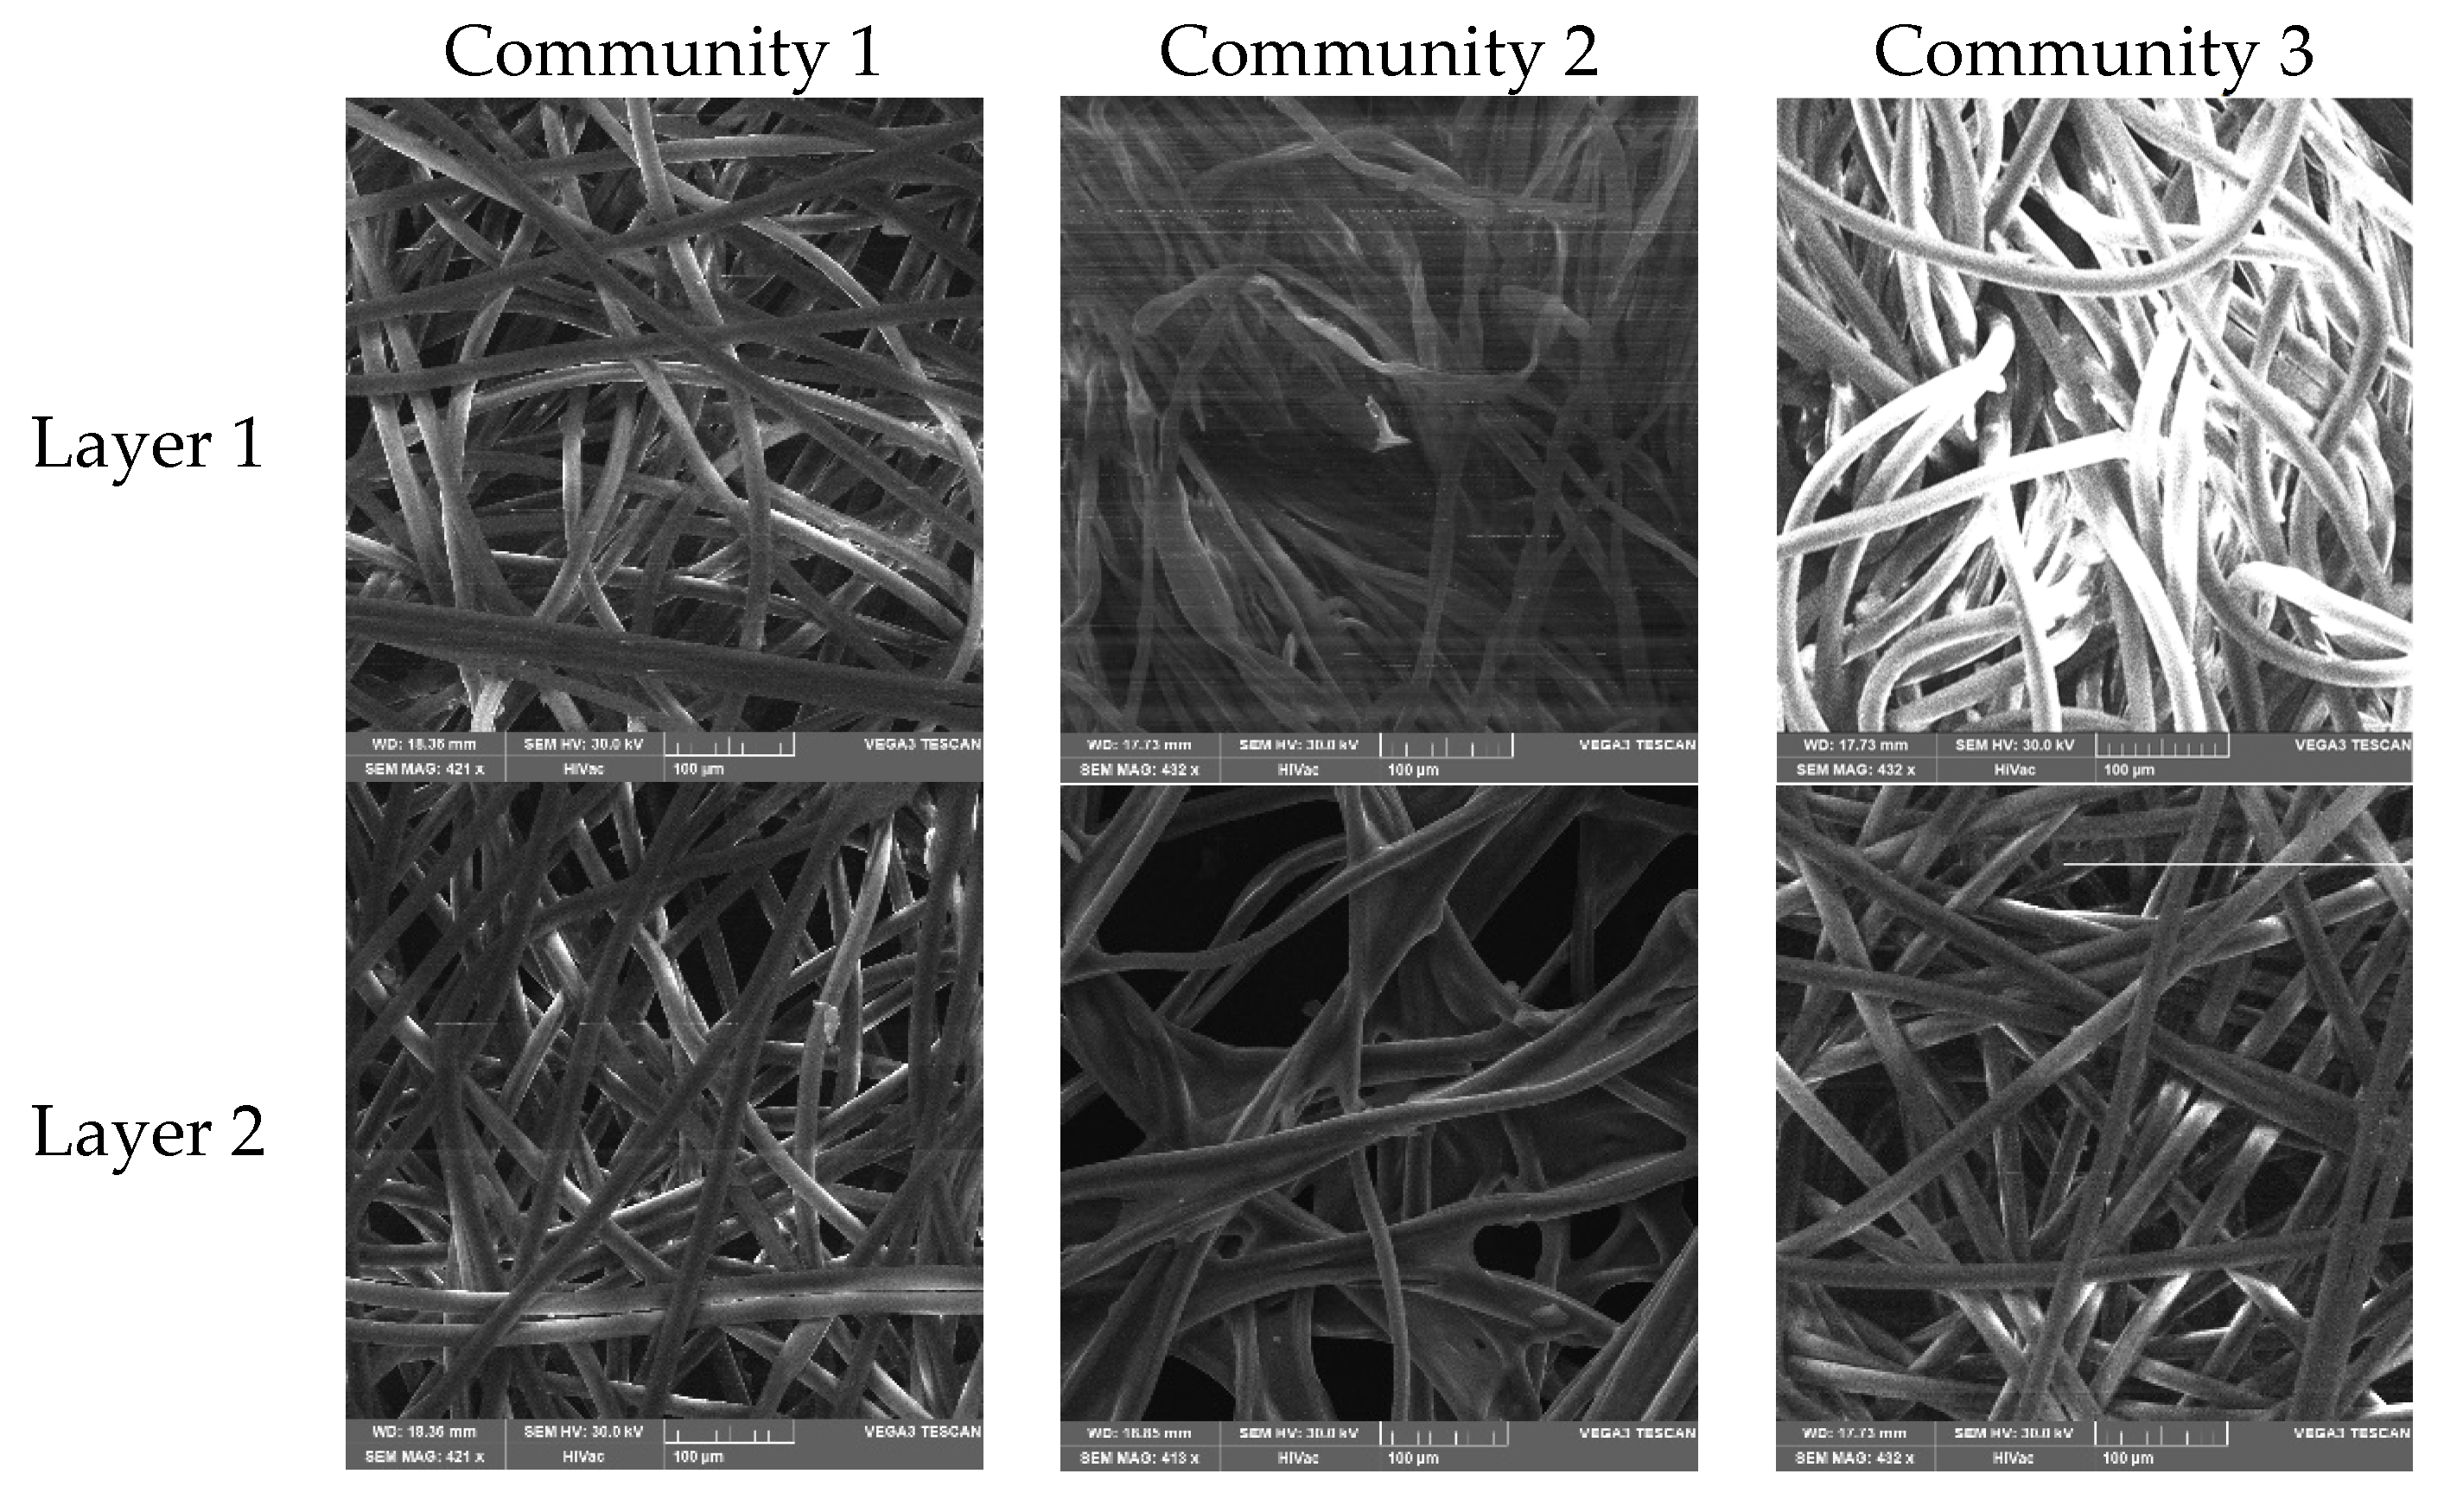
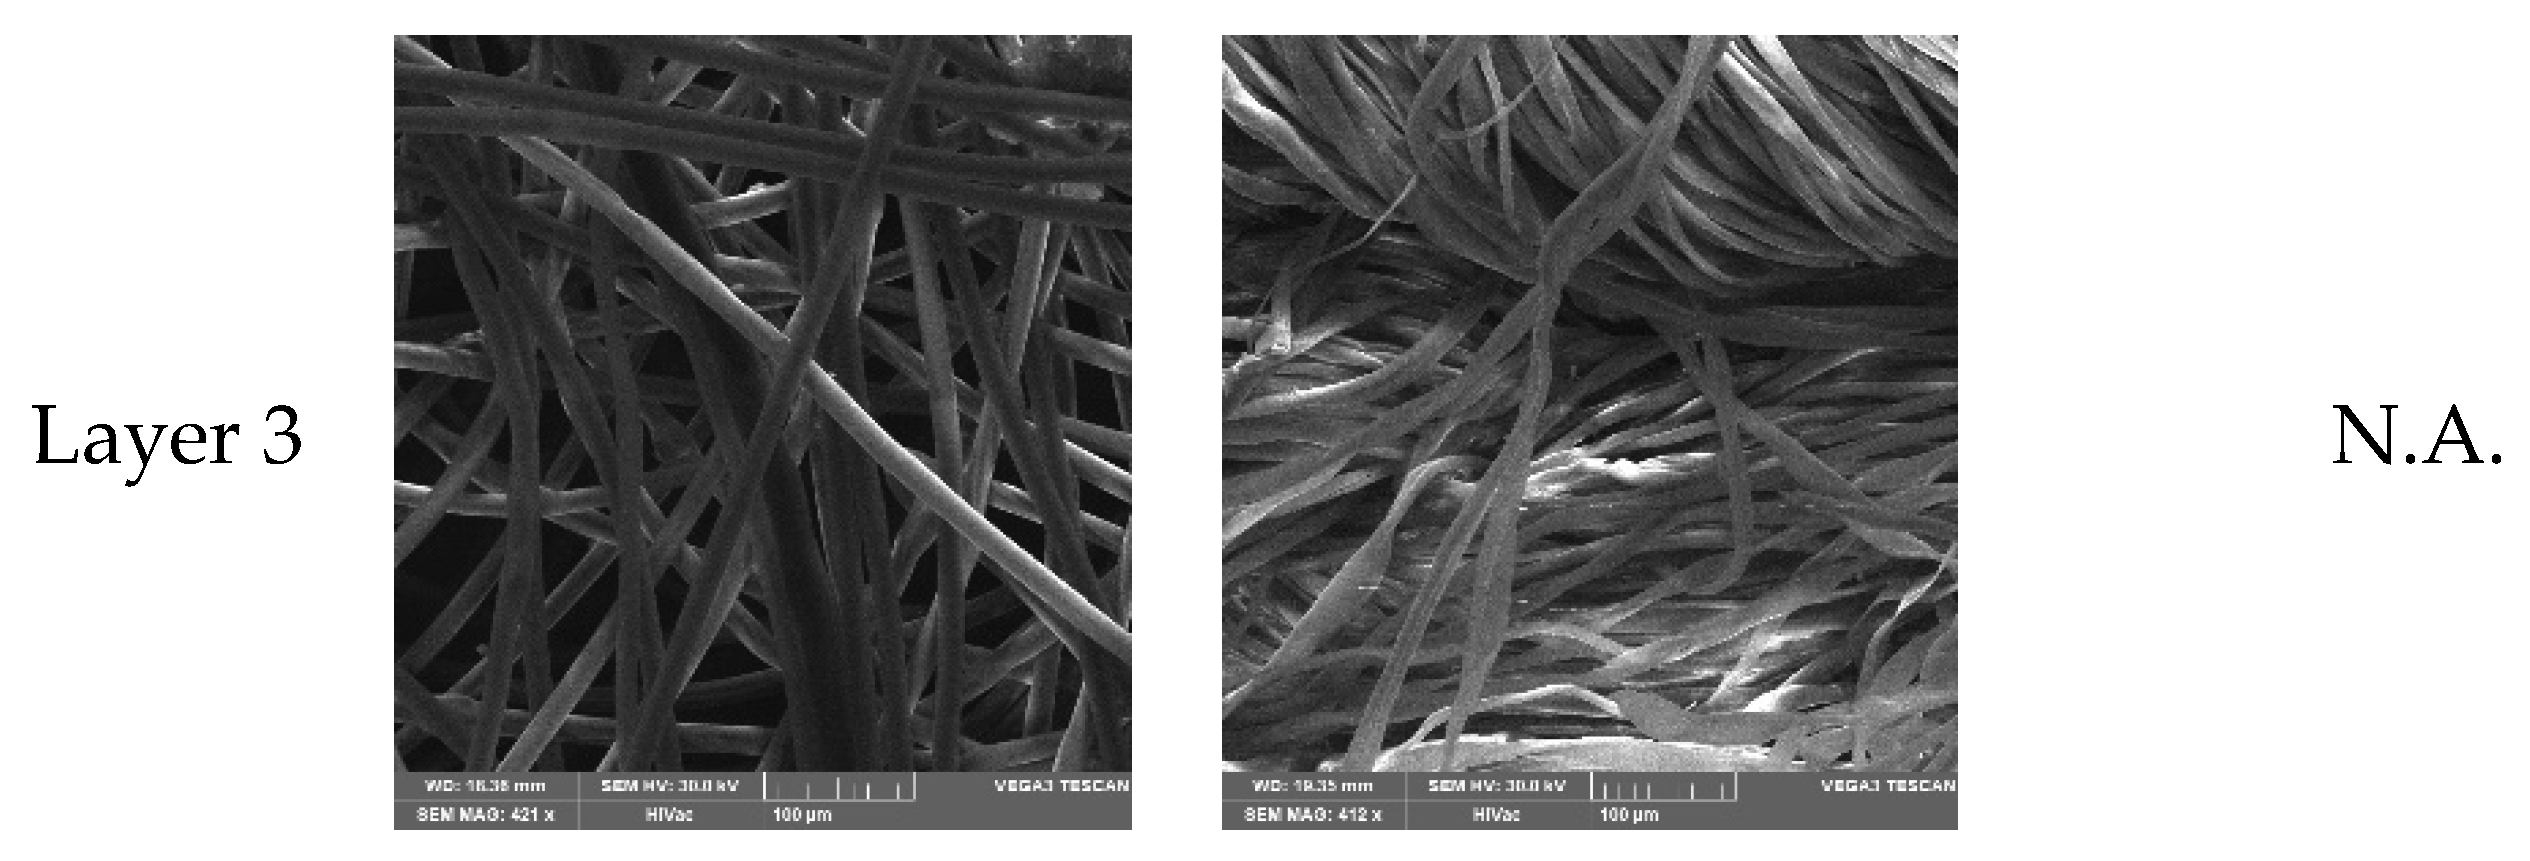
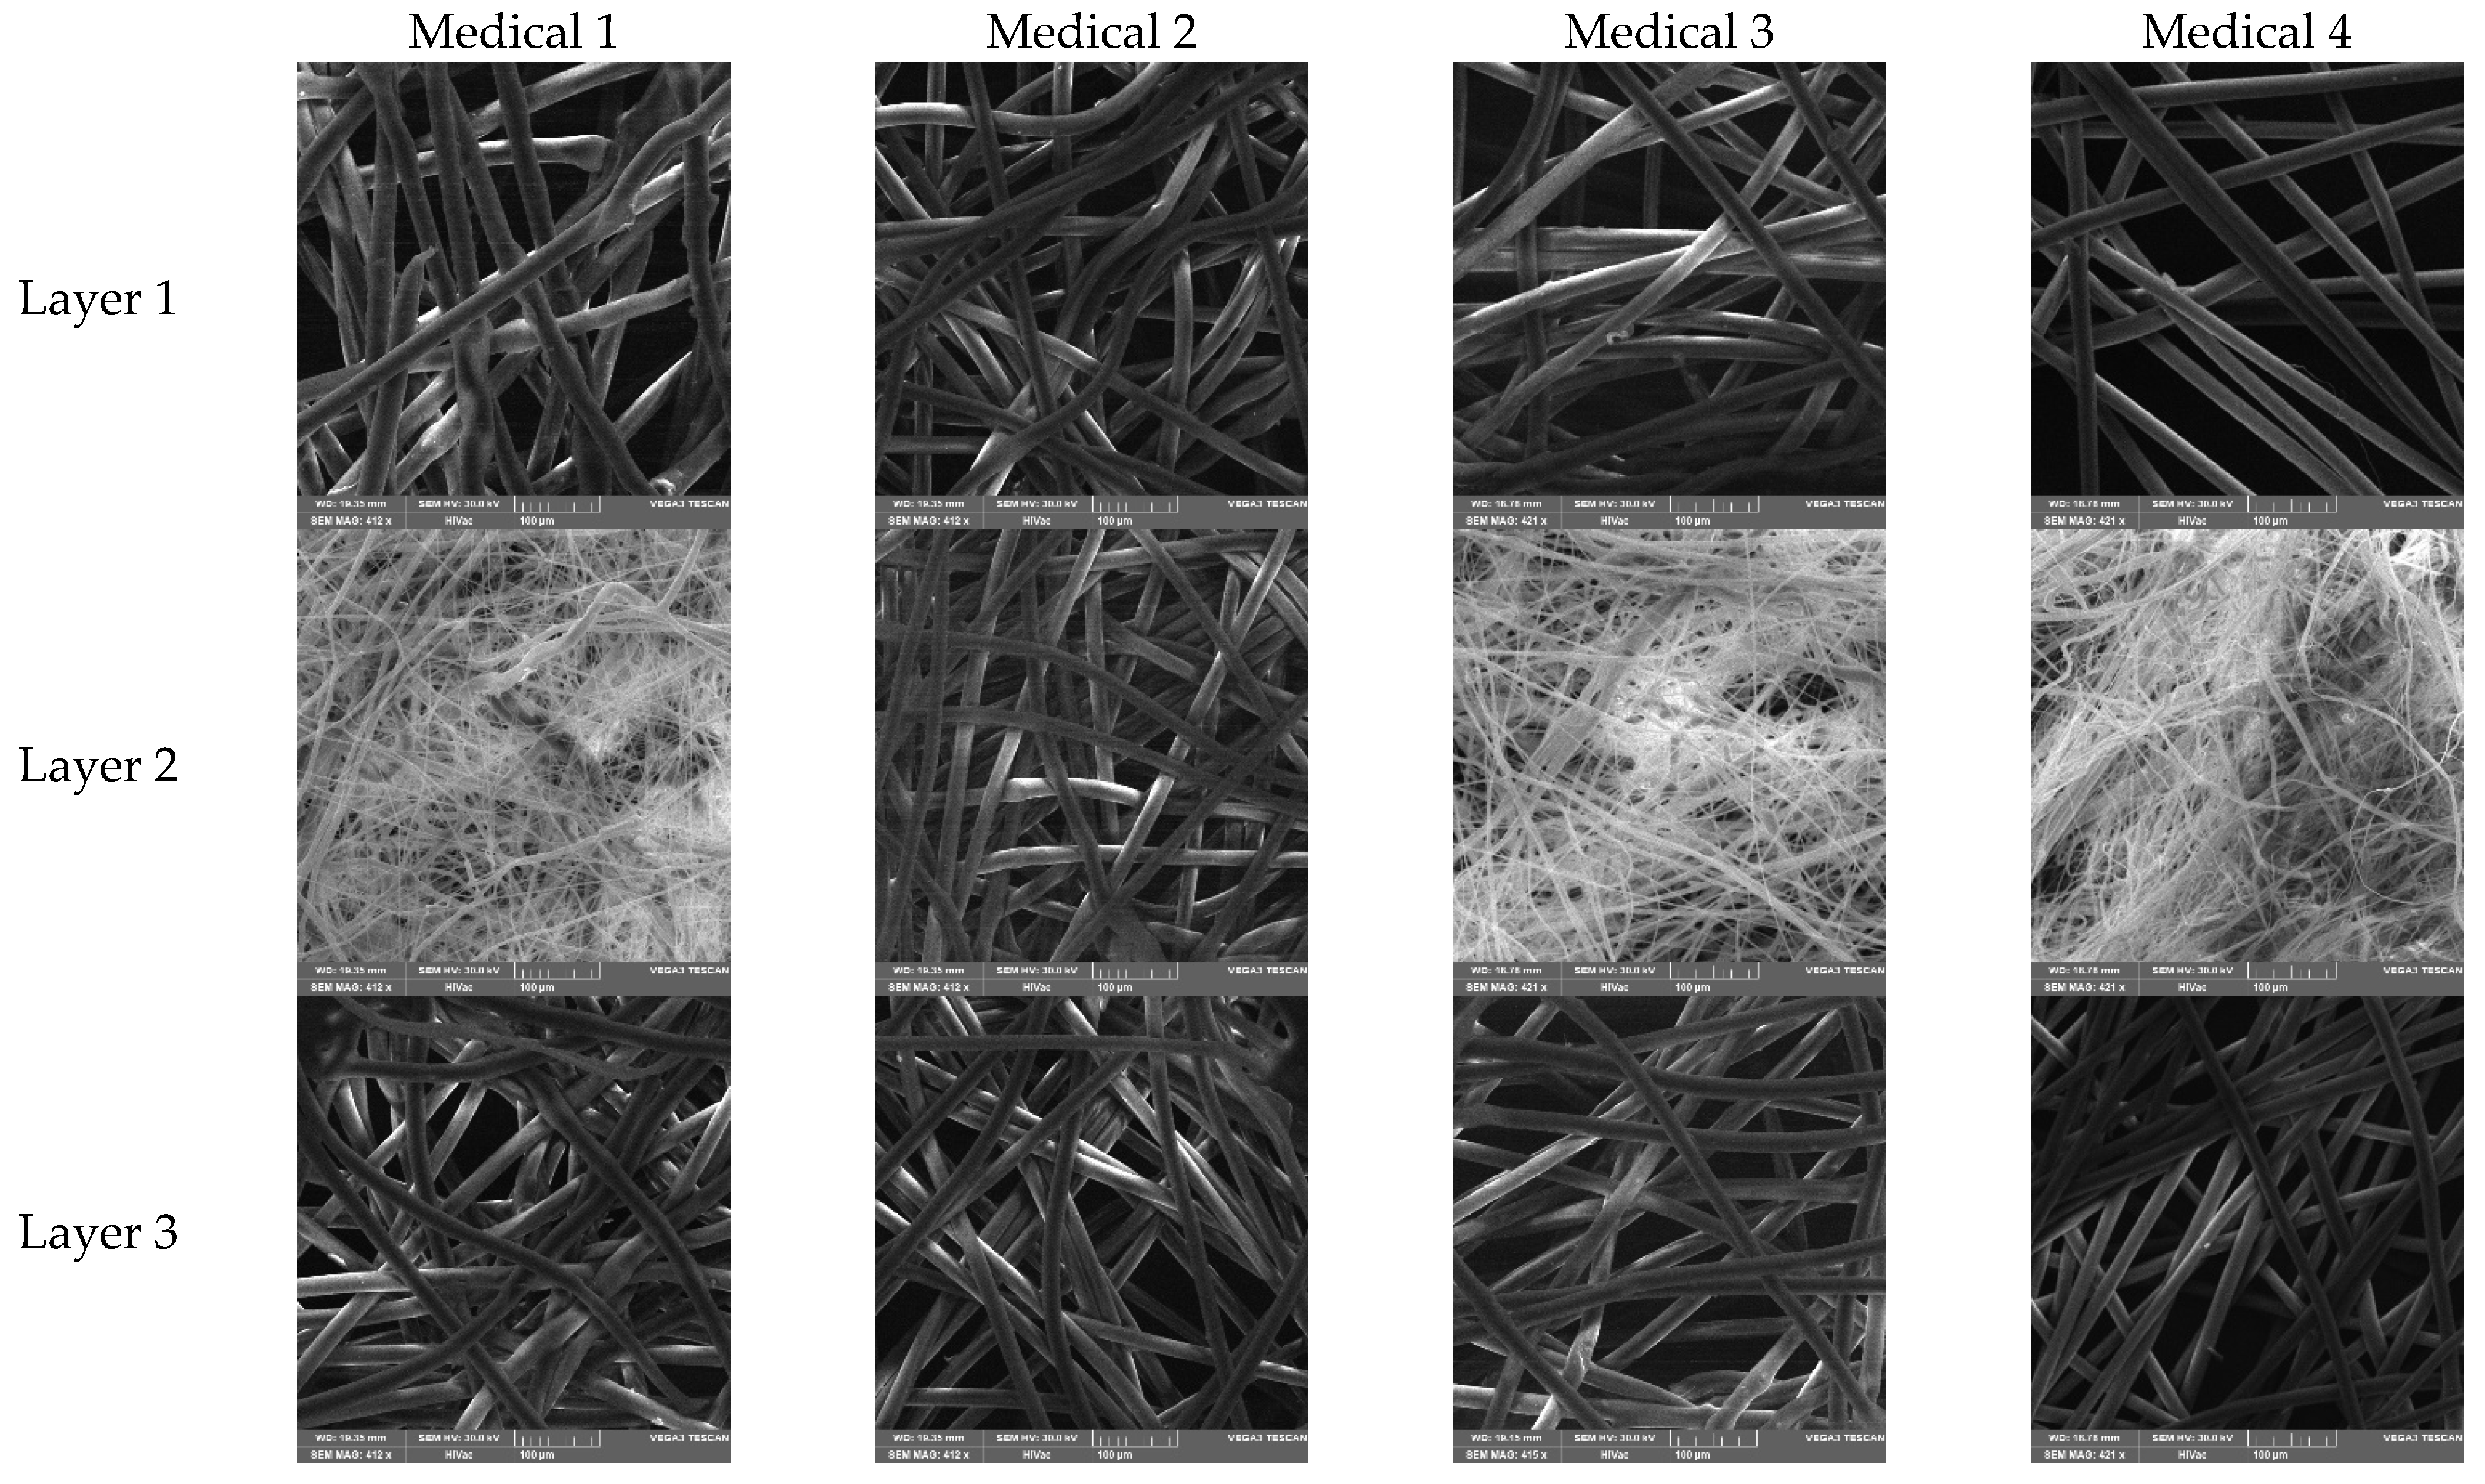
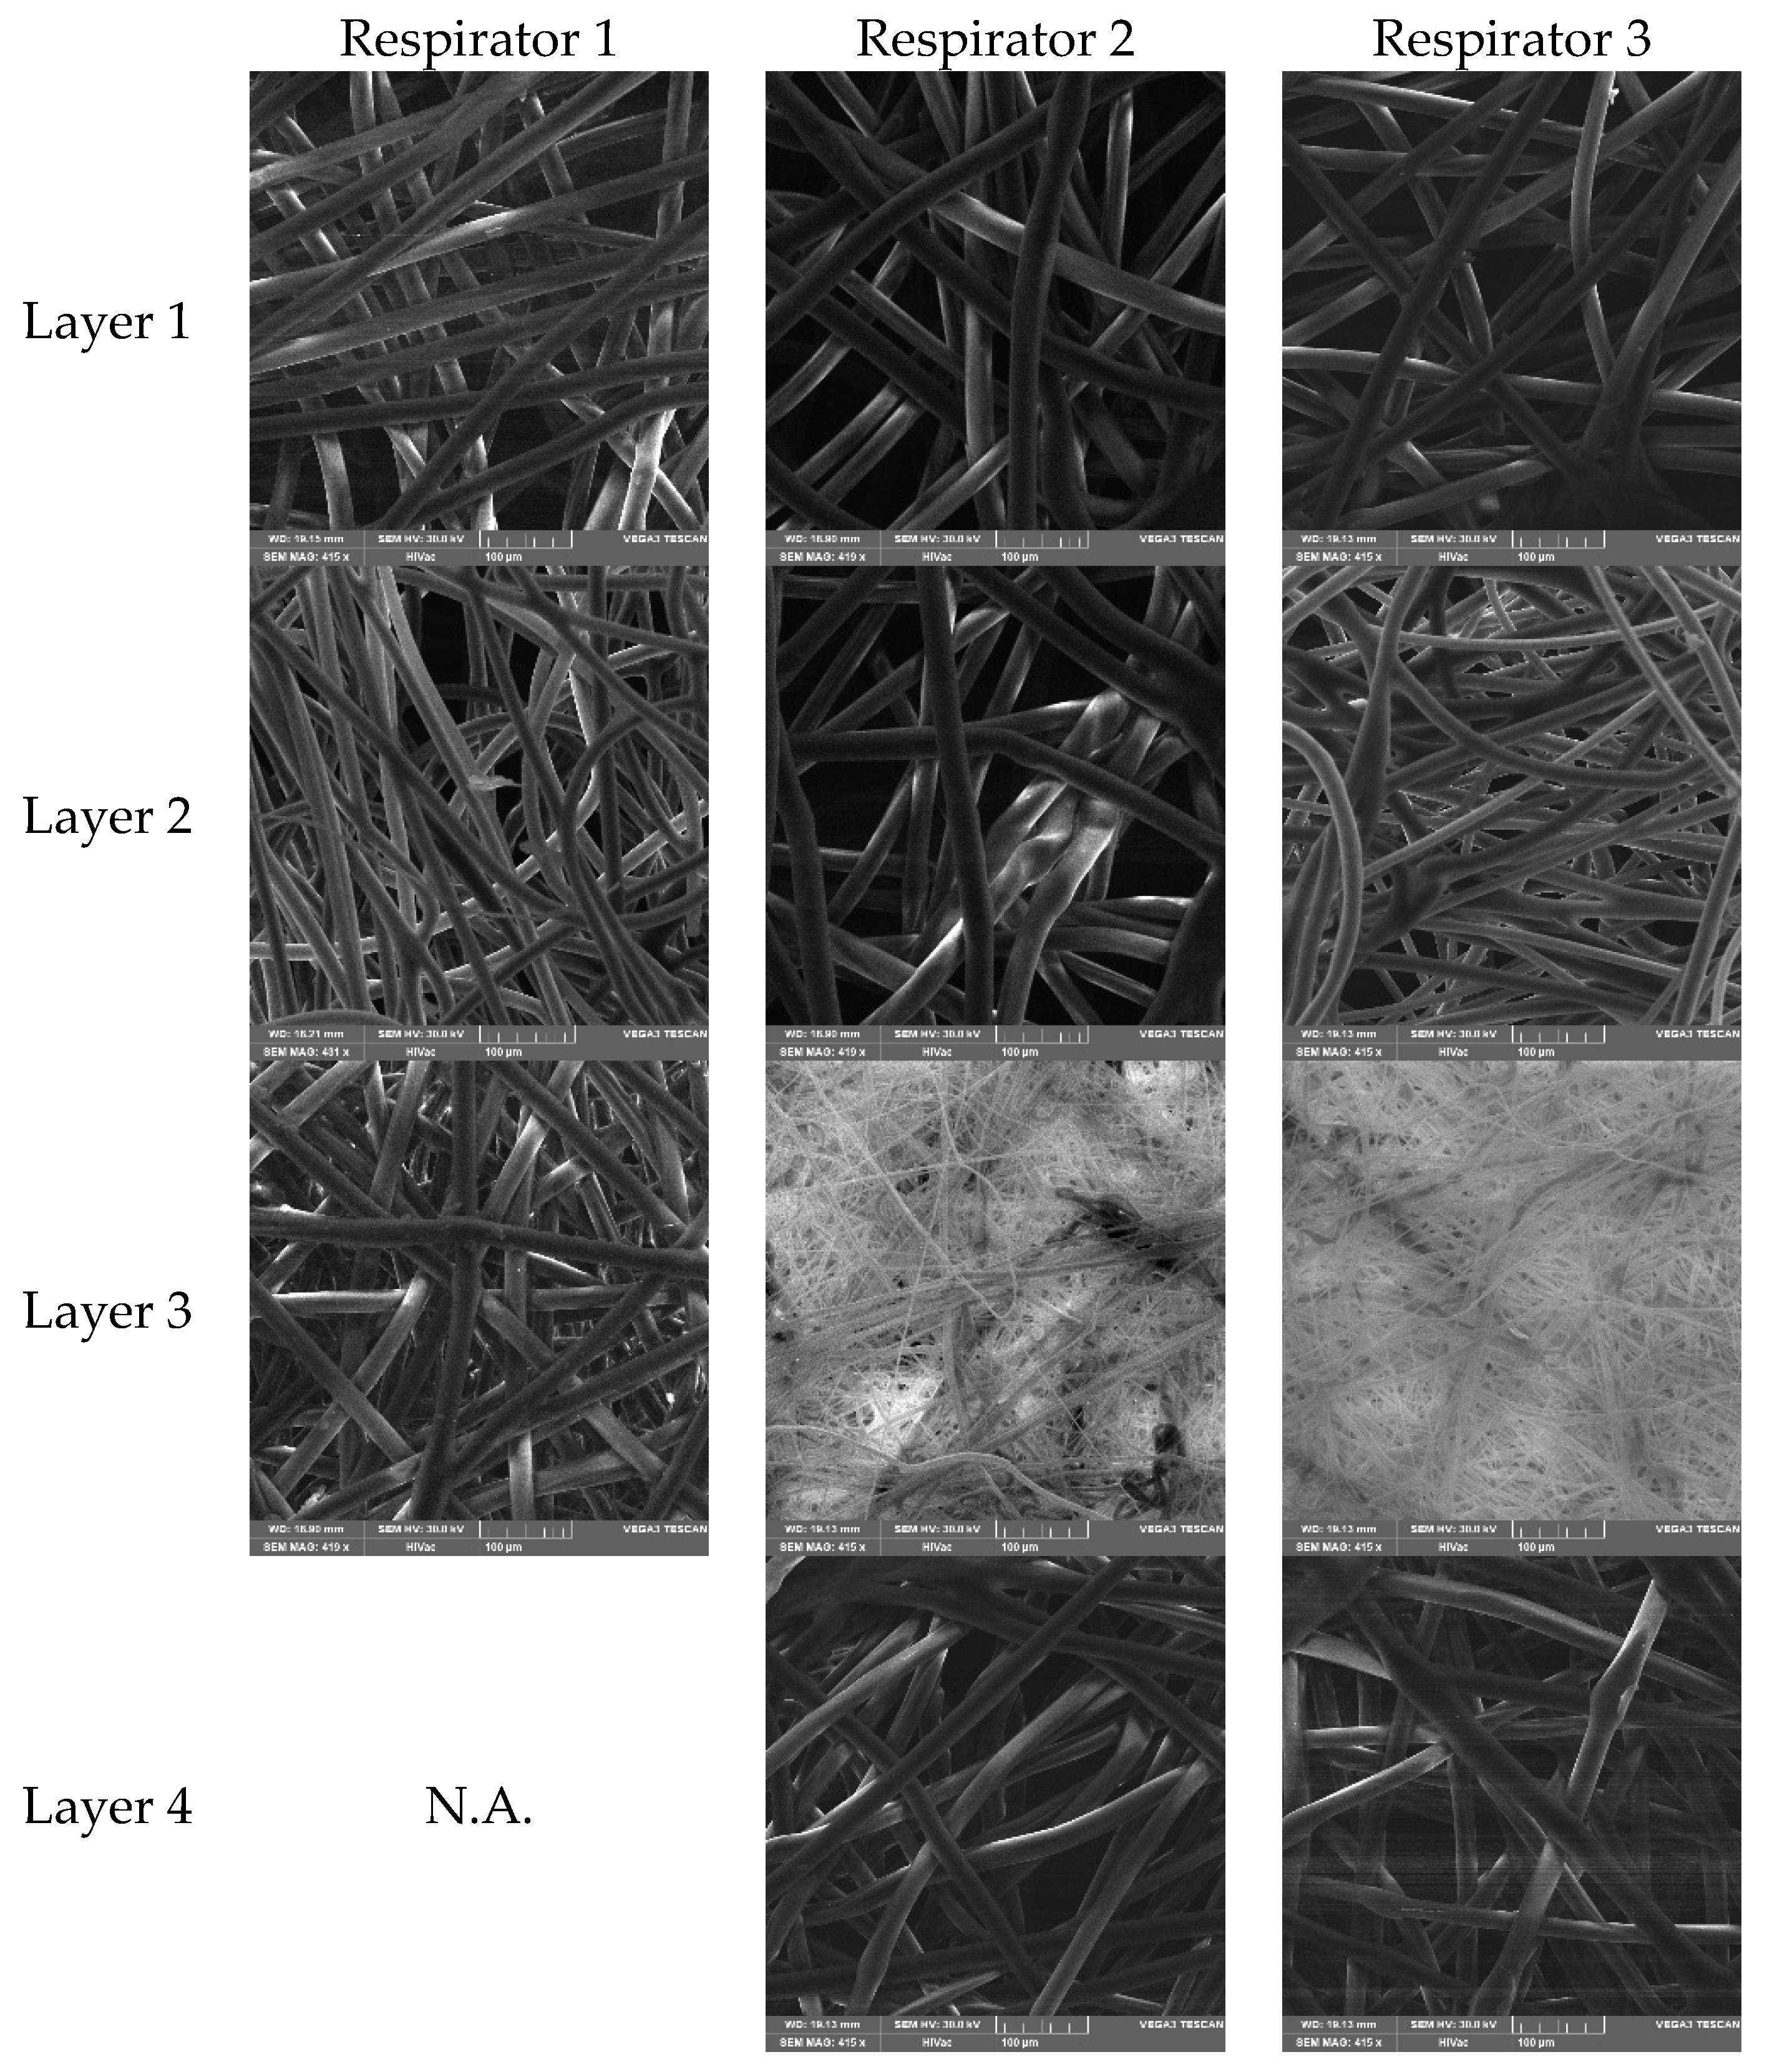
Morphology of the tissues composing the masks has been observed by scanning electron microscopy (SEM). This allows the evaluation of the porosity of the fibrous materials of which the various layers of the mask are made of. Images have been acquired by TESCAN VEGA3 SEM. The main parameters for the analysis were: 30 kV for the electron gun acceleration, secondary electrons (SE) detector (more sensitive to the structure morphology) and a magnification of about 415×, enough to achieve micrometric resolution over a square area 0.6 × 0.6 mm2. A preliminary metal deposition (Gold) was necessary to make the specimens conductive, avoiding artefacts and the saturation of the SE detector. The parameters have been optimized for having a good signal-to-noise ratio with a large contribution due to the morphology rather than to the atomic number of the target material. Images have been acquired for each layer composing each mask.
SEM images show the typical chaotic superposition of fibers in face masks; actually, filtering depends significantly on the disorder inherent to these materials. Different masks have different fiber diameters and coarser or finer structures.
Once SEM parameters have been set in order to optimize image contrast, acquired images have been binarized through thresholding, in order to separate fibers from the dark background (
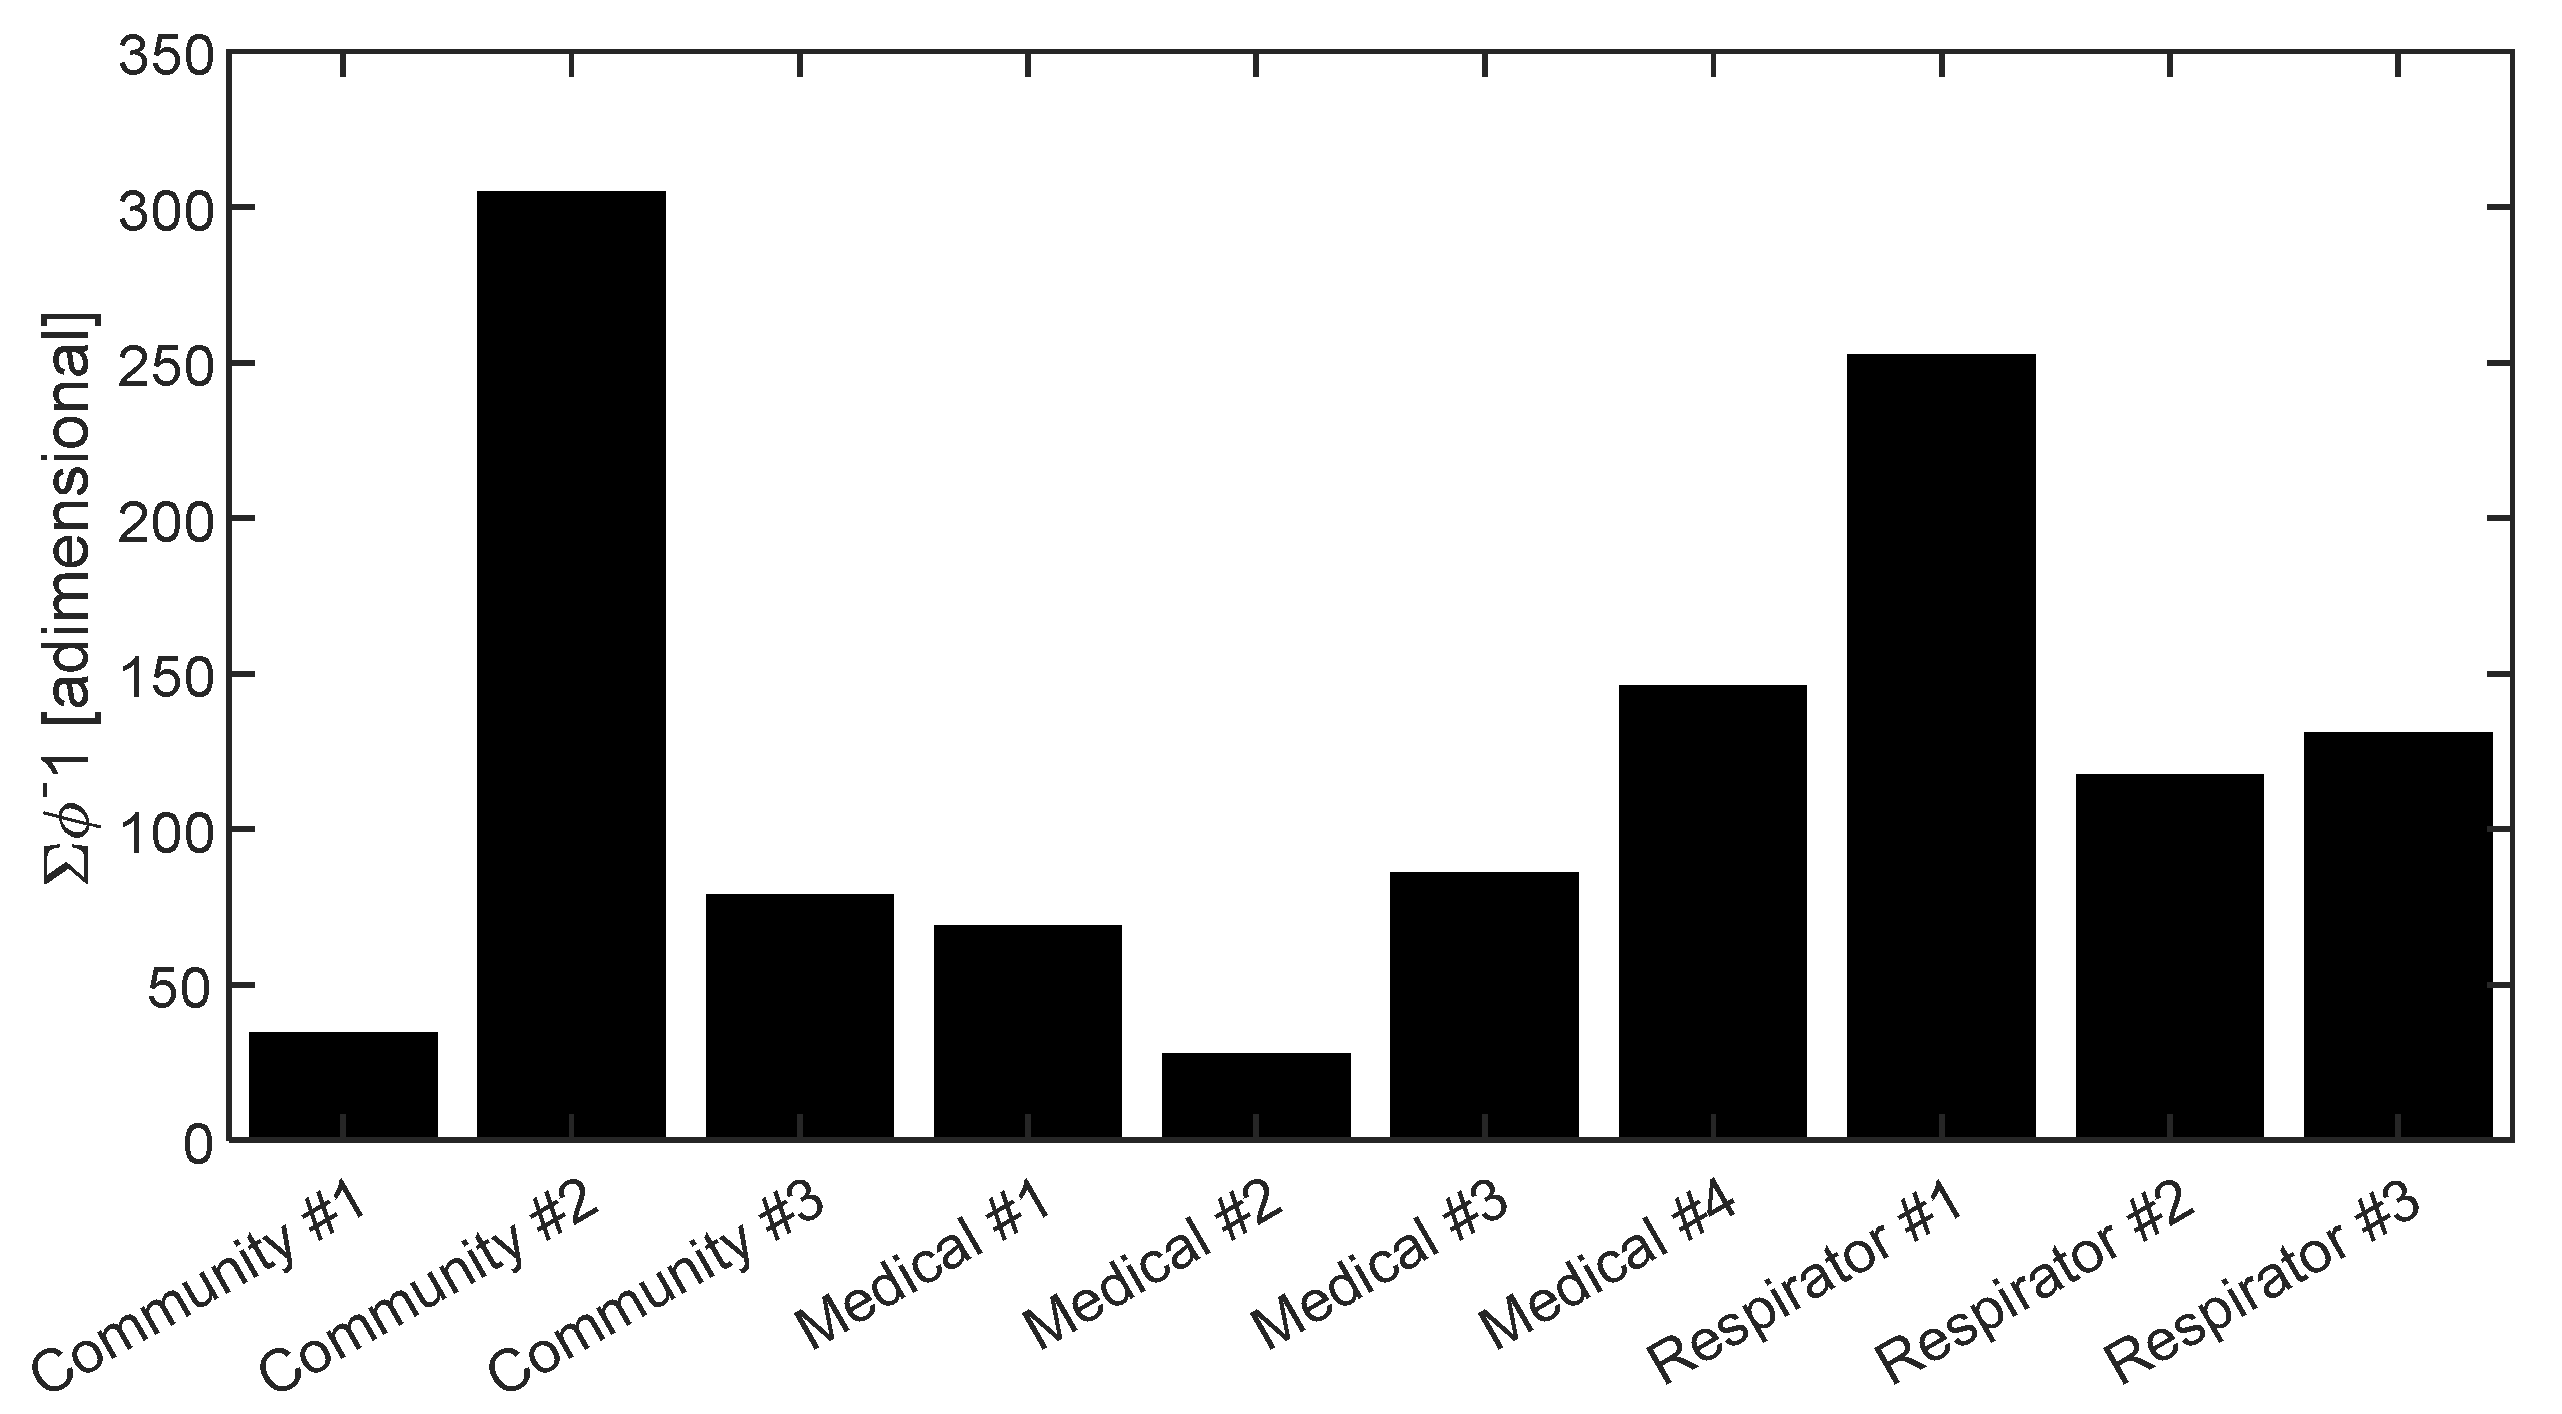
Figure 5). The latter procedure has been repeated five times for each sample under the continuous monitoring of the operator. The average percentage of void area over the five measurements have been considered and this non-dimensional parameter, a percentage, is an estimator of the mask porosity. Repeated measurements allow for the estimation of an average estimate, accounting for inhomogeneities of the material. This approach, based on two-dimensional imaging can be applied to for an indirect measurement of porosity, given the fact that each mask layer is inherently a two-dimensional structure, with negligible thickness, in the order of some tenths of a millimeter.

3. Results

3.1. Acoustic Results

Figure 6 reports the directivity plots from some frequency bands of interest (500, 1000, 3150, 5000 Hz). The 0-degree direction in the polar plot represents the position in front of the mannequin mouth while the 180-degree direction represents the back of the mannequin. The plots also show the directivity of the source with/without the mannequin to prove that the installation condition does not modify the monopole-like characteristics of the source. As demonstrated in [12], the masks covering the radiating source influence its directivity. According to a previous work presented in the literature [16], the major impact occurs in the high frequency range (3150 Hz–5000 Hz), in which a deviation from omnidirectional behavior is to be highlighted.
Looking at the plots, it is also evident that community masks produce the greatest effect in modifying directivity and increasing attenuation, as evidenced also in [15]. This phenomenon is indeed clear both in the low (500 Hz) and high frequency ranges. As respirators are concerned, they start modifying directivity and attenuating noise in the high frequency range. Contrarily, medical masks seem to have a reduced impact on the source directivity as well as on the attenuation.
Figure 7 reports the 1/3 octave acoustic pressure spectra, from the 200 Hz to the 8 kHz band, acquired by the microphone positioned in front of the mannequin mouth. The grey bars correspond to the test with no mask and the black bars to the test with one of the mask typologies, i.e., the respirator one. An error bar is superimposed to show the spread of data associated with averaging process over the five repetitions performed for each mask tested; this is an estimate of the reproducibility of the test, as said in Section 2. We plot an interval equal to ±2 standard deviations, i.e., coverage factor of 2 has been used to represent the interval which provides a 95% confidence level. The error bars highlight that the reproducibility is lower for the test with the masks because it depends on the process of placing the mask on the simulator head. This also demonstrates that the way of wearing the mask (more or less close-fitting to the face, for example) will have an impact on the voice radiation. Figure 7 also shows that the acoustic effect of the respirator is the attenuation in the medium–high frequency range, from the 2 kHz band on.
Figure 8 displays the attenuation effect of the different mask samples divided by typology. In each plot, the 1/3 octave band acoustic pressure spectra acquired by the microphone located at the front of the mannequin mouth of each mask for each type tested is represented, as well as for the no-mask condition (blue bars, the first bar of each bar plot). It is evident that different masks exhibit different attenuation even within the same typology. However, we may say that all types of masks attenuate at frequencies above 2 kHz. The community masks exhibit the largest data scatter which is expected because they are not subject to any standard, they differ significantly from each other in terms of material and layering. If we consider the respirators, from the bottom plot we can clearly see that they exhibit the largest attenuation especially at high frequencies. This is probably associated with the materials and their structure. In fact, the respirators are designed to have a tight fit to the face. They also show a limited scatter because they are subject to a strict standardization concerning the material and the layering. Finally, the behavior of medical masks can be considered in between the other two typologies. They exhibit a smaller acoustic attenuation in the high frequency range with respect to the respirators and a larger data scatter. Concerning the low frequency range, it can be stated that in general, only the community masks have an important effect below the 2 kHz band, while medical masks and respirators have not. In the high frequency range, community and medical masks attenuate up to 4–5 dB(Z). The most attenuating typology of masks is the respirator that shows a reduction of up 7 dB(Z) at the 3150 Hz band.

3.2. Porosity of the Fibrous Material

The images acquired by SEM, and reported from Figure 9, Figure 10 and Figure 11, show different characteristics of each layer in the various masks: the fibers dimension, the presence of pores and the geometrical structure of the layers can be very well observed. The different brightness of the images is mainly due to the different quality of the metal deposition on the specimen surface, whose adhesion is slightly different from one type of mask to another, due to the different surface conditions and material characteristics.
Fibers are disposed randomly in each layer, in an unstructured way: this is typical of fibrous materials used for filters. Air flow takes place through the voids.
For each layer it is possible to compute, through image analysis, the percentage of voids per unit area (ϕ): this parameter is an estimate of porosity. According to the classical semi-empirical Kozeny–Carman model, also widely applied to randomly distributed fibrous media [19,20], it is recognized that the flow resistance R is dependent on porosity ϕ through an inverse relationship: R 1 ϕ .
Additionally, it is well established that other parameters influence flow resistivity; Hurrell in [21] demonstrated that it is also related to fiber radius and fiber radius distribution. In our work we concentrate on porosity, which can be estimated by the analysis of the SEM images of each layer.
Being a mask made of N layers, one in series to the other, the overall acoustic resistance Rtot (if considering electro-acoustical circuits analogy) can be assumed, in first approximation, as the sum of the resistances of each i-th layer, hence R t o t i N ϕ i 1 .
Figure 12 shows the sum of the inverse of the porosity, that is expected to be correlated to acoustic attenuation. The values of void percentage per unit area (ϕ) have been evaluated for each layer of the tested masks following the procedure stated in Section 2.3. The dark background of the binarized images clearly represents the voids in the tissue structure.

3.3. Correlation Analysis

The acoustic attenuation of the masks has been determined considering the sound pressure measured by the microphone positioned in front of the mannequin mouth. The overall sound pressure level integrated in the frequency range between the 200 Hz and 8000 Hz bands, the effective operation frequency range of the Q-HMF source, has been calculated from the acoustic pressure spectra measured in the different configurations: source covered with the 10 different masks and source uncovered. The acoustic attenuation has been estimated by subtracting the overall acoustic pressure level obtained for the 10 masks to the overall sound pressure level attained when the source was not covered with any mask. The synthesis of the attenuation levels is reported in Figure 13. It is clearly evident that community masks behave very differently depending on the material they are made of. Respirators instead are more aggregated in terms of attenuation capabilities, and they exhibit the maximum clustered attenuation levels (about 3 dB(Z)).
It is now interesting to observe that the trends seen in Figure 12 and Figure 13 are similar. Indeed, a correlation between acoustic attenuation and the void percentage of the mask’s tissues is in accordance with what was stated by Beranek [22] for fibrous media.
In order to highlight the relationship between acoustic attenuation and the inverse of porosity, we plotted these two quantities in Figure 14. The scatter plot clearly highlights a positive correlation between these parameters, hence contributing to sustain the hypothesis that the porosity in the layers affects acoustic performance. In order to quantify this possible correlation, being the attenuation in a logarithmic quantity, in Figure 15 we also plotted the abscissa in a logarithmic scale; the fact that a logarithmic fit clearly represents the trend of data reported in Figure 15 and that it appears as a linear function, suggests that it is possible to identify a linear correlation between the attenuation levels in dB(Z) and the logarithm of the inverse of porosity. Thus, this confirms that porosity is indeed a major cause of acoustic attenuation. Indeed, if we consider a linear regression model for the acoustic attenuation and the logarithm of the inverse of porosity, we find a strong correlation, with R2 = 0.8. This correlation is also confirmed by the well-known semi-empirical relationship between acoustic attenuation through fibrous materials and their flow resistivity proposed by Delany and Bazley in [23].
In mask testing, for certification purposes, the breathability is always measured: this quantity is closely related to porosity and flow resistance, hence it is expected that acoustic attenuation would correlate to breathability, in particular to the logarithm of breathability.
Figure 16 shows these data in linear scale, while Figure 17 shows breathability in a logarithmic scale. An evident correlation between acoustic attenuation and breathability can be seen in Figure 17 if considering the good logarithmic fit on experimental data, showing as a linear trend in log-dB(Z) scale. Acoustic attenuation and the logarithm of breathability data can be accurately fitted by a linear regression model—correlation coefficient (R2) of 0.9—once community mask number 2 is excluded from the dataset.
Instead, no correlation is evidenced when comparing acoustic attenuation with BFE, see Figure 18. This can be due to the fact that bacterial filtration efficiency depends on several phenomena, involving different material properties, other than porosity; therefore, porosity of the fibrous medium, which we have seen is well correlated to acoustic attenuation, is influencing BFE, but it is not the main influencing variable.

4. Discussion

The pandemic has brought to use a large number of face masks which are designed for creating a shield against the spread and/or inhalation of droplets which are the vehicle of COVID-19 virus transmission. Indeed, by covering the nose and mouth of the wearer, they might be effective in their prevention purposes, but they surely have an impact in terms of acoustic communication.
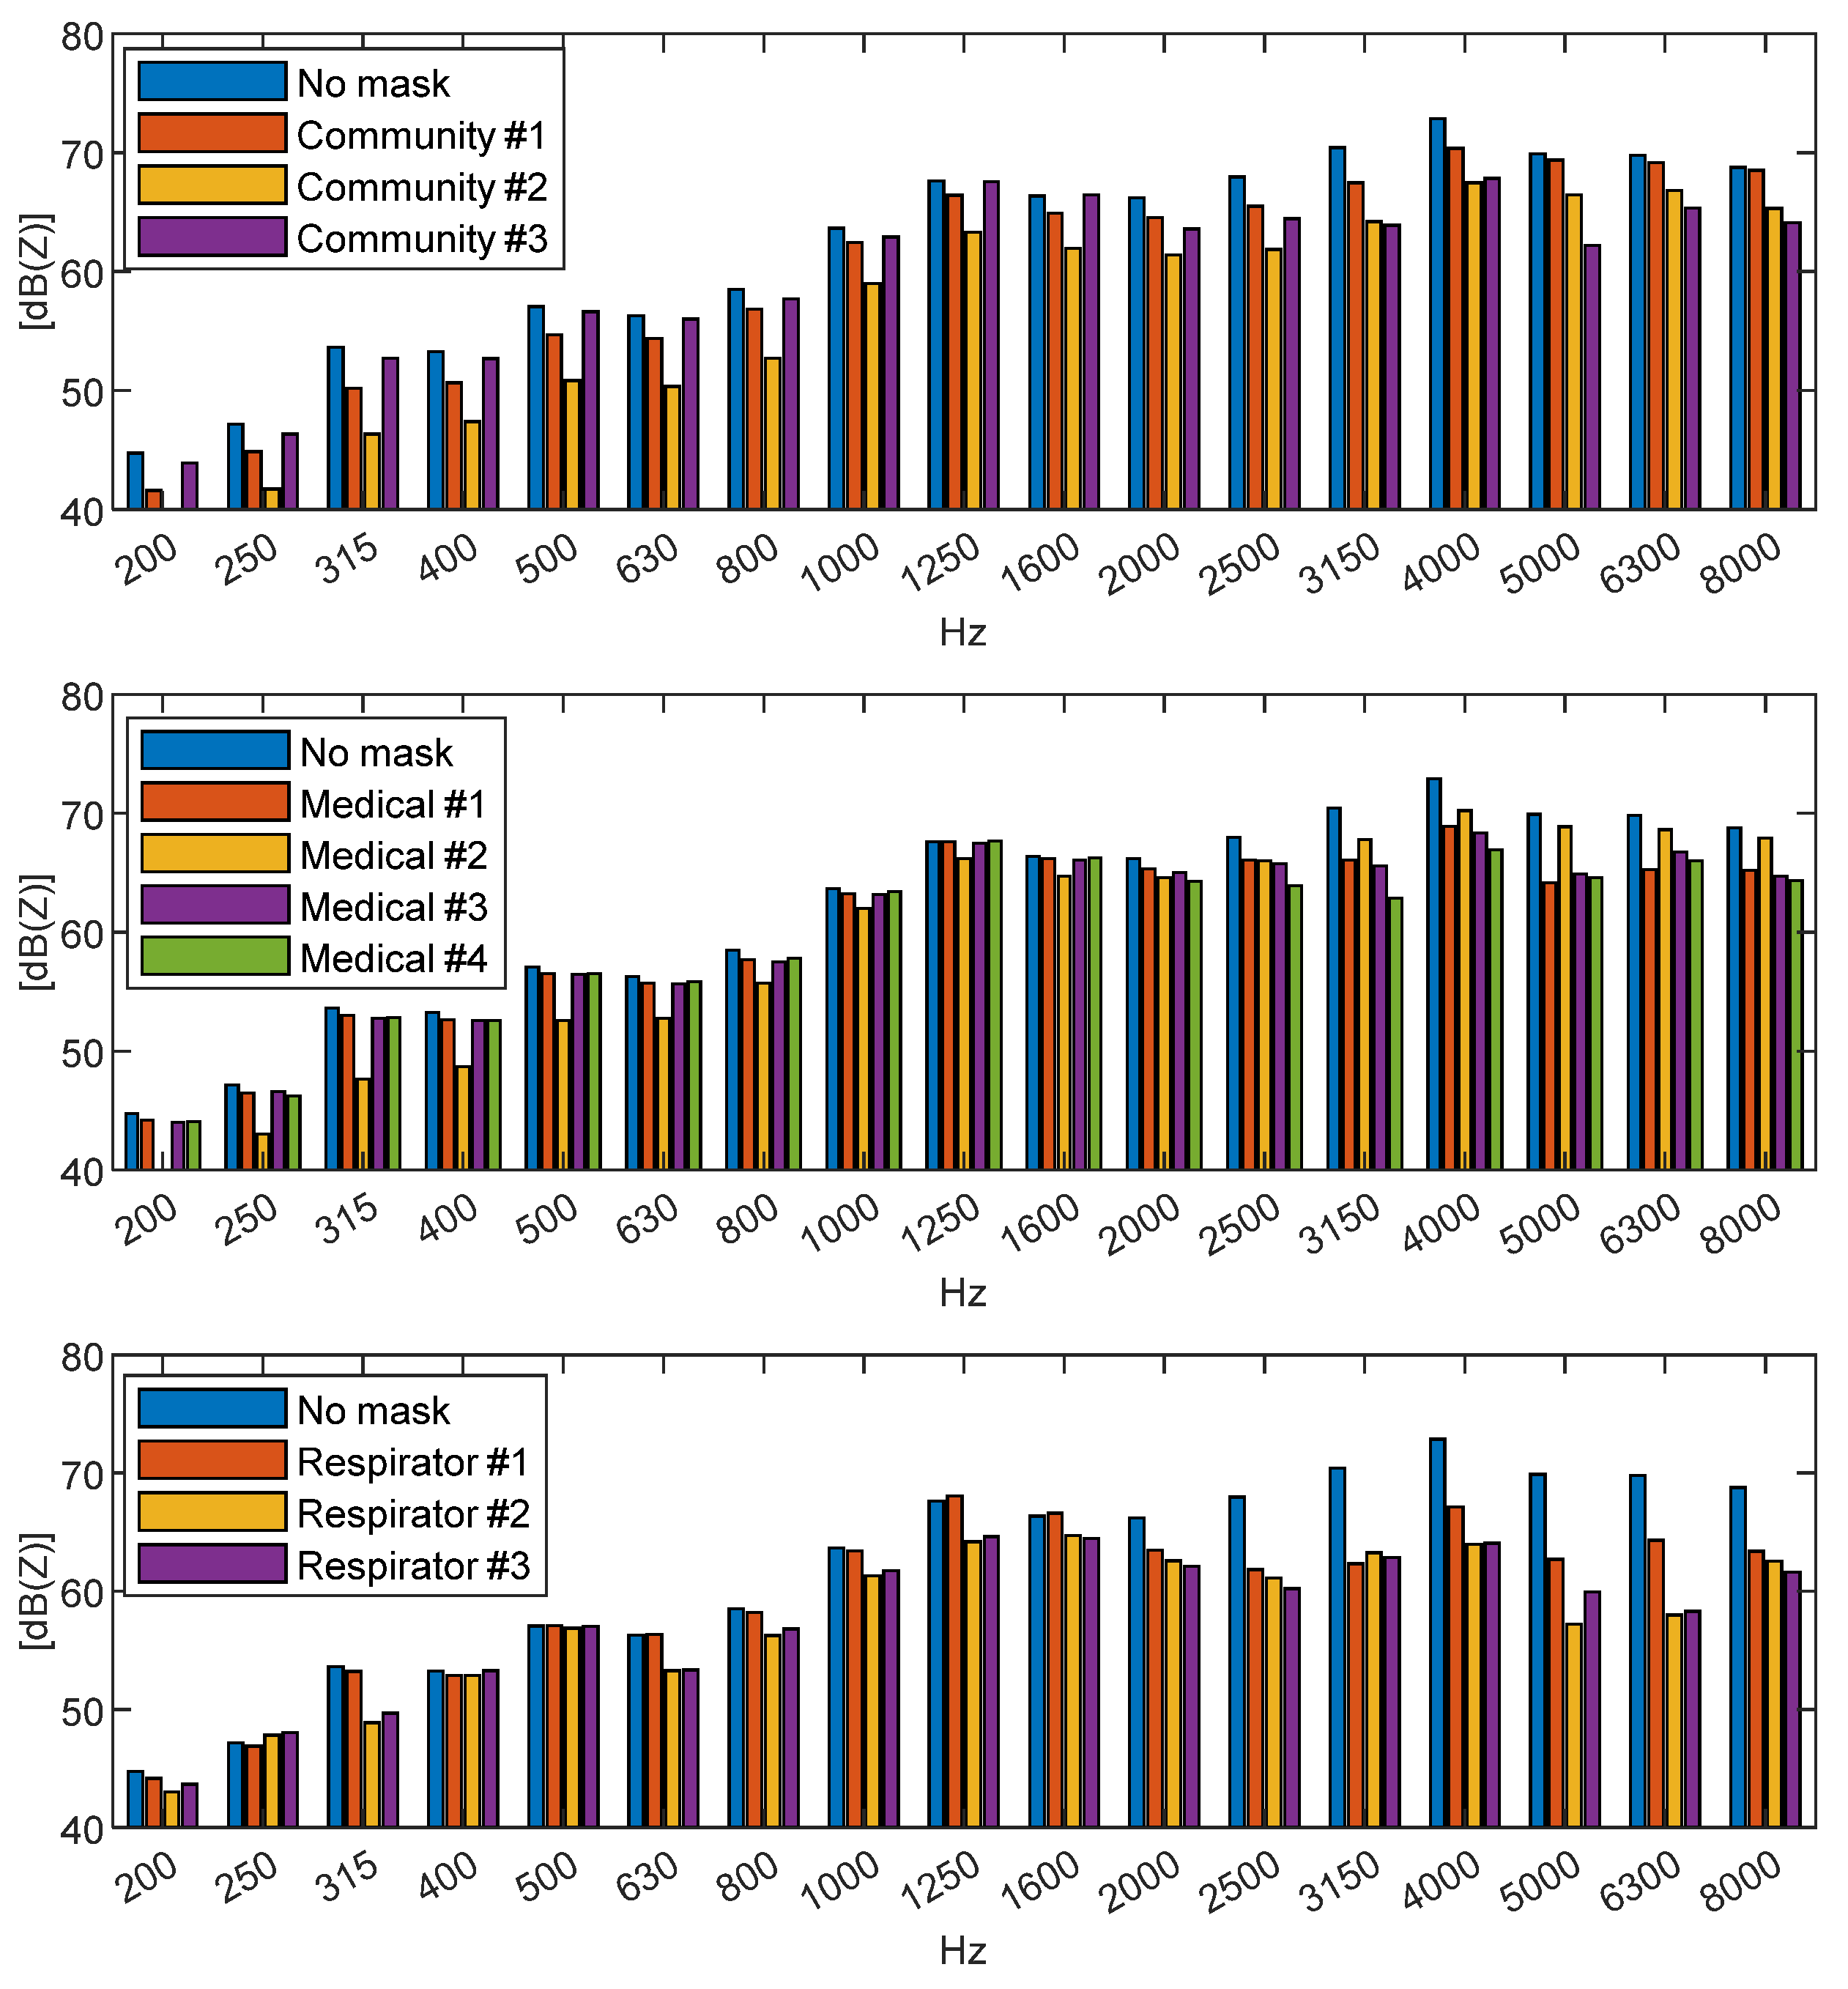
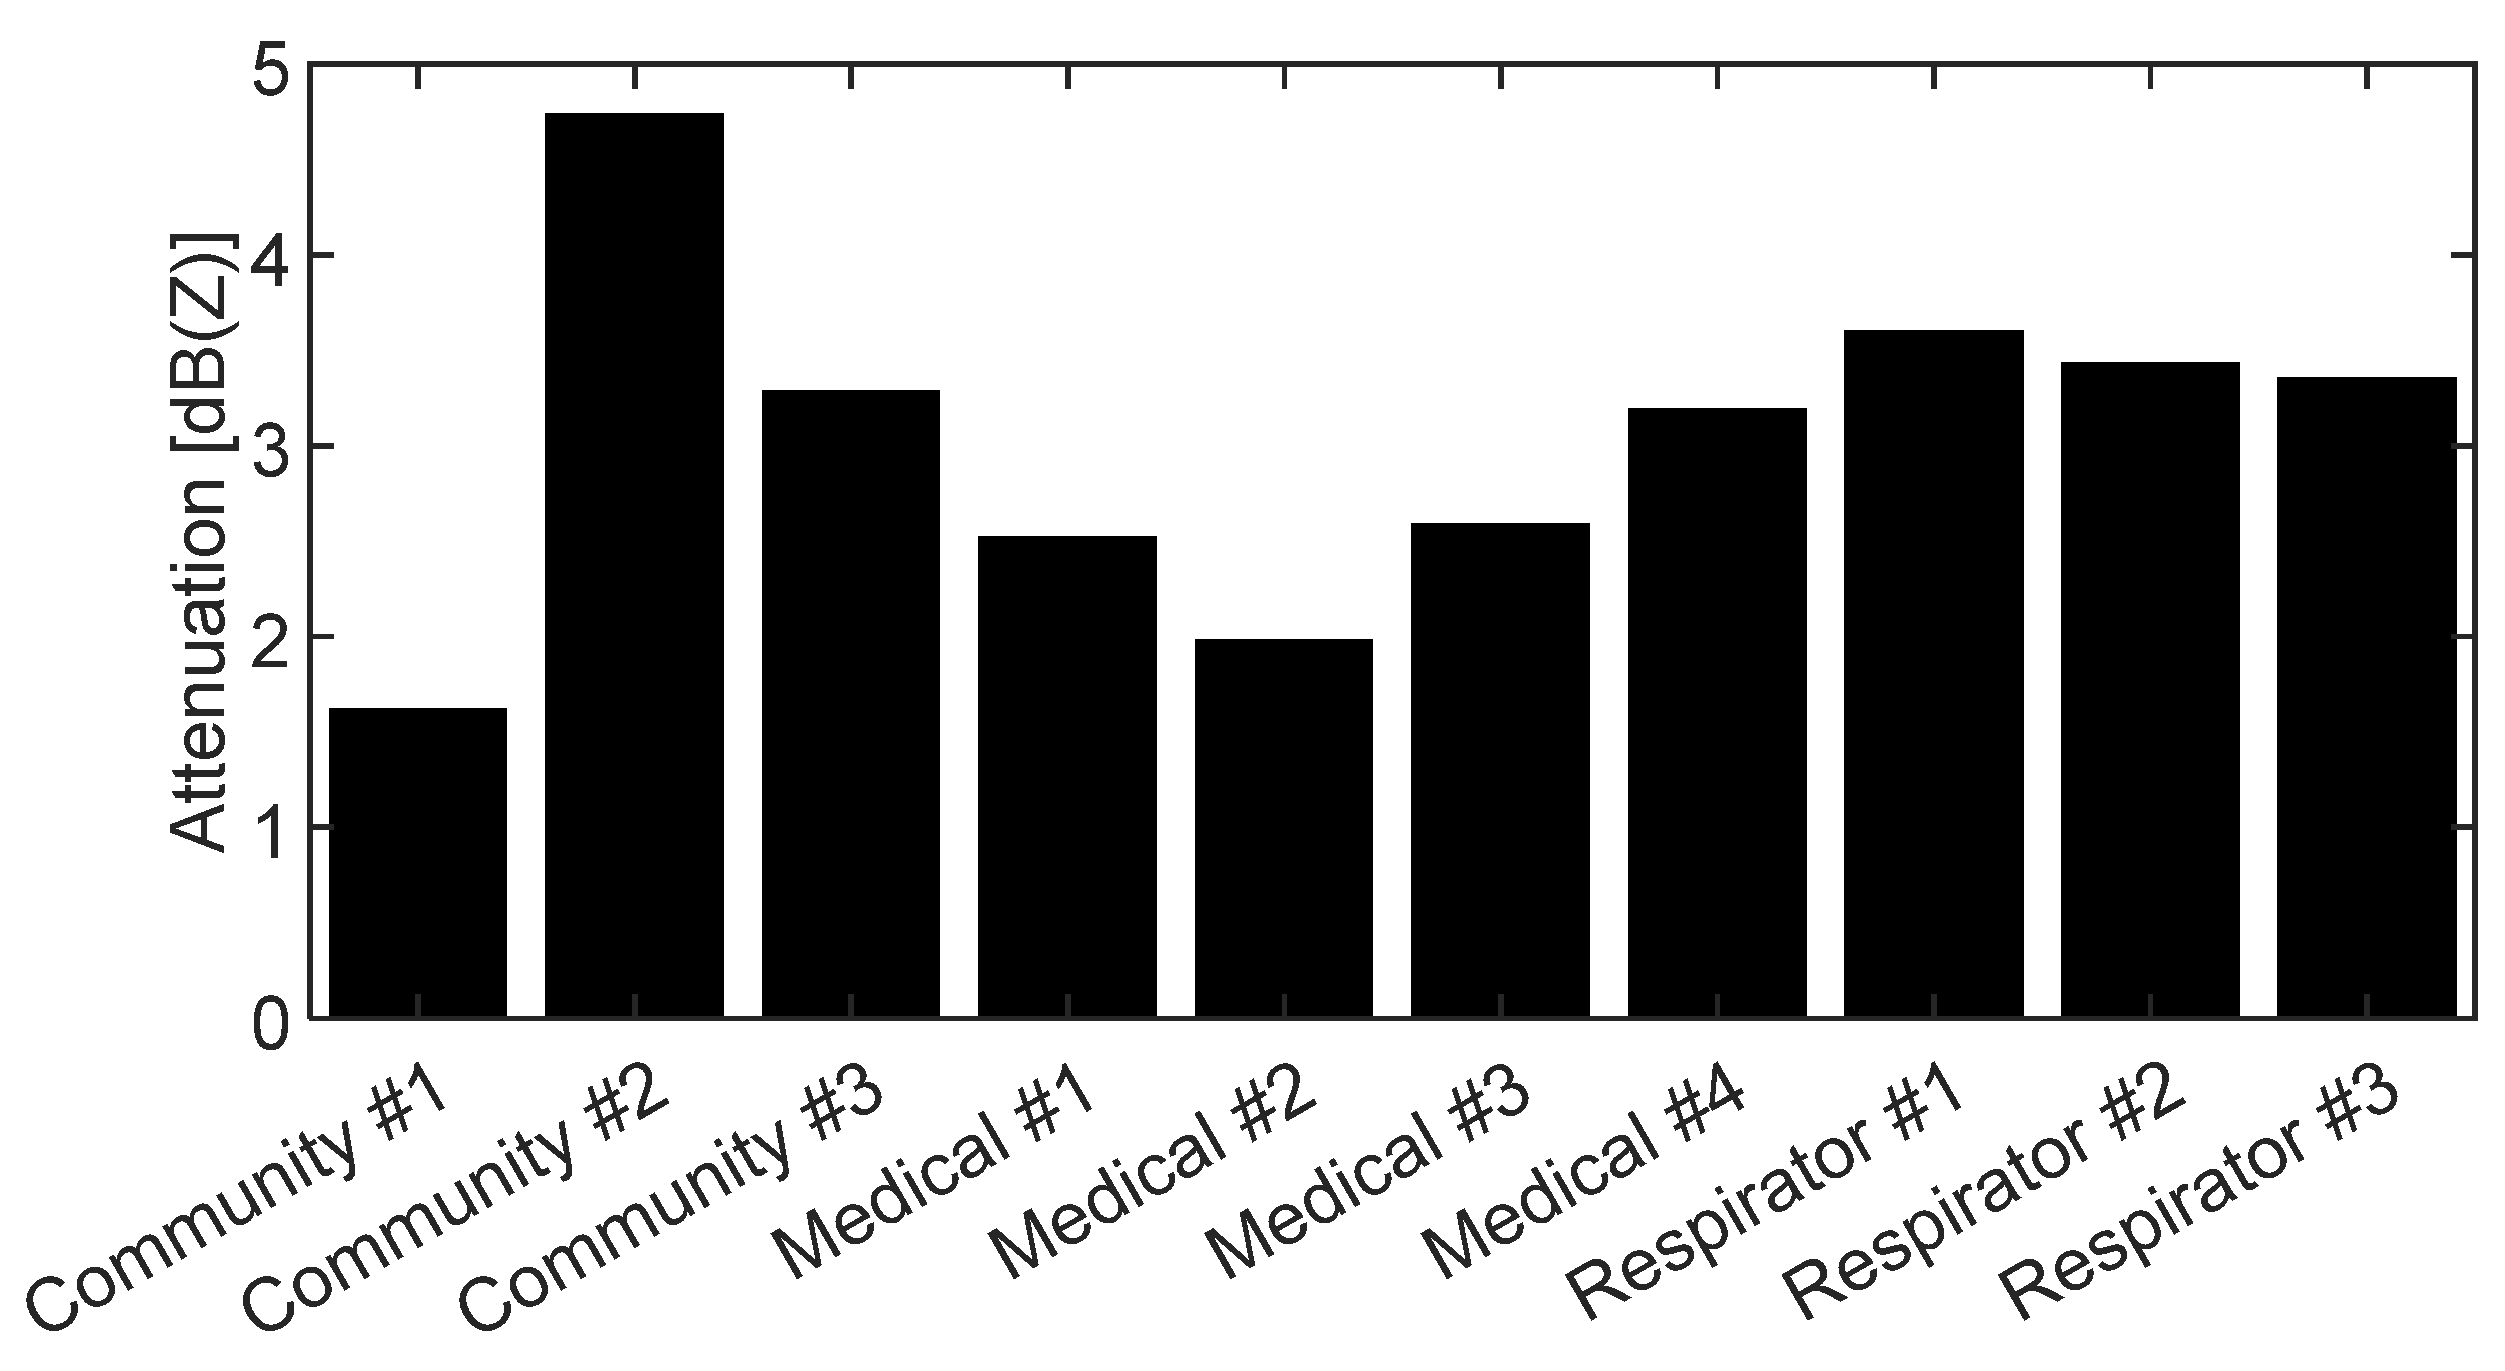
The paper has discussed the acoustic performances of three types of masks, medical masks, respirators and community masks. Overall, ten different models of masks have been tested, in particular four medical masks, three respirators and three community masks. For each, we have measured the acoustic attenuation, breathability, bacterial filtration efficiency and porosity of the fibrous layers.
The acoustic tests show that all masks have a non-negligible acoustic attenuation in the high frequency range above 2 kHz. Some of the community masks also have an important attenuation in the lower range, up to 200 Hz, and they exhibit very diverse behavior overall with the complete frequency range between 200 and 2000 Hz. Data from the community masks are more dispersed, due to the fact that their characteristics are not subject to any standard.
Then, we have processed the data in search for a correlation between the acoustic attenuation and the specific structure of the fibrous material, and to two main functional properties of the masks, namely breathability and bacterial filtration efficiency.
It is interesting to observe a positive correlation between acoustic attenuation and breathability and the inverse of mask porosity, which is related to flow resistance. Indeed, it emerges that porosity is the key characteristic ruling both breathability and acoustic pressure wave propagation.
No similar correlation has been observed with bacterial filtration efficiency: even if this parameter depends on the porosity of the fibrous medium, probably many other factors have an influence on filtration, but not on acoustic attenuation.
At present, mask design is not taking into account any issues related to acoustics. However, given the current wide usage (and probably long-lasting in the future) of these disposable devices and their impact in everyday social activities, especially for hearing impaired/partially impaired people, the acoustic performance should be considered among the functional performance of the masks. Further studies should still be performed to guarantee a complete understanding of the mechanisms linking acoustic performance and other design parameters such as the number of layers, geometries and orientation of the fibers, geometry of the structure and material properties. In this context, the present paper aimed to contribute to the paving of the way for increased awareness on the social importance of this topic and trigger the interest for a mask design which takes into also account acoustic performance.

Author Contributions

Conceptualization, M.M., P.C. (Paolo Chiariotti) and P.C. (Paolo Castellini); methodology, M.M., L.M. and S.S.; formal analysis, P.C. (Paolo Chiariotti) and N.P.; investigation, G.B.; data curation, G.B.; writing—original draft preparation, M.M.; writing—review and editing, N.P. and P.C. (Paolo Castellini); supervision, P.C. (Paolo Chiariotti). All authors have read and agreed to the published version of the manuscript.

Funding

This research received no external funding.

Institutional Review Board Statement

Not applicable.

Informed Consent Statement

Not applicable.

Data Availability Statement

Raw data were generated at Università Politecnica delle Marche. Derived data supporting the findings of this study are available from the corresponding author on request.

Acknowledgments

Authors would like to acknowledge Stefania Cecchi who made the anechoic chamber available for testing.

Conflicts of Interest

The authors declare no conflict of interest.

References

  1. Available online: https://www.who.int/emergencies/diseases/novel-coronavirus-2019/question-and-answers-hub/q-a-detail/coronavirus-disease-covid-19-masks (accessed on 10 December 2021).
  2. EN 149:2009+A1:2009; Respiratory Protective Devices—Filtering Half Masks to Protect against Particles—Requirements, Testing, Marking. European Committee for Standardization: Bruxelles, Belgium, 2009.
  3. EN 14683:2019+AC:2019; Medical Face Masks—Requirements and Test Methods. European Committee for Standardization: Bruxelles, Belgium, 2019.
  4. Tessarolo, F.; Nollo, G.; Maniglio, D.; Rigoni, M.; Benedetti, L.; Helfer, F.; Corradi, I.; Rovati, L.; Ferrari, A.; Piccini, M.; et al. Testing Surgical Face Masks in an Emergency Context: The Experience of Italian Laboratories during the COVID-19 Pandemic Crisis. Int. J. Environ. Res. Public Health 2021, 18, 1462. [Google Scholar] [CrossRef]
  5. Tessarolo, F.; Nollo, G.; Benedetti, L.; Helfer, F.; Rovati, L.; Ferrari, A.; Marchetti, G.; Reverberi, F.; Baglio, S.; Tuccitto, N.; et al. Measuring breathability and bacterial filtration efficiency of face masks in the pandemic context: A round robin study with proficiency testing among non-accredited laboratories. Measurement 2021, 189, 110481. [Google Scholar] [CrossRef]
  6. CWA 17553:2020 E; Community Face Coverings—Guide to Minimum Requirements, Methods of Testing and Use. European Committee for Standardisation: Bruxelles, Belgium, 2020.
  7. Claudi, L.; Arnesano, M.; Chiariotti, P.; Battista, G.; Revel, G.M. A soft-sensing approach for the evaluation of the acoustic comfort due to building envelope protection against external noise. Measurement 2019, 146, 675–688. [Google Scholar] [CrossRef]
  8. Chodosh, J.; Weinstein, B.E.; Blustein, J. Face masks can be devastating for people with hearing loss. BMJ 2020, 370, m2683. [Google Scholar] [CrossRef] [PubMed]
  9. Asadi, S.; Cappa, C.D.; Barreda, S.; Wexler, A.S.; Bouvier, N.M.; Ristenpart, W.D. Efficacy of masks and face coverings in controlling outward aerosol particle emission from expiratory activities. Sci. Rep. 2020, 10, 15665. [Google Scholar] [CrossRef] [PubMed]
  10. Bandaru, S.V.; Augustine, A.M.; Lepcha, A.; Sebastian, S.; Gowri, M.; Philip, A.; Mammen, M.D. The effects of N95 mask and face shield on speech perception among healthcare workers in the coronavirus disease 2019 pandemic scenario. J. Laryngol. Otol. 2020, 134, 895–898. [Google Scholar] [CrossRef] [PubMed]
  11. Muzzi, E.; Chermaz, C.; Castro, V.; Zaninoni, M.; Saksida, A.; Orzan, E. Short report on the effects of SARS-CoV-2 face protective equipment on verbal communication. Eur. Arch. Oto-Rhino-Laryngol. 2021, 278, 3565–3570. [Google Scholar] [CrossRef] [PubMed]
  12. Corey, R.M.; Jones, U.; Singer, A.C. Acoustic effects of medical, cloth, and transparent face masks on speech signals. J. Acoust. Soc. Am. 2020, 148, 2371. [Google Scholar] [CrossRef] [PubMed]
  13. Caniato, M.; Marzi, A.; Gasparella, A. How much COVID-19 face protections influence speech intelligibility in classrooms? Appl. Acoust. 2021, 178, 108051. [Google Scholar] [CrossRef]
  14. Bottalico, P.; Murgia, S.; Puglisi, G.E.; Astolfi, A.; Kirk, K.I. Effect of masks on speech intelligibility in auralized classrooms. J. Acoust. Soc. Am. 2020, 148, 2878–2884. [Google Scholar] [CrossRef] [PubMed]
  15. Brown, V.A.; Van Engen, K.J.; Peelle, J.E. Face mask type affects audiovisual speech intelligibility and subjective listening effort in young and older adults. Cogn. Res. Princ. Implic. 2021, 6, 49. [Google Scholar] [CrossRef] [PubMed]
  16. Pörschmann, C.; Lübeck, T.; Arend, J.M. Impact of face masks on voice radiation. J. Acoust. Soc. Am. 2020, 148, 3663–36701. [Google Scholar] [CrossRef] [PubMed]
  17. Halkosaari, T.; Vaalgamaa, M.; Karjalainen, M. Directivity of artificial and human speech. J. Audio Eng. Soc. 2005, 53, 620–631. [Google Scholar]
  18. Andersen, A.A. New sampler for the collection, sizing, and enumeration of viable airborne particles. J. Bacteriol. 1958, 76, 471–484. [Google Scholar] [CrossRef] [PubMed] [Green Version]
  19. Yazdchi, K.; Srivastava, S.; Luding, S. On the validity of the Carman-Kozeny equation in random fibrous media. In Proceedings of the 2nd International Conference on Particle-based Methods, PARTICLES 2011, Barcelona, Spain, 26–28 October 2011; pp. 1–10. [Google Scholar]
  20. Nabovati, A.; Llewellin, E.W.; Sousa, A.C.M. A general model for the permeability of fibrous porous media based on fluid flow simulations using the lattice Boltzmann method. Compos. Part A Appl. Sci. Manuf. 2009, 40, 860–869. [Google Scholar] [CrossRef]
  21. Hurrell, A.I.; Horoshenkov, K.V.; Pelegrinis, M. The accuracy of some models for the airflow resistivity of nonwoven materials. Appl. Acoust. 2018, 130, 230–237. [Google Scholar] [CrossRef]
  22. Franklin, R.E. Noise Reduction; Beranek, L.L., Ed.; McGrow-Hill: New York, NY, USA, 1960. [Google Scholar]
  23. Delany, M.E.; Bazley, E.N. Acoustical properties of fibrous materials. Appl. Acoust. 1970, 3, 105–116. [Google Scholar] [CrossRef]
Figure 1. Experimental set-up with the microphone arrangement around the head and torso simulator housing the sound source nose in the mouth.
Acoustics 04 00009 g001
Figure 2. Close-up of the simulator head with no mask (left) and wearing a community mask (right).
Acoustics 04 00009 g002
Figure 3. Scheme of the layout of the breathability test, according to the EN 14683 standard [3].
Acoustics 04 00009 g003
Figure 4. BFE scheme as reported by the EN 14683 standard [3].
Acoustics 04 00009 g004
Figure 5. As an example, the image on the left reports the SEM image of the layer number one of the community 1 mask; on the bottom side of the image, the main parameters for the acquisition are indicated. On the right, the processed image in which the black areas indicate the void part of the tissue net.
Acoustics 04 00009 g005
Figure 6. Acoustic pressure 1/3 octave bands directivity plots in dB(Z). The decibel reference is 20 μPa. Radial scale between 40 and 80 dB(Z).
Acoustics 04 00009 g006
Figure 7. Acoustic pressure of a 1/3 octave spectrum for the condition without the mask (grey bar) and for the condition with one of the masks (black bar). The decibel reference is 20 μPa.
Acoustics 04 00009 g007
Figure 8. 1/3 octave spectrua of the acoustic pressure for the different mask types: community masks (top), medical (center), and respirator (bottom). The decibel reference is 20 μPa.
Acoustics 04 00009 g008
Figure 9. SEM pictures of the layers composing the community masks. Despite the fact that the images seem similar, the third layer of the Community 2 mask presents a denser structure as well as the first layer of the Community 3 mask.
Acoustics 04 00009 g009aAcoustics 04 00009 g009b
Figure 10. SEM pictures of the layers composing the medical masks. A denser structure with thinner filaments is present in layer 2 of the Medical masks n. 1, 3 and 4.
Acoustics 04 00009 g010
Figure 11. SEM pictures of the layers composing the respirators. Respirators 2 and 3 have an additional layer with thinner filaments, as seen in the third pictures in column 2 and 3; while Respirator 1 presents a dense structure with thicker fibers in picture 3 of the column 1.
Acoustics 04 00009 g011
Figure 12. Plot of the sum of the inverse of porosity, ϕ (percentage of void/ total area), for the different layers of each mask.
Acoustics 04 00009 g012
Figure 13. Acoustic attenuation of the 10 masks tested.
Acoustics 04 00009 g013
Figure 14. Acoustic attenuation versus the sum of the inverse of porosity.
Acoustics 04 00009 g014
Figure 15. Correlation between acoustic attenuation and the logarithm of the sum of the inverse of porosity (R2 = 0.8).
Acoustics 04 00009 g015
Figure 16. Acoustic attenuation versus breathability.
Acoustics 04 00009 g016
Figure 17. Correlation between acoustic attenuation and the logarithm of breathability (R2 = 0.9).
Acoustics 04 00009 g017
Figure 18. Correlation between acoustic attenuation and the logarithm of the BFE.
Acoustics 04 00009 g018
Table 1. Typology and characteristics of the masks tested.
TypologySampleN. of LayersMass per Unit Area [g/mm2]Appearance
Community13100.7 Acoustics 04 00009 i001
23397.2 Acoustics 04 00009 i002
32582.7 Acoustics 04 00009 i003
Medical1386.1 Acoustics 04 00009 i004
23113.0
3377.8
4372.2
Respirators13187.5 Acoustics 04 00009 i005
24199.4
34186.9
Publisher’s Note: MDPI stays neutral with regard to jurisdictional claims in published maps and institutional affiliations.

