Article

The Proscenium of Opera Houses as a Disappeared Intangible Heritage: A Virtual Reconstruction of the 1840s Original Design of the Alighieri Theatre in Ravenna

1
Department of Industrial Engineering, University of Bologna, 40136 Bologna, Italy
2
Acoustics Air and Emissions, Atkins, London SW1E 5BY, UK
*
Author to whom correspondence should be addressed.
Current address: Viale Risorgimento 2, 40126 Bologna, Italy.
Acoustics 2019, 1(3), 694-710; https://doi.org/10.3390/acoustics1030041
Submission received: 1 July 2019 / Revised: 23 August 2019 / Accepted: 23 August 2019 / Published: 1 September 2019

Abstract

:
In a Historical Opera House (HOH), the proscenium is the foreground part of the stage. Until the end of the 19th Century, it was extended through the cavea, being the orchestra placed at the same level of the stalls, without an orchestra pit. Soloists often moved in the proscenium when they sung, in order to increase the strength of the voice and the intelligibility of the text. The Alighieri theatre in Ravenna, designed by the Meduna brothers, the former designers of Venice’s “La Fenice” theater, is chosen as a case study. During a refurbishment in 1928, the proscenium of the stage was removed in order to open the orchestra pit, which was not considered in the original design. The original design and the present one are compared by using numerical simulations. Acoustic measurements of the opera house and vibro-acoustic measurements on a wooden stage help to reach a proper calibration of both models. Results are discussed by means of ISO 3382 criteria: the proscenium increases the sound strength of the soloists but reduces the intelligibility of the text.

1. Introduction

During last three decades, the interest of scholars was focused on the acknowledgment of acoustics of HOH as intangible cultural heritage, using this term with the meaning accepted by the academic community [1,2]. The so-called “Charter of Ferrara”—a document delivered in 1999—stated: “Preserving the acoustical heritage of historical opera houses means first of all being fully aware of it, identifying its presence and getting to know it. Then, it implies making an inventory of it and, finally, introducing legal protection measures to avoid its spoilage” [3]. Basing on the Charter of Ferrara—but not only—in the last 20 years, a huge set of acoustical data of Historical Opera Houses (HOHs) have been accumulated by scholars, but only few studies are available on international references [4,5,6,7,8,9,10,11,12].
Acoustic impulse responses are measured by setting sound sources and receivers in some relevant positions, respectively in the orchestra pit and on the stage for the source and in the stalls and in the boxes for the receiver [13] and extracting the room criteria defined by ISO 3382-1 [14]. HOHs need periodic refurbishments, which imply effects from an acoustic point of view [15,16]. The refurbishment of an HOH is a debated topic: on one hand, it would return the hall at its originally working condition; on the other hand, the safety and performance requirements vary in time. The acoustics of an HOH needs to change during all its life and this variability must be taken into account when we consider HOH acoustics an intangible cultural heritage [17]. Nevertheless, during the 19th Century, a dramatic change occurred in many opera houses, which influenced more than others the acoustics: the introduction of the orchestra pit by removing the proscenium of the stage.
The proscenium was introduced in the 17th-Century theatre in order to improve the singer intelligibility during the recitativo and to bring the singer close to cembalist—or other keyboardist—who played the continuo (see Table 1 for the meaning of Italian musical terms). Moreover, the shapes of the proscenium were optimised by pre-Sabine designers in order to make the voice of soloist louder during the aria [18].
The orchestra pit was introduced by Richard Wagner (1813–1883) in the Bayreuther Festspielhaus (1876)—the wooden theatre designed by architect Gottfried Semper (1803–1879) to host Wagner’s Ring [19]. They proposed a mystic gulf, covered by a double proscenium arch, in order to divide the scene from the audience. In the mystic gulf, the orchestra was placed under the level of the audience, in a pit covered by a shell. A second shell was added in a second time, in order to decrease further the sound strength of the orchestra. The plan for a covered pit was not a Wagner original idea: the concealment of the orchestra was proposed in essays in 1775 and 1817 [18], and achieved in the Theatre of Besançon, designed by Claude-Nicholas Ledoux (1736–1806) [20], now demolished.
After three centuries from the birth of the Italian opera house—which dated back to Palladium’s Teatro Olimpico (1580)—several reasons contributed to creating another volume, coupled to the main hall, for the orchestra:
  • When the orchestra plays in the pit, it is also possible to dim the lights in the cavea, increasing the focusing of audience on the scenes. During the 19th Century, before the Festspielhaus opening—some show companies, such as the Meiningen Company, dimmed the auditorium during the performance [21]. Wagner’s main goal in Festspielhaus was to prevent the audience reading the libretto during the drama, enhancing the visual and the listening experience of the audience: for this reason, the sunken pit was intended to cover the lights used by musicians [22].
  • In the 19th Century, orchestras were changing, by adding more brass and, consequently, more strings and woodwinds were needed to balance the tone [23]. Consequently, the sound level of the orchestra was louder than the soloist and the pit was needed also to decrease the orchestral sound strength [24,25].
  • Recitativo gradually disappeared during the 19th-Century opera, so soloist and conductor did have more need for proximity, which allows—from the point of view of the soloist—to follow the continuo accompaniment, often played by the conductor himself.
Wagner’s proposals for Bayreuther Festspielhaus were followed by almost all the composers, and not only by composers: some of today’s practice—e.g., to clap hands at the end of each act only—were introduced during the early representations of the Ring. After the Wagnerian revolution in conceiving, playing and attending an opera, almost all the HOHs needed to be updated to the new wave. In the early 20th Century, the pre-existent HOHs removed the proscenium in order to open the orchestra pit. In the “La Scala” theatre in Milan, the pit was opened in 1902, two years after the death of Giuseppe Verdi (1813–1900): it means that most of the operas were written taking into account the proscenium as “natural gain” of singers’ voices. It can be confirmed by original libretto, which included the design of the wings and the displacement of the soloist [26].
Due to these reasons, the aim of the present work is to compare the acoustics for an HOH with and without the proscenium, by using the virtual simulation of the discontinued configuration. It could be useful to better understand how the audience attended the opera in the 19th Century. Furthermore, the present works may help to understand the range value of some room criteria during the golden age of the Italian opera.
Some data of the present work were provided by the MSc theses of Laura Reggiani [27] and Marco Rinaldi [28].

2. Methodology

As mentioned in the abstract, during a refurbishment in 1928, the proscenium of the stage was removed in order to open the orchestra pit, which was not considered in the original 1840 design. Acoustic differences between the original design of Alighieri theatre and the present one were studied by using numerical simulations. Two acoustic simulation models were done: the original design and the present one.
The present model was calibrated with measurements done in September 2014. The calibration process compares the measured and the simulated room criteria, considering values in each octave band, averaged over three regions of receivers (stalls, boxes and gallery). The analysis of this process takes into account both the spatial variation of the sound field and the uncertainty due to the simulation chain [29].
The proscenium, as mentioned in the abstract, was the foreground part of the stage, and it was made of wood. The wooden stage is fixed above the air cavity: it works as an acoustic absorber at low frequencies and, at the same time, it shows some re-radiation properties above its coincidence frequency. In order to study the acoustic behaviour of the historic wooden stage, further vibro-acoustic measurements were done. Laboratory tests on specimens helped to evaluate the influence of the aging on fir wood. Then, in situ measurements on the stage of the Alighieri Theatre confirmed the results of specimens, helping the vibro-acoustic behaviour of the historical stage.
After the calibration procedure, two models of the theatre were built: the original and the present one. A virtual sound source was simulated in each model, which was placed in the position used by the soloist during arias, respectively, in the proscenium and on the fore-stage. Room criteria were simulated over the same receivers used in the calibration procedure. Finally, results were compared.
The reliability of the method used in the present study may be evaluated through the point of view of the so-called archeo-acoustics. A taxonomy of the procedures used in the previous studies [30,31,32,33,34,35,36,37,38,39,40] is shown in Table 2.

2.1. The Alighieri Theatre in Ravenna

In 1838, Tomaso Meduna (1798–1880) was asked to design the new opera house in Ravenna. Tomaso Meduna, formerly the architect of “La Fenice” Theater in Venice, accepted the job along with his brother Giovanni Battista (1800–1886). The works began in 1840 and the theater was inaugurated in 1853 [
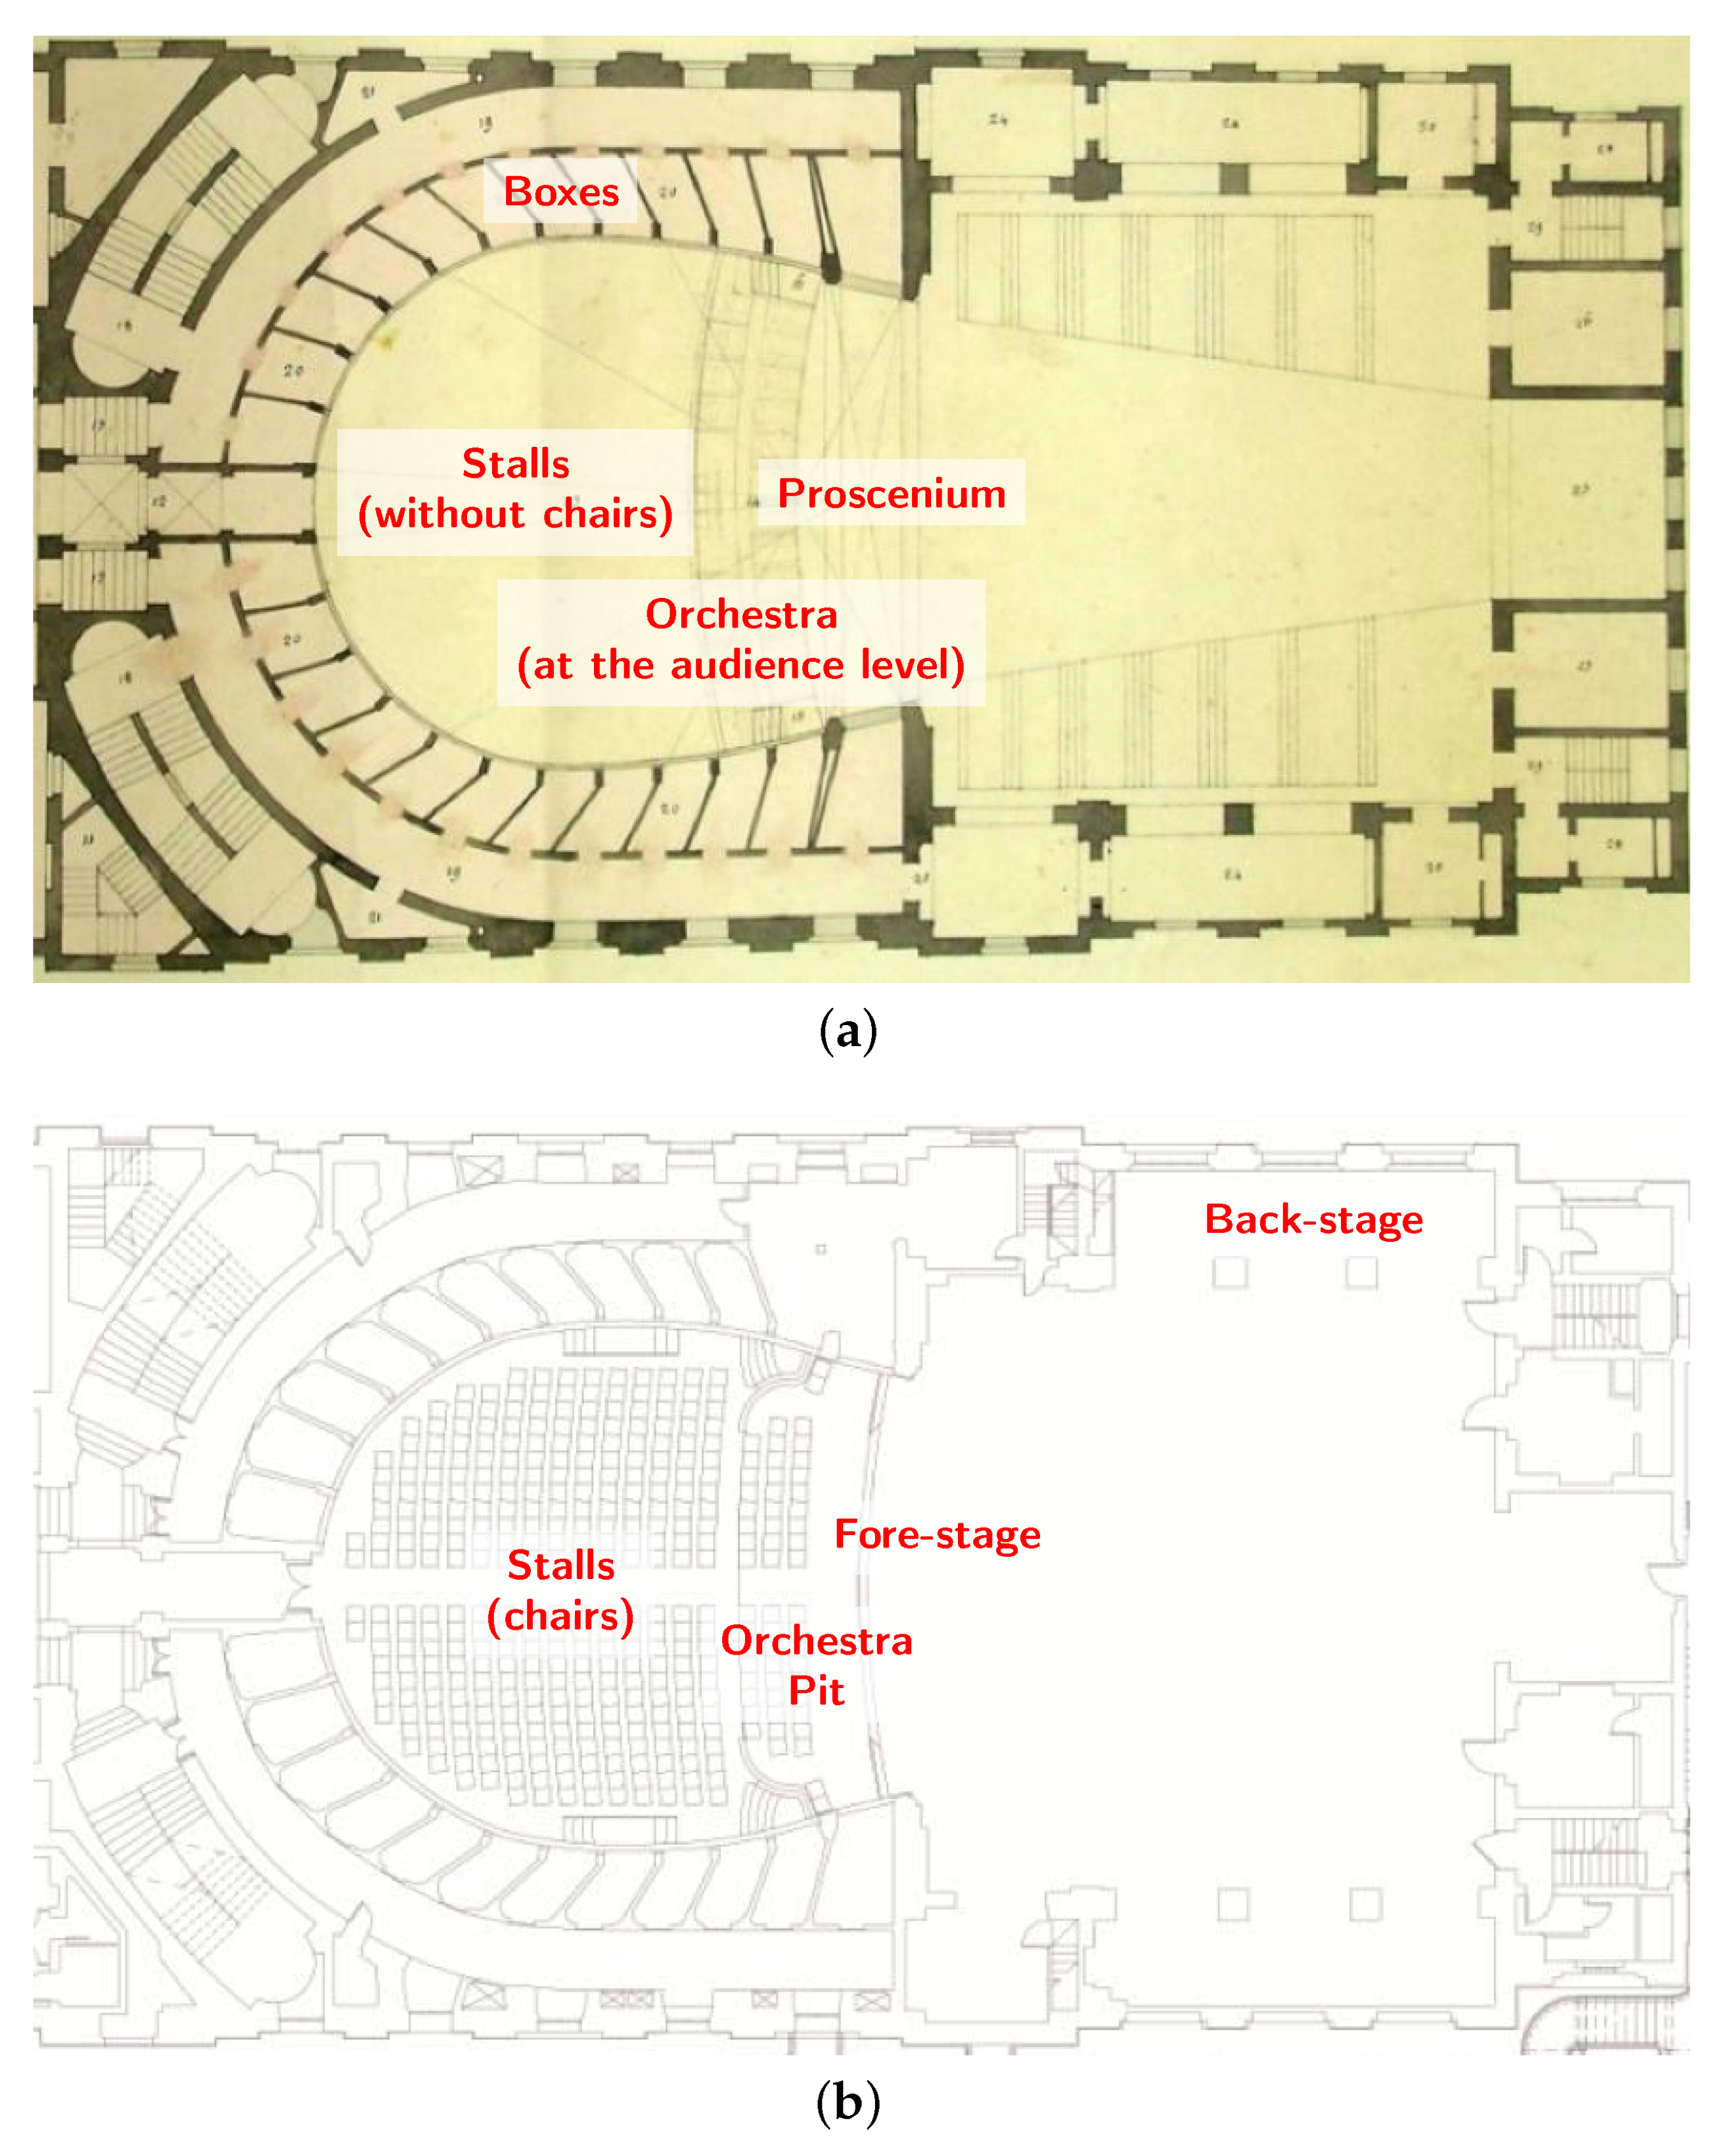
41]. In the 1840 design—in the following cited as the “original” one—the stage was protruded in the cavea (the so-called proscenium), to a corresponding surface until the line of the first boxes (see Figure 1). Furthermore, the orchestra was placed at the same level of the listeners in the stalls, corresponding to the second and the third row of chairs. The floor of the stalls, which was entirely made of pine wood, was supported with pine wooden truss holding up larch architraves and brick pillars. A river cobblestone was placed under the floor [42]. In 1928, the orchestra pit was built, cutting the proscenium. From 1959 to 1967, the theatre remained closed, in order to replace the wooden structures affected by termites: the original wooden structures were replaced by newer ones made by concrete and steel. The theatre reopened in 1967. The wooden stage was replaced a second time in 1970 [43]. In the summer of 2015, the wooden stage was renewed for a third time. The theatre is now used for opera and symphonic music by the resident “Luigi Cherubini” Young Orchestra, found and conducted by Riccardo Muti.

2.2. Measurements and Simulation Set-Up

On the basis of available plans and sections of the present state of the Alighieri Theatre, a geometrical acoustic model was set up for numerical simulation purposes. This model was calibrated according to the acoustic parameters extracted from the Room Impulse Responses (RIRs), which have been measured during the acoustic measurements in September 2014 and vibro-acoustic measurements on the stage in November 2014.
The workflow of acoustic measurements followed the ISO 3382-1 [14] recommendations. Three positions of sound sources were used in the stage (two) and inside the orchestra pit (one), following the recommendation of the Ferrara charter [13]. RIRs were measured for each sound source in each position of stalls, boxes and gallery, for a total amount of about 2500 measurements [10]. Exponential Sine Sweeps (ESS) were used as excitation signals through a custom high-SPL sound source [44]. The excitation signal was 128 K length with a sample rate of 48 kHz, allowing for measuring IRs that have enough signal-to-noise ratio in each octave band. A proprietary software was used in order to optimise the time-windowing of the ESS and, consequently, the frequency response of the measured impulse responses [45].

2.3. Assumptions and Numerical Calibration

In order to understand the acoustic improvements generated by the last renovations and to investigate the acoustic behavior of the original design—the one with the proscenium—a geometrical model of it was created for numerical simulation aims. In Table 3, geometrical data of both acoustic models are reported.
The acoustic simulations were provided by hybrid ray tracing software Odeon v.12 (Lyngby, Denmark). The software uses two different calculation methods for early and late reflections and it switches from one to the other according to the transition order (TO) that the user indicates. The early reflections calculation is carried out with the deterministic image source method, while the late reflections calculation is driven by the statistical ray tracing method. A transition order equal to 2 was used. The number of late rays used in the calculations was enough to allow an adequate accuracy, according to the investigation of the reflection density parameter that should be higher than at least 25 reflections/ms for reliable results [46]. A length of the simulated impulse response of 2500 ms was selected to be greater than the estimated reverberation time. The virtual sound source was placed on the fore-stage, at 1 m from the edge; in the original design model, the sound source was placed on the proscenium, at 1 m from the edge. Twelve virtual receivers were placed in the stalls, eight on two column boxes—two in each tier—and two in the gallery, as suggested by a Ferrara-charter [13].
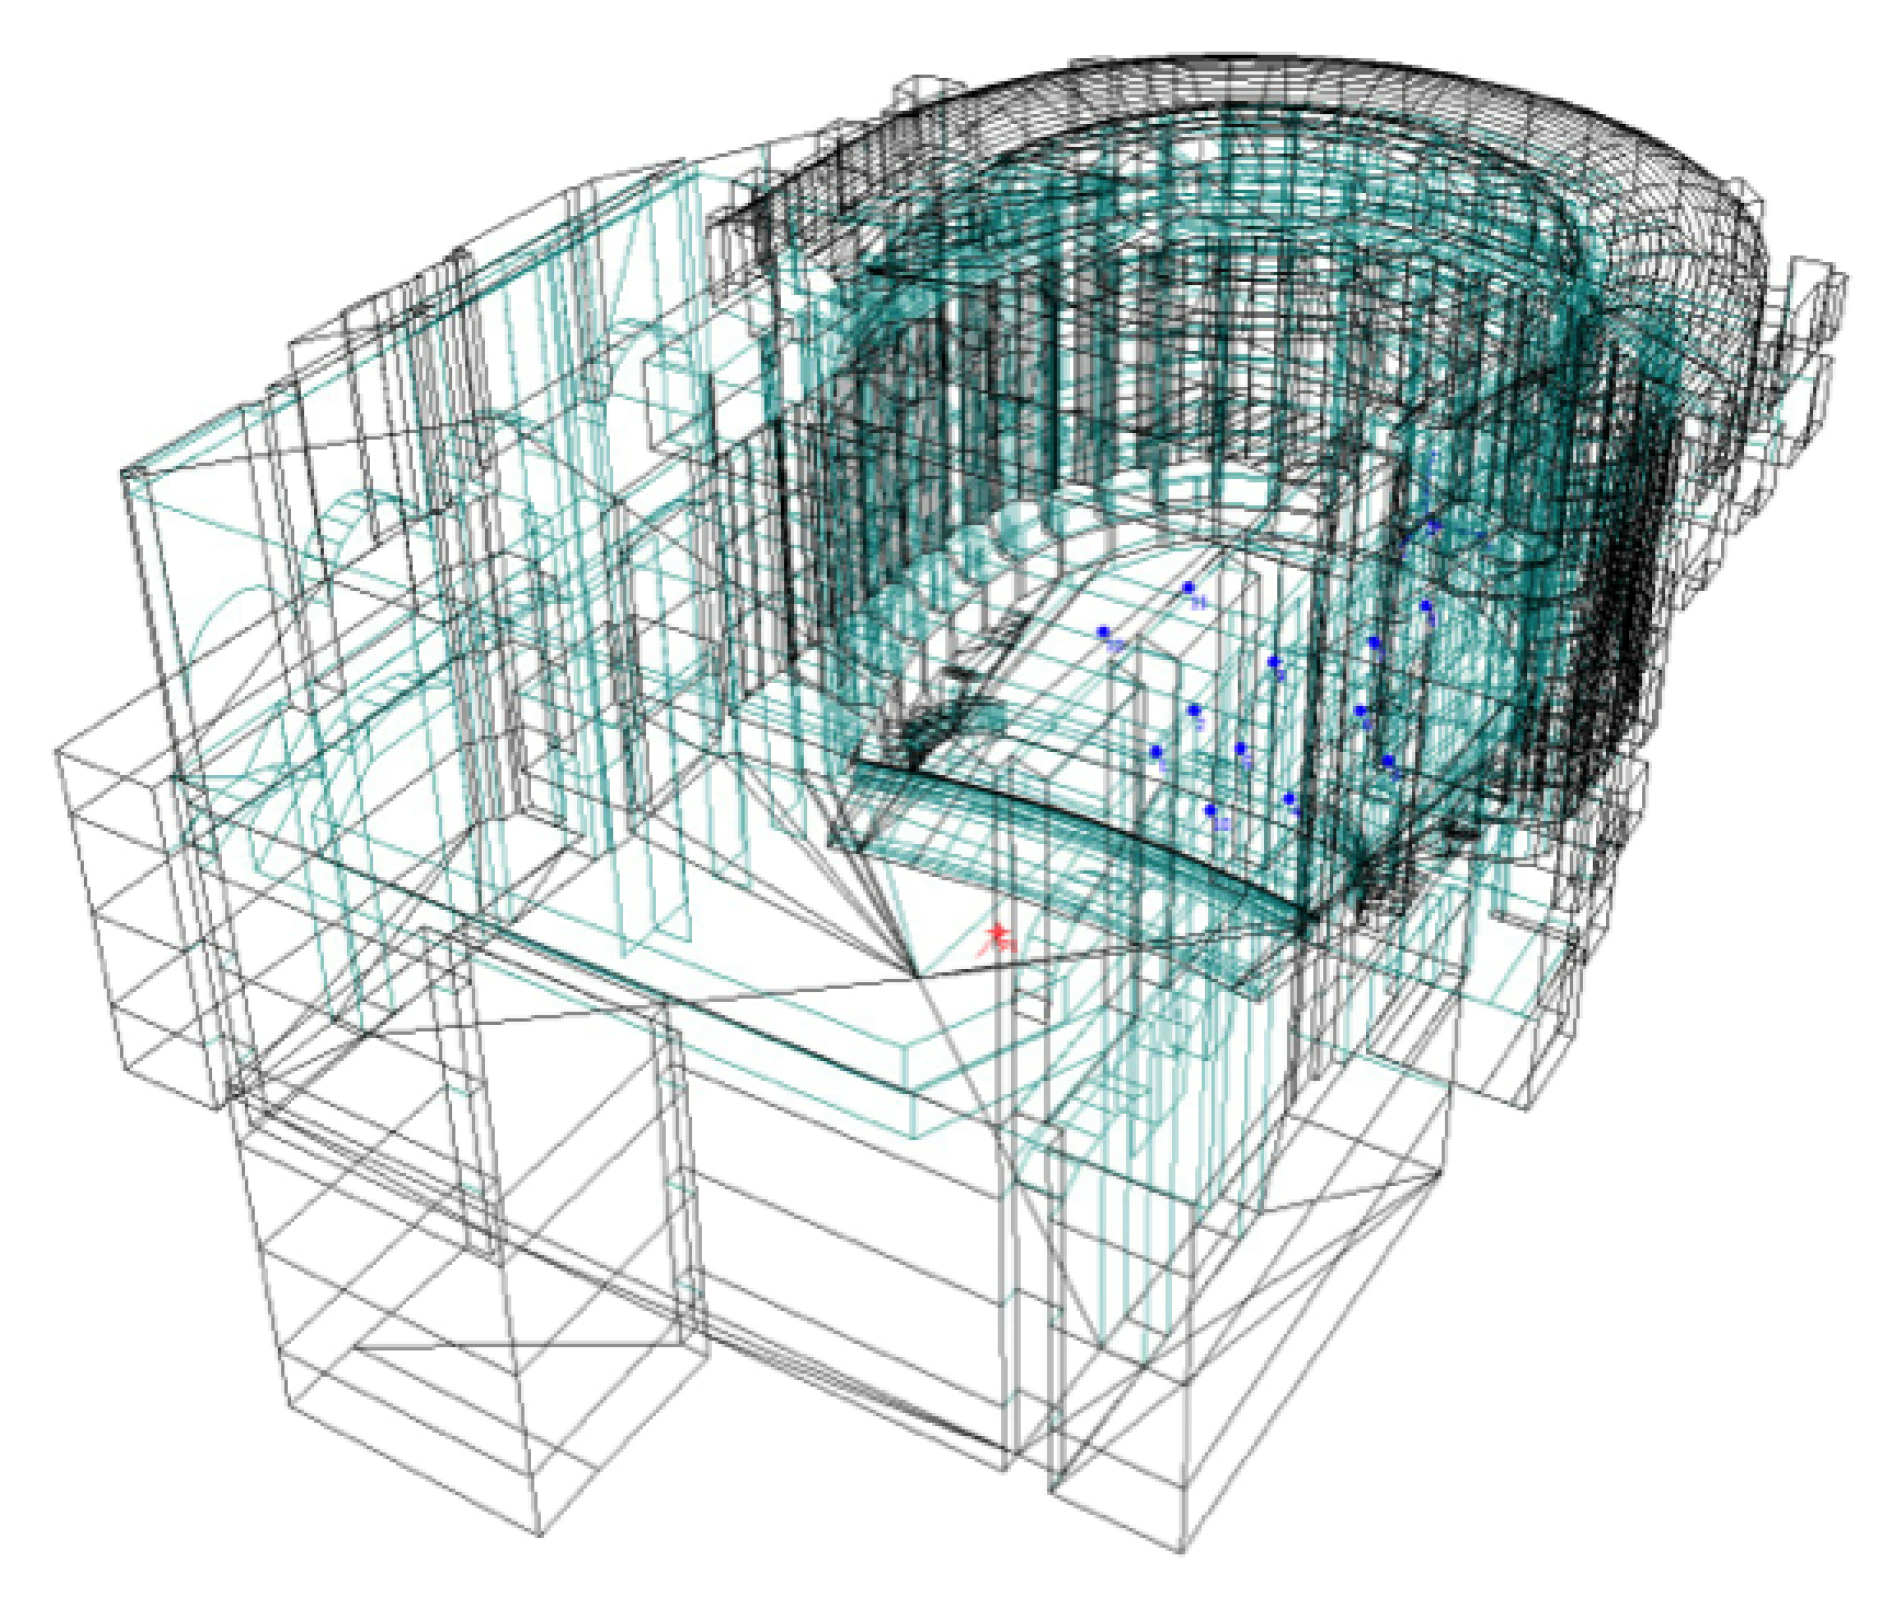
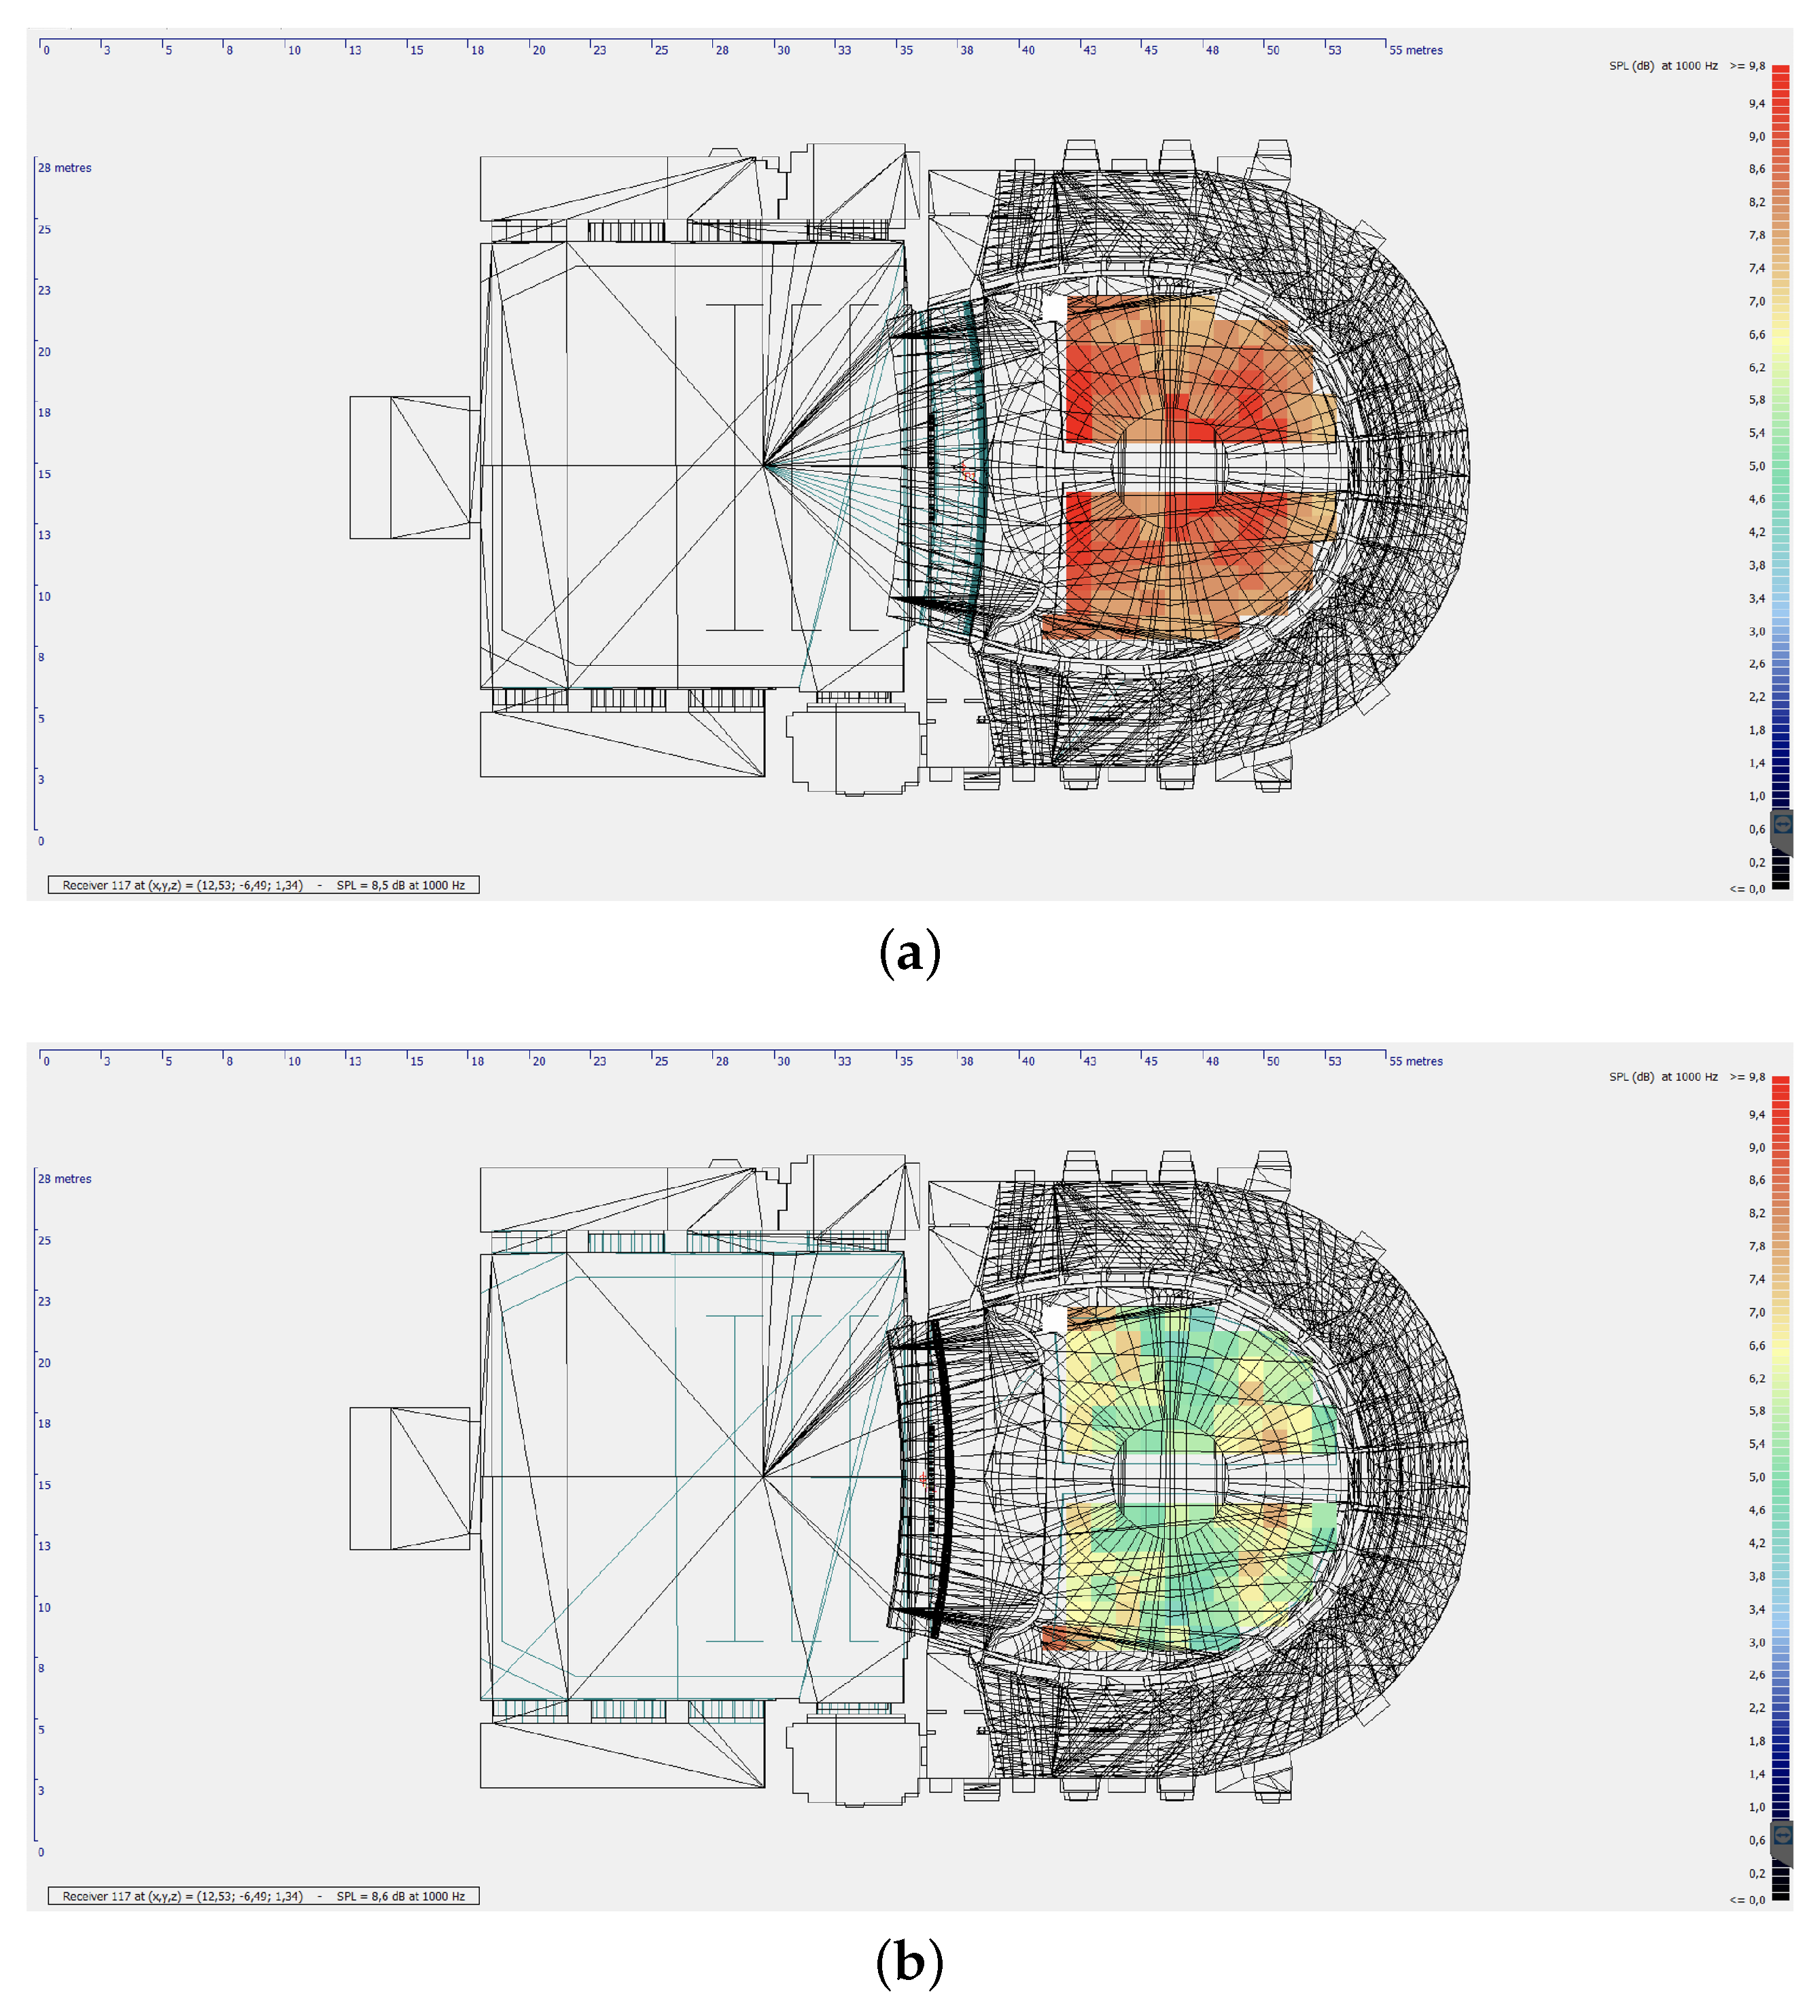
The model of the theatre (see Figure 2) was calibrated according to the acoustic measurements and the reliability of the calibration process was evaluated following simulation procedures based on the previous studies [29,47]. The calibration workflow mainly consisted of an iterative process which involved the acoustic material proprieties, as absorption and scattering coefficients, and thus the selection of these values is responsible for the reliability of the simulations. A data collection for credible values of absorption coefficients was carried out based on the scientific literature on this matter, according to both the material typologies and historical context [48,49]. Some values were slightly adapted according to the specific case and conditions, e.g., elements which were simplified or even not modeled as the technical equipments in the fly tower. In fact, some values of absorption coefficients have been slightly modified in order to adapt them to the specific case of the theatre, while remaining within reasonable ranges considering comparable materials in the literature. Values of plaster inside the fly tower and hall results higher than the referenced ones due to the presence of furniture—as scenography furniture for the stage and general furniture for the hall—during the measurement session. The most significant adaption of values of absorption coefficients was done for the case of the boxes where the geometrical details as seats and objects inside were not modeled in order to avoid the increase of number of surfaces, which are not necessary for the simulation process [46]. In particular, the absorption and scattering coefficients assigned to the boxes are significantly high due to the lack of interior modeled surfaces. Considering the lack of complex small details in comparison to the main volumes, particular scattering proprieties were assigned to fix it. The scattering and absorption coefficients of all the materials involved in the geometric acoustic (GA) simulations are reported in Table 4.
The following acoustic parameters were considered in the calibration process: Early Decay Time E D T , Reverberation Time T 30 , Center Time t s and Clarity C 80 [
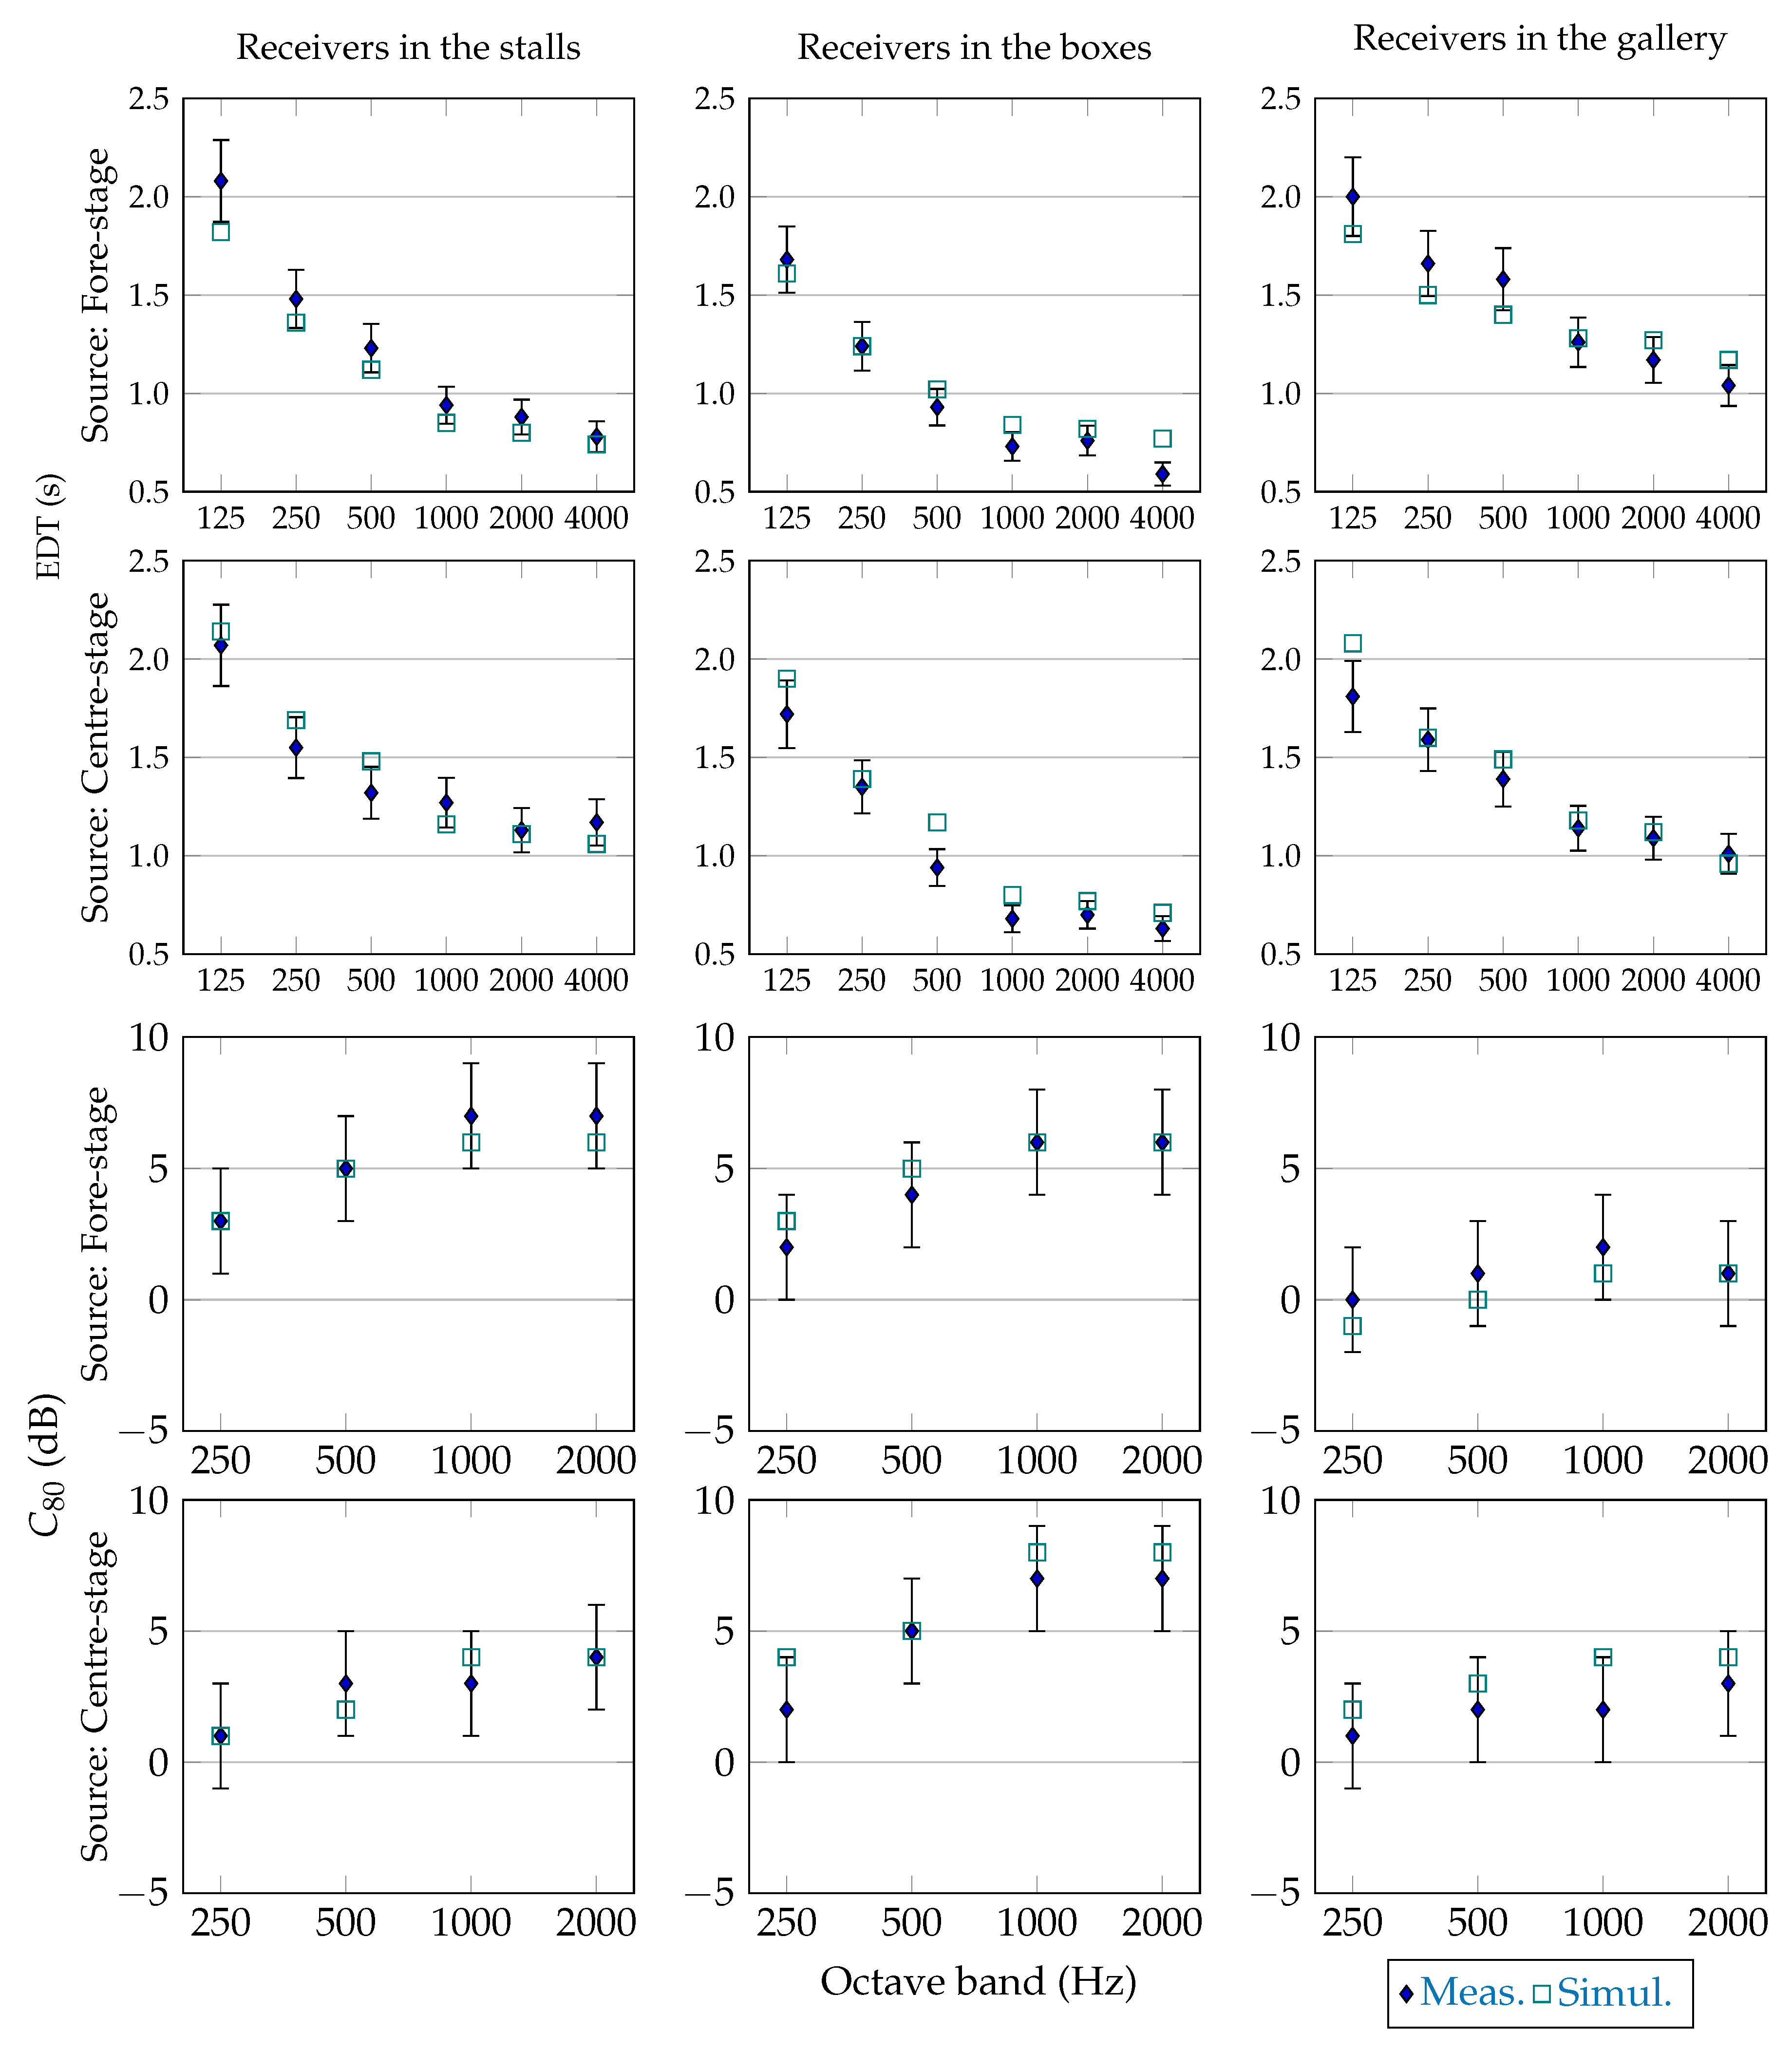
50]. Giving the couples of sound sources/receivers used in the calibration process, the work was completed once the difference between the measured values and the simulated one was less than twice Just Noticeable Differences (JNDs). For sake of brevity, the calibration results are reported in Figure 3, where E D T and C 80 values were plotted—for each octave band—showing for sound source the averaged values over three groups of receivers—respectively, stalls, boxes, and gallery.

2.4. Vibroacoustic Measurements of the Historical Wooden Stage

A crucial aspect of the work concerns the stage. In an HOH, the stage was typically made of light wooden fir, in order to fix the scenes during operas. Any acoustic reason was taken into account by pre-Sabinian scholars regarding the stage design [18]. Previous works related to wooden stage-air cavity are purely numerical [51,52], or related to the fork-effect of cellos and double-bass only [53] or the early work of Beranek, which showed an increment of radiation in the 125 Hz octave band [54]. Instead, the present work needed vibro-acustic measurements for archeo-acoustical reasons. The question was: “Are the historical stage properties similar to the present ones?”.
In 2014, the direction of the Alighieri Theatre stated the renovation of the wood of the stage and the authors were asked to study the effects of wood aging on stage acoustics. The original stage was made of fir boards, arranged in square blocks, measuring 17.30 m by 17.30 m and sloping “nel rapporto di vent’uno di base per uno di altezza” (the ratio is 21/1 in height, corresponding to a slope of 2.6 degrees). Samples of not-aged and two-year aged firs were analyzed in a laboratory and compared with a historical sample of the stage.
A set of measurements was carried out in the laboratory to determine several relevant parameters related to the acoustical quality of the wood. In particular, density, wave propagation speed and elastic modulus have been measured and calculated. Furthermore, considering these characteristics, it is possible to define other quantities useful to compare the acoustical properties of different materials: the quasi-longitudinal wave speed in beams, the characteristic impedance, the sound radiation coefficient and the loss factor were determined for three specimens. In order to compare the measured and the predicted data, propagation velocities and elastic modulus were measured in all of the directions, by using mechanical impulses and accelerometers: the equipment included a signal conditioner Brüel and Kjær NEXUS, two Piezoelectric charge accelerometer Brüel and Kjær 4371V, an instrumented impact hammer APTech AU02 (Bombay, India) and a calibrator Brüel and Kjær 4294. 
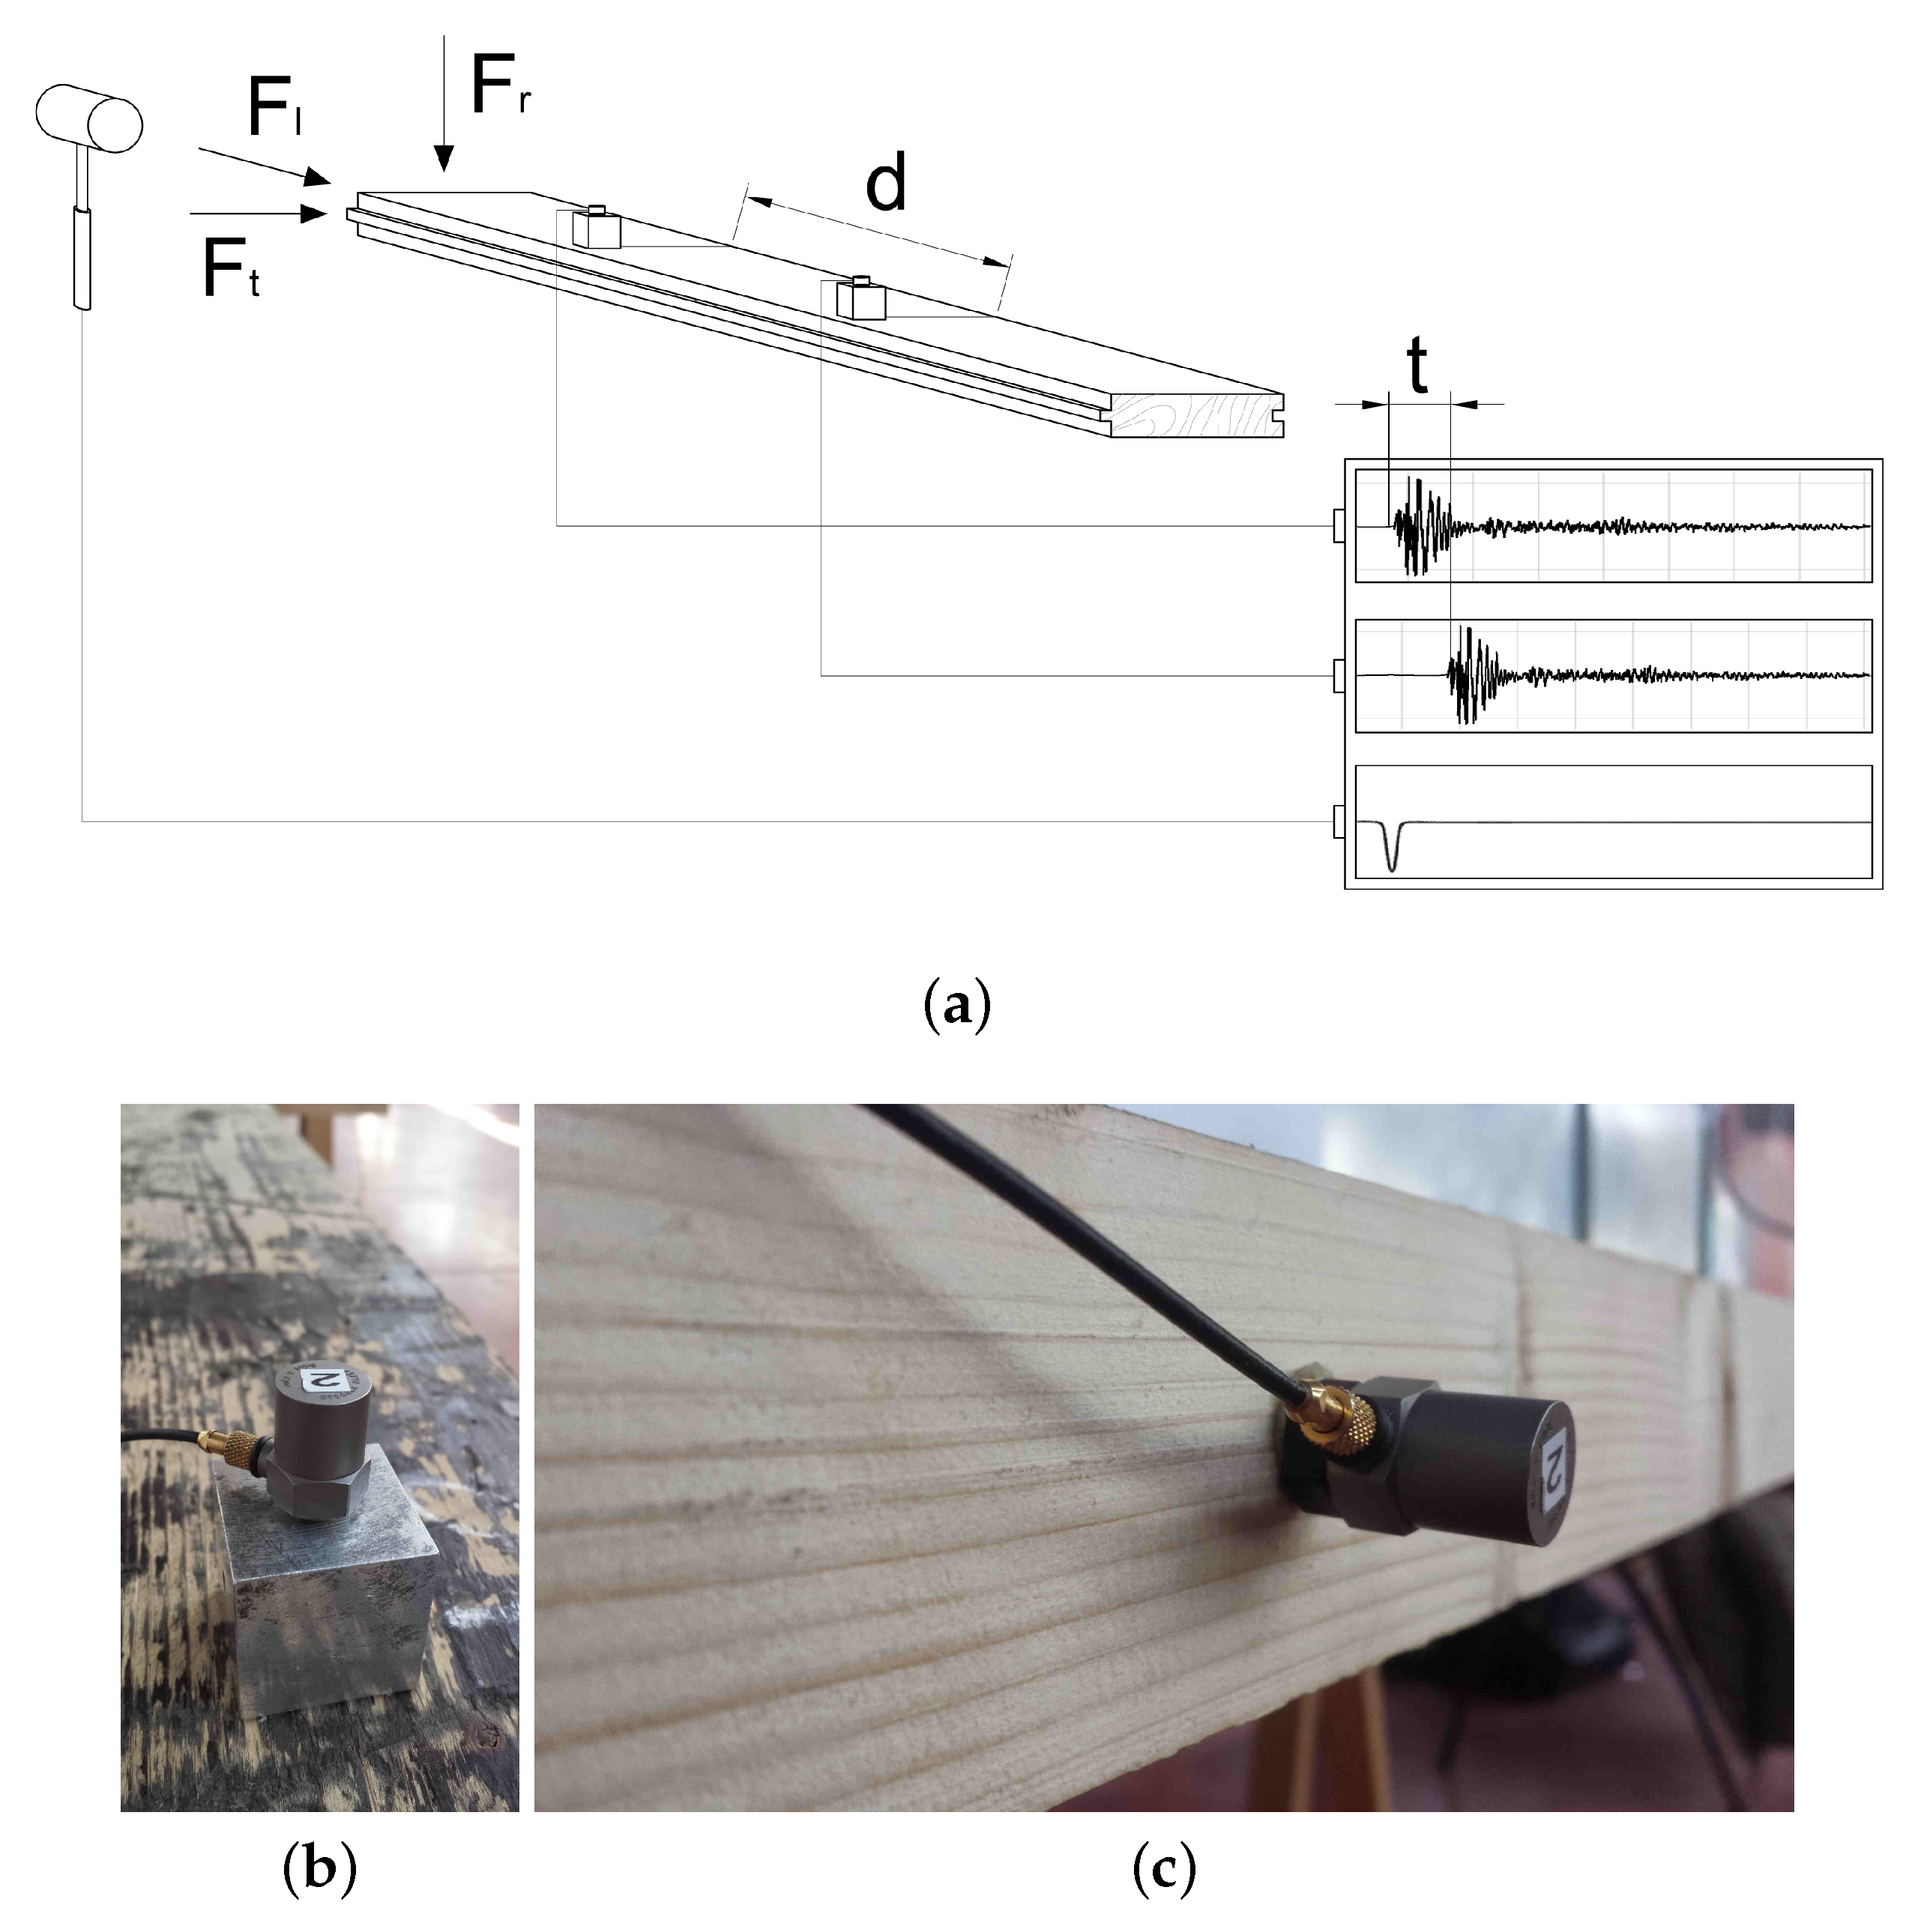
Figure 4 shows how the measurements were performed on the samples: two accelerometers were fixed at a reference distance d and impulses were generated with an impact hammer along the longitudinal axis ( F y ), the tangential axis ( F x ) and the radial axis ( F z ). The signal acquired from the accelerometers and the impact hammer were therefore analyzed in order to calculate the wave propagation speed considering the time delay from the two signals. A Matlab code (The MathWorks, Boston, MA, USA) was then created to calculate the wave speed c l y in the longitudinal direction with the impulse generated in the longitudinal direction. Similarly, the quasi-longitudinal wave speed c l x in the tangential direction with the impulse generated in the tangential direction was determined. The values of the different wave speeds obtained with the method described are summarized in Table 5.
The wave propagation speed along different axes was measured in order to compare the three samples’ characteristics. With the obtained values, it was possible to determine the dynamic elastic modulus E from Equation (1), the characteristic impedance z and the sound radiation coefficient R from Equations (2) and (3), respectively. The sound velocity is defined as the root square of the ratio between elastic modulus E and density ρ :
c = E / ρ ( m / s ) .
The characteristic impedance is defined as a product of sound velocity c and density ρ :
z = ρ c ( k g / ( m 2 s ) )
and, finally, the radiation coefficient R is defined as the square root of ration between the elastic modulus E and cubic density ρ 3 :
R = E / ρ 3 ( m 4 / ( k g s ) ) .
These quantities allowed for analyzing the acoustic properties of the different samples and comparing them with the ones found in other studies. From these values, it is possible to calculate the elastic modulus in longitudinal and tangential directions, respectively E l and E t [55]:
E l = ρ c l 2 ( G P a ) ,
E t = E l c t c l 2 ( G P a ) .
See Table 5 for the values measured in the specimens. The main result is that the radiation properties of the two-year aged specimen were quite similar to the historical one, in the first approximation of the used model.
Moreover, vibration measurements were carried out on the stage of the Alighieri Theatre in November 2014, see Figure 5. Using the instrumented hammer as the source, impulse responses were recorded by accelerometers. Then, the measured impulse responses were evaluated two at a time, taking into account the disposition and the distance. The velocities extracted were statistically analyzed through histograms of occurrences: only the measurements with the receivers aligned are plotted in Figure 5c. The mean value of the measured velocities on the stage is about 770 m/s and this value is comparable with the laboratory measurement value of 800 m/s, done for historical fir in Table 5.
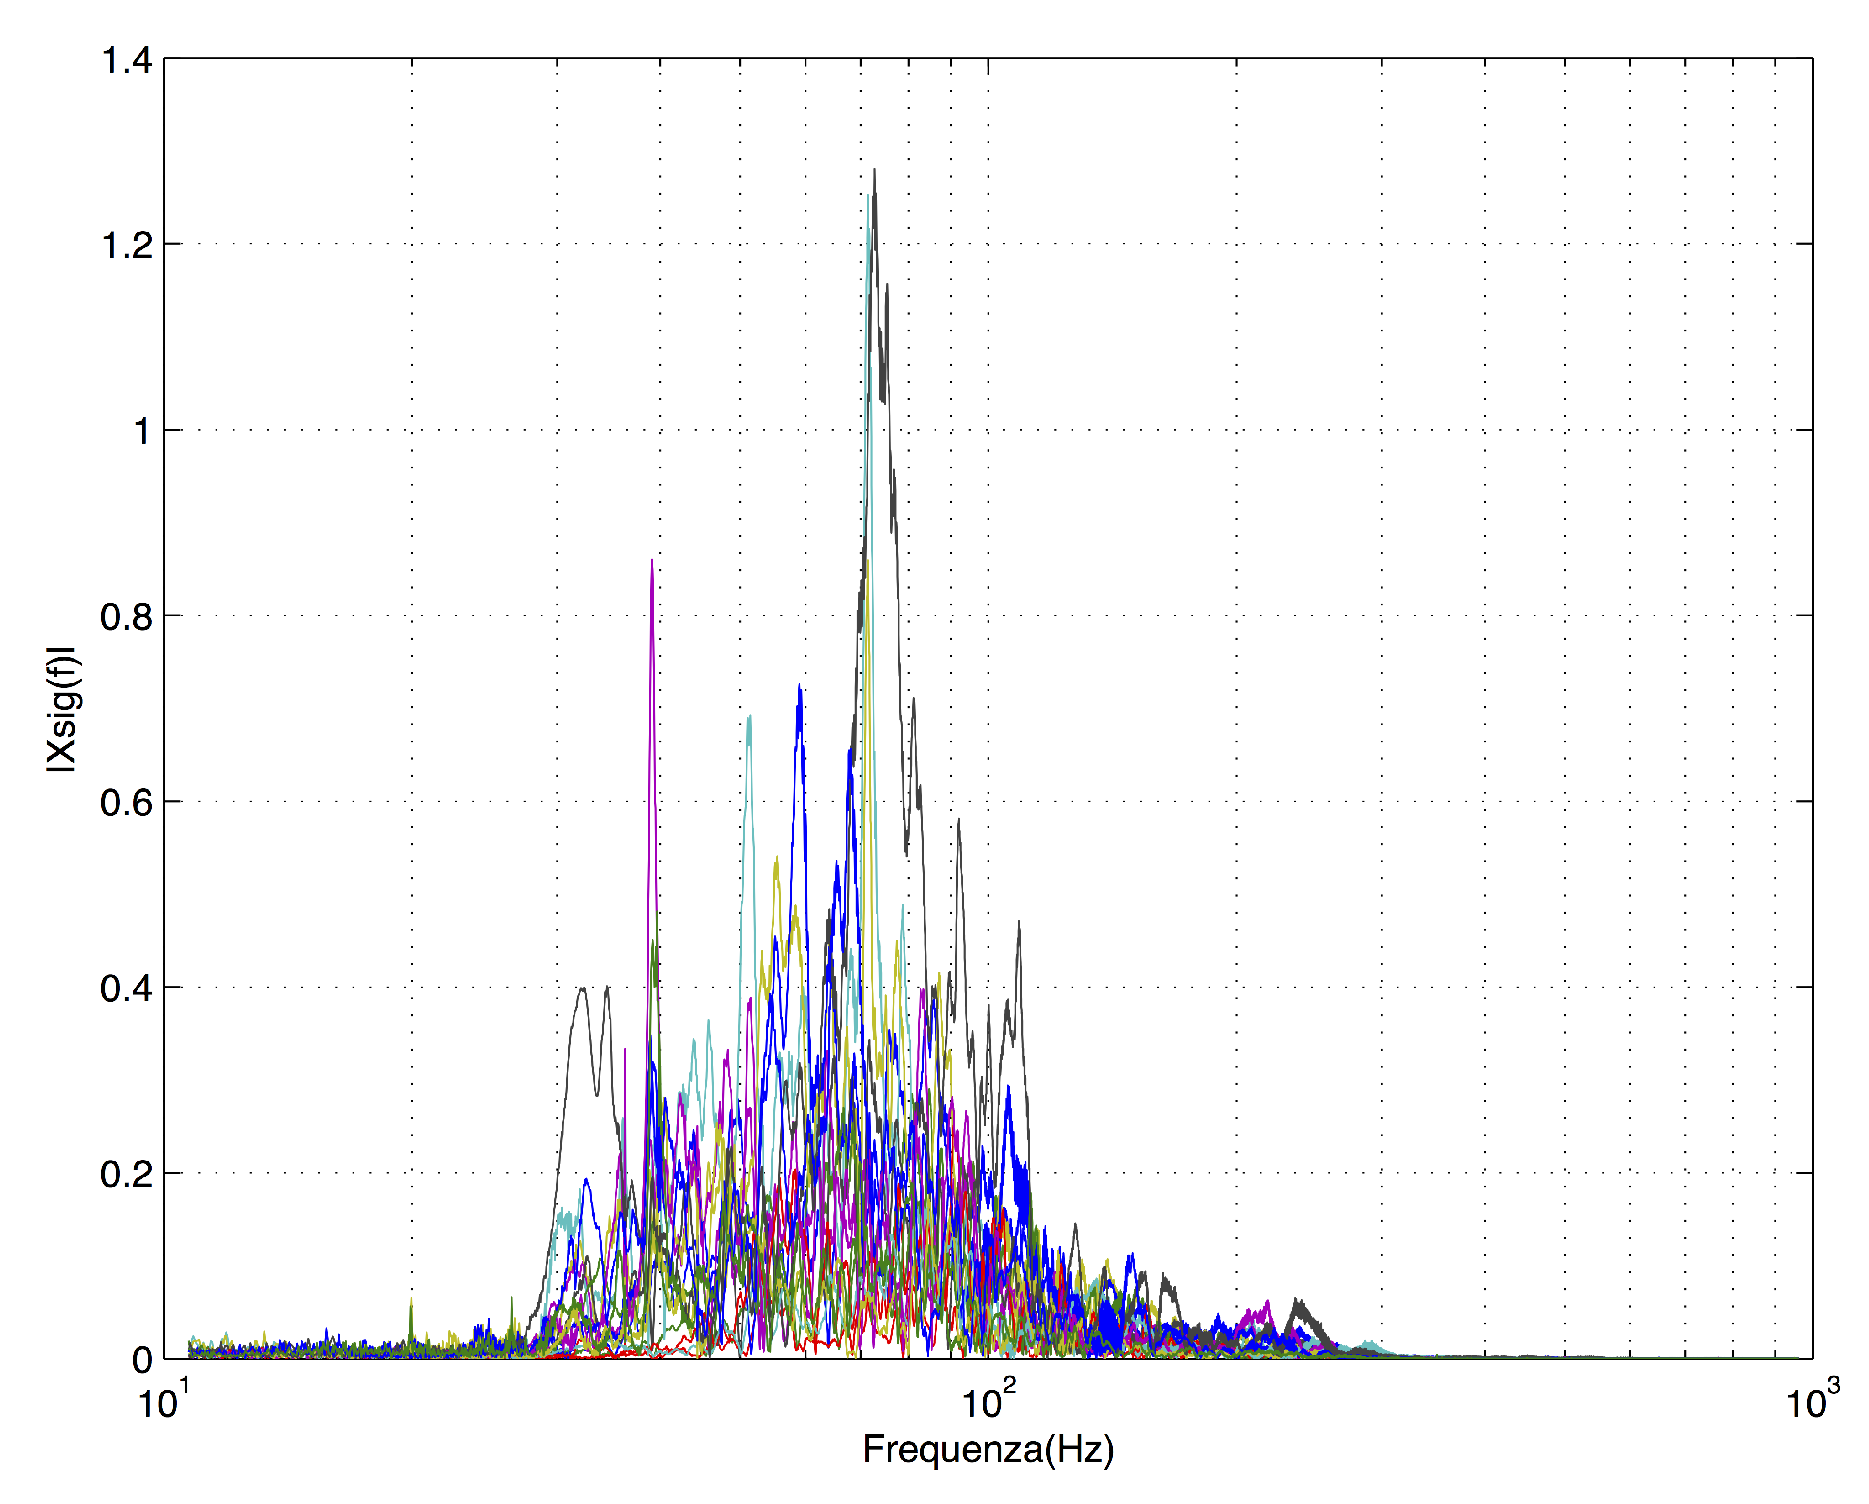
The in situ measured vibro-acoustic impulse responses were also analysed in frequency. Figure 6 shows the amplitude of the modulus of the Fourier Transform of the measured velocities, which were normalised, with each curve plot a source–receiver couple. The maxima are in the range 70–100 Hz and this aspect was considered in the calibration process, by increasing the absorption of the wooden stage in the octave band of 125 Hz. Since the voice of a soloist shows a negligible contribution in this frequency range, the vibro-acoustic behaviour of the stage/proscenium may be considered negligible in all other aspects of the present study.
Finally, it is interesting to note that the acoustic properties of the two-year aged specimen are close to the ones of the historical specimen. It follows that only aged wooden boards should be used in the stage refurbishment; at the same time, the renewed stage can ’play’ like the former one, from a vibro-acoustic point of view. It should be noted that the present works concerned fir wood only, which is the most used wood essence for the stage.

3. Results and Discussion

Table 6 compares the results of simulations, averaged for each sound source over three groups of receivers: stalls, boxes and gallery. A sound source with omnidirectional directivity was used in the first part of the simulations, in which sound strength at mid frequencies G M and sound clarity C 50 , 3 values were simulated. A temporal threshold of 50 ms was used for sound clarity because of its meaning for HOH [56]. In the second part of the simulations, a directional sound source—corresponding to a “Soprano” directivity—was used in order to evaluate the speech transmission index STI.
With the proscenium (original design), the sound of soloist is louder; in fact, the sound strength at mid-frequencies of the original configuration is higher than the present one: 10 dB instead of 7.6 dB in the stalls, 2.5 dB instead of 1.5 dB in the boxes; values in the gallery are quite similar. It means that the proscenium influences the direct sound and, to a lesser extent, the early reflections. In fact, the differences in stalls are higher than the ones in boxes, whereas, in the gallery, the direct sound contribution is negligible and the difference is due to early reflections only [10]. Sound strength values in the stalls are plotted in Figure 7. It is interesting to note that sound clarity values span from −1.4 to 6 dB in the present configuration, whereas it is from −2.6 to 1.2 dB in the original design. On one hand, it means that now the intelligibility is higher than the one in the original design, which is also confirmed by STI simulations. On the other hand, the timbre of the voice in the original design seems to be more ’balanced’ in frequency than the present configuration. In an HOH, the sound clarity may mean, in first approximation, how the room can ’equalise’ the voice. In fact, if the C 50 value is high (e.g., 5–8 dB), the direct field is reinforced by the early reflections that have plenty of high frequencies, due to low absorption at high frequencies of the smooth wall surfaces surrounding the stalls, the ceiling and the proscenium arch. The voice timbre may be too ’brilliant’ but poor of ’body’. In other words, it can be full of harmonics in the formant region (the octave band of 4000 Hz) but poor of energy in the octave band of 250 Hz and below. Otherwise, if the C 50 value is close to 0 dB, the voice timbre can be appear to be more ’balanced’: the energy of early reflections is attenuated and the ’body’ of the voice is enhanced by the energy of the subsequent reverberation.
Furthermore, the analyses of spatial distribution of the sound strength in Figure 8 show further differences between the soloist on the proscenium of the original design, and the soloist in the fore-stage of the present layout. The Barron’s “revised theory” of the semi-reverberant sound field [57] gives a relationship between the expected sound strength value at distance r from the source, G ( r ) (in dB), the volume of the hall, V (in cubic metres) and the mean of the reverberation time measured in the hall, T (in seconds), as follows:
G ( r ) = 10 log 100 r 2 + 31 , 200 T V e 0.04 r / T ( dB ) .
In the original Barron’s work, the hall under study was the concert hall, without coupled volumes. In case of the opera house, there were several coupled volumes that should be taken into account: the volume of the main hall V h a l l , the volume fo the fly tower V f l y t o w e r and also the volume of the orchestra pit, the volume of the boxes, etc. Previous studies considered the volume of the hall only [11] or, more recently, the ’effective volume’ V , which was preliminary studied in the case of churches [58] and opera houses [59].
Considering the receiver in stalls only, the spatial distribution of sound energy in the original design shows values near the Barron’s Equation (6) with the effective volume V is equal to:
V = V h a l l .
When the sound source is placed on the fore-stage, the values—in the stalls—are closer to the lowest curve, in which Barron’s Equation (6) considered the effective volume equal to the whole volume of the opera house, i.e., the volume of the hall and the volume of the fly tower:
V = V h a l l + V f l y t o w e r .
These results are in agreement with the ones of a survey of over eleven HOHs [59]: when the sound source is on the proscenium, only the volume of the hall contributes to the reverberation; when the sound source is moved back, i.e., when the proscenium was ’cut’ from the stage, both the volume of the stage house and the volume of the hall may be taken into account, the weight of each depending on the sound source position between the two coupled volumes.
The sound strength of receivers in the boxes did not vary with the distance because of the ’dominant’ volume of the boxes. For the receivers in the boxes, the changes in sound strength values may depend on the distance only: higher values for the receiver in the central zones of the lower tiers of boxes, lower values for the receivers in the lateral zones of the highest tiers of boxes.
Figure 8 shows that, when the soloist was on the proscenium, the acoustics of the voice depended on the volume of the hall only. It follows that the audience felt a louder voice and a more balanced timbre.

4. Conclusions

In the early decades of the 20th Century, almost all the stages of the Italian theatres were modified in order to include an orchestra pit. The front of the stage, the so-called proscenium, was cut about 2–3 m, depending on the theatre. This fact drastically changed the acoustics of the theatre: the singers had to draw back from their position during the aria.
A virtual simulation of an HOH original configuration, the Alighieri Theatre in Ravenna, helps to quantify these differences. Acoustic measurements were done in the theatre and a simulation model was calibrated using room criteria extracted from these measurements. Another model of the theatre was simulated, including the proscenium and removing the orchestra pit. The analyses show that historical stage is quite similar to the two-year aged wood, so we can assume that the historical stage may be modeled as the present one, which was ’calibrated’ with the acoustic measurements in the theatre. Results show that the proscenium influences the loudness of the voice, increasing the sound strength and enhancing the tonal balance, while decreasing the sound clarity. Further developments of this approach may be extended to subjective analyses, e.g., by MIMO (Multiple-Input-Multiple-Output) auralisations, using instrumental directivity and multitrack anechoic recordings [60].

Author Contributions

Conceptualization and methodology, D.D., M.G.; Investigation, D.D., Simulation, A.R.; Writing—Original Draft, D.D. and A.R.; Revision, D.D., A.R. and M.G.

Funding

This research received no external funding.

Acknowledgments

The authors would like to thank Antonio De Rosa, Davide Mazzavillani and the technical staff of the Alighieri Theatre.

Conflicts of Interest

The authors declare no conflict of interest.

References and Note

  1. Vecco, M. A definition of Cultural Heritage: From the tangible to the intangible. J. Cult. Herit. 2010, 11, 321–324. [Google Scholar] [CrossRef]
  2. Đórđévić, Z. Intangible tangibility: Acoustical heritage in architecture. Struct. Integr. Life 2016, 16, 59–66. [Google Scholar]
  3. Fausti, P.; Pompoli, R.; Prodi, N. Acoustics of opera houses: A cultural heritage. J. Acoust. Soc. Am. 1999, 105, 929. [Google Scholar] [CrossRef]
  4. Tronchin, L.; Farina, A. Acoustics of the Former Teatro—La Fenice—In Venice. J. Audio Eng. Soc. 1997, 45, 1051–1062. [Google Scholar]
  5. Iannace, G.; Ianniello, C.; Maffei, L.; Romano, R. Objective measurement of the listening condition in the old Italian opera house “Teatro di San Carlo”. J. Sound Vib. 2000, 232, 239–249. [Google Scholar] [CrossRef]
  6. Farina, A. Acoustic quality of theatres: Correlations between experimental measures and subjective evaluations. Appl. Acoust. 2001, 62, 899–916. [Google Scholar] [CrossRef]
  7. Cammarata, G.; Fichera, A.; Pagano, A.; Rizzo, G. Acoustical prediction in some Italian theatres. Acoust. Res. Lett. Online 2001, 2, 61–66. [Google Scholar] [CrossRef]
  8. Astolfi, A.; Bortolotto, A.; Filippi, A.; Masoero, M.; Pisani, R. Acoustical characterisation of small Italian opera house. In Proceedings of the Forum Acusticum, Budapest, Hungary, 29 August–2 September 2005; pp. 2301–2306. [Google Scholar]
  9. Pompoli, R. (Ed.) Proc. Teatri d’Opera dell’Unità d’Italia (Proceedings Opera houses of the Italian Unification); Acoustical Society of Italy (AIA): Venezia, Italy, 2011. (In Italian) [Google Scholar]
  10. Garai, M.; Morandi, F.; D’Orazio, D.; De Cesaris, S.; Loreti, L. Acoustic measurements in eleven Italian opera houses: Correlations between room criteria and considerations on the local evolution of a typology. Build. Environ. 2015, 94, 900–912. [Google Scholar] [CrossRef]
  11. Prodi, L.; Pompoli, R.; Martellotta, F.; Sato, S. Acoustics of Italian Historical Opera Houses. J. Acoust. Soc. Am. 2015, 138, 769–781. [Google Scholar] [CrossRef]
  12. Weinzierl, S.; Sanvito, P.; Schultz, F.; Büttner, C. The acoustics of renaissance theatres in Italy. Acta Acust. 2015, 101, 632–641. [Google Scholar] [CrossRef]
  13. Pompoli, R.; Prodi, N. Guidelines for acoustical measurements inside historical opera houses: Procedures and validation. J. Sound Vib. 2000, 232, 281–301. [Google Scholar] [CrossRef]
  14. ISO 3382-1: Acoustics—Measurement of Room Acoustic Parameters. Part 1: Performance Spaces; ISO: Geneva, Switzerland, 2009.
  15. Pisani, R.; Duretto, F. Il restauro ed i problemi di acustica dei teatri storici (The restoration and the acoustics problems in historical theatres). In Proceedings of the XXVII National Conference of the Italian Acoustics Association (AIA), Genova, Italy, 26–28 May 1999. [Google Scholar]
  16. Prodi, N.; Pompoli, R. Acoustics in the restoration of Italian historical opera houses: A review. J. Cult. Herit. 2016, 21, 915–921. [Google Scholar] [CrossRef]
  17. Prodi, N. From Tangible to Intangible Heritage inside Italian Historical Opera Houses. Heritage 2019, 2, 826–835. [Google Scholar] [CrossRef] [Green Version]
  18. D’Orazio, D.; Nannini, S. Towards Italian Opera Houses: A Review of Acoustic Design in Pre-Sabine Scholars. Acoustics 2019, 1, 252–280. [Google Scholar] [CrossRef] [Green Version]
  19. Wagner, R. The Opera House at Bayreuth. In Selected from His Writings and Translated; Wagner, R., Ed.; H. Holt and Company: New York, NY, USA, 1875; pp. 255–288. [Google Scholar]
  20. Ledoux, C.N. Architecture Considérée Sous le Rapport de l’Art des Moeurs et de la Législation; Porroneau: Paris, France, 1804. [Google Scholar]
  21. Carnegy, P. Wagner and the Art of the Theatre; Yale University Press: New Haven, CT, USA, 2006. [Google Scholar]
  22. Müller, K. Die Demokratisierung der Akustik (The democratization of acoustics). In Das Richard Wagner Festspielhaus Bayreuth; Kiesel, M., Ed.; Nettpress: Düsseldorf, Germany, 2007; pp. 174–197. [Google Scholar]
  23. Stefani, D. L’orchestra del Teatro alla Scala nella prima metá dell’800 Organizzazione, Funzioni, Gerarchie. Ph.D. Thesis, Politecnico di Milano, Milan, Italy, 2015. [Google Scholar]
  24. Lautenbach, M.R.; Vercammen, M.L.S.; Lorenz-Kierakiewitz, K.H. Acoustic Aspects of Stage and Orchestra Pit in Opera Houses. In Proceedings of the 38th German Acoustical Society (DAGA), Darmstadt, Germany, 19–20 March 2012. [Google Scholar]
  25. Vercammen, M.L.S.; Lautenbach, M.R. Stage and Pit Acoustics in Opera Houses. In Proceedings of the International Symposium on Music and Room Acoustics (ISMRA), La Plata, Argentine, 11–13 September 2016. [Google Scholar]
  26. Disposizione scenica per l’opera “Otello”, dramma lirico in quattro atti, versi di Arrigo Boito, musica di Giuseppe Verdi, compilata e regolata secondo la messa in scena del Teatro alla Scala Milano, Ricordi, 1887. (In Italian)
  27. Reggiani, L. Il Teatro Alighieri di Ravenna: Rilevazioni Acustiche e Modelli Numerici per la Conservazione, la Ricerca Musicologica e l’Auralizzazione di Futuri Allestimenti. Master’s Thesis, University of Bologna, Bologna, Italy, 2011. [Google Scholar]
  28. Rinaldi, M. Vibro-Acoustic Measurements of Wooden Stages in Historical Italian Theatres. Master’s Thesis, University of Bologna, Bologna, Italy, 2015. [Google Scholar]
  29. Vorländer, M. Computer simulations in room acoustics: Concepts and uncertainties. J. Acoust. Soc. Am. 2013, 133, 1203–1213. [Google Scholar] [CrossRef] [PubMed]
  30. Vissilantonopoulos, S.; Mourjopoulos, J. Virtual acoustic reconstruction of ritual and public spaces of ancient Greece. Acta Acust. United Acust. 2001, 87, 604–609. [Google Scholar]
  31. Katz, B.F.G.; Wetherill, E. Fogg art museum lecture room: A calibrated recreation of the birthplace of room acoustics. In Proceedings of the Forum Acusticum, Budapest, Hungary, 29 August–2 September 2005. [Google Scholar]
  32. Weinzierl, S.; Rosenheinrich, H.; Blickensdorff, J.; Horn, M.; Lindau, A. The acoustics of the concert hall in Leipzig’s Gewandhaus. History, reconstruction and auralization. In Proceedings of the Fortschritte des Akustik, Berlin, Germany, 15–18 September 2010. [Google Scholar]
  33. Takala, J.; Kylliïnen, M. Comparison of modelled performance of a vanished building with historical information on its acoustics. In Proceedings of the Forum Acusticum, Krakow, Poland, 7–12 September 2014. [Google Scholar]
  34. Sü Gül, Z.; Xiang, N.; Çaliskan, M. Investigations on sound energy decays and flows in a monumental mosque. J. Acoust. Soc. Am. 2016, 140, 344–355. [Google Scholar] [CrossRef]
  35. Sender, M.; Planells, R.; Perello, R.; Segura, J.; Gimenez, A. Virtual acoustic reconstruction of a lost church: Application to an Order of Saint Jerome monastery in Alzira, Spain. J. Build. Perf. Simul. 2017, 11, 369–390. [Google Scholar] [CrossRef]
  36. Suárez, R.; Alonso, A.; Sendra, J.J.A. Virtual acoustic environment reconstruction of the hypostyle mosque of Cordoba. Appl. Acoust. 2018, 140, 214–224. [Google Scholar] [CrossRef]
  37. D’Orazio, D.; De Cesaris, S.; Morandi, F.; Garai, M. The aesthetics of the Bayreuth Festspielhaus explained by means of acoustic measurements and simulations. J. Cult. Herit. 2018, 34, 151–158. [Google Scholar] [CrossRef]
  38. Bo, E.; Shtrepi, L.; Pelegrin Garcia, D.; Barbato, G.; Aletta, F.; Astolfi, A. The accuracy of predicted acoustical parameters in ancient open-air theaters: A case study in Syrscusae. Appl. Sci. 2018, 8, 1393. [Google Scholar] [CrossRef]
  39. Postma, B.N.J.; Dubouilh, S.; Katz, B.F.G. An archeoacoustic study of the history of the Palais du Trocadero. J. Acoust. Soc. Am. 2019, 145, 2810–2821. [Google Scholar] [CrossRef] [PubMed]
  40. Đórđévić, Z.; Novković, D.; Andrić, U. Archaeoacoustic Examination of Lazarica Church. Acoustics 2019, 1, 423–438. [Google Scholar] [CrossRef] [Green Version]
  41. Meduna, T.; Meduna, G. Il Teatro La Fenice in Venezia… (On the La Fenice Theatre…); Antonelli: Venezia, Italy, 1849. (In Italian) [Google Scholar]
  42. Cocchi, A.; Garai, M.; Tronchin, L. Influenza di cavità risonanti poste sotto la fossa orchestrale: Il caso del teatro Alighieri di Ravenna (The Influence of Resonating Cavities under the Orchestra Pit: The Case of the Alighieri Theatre in Ravenna); Nardini Editore: Firenze, Italy, 1997; pp. 135–153. (In Italian) [Google Scholar]
  43. Sarasini, F. Il teatro Alighieri di Ravenna. Storia e restauri dalla fondazione ad oggi. Ravenna Studi e Ricerche 2005, 12, 165–199. (In Italian) [Google Scholar]
  44. D’Orazio, D.; De Cesaris, S.; Guidorzi, P.; Barbaresi, L.; Garai, M.; Magalotti, R. Room acoustic measurements using a high SPL. In Proceedings of the 140th Audio Engineering Society Convention (AES), Paris, France, 4–7 June 2016. [Google Scholar]
  45. Guidorzi, P.; Barbaresi, L.; D’Orazio, D.; Garai, M. Impulse responses measured with MLS or Swept–Sine signals applied to architectural acoustics: An in-depth analysis of the two methods and some case studies of measurements inside theaters. Energy Procedia 2015, 78, 1611–1616. [Google Scholar] [CrossRef]
  46. Christensen, C.L.; Koutsouris, G.; Gil, G. ODEON Room Acoustics Software, Version 12, User Manual; ODEON A/S: Lyngby, Denmark, 2013. [Google Scholar]
  47. Postma, B.N.J.; Katz, B.F.G. Perceptive and objective evaluation of calibrated room acoustic simulation auralizations. J. Acoust. Soc. Am. 2016, 140, 4326–4337. [Google Scholar] [CrossRef] [PubMed]
  48. Vorländer, M. Auralization: Fundamentals of Acoustics, Modelling, Simulation, Algorithms and Acoustic Virtual Reality; Springer Science & Business Media: Berlin/Heidelberg, Germany, 2007. [Google Scholar]
  49. Cox, T.J.; D’Antonio, P. Acoustic Absorbers and Diffusers: Theory, Design and Application, 3rd ed.; CRC Press: Boca Raton, FL, USA, 2004. [Google Scholar]
  50. Koutsouris, G.; Norgaard, A.K.; Christensen, C.L. Discretisation of curved surfaces and choice of simulation parameters in acoustic modeling of religious spaces. In Proceedings of the 23rd International Congress on Sound and Vibration (ICSV), Athens, Greece, 10–14 July 2016. [Google Scholar]
  51. Nakanishi, S.; Sakagami, K.; Daido, M.; Morimoto, M. Acoustic properties of a cavity backed stage floor: A theoretical model. Appl. Acoust. 1999, 57, 17–27. [Google Scholar] [CrossRef]
  52. Augusztinovicz, F. Vibroacoustic analysis of the stage floor of a concert hall—A case study. Appl. Acoust. 2012, 73, 648–658. [Google Scholar] [CrossRef]
  53. Guettler, K.; Askenfelt, A.; Buen, A. Double basses on the stage floor: Tuning fork-tabletop effect, or not? J. Acoust. Soc. Am. 2012, 1, 795–806. [Google Scholar] [CrossRef] [PubMed]
  54. Beranek, L.; Johnson, F.R.; Shultz, T.J.; Walters, B.G. Acoustics of Philharmonic Hall, New York, during its first season. J. Acoust. Soc. Am. 1964, 36, 1247–1262. [Google Scholar] [CrossRef]
  55. Cremer, L.; Heckl, M.; Petersson, B.A.T. Structure-Borne Sound—Structural Vibrations and Sound Radiation at Audio Frequencies, 3rd ed.; Springer: Berlin/Heidelberg, Germany, 2005. [Google Scholar]
  56. De Cesaris, S.; Morandi, F.; Loreti, L.; D’Orazio, D.; Garai, M. Notes about the early to late transition in Italian theatres. In Proceedings of the 22nd International Congress on Sound and Vibration (ICSV), Florence, Italy, 12–16 June 2015. [Google Scholar]
  57. Barron, M.; Lee, L.J. Energy relations in concert auditoriums. J. Acoust. Soc. Am. 1988, 84, 618–628. [Google Scholar] [CrossRef]
  58. D’Orazio, D.; Fratoni, G.; Garai, M. Acoustics of a chamber hall inside a former church by means of sound energy distribution. Can. Acoust. 2017, 45, 7–16. [Google Scholar]
  59. Garai, M.; De Cesaris, S.; Morandi, F.; D’Orazio, D. Sound energy distribution energy distribution in Italian Historical Theatres. In Proceedings of the 22nd International Congress on Acoustics (ICA), Buenos Aires, Argentine, 5–9 September 2016. [Google Scholar]
  60. D’Orazio, D.; De Cesaris, S.; Garai, M. Recordings of Italian opera orchestra and soloists in a silent room. Proc. Mtgs. Acoust. 2016, 28, 015014. [Google Scholar]
Figure 1. Plans of Alighieri Theatre. Comparison between the original Meduna’s design (a) and the actual configuration (b). Focusing on the fore-stage, the proscenium of Meduna’s plan was replaced by an orchestra pit; on the back-stage, some fitting rooms were dismissed in order to enlarge the stage.
Acoustics 01 00041 g001
Figure 2. Wireframe of the theatre model. More details are provided in Table 3.
Acoustics 01 00041 g002
Figure 3. Calibration of Alighieri Theatre: comparison between the simulated values (Simul.) and the measured values (Meas.) of E D T and C 80 for two significant sound sources. The values are subdivided into the three categories (stalls, boxes and gallery) and averaged over the corresponding receivers. The error bars correspond to twice the Just Noticeable Difference (JND), which was assumed as 1 dB for C 80 and 5% of the measure value for E D T .
Acoustics 01 00041 g003
Figure 4. Procedure of laboratory vibro-acoustic measurements. Layout of the propagation velocity measurement (a). F l , F t e F r are, respectively, longitudinal, tangential and radial mechanical impulses, forced by an instrumental hammer; accelerometers placed on the historical beam (b) and not-aged beam (c).
Acoustics 01 00041 g004
Figure 5. Procedure of in situ vibro-acoustic measurements. Plan of the stage of the Alighieri Theatre (a). Details on the source and receiver positions (b). Statistics of the structural sound velocities (occurrences vs. velocities) were measured on the stage for couples of aligned sources-receivers only (c).
Acoustics 01 00041 g005
Figure 6. Frequency responses of the Alighieri Theatre’s wooden stage, with each curve plot a source–receiver couple (see Figure 5b). Frequency on the abscissa axis (logarithmic scale), modulus of the Fourier Transform of the measured velocities on the ordinate axis (linear scale).
Acoustics 01 00041 g006
Figure 7. G values (in dB) at 1000 Hz simulated in the stalls with in the original (a) and in the present configuration of the theatre (b).
Acoustics 01 00041 g007
Figure 8. Simulated G M values, considering the present layout and the original design. Receivers in stalls (squares), in boxes (circles) and in the gallery (triangles). Simulated values are compared with two analytical prediction curves: Barron’s Equation (6) which takes into account the hall volume only V (see Equation (7)); Barron’s Equation (6), which takes into account the whole volume V (hall and fly-tower), see Equation (8).
Acoustics 01 00041 g008
Table 1. List of the musical terms in Italian used in this paper.
ariasolo vocal piece with instrumental accompaniment
librettotext written for and set to music in an opera
recitativostyle of delivery in which a singer is allowed to adopt the rhythms of ordinary speech
continuo(or bass continuo) a part for keyboard consisting of a succession of bass notes with figures that indicate the required chords
Table 2. Summary of the calibration method for several previous studies on virtual reconstruction for historic buildings that are no longer existing.
Room under StudyCalibration ReferenceCalibration Approach
Public/Ritual Spaces [30]Architectural drawingsCollected historical records.
Fogg Art Museum [31]impulse response measurement (1973) and reverberation time data (1912)Calibrated model using reverberation time data and photo, reconstruction former room states by modifying model and final comparison of original state to Sabine’s data.
Concert Hall, Gewandhaus [32]Historical reverberation time data (1933)Material properties based on detailed construction documentation, seating material determined from photo inspection, adjusted to reverberation time data.
Acheron Necromancy, Olympia echo hall, Temple of Zeus [30]Archival plansMaterial properties based on common materials of the time.
Finnish concert halls [33]Reviews of acoustical qualities (2014)Reproduce acoustical characteristics by adjusting material and scattering properties.
Súleymaniye Mosque [34]impulse response measurementCalibrated model based on the field test results.
Santa Maria de la Murta [35]Archival plans and imagesMaterial properties determined from historical images and similar studies.
Mosque, Cordoba [36]Previous studies and archival materialsCalibration based on the current model results.
Festspielhaus, Bayreuth [37]Archival plans and sectionsMaterial properties determined from historical images and similar studies.
Greek Theatre of Syracusae [38]Impulse response measurement and previous studiesMaterial properties based on detailed construction documentation and photo inspection.
Palais du Trocadero [39]Historical documentations and historical acoustic data (1911, 1906, 1907)Historic photos of the space, documents concerning the construction and design and acoustic data.
Lazarica Church [40]Impulse response measurementCalibrated model using on-site measurement results.
Present workOriginal plans and sectionsMaterial properties based on acoustic and vibro-acoustic measurements of the current status of the theatre.
Table 3. Geometrical data of the acoustic simulation models corresponding to the original and present configurations.
ConfigurationVolume (m 3 )Number of SurfacesNumber of Late Rays
Original10,455768010,584
Present10,455767610,564
Table 4. Absorption and scattering (s) coefficients for all the materials involved in the simulation. The scattering coefficient is referred to 707 Hz.
MaterialsSurface %AbsorptionsRef.
125 Hz250 Hz500 Hz1000 Hz2000 Hz4000 Hz
Marble10.020.020.030.050.050.050.05[48]
Plaster (Fly Tower)230.120.140.150.150.160.160.05adapted [49]
Plaster (Hall)160.080.100.100.100.100.070.05adapted [49]
Boxes330.200.220.300.330.330.330.50adapted [49]
Wood (Stage)100.180.120.100.090.080.070.05adapted [48]
Wood (Hall)30.040.040.070.060.060.070.05[48]
Stage grid40.150.150.250.400.500.500.20adapted [10]
Wings60.150.200.200.400.400.420.05adapted [48]
Velvet10.150.350.550.770.700.600.05adapted [49]
Wooden chairs10.120.110.100.090.080.070.70[48]
Seats20.400.550.700.800.800.700.70adapted [49]
Table 5. Results of laboratory measurements on three wood specimens. ρ is the density, measured by weighting each specimen; c l y is the quasi-longitudinal phase velocity measured in the y-direction; c l x is the quasi-longitudinal phase velocity measured in the x-direction; c b y is the bending phase velocity in the y-direction; c b x is the bending phase velocity measured in the x-direction; the elastic moduli in the longitudinal and tangential directions are, respectively, E l and E t , done by Equations (4) and (5); z is the modulus of characteristic impedance, done by Equation (2); R is the Radiation coefficient, done from Equation (3).
Beams ρ c ll c tt c lr c tr E l E t zR
kg/m 3 m/sm/sm/sm/sGPaGPa10 3 kg/(m 2 s)m 4 /(kg s)
not-aged39030009209002603.40.3411707.57
two-year aged400457087010003408.10.30182811.2
historical450530054080023012.80.13238511.85
Table 6. Measured values, spatially and spectrally averaged. The subscript “M” means the value was averaged over the octave bands of 500–1000 Hz. The subscript “3” means the value was averaged over the octave bands of 500–1000–2000 Hz. Speech Transmission Index (STI) values were simulated considering an infinite signal-to-noise ratio value.
G M  (dB) C 50 , 3  (dB)STI
Present (without proscenium)Stalls7.66.00.65
Boxes1.52.90.63
Gallery4.4−1.40.56
Original (with proscenium)Stalls10.01.20.61
Boxes2.50.80.57
Gallery4.7−2.60.55

