
The PARC_CL 2.1 Crack Model for NLFEA of Reinforced Concrete Elements Subjected to Corrosion Deterioration


Department of Engineering and Architecture, University of Parma, 43124 Parma, Italy
*
Author to whom correspondence should be addressed.
Corros. Mater. Degrad. 2021, 2(3), 474-492; https://doi.org/10.3390/cmd2030025
Submission received: 23 July 2021
/
Revised: 23 August 2021
/
Accepted: 26 August 2021
/
Published: 30 August 2021
(This article belongs to the Special Issue Corrosion of Steel Reinforcement in Concrete: Furthering Knowledge within and beyond Boundaries)
Abstract
:During their service life, existing structures may suffer a combination of ageing and reinforcement corrosion. The corrosion deterioration can significantly affect the durability of reinforced concrete (RC) elements causing premature concrete crushing, size reduction of reinforcement cross-section, degradation of mechanical properties of steel and concrete, and stirrups rupture. One of the main purposes related to durability reduction is the evaluation of the maintenance of adequate safety and residual capacity throughout the life of the structure. For this reason, a non-linear finite element approach (NLFEA), based on multi-layer shell elements and PARC_CL 2.1 crack model has been presented in this paper. The PARC_CL 2.1 model is a fixed crack model developed at the University of Parma and implemented in a subroutine UMAT for ABAQUS that incorporates cyclic constitutive laws of materials and the evolution of corrosion over time. In the present work, the crack model was improved by implementing the effects of exposure to environmental attack. Firstly, the effectiveness of the proposed model has been validated through comparison with experimental data available in literature. The residual capacity of corroded RC panels subjected to cyclic loads was then investigated over time considering different exposure classes. Based on the obtained results, the capacity reduction in terms of maximum shear stress and ductility have been estimated over time.
1. Introduction
Nowadays, a significant part of reinforced concrete (RC) structures and infrastructures have almost reached and overcome their conventional service life and are suffering ageing effects and material deterioration [1].
In particular, corrosion has been recognized as one of the principal causes that leads RC members to premature unexpected failures, characterized by structural brittle behavior and lacking of warning signs [2]. As widely reported, the principal effects of corrosion deterioration can be identified as concrete crushing, size reduction of reinforcement cross-section, degradation of mechanical properties of steel and concrete, and stirrups rupture [3,4,5,6]. Since the aggressive environmental attack—due to chloride contents (localized corrosion) or carbonation (uniform corrosion)—increases over time, the corrosion process plays a crucial rule, increasing the vulnerability of RC structures and drastically decreasing their structural capacity over the years. In this framework, a large amount of research was conducted to analyze the effects induced by corrosion deterioration on RC structures and infrastructures and to evaluate the residual life of corroded RC members. For instance, referring to the residual capacity of corroded RC elements, Rodriguez et al. [7] experimentally investigated 31 corroded beams by reproducing the corrosion deterioration by applying a current density of 100 μA/cm2, while Torres-Acosta et al. [8,9] performed a huge experimental campaign investigating the reduction in terms of flexural resistance induced by pitting corrosion of reinforcements. On the other hand, the relevant topic concerning the prediction of the residual service life of corroded RC members has seen increasing interest in the last years. Among them, Ahmad et al. [10] investigated the remaining service life of corroded structures considering both empirical and experimental methods. Ranjith et al. [11] carried out a parametric study on relevant parameters such as, cover thickness, corrosion rate, and perimeter of the bar, for the evaluation of the effects of corrosion on service life prediction. Moreover, Imperatore et al. [12] proposed a simplified integrated procedure for the estimation of the strength decay of RC sections exposed to chloride attack.
Despite the amount of work carried out, additional efforts from researchers must be addressed to the study of serviceability, durability, and safety performance of corroded RC structures subjected to cyclic loading. To this aim, the present work proposes a reliable numerical model, called PARC_CL 2.1 crack model—developed at the University of Parma and implemented in a user subroutine for ABAQUS software [13]—for the cyclic and dynamic response prevision of existing RC structures subjected to corrosion deterioration. It is worth noting that the proposed model has been already successfully applied to the non-linear finite element analysis (NLFEA) of RC elements subjected to static, cyclic, and dynamic loading, as reported in [14,15,16].
The main novelty of the study consists of the implementation of a stiffness matrix to be used at the integration point, for non-linear finite element simulation of corroded RC members. The stiffnesses matrix, based on the PARC_CL 2.1 crack model, represents a new release of the user subroutine for membrane or multi-layered shell elements. Appropriate models, available in literature, for concrete and steel damaged by corrosion effects were implemented in the new release of PARC_CL 2.1. The new release of PAR_CL 2.1 is validated by analyzing RC panels that represent an element of assemblages of entire structures. Therefore, the knowledge of the mechanisms and failure modes caused by corrosion in RC panels can improve the knowledge of the mechanisms and the failure modes of entire structures. In the present work, the residual loading capacity of corroded RC panels were evaluated by coupling the new release of PARC_CL 2.1 with other available models concerning chloride-induced corrosion. To this aim, the proposed model was firstly validated by means of the comparison with experimental results carried out on uncorroded RC panels tested by Mansour and Hsu [17] and previously investigated in Belletti et al. [14]. Once validated, the proposed model was used for the prediction of the ultimate resistance and ductility of corroded RC panels subjected to localized corrosion deterioration. In this context, referring to chloride-induced corrosion, a parametric analysis considering three different exposure classes related to sea water exposure, XS1, XS2, and XS3 was performed over time. As the first step, the model for deteriorated structures proposed by Tuutti [18] was assumed for the evaluation of the initiation and propagation period, where input parameters, such as, the chloride critical contents and the chloride diffusion coefficient were estimated according to scientific literature outcomes [11,12,19,20]. Secondly, the corrosion effects in terms of maximum penetration depth was evaluated according to CONTECVET manual [21]. Thirdly, the reduced mechanical properties of steel and concrete were evaluated by means of models developed by Chen et al. [22] and Coronelli and Gambarova [23], respectively. Finally, the comparison of the obtained results in terms of shear stress—shear strain cyclic response and pre-yield shear stiffness were carried out. The outcomes show that a critical reduction in terms of maximum shear stress and shear strain takes place over time, especially in the case of splash and spray condition. On the other hand, the constantly submerged environment leads to a general lower reduction.
2. Materials and Methods
2.1. The PARC_CL 2.1 Crack Model
Currently, available to designers all over the world, there are different approaches for non-linear finite element modelling of RC structures such as, fiber models, 2-dimensional models (2D), and 3-dimensional models (3D). Basically, each model is characterized by pros and cons generally related to its complexity and computational cost. In particular, 2D approaches present limited computational efforts and provide the chance to model complex structural typologies taking into account both flexural and shear effects.
In the present study, the PARC_CL 2.1 crack model, which stands for Physical Approach for Reinforced Concrete subjected to Cyclic Loading, is described and used in order to predict the structural response under cyclic loading of corroded RC panels. PARC_CL 2.1, which was implemented in a user subroutine for the software ABAQUS [13] at the University of Parma, is a total fixed crack approach for 2D multi-layered shell elements that assumes reinforcement smeared in the concrete element. The non-linear behavior is assigned through the model at each integration point, where two reference systems are defined: (a) the first one refers to the local x,y coordinate system of the finite element, while the other (b) refers to the 1,2-coordinate system, assumed along the principal stress directions, Figure 1.
The proposed model treats the cracked solid as a continuum by reducing the stiffness matrix at the integration points. When the crack is formed, the 1,2-coordinate system remains fixed throughout the loading process. The uniaxial model proposed by He et al. [24] based on the energy fracture law is implemented to predict the non-linear behavior of concrete. The shear stress due to the effect of aggregate interlock is evaluated by implementing the Gambarova law [25]. Moreover, the biaxial state for concrete in compression is considered by using the law proposed by Vecchio and Collins [26], but extended to cyclic loading. Several stress-strain relationships for steel such as, the widely used uniaxial model proposed by Menegotto and Pinto [27], and two additional models able to detect the buckling of the reinforcement: the Monti-Nuti model [28], and the Kashani et al. model, are implemented in the PARC_CL 2.1 crack model [29]. Recently, the model has been upgraded by implementing adequate constitutive laws to evaluate the contribution of creep and shrinkage effects. For the sake of brevity, further details on the PARC_CL 2.1 crack model can be found referring to [14,15,30,31,32,33].
2.2. Validation of the Model
According to the results shown in Belletti et al. [14], the PARC_CL 2.1 crack model was validated by simulating 8 out of 12 uncorroded specimens belonging to the experimental campaign carried out by Mansour and Hsu [17]. All panels were characterized by a height, h0, equal to 1397 mm and a width, b0, equal to 1397 mm. Two different rebar diameters, D0, were considered equal to 19 mm and 25 mm, leading to uncorroded cross-sectional area, As0, of about 284 mm2 and 510 mm2, respectively. A modulus of elasticity of reinforcing steel, Es, equal to 200 GPa was assumed.
Generally, the panels were 178 mm thick, except those reinforced with a bar diameter of 25 mm which had a thickness equal to 203 mm.
In the present work, two RC panels (CE3 and CA4) were taken into account for the evaluation of the corrosion effects over time. The panel of the CE series was characterized by longitudinal and transversal reinforcement placed parallel to the applied principal stresses. On the other hand, the CA series had a bar orientation with respect to the applied principal stresses equal to 45 degrees. Table 1 lists the values of the mechanical properties of undamaged concrete (fc0, εc0) and uncorroded rebar for the different diameters considered (fy0, εy0, fu0, εu0, ρ), where fc0, and εc0 are the cylinder compressive strength of concrete and the concrete strain at maximum compressive stress, while fy0, εy0, fu0, and εu0 stand for the yield strength, the yield strain, the ultimate strength, and the ultimate strain of reinforcing steel, respectively, and ρ is the ratio of longitudinal tension reinforcement.
Referring to non-linear finite element analysis (NLFEA), the panels were modelled using a single 4 node membrane element with reduced integration, M3D4R, and to reproduce the same experimental loading condition, truss elements were used to realize an external frame to apply the cyclic displacement time history. To reproduce the experimental tests carried out by Mansour and Hsu [17], compression-tension cyclic loading with the same absolute (positive and negative) values was applied to RC panels. These values simulate the principal stresses in the horizontal and vertical directions, and they are characterized by increasing magnitude during the cyclic displacement time history. Figure 2 shows the comparison between experimental test results and numerical outcomes in terms of measured shear stress versus shear strain response for CE3 and CA4 uncorroded panels. For more details on the setting of the NLFE analyses and the comparison between experimental and NLFEA outcomes refer to [14].
2.3. Prediction of Corrosion Deterioration
To carry out a reliable prediction of the cyclic behavior of corroded RC elements, the main effects due to corrosion deterioration were included in the NLFEA. In this context, it is widely recognized in the scientific literature that the corrosion deterioration process can drastically reduce the resisting cross-section of the reinforcement as well as modify the mechanical response of rebar and surrounding concrete. In addition, the cracking phenomena and the reduction of bond between concrete and steel should be considered as relevant issues over time.
The model proposed by Tuutti [18] for deteriorated structures was assumed to estimate the design life of corroded RC elements. According to this model, the design life of the structure can be divided into two main periods. The first period, called initiation period (years), ti, or depassivation time, corresponds to the time from structural construction up to the depassivation of the reinforcement and it depends primarily on cover depth, w/c ratio, curing time, environmental conditions, and temperature. The second period, called propagation period (years), tp, starts from the depassivation of the reinforcement until a certain unacceptable level of deterioration and depends on oxygen, water availability, and hydrogen ions concentration [21].
The present work primarily focuses on the investigation of the effects induced by chloride corrosion (localized/pitting corrosion). To this aim, according to the environmental classification proposed in EN 206 [34], the exposure classes for corrosion induced by chlorides from sea water (XS1, XS2, and XS3) were taken into account. The exposure class XS1 refers to structures exposed to airborne salt but not in direct contact with sea water, XS2 is assigned to structures permanently submerged, while the exposure class XS3 refers to tidal, splash, and spray zones.
Based on these assumptions, the initiation period, ti, was calculated for each exposure class by applying the chloride concentration diffusion model (Fick’s second law of diffusion), which expression is reported in Equation (1):
where, C(x,t) is the chloride content at depth x from the concrete surface at a time t (years), x is the thickness of concrete cover (mm), Ci is the initial chloride content (%), assumed equal to 0, Csa is the achieved surface chloride content (%), evaluated from scientific literature (DuraNet) [19,20] in function of the height above sea level, and Dcl is the chloride diffusion coefficient of the concrete. Based on scientific literature outcomes, different opinions about the values of the chloride diffusion coefficient, Dcl, are available: Ranjith et al. [11] pointed out a range that varies from 0.45 to 6 cm2/year, Imperatore et al. [12] suggested a range from 0.16 to 8 cm2/year, and Collepardi et al. [35] showed a Dcl varying from 0.26 to 1.57 cm2/year. In the following calculations, a chloride diffusion coefficient equal to 0.61 cm2/year was assumed. Additionally, as pointed out by different authors [12,36], an actual definition of the critical chloride content, Ccr, is hardly achievable, since this threshold value depends on several parameters. Table 2 reports the critical chloride contents assumed in this study as a function of the different exposure classes considered.
The evolution of chloride content over time for the different exposure classes is reported in Figure 3. In this regard, by assuming a concrete cover, x, equal to 45 mm, and by imposing the chloride content C(x,t) equal to a critical content (%), Ccr, the initiation period, ti, has been evaluated for the different exposure classes under analysis, Table 2.
Once the initiation period, ti, was evaluated, the propagation period, tp, was calculated through the expression reported in Equation (2):
where, t is the time of the assessment. For the case study, the prediction is carried out from 50 up to 100 years, assuming a time step equal to 10 years.
Investigating the localized (pitting) corrosion, the next step consisted of the evaluation of the maximum penetration depth (mm), Ppit(tp), which was calculated by using the formulation provided in CONTECVET manual [21] and reported in Equation (3):
where, 0.0116 is a conversion factor of μA/cm2 into mm/year, α is the pitting factor, set equal to 10, and Icorr (μA/cm2) is the corrosion rate. Referring to CONTECVET manual [21]—in case of lack of in situ measurements—values of corrosion rate equal to 1.7 μA/cm2, 0.5 μA/cm2, and 2.5 μA/cm2 for exposure classes XS1, XS2, and XS3 were assumed, respectively. Table 3 reports the maximum penetration depths, Ppit(tp), calculated over time by applying Equation (3) for the different exposure classes.
Thereafter, according to the model proposed by Val [37,38], a hemispherical pit type morphology was assumed in order to estimate the area loss due to pitting (mm2), Ap(tp), as a function of the maximum penetration depth, Ppit(tp), and the uncorroded diameter, D0, Equations (4)–(9):
where:
Furthermore, by considering the uncorroded cross-sectional area of rebar, As0, the maximum cross-sectional loss (%), μmax, due to localized corrosion was estimated through Equation (10):
2.4. Mechanical Properties
2.4.1. Steel
As highlighted by several research, corrosion deterioration may lead to a critical reduction in terms of load capacity and ductility of reinforcement rebar over time and with the increasing corrosion level. In the present work, the corrosion deterioration was considered by reducing the area of the reinforcement. The ultimate strain, εu,cor, was estimated through the expression proposed by Chen et al. [22], as reported in Equation (11).
where, fu0 and εu0 are the ultimate strength and the ultimate strain of the uncorroded reinforcing steel, respectively, while fy0 and εy0 are the yield strength and the yield strain of the uncorroded reinforcing steel. The coefficient P is the strain-hardening power, estimated according to the formula reported in Equation (12), [22]:
where, Esh0 is the strain-hardening modulus, which was set equal to 2 GPa.
According to Chen et al. [22], a critical corrosion level (%), μcr, above which the rebar would not yield upon failure was calculated by using Equation (13), Figure 4. Referring to the uncorroded yield and ultimate strength of reinforcing steel reported in Table 1, critical values equal to 21.39% and 20.30% are obtained for rebar diameter, D0, equal to 19 mm and 25 mm, respectively.
For instance, Figure 5 shows reduced force–strain relationships over time in the case of panel CE3—with reinforcements characterized by a rebar diameter equal to 19 mm—for the exposure classes XS1 and XS3, respectively. The force, F, was evaluated according to Equation (14):
where Acorr(tp) is the corroded area of the rebar over time, evaluated as the difference between the uncorroded area of rebar, As0, and the area loss due to pitting, Ap(tp). As visible from Figure 5, with the increase in the exposure time, the hysteretic loops tend to reduce and disappear, leading to brittle failure of the analyzed panels, except for the exposure class XS2.
2.4.2. Concrete
The increase of the volume of steel during the corrosion process may cause delamination and spalling of the concrete cover. This latter phenomenon may cause concrete cracking and reduction of the ductility and compressive strength of concrete. The reduction law proposed by Coronelli and Gambarova [23] was assumed for the evaluation of the cylinder compressive strength of damaged concrete (MPa), fc’, through the formula provided in Equation (15):
where, fc is the cylinder compressive strength of undamaged concrete (MPa), Table 1, k is a coefficient related to the bar roughness and diameter, which is set equal to 0.1 according to [23], εc0 is the concrete strain at maximum compressive stress, and ε1 is defined as the average strain in the cracked concrete at right angles to the direction of the applied compression. This latter parameter was calculated according to Equation (16) as a function of the number of rebars in compression, nbar, the uncorroded section width, b0, and the total crack width for a given corrosion level (mm), wcr.
To take into account the effect induced by localized corrosion, the total crack width, wcr, was estimated according to the model proposed by Xia et al. [39], as reported in Equation (17):
where, μaverage is the average cross-sectional loss (%), assumed equal to 0.476 times the maximum cross-sectional loss [39], μmax, and μlim is the critical cross-sectional loss (%), evaluated according to the model proposed by Vidal et al. [40] in correspondence of the initiation of cracking through Equation (18). Lastly, K is a parameter established for the evaluation of the maximum crack width as a function of the concrete cover, x, and rebar diameter, D0, that was calculated through the expression provided in Equation (19).
Furthermore, the ultimate strain of concrete in compression, εcu,cor, was reduced over time proportionally to the reduction of the cylinder compressive strength of damaged concrete, fc’. Table 4 reports the values of the cylinder compressive strength of damaged concrete, fc’, over time for the two RC panels analyzed.
Finally, to consider the effect induced by the rust product’s formation and concrete cracking caused by the progress of corrosion deterioration over time, a threshold value of the mass loss (%), ηloss, of reinforcing rebar equal to 20% was selected, as pointed out by Jiang et al. [41]. When the mass loss of reinforcement exceeds this critical value, the spalling of concrete cover was assumed to occur, leading to the reduction of the thickness of the panel. The mass loss, ηloss, of reinforcement associated to each panel over time was evaluated in relation to the corroded cross-sectional area of the rebar, Acorr(tp), through the expression proposed by Li et al. [42], Equation (20):
3. Results and Discussion
Starting from the uncorroded RC panels tested by Mansour and Hsu [17] and analyzed by Belletti et al. [14], the effects of corrosion on RC panels subjected to cyclic shear stresses were evaluated by analyzing the hysteretic loops of the shear stress–shear strain curves until failure. It is worth noting that RC panels tested by Mansour and Hsu [17] did not fail during the experimental campaign. Hence, to study the ultimate behavior of the two panels subjected to corrosion, once validated as shown in Figure 2, the NLFE model was put forward until reaching the ultimate strain of reinforcing steel or the ultimate strain of concrete in compression. To this aim, the loading protocol in terms of number of cycles used during the experimental tests was further extended to reach the assumed ultimate strain value of reinforcing steel or the ultimate strain of concrete in compression. The starting loading cycles that were previously set for the reference uncorroded specimen were assumed the same for the corroded RC panels. In this study, NLFEA of RC panels was carried out without considering the buckling phenomenon and therefore by adopting the Menegotto and Pinto [27] model for steel.
In particular, the hysteretic loops obtained by performing NLFEA were simplified by considering two distinct stages: (i) from the origin to the yielding point and (ii) from the yielding point to the maximum point. To this aim, four critical points were identified by letters Y+, Y−, M+, and M−, where point Y identifies the yielding point in tension and compression, while point M stands for reaching of the maximum point in tension and compression, respectively.
For the sake of clarity, Figure 2 shows the identification of the main points on the hysteretic loops for the uncorroded panels CE3 and CA4, while Table 5 reports the NLFEA values of the investigated parameters for both uncorroded specimens considered.
3.1. Shear Stress–Shear Strain Response Reduction
To investigate the detrimental effects induced by corrosion deterioration, the decay in terms of maximum shear stress, τmax, and maximum shear strain, γmax, in tension and compression were investigated over time for the three exposure classes XS1, XS2, and XS3. Generally, the maximum shear stress, τmax, was assumed equal to the maximum point reached by the shear stress–shear strain curve. Consequently, the maximum shear strain, γmax, was set equal to the strain value evaluated in correspondence of the measured maximum shear stress, τmax.
Additionally, the reduction in terms of ductility, μp, were investigated over time. This latter parameter was calculated according to Equation (21):
where γy corresponds to the shear strain evaluated in correspondence of the yielding point, Y, while γu stands for the ultimate shear strain of the analyzed panel. In this context, as pointed out by Mansour and Hsu [17], when no descending branch is exhibited by the hysteretic loop response, the ultimate shear strain is identical to the maximum shear strain, γmax, as highlighted by Figure 6a. On the other hand, when a descending branch is visible, the ultimate shear strain is evaluated in correspondence of an ultimate shear stress value, τu, assumed equal to the 80% of the maximum shear stress, τmax, Figure 6b.
Appendix A reports the obtained results for both the corroded RC panels taken into account. Examples of the reduction of hysteretic loops as a function of chloride-induced corrosion over time are shown in Figure 6—considering exposure classes XS1 and XS3—in case of panels CE3 and CA4, respectively.
Figure 7 graphs the NLFEA outcomes in terms of τmax for the analyzed RC panels. The reduction is expressed in percentage (%) and evaluated with respect to NLFEA outcomes of each uncorroded panel (Belletti et al. [14]). Additional information can be found in Appendix A.
Based on the obtained results, after 50 years of exposure, negligible differences in terms of maximum shear stress were noticed for the exposure classes XS1 and XS2, while for the exposure class XS3 in case of panel CE3 and CA4, a significant reduction of about 20% and 45% of the maximum shear stress was observed (Figure 7). Moreover, within an exposure time of about 60 years, little scatter of data between exposure class XS1 and XS2 was detected. After about 70 years of exposure, a significant reduction in terms of maximum shear stress took place, except for the exposure class XS2. Referring to the latter, a high residual maximum shear stress even after 100 years of exposure to chloride attack induced by sea water was noticed for panel CE3 (Figure 7a), while for panel CA4, a 30% reduction was estimated, Figure 7b.
As a result, a relevant reduction of the maximum shear stress, τmax, and the maximum shear strain, γmax, were detected over time, especially for the exposure class XS3, which can be considered as the more aggressive exposure environment condition analyzed. On the other hand, it is possible to state that the class XS2 results in being the less aggressive exposure environment with a general limited or negligible deterioration process even after a period of about 100 years for panel CE3 and CA4, respectively. An intermediate behavior was predicted for the corroded RC panels subjected to exposure class XS1.
Additionally, it is worth noting that the reduction of the maximum shear stress over time due to chloride-induced corrosion causes a sensible reduction in the maximum and ultimate shear strain—characterized by the disappearance of the hysteretic loops—leading to the occurrence of brittle failures of the corroded RC panels (Appendix A, Table A1). This type of failure was frequent in the case of exposure class XS3 after a period comparable to the time at which a first big drop in the maximum shear stress versus time graphs was observed (Figure 7). Generally, two different failure modes were detected over time: (i) failure of steel induced by reaching the corroded ultimate strain of reinforcing steel, εu,cor, (steel rupture) or (ii) failure of concrete due to reaching the corroded ultimate strain of concrete in compression, εcu,cor (concrete crushing). Since the reinforcements were symmetrical, the failure modes of the RC panels were not affected by aggregate interlock phenomenon. Basically, the failure mode of panel CE3 is characterized by the rupture of rebars after a period that varies in relation to the exposure class taken into account. On the other hand, panel CA4 showed a failure mode caused by the crushing of concrete. Additionally, it was observed from NLFE outcomes that—with the decrease of mechanical properties induced by corrosion deterioration process—the failure mode characterizing each RC panel analyzed does not vary over time. In particular, the effects induced by the corrosion process over time, i.e., increase of the maximum penetration depth and consequent increase in the maximum cross-sectional loss, leads—especially for the exposure class XS3—to a drastic reduction over time of the ultimate strain of reinforcing steel and of the cylinder compressive strength of damaged concrete. Consequently, the number and the amplitude of hysteretic loops tends to reduce over time (Figure 4 and Figure 5), leading to a reduction of the loading capacity of the investigated corroded RC panel.
Figure 8 shows the reduction trend of the ductility, μp, over time considering the exposure classes under analysis. If compared to the uncorroded value, the ductility of the RC panels tends to be more preserved over time in the case of exposure class XS2, except after a period of about 80 years for panel CA4, when a clear reduction started to be detected. On the other hand, a severe reduction over time was observed in the case of exposure class XS3 for both the analyzed panels. When the corroded rebar fails in the elastic branch of the stress–strain response, the yield shear strain, γy, cannot be reached in the cyclic loading response of corroded RC panels, leading to a ductility, μp, equal to zero. Once again, an intermediate behavior was observed when the RC panels were subjected to exposure class XS1. In this case, the disappearance of ductility only took place for panels CE3 after a period of exposure of about 90 years. Moreover, comparing the two RC panels and taking into account their different failure modes, it is possible to affirm that panel CA4, that fails due to concrete crushing and it is characterized by an overall lower ductility if compared to panel CE3, shows a less pronounced reduction trend over time than the other RC panel, that exhibits failures induced by rebar rupture. In this regard, referring to panel CA4, a residual ductility equal to 0.9 was still detected after a period of about 90 years in the case of exposure class XS3 (most aggressive environments). On the other hand, considering the same exposure class (XS3), no ductility could be obtained for panels CE3 after a period of about 60 years.
3.2. Pre-Yield Shear Stiffness Effect
In addition to the evaluation of the reduction of maximum shear stress, τmax, and ductility, μp, over time and for different exposure classes, a further parameter—the pre-yield shear stiffness, Kγ—has been analyzed. The pre-yield shear stiffness, Kγ, is defined as the ratio between yield shear stress, τy, to yield shear strain, γy, as shown by Equation (22):
The positive and negative values of the parameter (Kγ+ and Kγ−) for both the analyzed RC panels were investigated and reported in Appendix A, Table A2, for each exposure class taken into account. Figure 9a,b show the variation of pre-yield shear stiffness coefficient over time for panel CE3 in the cases of exposure classes XS2 and XS3, respectively. The dashed black line plotted in Figure 9 stands for the experimental uncorroded pre-yield shear stiffness measured during the experimental campaign carried out by Mansour and Hsu [17].
Generally, as visible from the obtained outcomes reported in Appendix A, Table A2, varying the exposure classes, even in the case of the pre-yield shear stiffness coefficient, no remarkable difference after a period of about 50 years was observed. Moreover, referring to exposure classes XS1 and XS2, similar results were obtained until a period of exposure of about 70 years. After this time threshold, the difference between the obtained values became visible. In final analysis, increasing the exposure time, more relevant reduction of pre-yield shear stiffness occurred, especially for the exposure class XS3.
In detail, in the case of high levels of corrosion, the ultimate strain of reinforcing steel drops drastically, leading to a sudden rupture of the rebar at the elastic stage. Therefore, the yielding point (τy, γy) cannot be reached during the analysis and consequently the pre-yield shear stiffness, Kγ, results in being equal to 0. In correspondence of this value (Kγ = 0), a brittle failure of the corroded RC panel was assumed to occur (brittle behavior), as shown in Figure 9b for panel CA3. Conversely, when the RC panel is subjected to a less aggressive exposure condition, i.e., exposure class XS2, since the cyclic loading response of the analyzed RC panel can overcome the yielding point, leading to a residual ductility of the RC panel (Kγ ≠ 0), a reduced value of the pre-yield shear stiffness coefficient can be detected over time even after 100 years of exposure to chloride ions, as shown in Figure 9a.
4. Conclusions
In this paper, the PARC_CL 2.1 model was used to predict the cyclic loading response of corroded RC panels. Firstly, the main features of the PARC_CL 2.1 crack model were described, secondly the main assumptions for the evaluation of chloride-induced corrosion effects as well as the constitutive laws for the estimation of the reduced mechanical properties of both concrete and steel were discussed. Finally, after model validation by means of comparison with the experimental results obtained for uncorroded RC panels, the proposed model was applied for the prediction of the ultimate resistance of corroded RC panels over time.
Based on the obtained results, the following conclusions can be drawn:
- Generally, the PARC_CL 2.1 crack model can be used as a powerful and useful tool for the prediction of the cyclic response of existing corroded RC structures.
- As expected, the corroded RC panels present lower maximum resistance and ductility than the uncorroded one. In this regard, considering the severe reduction of mechanical properties of both steel and concrete over time, brittle failures characterized by absence of ductility occur.
- Over time, a significant reduction in terms of maximum shear stress, τmax, ductility, μp, and pre-yield shear stiffness, Kγ, was observed, especially for the exposure class XS3, which results in being the worst environmental condition analyzed. On the other hand, a significant lower reduction was noticed in the case of exposure class XS2, except for panel CA4.
- As highlighted by NLFEA results, the failure of each panel occurred after a different exposure time as a function of both the reduction of the mechanical properties of steel and concrete and the type of exposure class considered. As a general statement, panel CE3 fails due to the rupture of reinforcement, while the failure of panel CA4 is induced by concrete crushing. In particular, with the decrease of mechanical properties induced by the corrosion deterioration process, the failure mode characterizing each RC panel analyzed does not vary over time.
- To carry out reliable calculations of existing RC structures over time, particular attention must be addressed to the estimation of important parameters, such as critical chloride content, chloride diffusion coefficient, and corrosion rate. These values may be obtained by means of in situ measurement, when possible, or through probabilistic and statistical analyses. On this research topic, further studies need to be carried out.
Finally, future research will concern the estimation of the effect induced by different reinforcement ratios in longitudinal and transversal direction on the residual capacity of corroded RC panels. Moreover, additional efforts will aim to investigate the cyclic loading response of corroded RC panels considering the contributions provided by creep and shrinkage effects over time and buckling phenomenon of compressed steel reinforcement.
Author Contributions
Conceptualization: B.B. and L.F.; methodology: L.F.; software, L.F.; validation: F.V. and L.F.; formal analysis: L.F.; investigation: B.B., L.F. and F.V.; resources: B.B.; data curation: L.F.; writing—original draft preparation: L.F.; visualization: F.V.; supervision: B.B. All authors have read and agreed to the published version of the manuscript.
Funding
This research received no external funding.
Institutional Review Board Statement
Not applicable.
Informed Consent Statement
Not applicable.
Data Availability Statement
The raw/processed data required to reproduce these findings cannot be shared at this time as the data also forms part of an ongoing study.
Conflicts of Interest
The authors declare no conflict of interest.
Appendix A
Here are reported the outcomes concerning the main investigated parameters for the two RC panels analyzed (τmax, γmax, and Kγ).

Table A1.
Variation over time of the maximum shear stress and the maximum shear strain (positive and negative values) in function of different exposure classes - for the two investigated panels.
Table A1.
Variation over time of the maximum shear stress and the maximum shear strain (positive and negative values) in function of different exposure classes - for the two investigated panels.
| Corroded RC Panels | Parameter | Time of Analysis (Years) | |||||
|---|---|---|---|---|---|---|---|
| 50 | 60 | 70 | 80 | 90 | 100 | ||
| Exposure Class: XS1 | |||||||
| CE3 | τmax+ (MPa) | 6.22 | 6.20 | 5.17 | 4.27 | 3.50 | 3.48 |
| τmax– (MPa) | –6.45 | –6.27 | –5.29 | –4.28 | –2.73 | –2.46 | |
| γmax+ (-) | 0.0501 | 0.0500 | 0.0285 | 0.0063 | 0.0014 | 0.0013 | |
| γmax− (-) | –0.0598 | –0.0520 | –0.0346 | –0.0081 | –0.0019 | –0.0003 | |
| CA4 | τmax+ (MPa) | 9.47 | 9.26 | 5.73 | 4.55 | 3.93 | 3.47 |
| τmax− (MPa) | –9.36 | –9.00 | –5.70 | –4.50 | –3.94 | –3.47 | |
| γmax+ (-) | 0.0057 | 0.0056 | 0.0038 | 0.0031 | 0.0027 | 0.0026 | |
| γmax− (-) | –0.0057 | –0.0055 | –0.0038 | –0.0030 | –0.0028 | –0.0025 | |
| Exposure Class: XS2 | |||||||
| CE3 | τmax+ (MPa) | 6.20 | 6.16 | 6.15 | 5.86 | 5.84 | 5.33 |
| τmax– (MPa) | –6.44 | –6.36 | –6.29 | –6.02 | –5.96 | –5.62 | |
| γmax+ (-) | 0.0498 | 0.0496 | 0.0494 | 0.0429 | 0.0425 | 0.0285 | |
| γmax− (-) | –0.0592 | –0.0574 | –0.0547 | –0.0510 | –0.0470 | –0.0416 | |
| CA4 | τmax+ (MPa) | 9.46 | 9.41 | 9.37 | 9.15 | 7.44 | 6.47 |
| τmax– (MPa) | –9.28 | –9.22 | –9.21 | –8.97 | –7.42 | –6.49 | |
| γmax+ (-) | 0.0056 | 0.0054 | 0.0054 | 0.0053 | 0.0044 | 0.0040 | |
| γmax– (-) | –0.0058 | –0.0057 | –0.0056 | –0.0055 | –0.0045 | –0.0041 | |
| Exposure Class: XS3 | |||||||
| CE3 | τmax+ (MPa) | 4.87 | 3.30 | 3.16 | 2.22 | 2.07 | - |
| τmax– (MPa) | –5.03 | –3.02 | –2.44 | –2.24 | –2.09 | - | |
| γmax+ (-) | 0.0213 | 0.0014 | 0.0014 | 0.0002 | 0.0002 | - | |
| γmax− (-) | –0.0280 | –0.0021 | –0.0003 | –0.0003 | –0.0003 | - | |
| CA4 | τmax+ (MPa) | 5.25 | 4.06 | 3.42 | 3.30 | 3.03 | - |
| τmax− (MPa) | –5.27 | –4.07 | –3.41 | –3.30 | –3.03 | - | |
| γmax+ (-) | 0.0035 | 0.0028 | 0.0025 | 0.0023 | 0.0003 | 0.0003 | |
| γmax− (-) | –0.0034 | –0.0028 | –0.0026 | –0.0023 | –0.0020 | - | |
+ positive loading direction; – negative loading direction.
Table A2.
Variation over time of the pre-yield shear stiffness (positive and negative values) in function of different exposure classes - for the two investigated panels.
Table A2.
Variation over time of the pre-yield shear stiffness (positive and negative values) in function of different exposure classes - for the two investigated panels.
| Corroded RC Panels | Parameter | Time of Analysis (Years) | |||||
|---|---|---|---|---|---|---|---|
| 50 | 60 | 70 | 80 | 90 | 100 | ||
| Exposure Class: XS1 | |||||||
| CE3 | Kγ+ (MPa) | 2074.4 | 2059.1 | 1888.2 | 1698.6 | - | - |
| Kγ− (MPa) | 2449.5 | 2303.0 | 2121.2 | 1787.9 | - | - | |
| CA4 | Kγ+ (MPa) | 1660.5 | 1653.6 | 1508.5 | 1468.8 | 1453.7 | 1334.9 |
| Kγ− (MPa) | 1642.1 | 1636.4 | 1499.2 | 1451.6 | 1405.7 | 1386.3 | |
| Exposure Class: XS2 | |||||||
| CE3 | Kγ+ (MPa) | 2069.4 | 2057.9 | 2045.4 | 2011.5 | 2005.6 | 1941.4 |
| Kγ− (MPa) | 2449.5 | 2419.2 | 2363.6 | 2333.3 | 2287.9 | 2166.7 | |
| CA4 | Kγ+ (MPa) | 1701.4 | 1672.7 | 1669.7 | 1666.7 | 1596.6 | 1517.2 |
| Kγ− (MPa) | 1582.5 | 1575.6 | 1568.4 | 1555.7 | 1524.5 | 1483.3 | |
| Exposure Class: XS3 | |||||||
| CE3 | Kγ+ (MPa) | 1954.5 | - | - | - | - | - |
| Kγ− (MPa) | 2050.5 | 1482.4 | - | - | - | - | |
| CA4 | Kγ+ (MPa) | 1590.0 | 1374.9 | 1266.7 | 1188.2 | 1174.5 | - |
| Kγ− (MPa) | 1548.9 | 1452.3 | 1310.6 | 1304.7 | 1273.6 | - | |
+ positive loading direction; − negative loading direction.
References
- Di Prisco, M. Critical infrastructures in Italy: State of the art, case studies, rational approaches to select the intervention priorities. In Proceedings of the Fib Symposium 2019: Concrete—Innovations in Materials, Design and Structures, Kraków, Poland, 27–29 May 2019; pp. 49–58. [Google Scholar]
- Sanchez, J.; Fullea, J.; Andrade, C. Corrosion-induced brittle failure in reinforcing steel. Theor. Appl. Fract. Mech. 2017, 92, 229–232. [Google Scholar] [CrossRef]
- Coronelli, D.; Hanjari, K.Z.; Lundgren, K. Severely Corroded RC with Cover Cracking. J. Struct. Eng. 2013, 139, 221–232. [Google Scholar] [CrossRef] [Green Version]
- Coronelli, D.; François, R.; Dang, H.; Zhu, W. Strength of Corroded RC Beams with Bond Deterioration. J. Struct. Eng. 2019, 145, 04019097. [Google Scholar] [CrossRef]
- Andrade, C.; Alonso, C.; Molina, F.J. Cover Cracking as a function of bar corrosion: Experimental test. Mater. Struct. 1993, 26, 453–464. [Google Scholar] [CrossRef]
- Torres-Acosta, A.A.; Castro-Borges, P. Corrosion-induced Cracking of Concrete Elements Exposed to a Natural Marine Environment for Five Years. Corrosion 2013, 69, 1122–1131. [Google Scholar] [CrossRef]
- Rodriguez, J.; Ortega, L.M.; Casal, J. Load carrying capacity of concrete structures with corroded reinforcement. Constr. Build. Mater. 1997, 11, 239–248. [Google Scholar] [CrossRef]
- Torres-Acosta, A.A.; Fabela-Gallegos, M.; Munoz-Noval, A.; Vazquez-Vega, D.; Hernandez-Jimenez, J.R.; Martinez-Madrid, M. Influence of corrosion on the Structural Stiffness of Reinforced Concrete Beams. Corrosion 2004, 60, 862–872. [Google Scholar] [CrossRef]
- Torres-Acosta, A.A.; Navarro-Gutierrez, S.; Teran-Guillen, J. Residual Flexure Capacity of Corroded Reinforced Concrete Beams. Eng. Struct. 2007, 29, 1145–1152. [Google Scholar] [CrossRef]
- Ahmad, S. Reinforcement corrosion in concrete structures, its monitoring and service life prediction—A review. Cem. Concr. Compos. 2003, 25, 459–471. [Google Scholar] [CrossRef]
- Ranjith, A.; Rao, K.B.; Manjunath, K. Evaluating the effect of corrosion on service life prediction of RC structures—A parametric review. Int. J. Sustain. Built Environ. 2016, 5, 587–603. [Google Scholar] [CrossRef] [Green Version]
- Imperatore, S.; Rinaldi, Z. Strength decay of RC sections for chloride attack. Int. J. Struct. Integr. 2016, 7, 194–212. [Google Scholar] [CrossRef]
- ABAQUS-6. 12-1 Standard User’s Manual; Hibbitt, Karlsson and Sorensen, Inc: Providence, RI, USA, 2012.
- Belletti, B.; Scolari, M.; Vecchi, F. PARC_CL 2.0 crack model for NLFEA of reinforced concrete structures under cyclic loadings. Comput. Struct. 2017, 191, 165–179. [Google Scholar] [CrossRef]
- Belletti, B.; Stocchi, A.; Scolari, M.; Vecchi, F. Validation of the PARC_CL 2.0 crack model for the assessment of the nonlinear behaviour of RC structures subjected to seismic action: SMART 2013 sharing table test simulation. Eng. Struct. 2017, 150, 759–773. [Google Scholar] [CrossRef]
- Belletti, B.; Muttoni, A.; Ravasini, S.; Vecchi, F. Parametric analysis on punching shear resistance of reinforced concrete continuous slab. Mag. Concr. Res. 2018, 71, 1083–1096. [Google Scholar] [CrossRef]
- Mansour, M.; Hsu, T.T.C. Behavior of Reinforced Concrete Elements under Cyclic Shear. I: Experiments. J. Struct. Eng. 2005, 131, 44–53. [Google Scholar] [CrossRef]
- Tuutti, K. Corrosion of Steel in Concrete; Swedish Cement and Concrete Research Institute: Stockholm, Sweden, 1982. [Google Scholar]
- Crete, D. Probabilistic Performance Based Durability Design of Concrete Structures: Statistical Quantification of the Variables in the Limit State Functions; Report No. BE 95-1347; The European Union—Brite EuRam III: Brussels, Belgium, 2000; pp. 62–63. [Google Scholar]
- Fluge, F. Marine Chlorides–A probabilistic approach to drive provisions for EN 206-1. In Proceedings of the Duranet 3rd Workshop-Service Life Design of Concrete Structures—From Theory to Standardization, Tromsø, Norway, Tromsø, Norway, 10–12 June 2001. [Google Scholar]
- Contecvet IN30902I. A Validated User’s Manual for Assessing the Residual Life of Concrete Structures; DG Enterprise, CEC: Tokyo, Japan, 2001.
- Chen, E.; Berrocal, C.G.; Fernandez, I.; Löfgren, I.; Lundgren, K. Assessment of the mechanical behaviour of reinforcement bars with localised pitting corrosion by Digital Image Correlation. Eng. Struct. 2020, 219, 110936. [Google Scholar] [CrossRef]
- Coronelli, D.; Gambarova, P. Compressive Behavior of Unconfined and Confined Clay Brick Masonry Compressive Behavior of Unconfined and Confined Clay. J. Struct. Eng. 2004, 130, 1214–1224. [Google Scholar] [CrossRef]
- He, W.; Wu, Y.F.; Liew, K.M. A fracture energy based constitutive model for the analysis of reinforced concrete structures under cyclic loading. Comput. Methods Appl. Mech. Eng. 2008, 197, 4745–4762. [Google Scholar] [CrossRef]
- Gambarova, P. Sulla trasmissione del taglio in elementi bidimensionali piani di c.a. fessurati. In Proceedings of the Giornate AICAP, Bari, Italy, 26–29 May 1983; pp. 141–156. (In Italian). [Google Scholar]
- Vecchio, F.J.; Collins, M.P. Compression Response of Cracked Reinforced Concrete. J. Struct. Eng. 1993, 119, 3590–3610. [Google Scholar] [CrossRef]
- Menegotto, M.; Pinto, P.E. Method of Analysis for Cyclically Loaded R. C. Plane Frames Including Changes in Geometry and Non-Elastic Behavior of Elements under Combined Normal Force and Bending. In Symposium on Resistance and Ultimate Deformability of Structures Acted on by Well Defined Repeated Loads; IABSE: Lisbon, Portugal, 1973; pp. 15–22. [Google Scholar]
- Monti, G.; Nuti, C. Nonlinear Cyclic Behavior of Reinforcing Bars Including Buckling. J. Struct. Eng. 1992, 118, 3268–3284. [Google Scholar] [CrossRef]
- Kashani, M.M.; Lowes, L.N.; Crewe, A.J.; Alexander, N.A. Phenomenological hysteretic model for corroded reinforcing bars including inelastic buckling and low-cycle fatigue degradation. Comput. Struct. 2015, 156, 58–71. [Google Scholar] [CrossRef] [Green Version]
- Belletti, B.; Damoni, C.; Gasperi, A. Modeling approaches suitable for pushover analyses of RC structural wall buildings. Eng. Struct. 2013, 57, 327–338. [Google Scholar] [CrossRef]
- Belletti, B.; Esposito, R.; Walraven, J. Shear Capacity of Normal, Lightweight, and High-Strength Concrete Beams according to Model Code 2010. II: Experimental Results versus Nonlinear Finite Element Program Results. J. Struct. Eng. 2013, 139, 1600–1607. [Google Scholar] [CrossRef]
- Belletti, B.; Cerioni, R.; Iori, I. Physical Approach for Reinforced-Concrete (PARC) Membrane Elements. J. Struct. Eng. 2001, 127, 1412–1426. [Google Scholar] [CrossRef]
- Walraven, J.; Belletti, B.; Esposito, R. Shear Capacity of Normal, Lightweight, and High-Strength Concrete Beams according to Model Code 2010. I: Experimental Results versus Analytical Model Results. J. Struct. Eng. 2013, 139, 1593–1599. [Google Scholar] [CrossRef]
- CEN. European Standard: EN-206: Concrete-Specification, Performance, Production and Conformity; CEN: Brussels, Belgium, 2014. [Google Scholar]
- Collepardi, M.; Marcialis, A.; Turriziani, R. Penetration of Chloride Ions into Cement Pastes and Concretes. J. Am. Ceram. Soc. 1972, 55, 534–535. [Google Scholar] [CrossRef]
- Alonso, C.; Andrade, C.; Castellote, M.; Castro, P. Chloride threshold values to depassivate reinforcing bars embedded in a standardized OPC mortar. Cem. Concr. Res. 2000, 30, 1047–1055. [Google Scholar] [CrossRef]
- Val, D.V.; Melchers, E.R. Reliability of Deteriorating RC Slab Bridges. J. Struct. Eng. 1997, 123, 1638–1644. [Google Scholar] [CrossRef]
- Val, D.V. Deterioration of Strength of RC Beams due to Corrosion and Its Influence on Beam Reliability. J. Struct. Eng. 2007, 133, 1297–1306. [Google Scholar] [CrossRef]
- Xia, J.; Jin, W.L. Prediction of corrosion-induced crack width of corroded reinforced concrete structures. In Proceedings of the 4th International Conference on the Durability of Concrete Structures, Purdue University, West Lafayette, IN, USA, 24–26 July 2014; pp. 146–154. [Google Scholar] [CrossRef] [Green Version]
- Vidal, T.; Castel, A.; François, R. Analyzing crack width to predict corrosion in reinforced concrete. Cem. Concr. Res. 2004, 34, 165–174. [Google Scholar] [CrossRef]
- Jiang, C.; Wu, Y.F.; Dai, M.J. Degradation of steel-to-concrete bond due to corrosion. Constr. Build. Mater. 2018, 158, 1073–1080. [Google Scholar] [CrossRef]
- Li, D.; Wei, R.; Li, L.; Guan, X.; Mi, X. Pitting corrosion of reinforcing steel bars in chloride contaminated concrete. Constr. Build. Mater. 2019, 199, 359–368. [Google Scholar] [CrossRef]
Figure 1.
Plane stress state of a RC element and crack pattern.
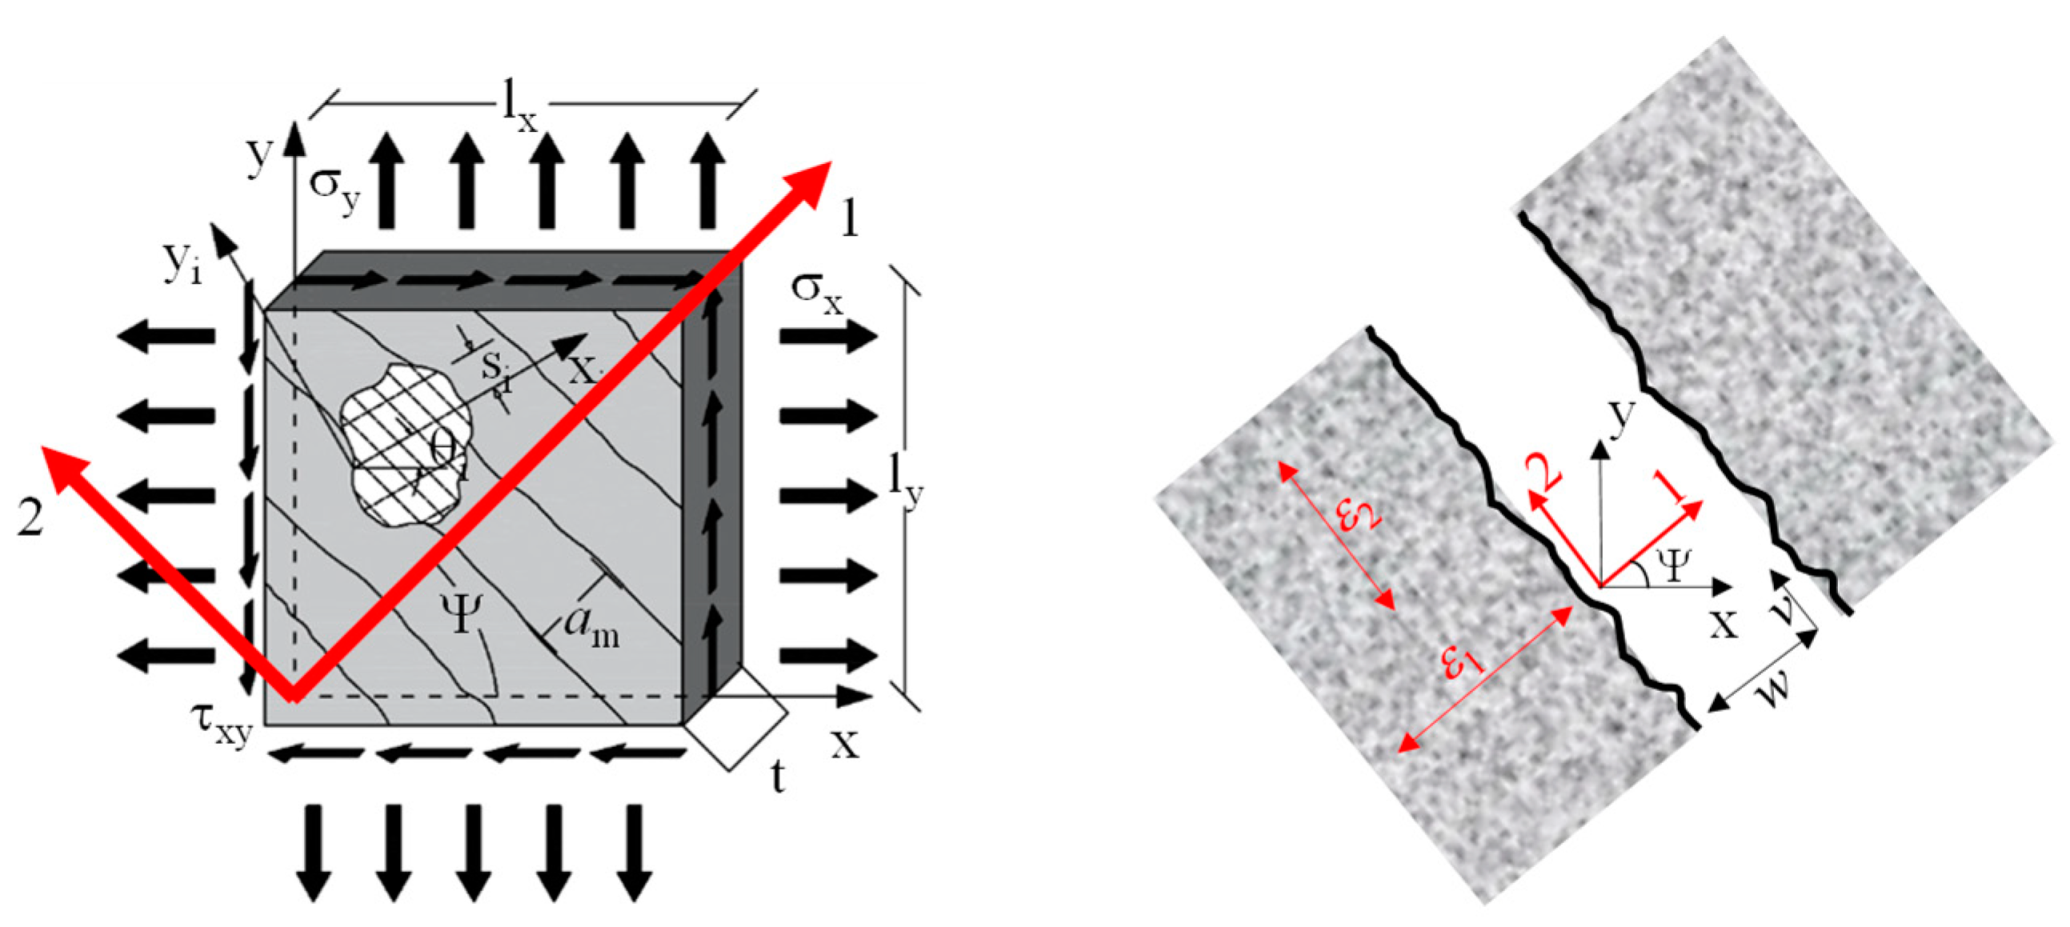
Figure 2.
Model validation by modelling uncorroded RC panels: (a) panel CE3 and (b) panel CA4.
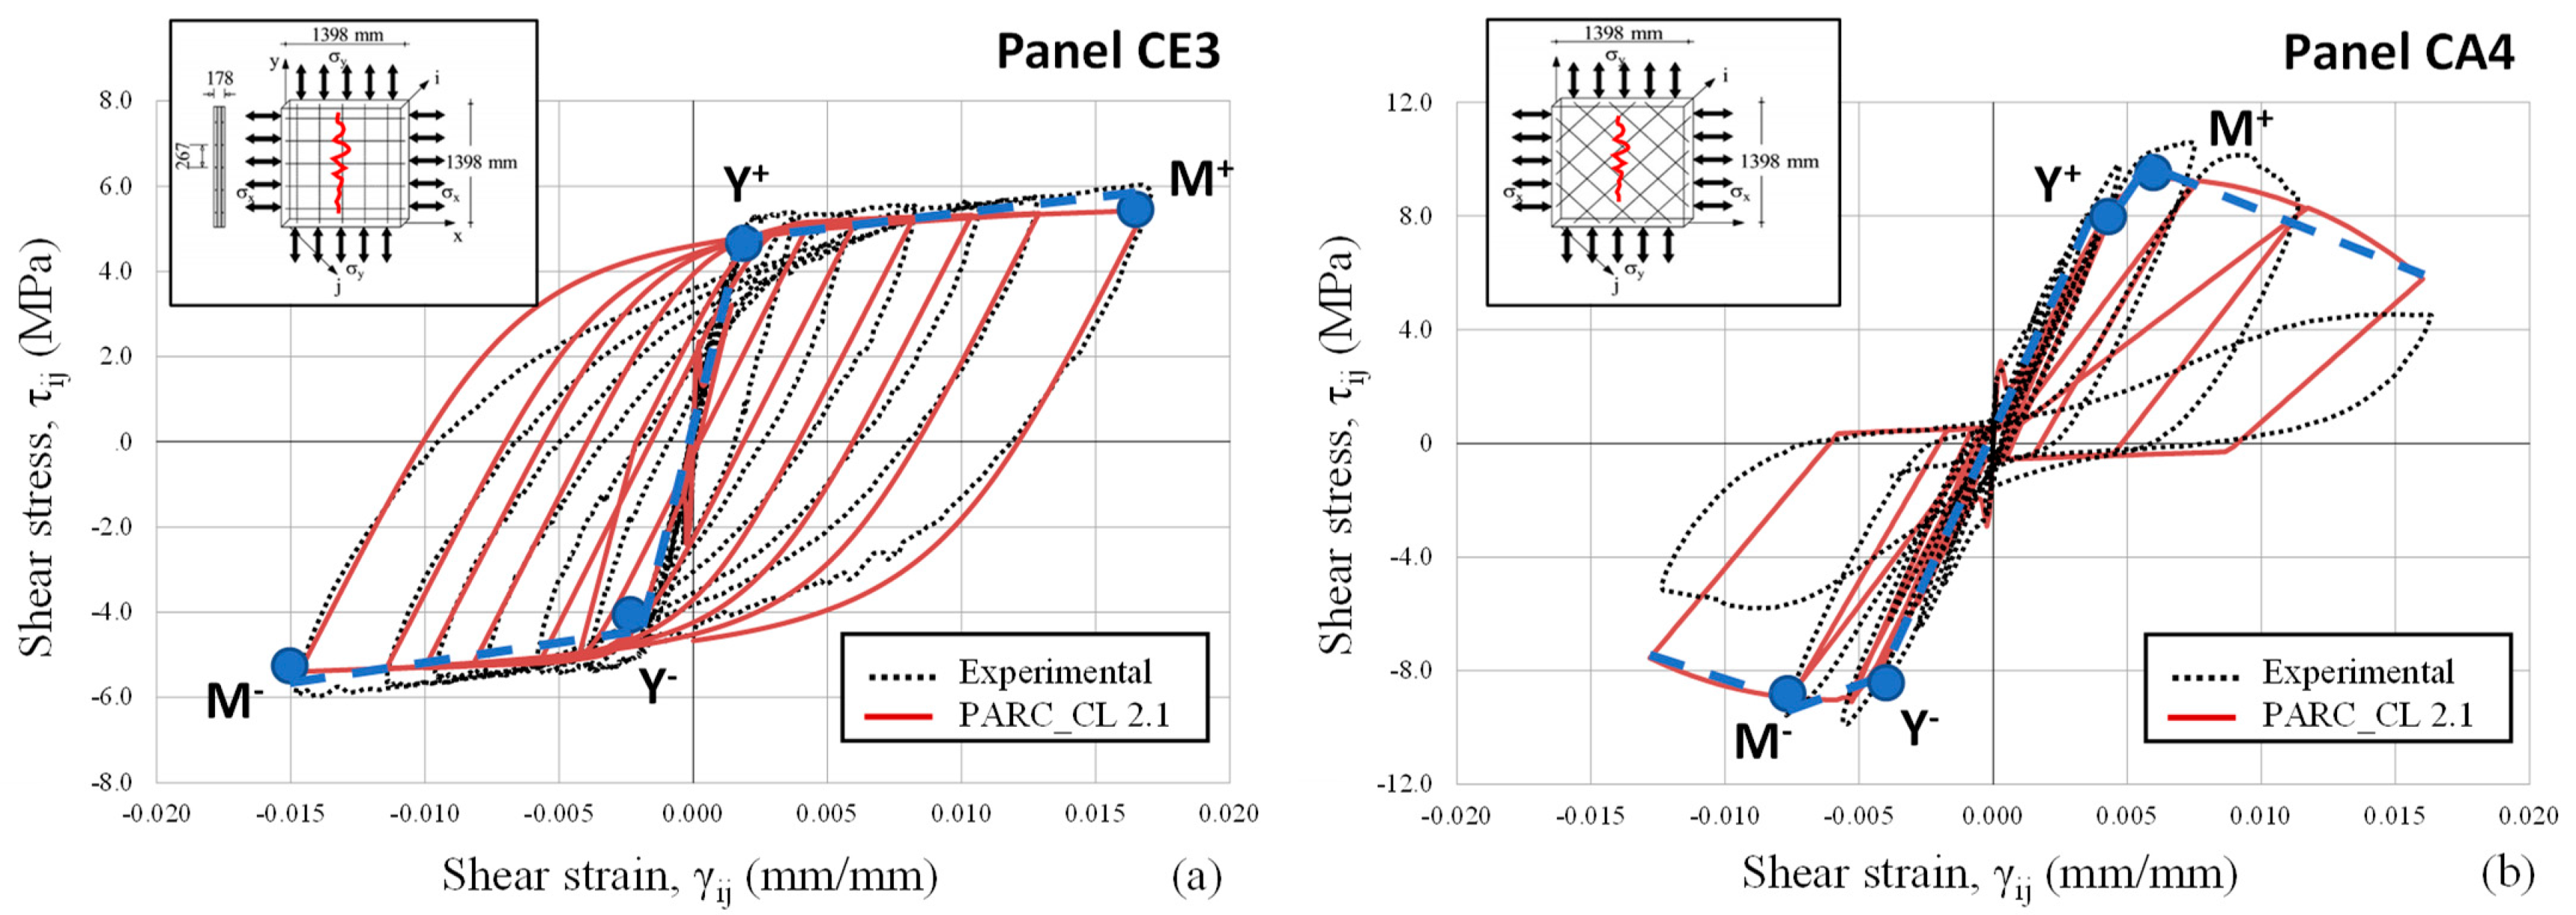
Figure 3.
Chloride content, C(x,t), at depth x (thickness of concrete cover) versus time.
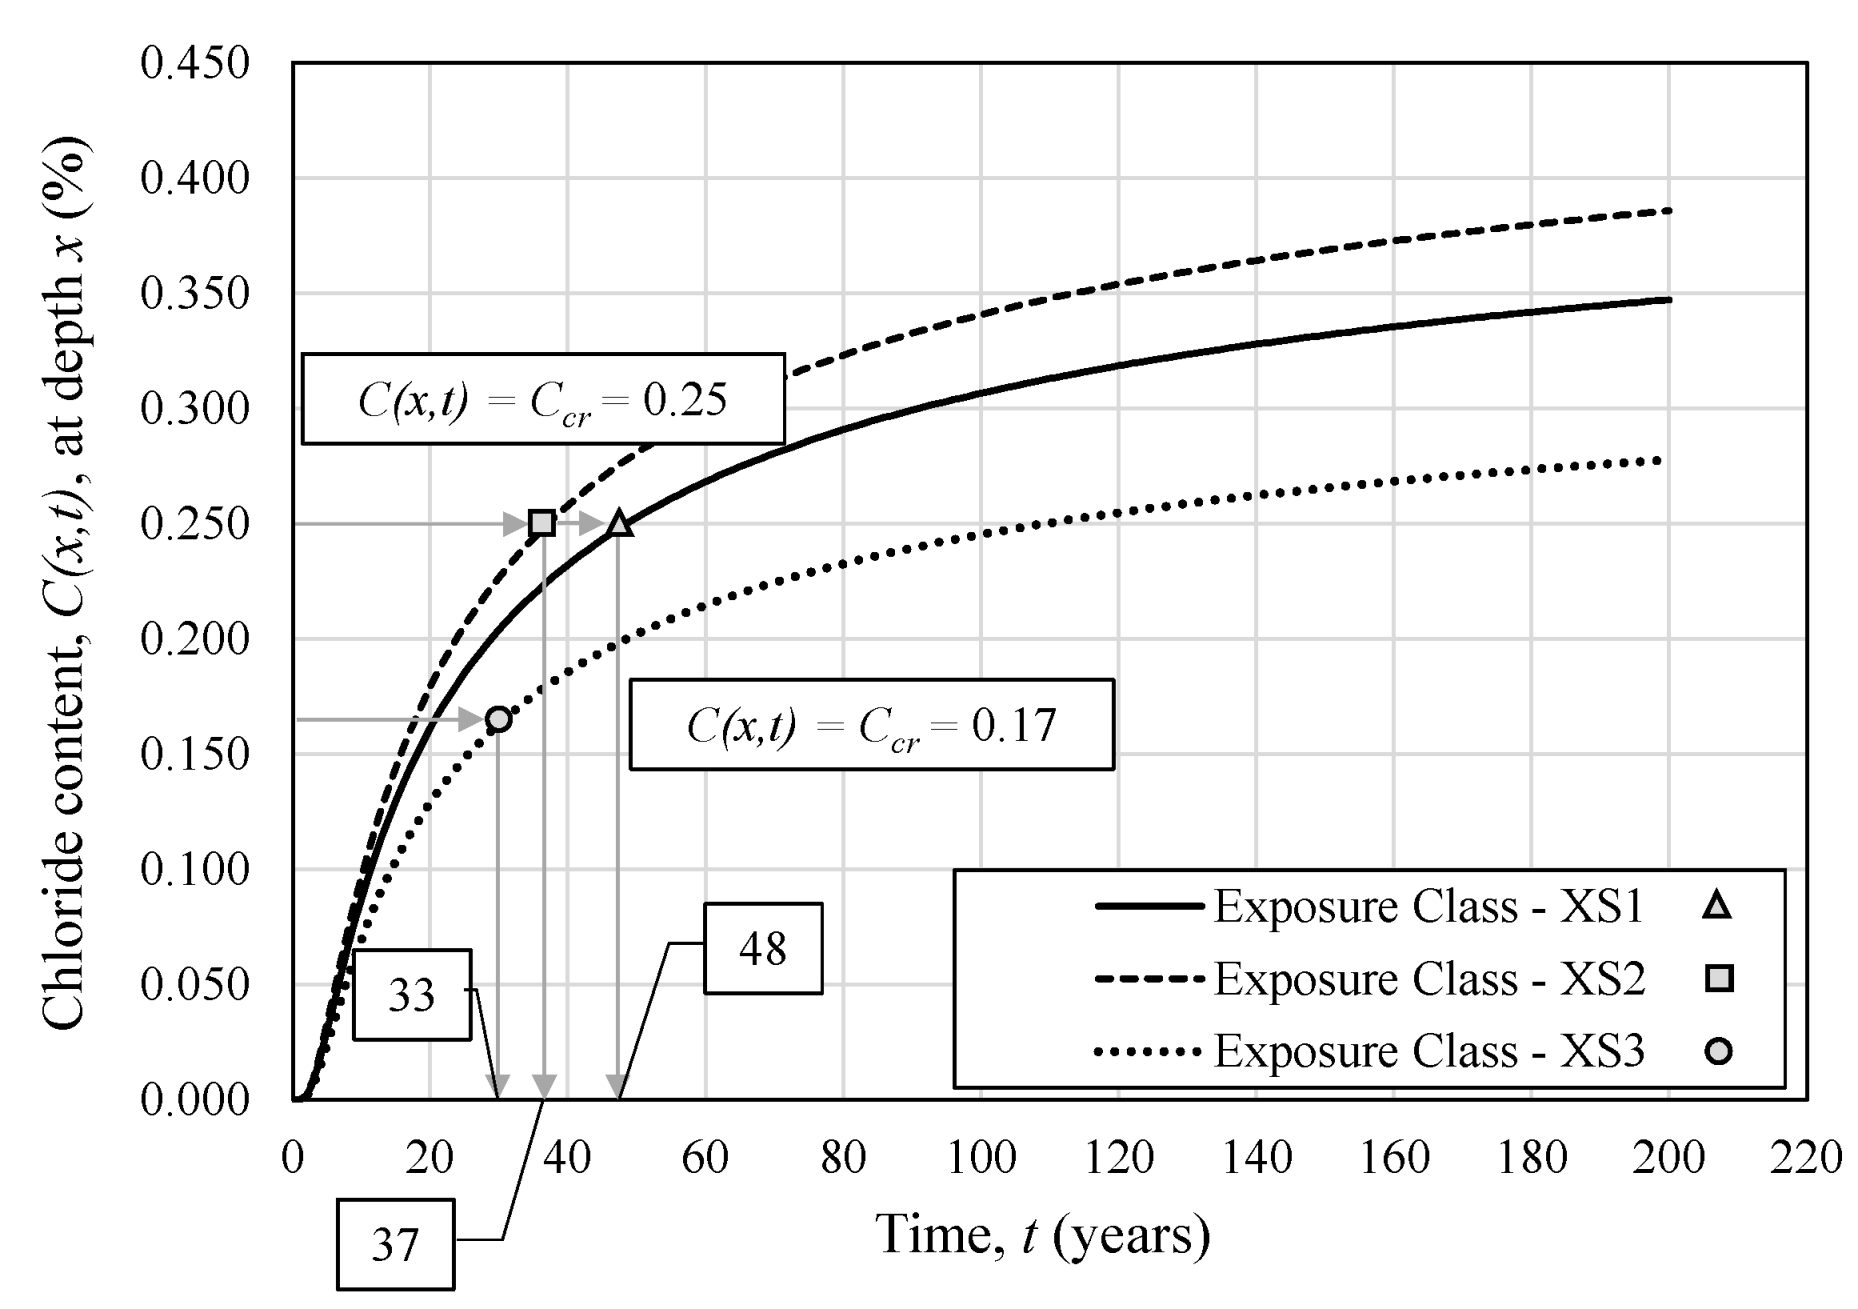
Figure 4.
Stress–strain behavior of corroded rebar as a function of corrosion deterioration.

Figure 5.
Force–strain curves over time of panel CE3 for the exposure class: (a) XS1, (b) XS2, and (c) XS3.
Figure 5.
Force–strain curves over time of panel CE3 for the exposure class: (a) XS1, (b) XS2, and (c) XS3.

Figure 6.
Critical points identification on hysteretic loops: (a) panel CE3 and (b) panel CA4.
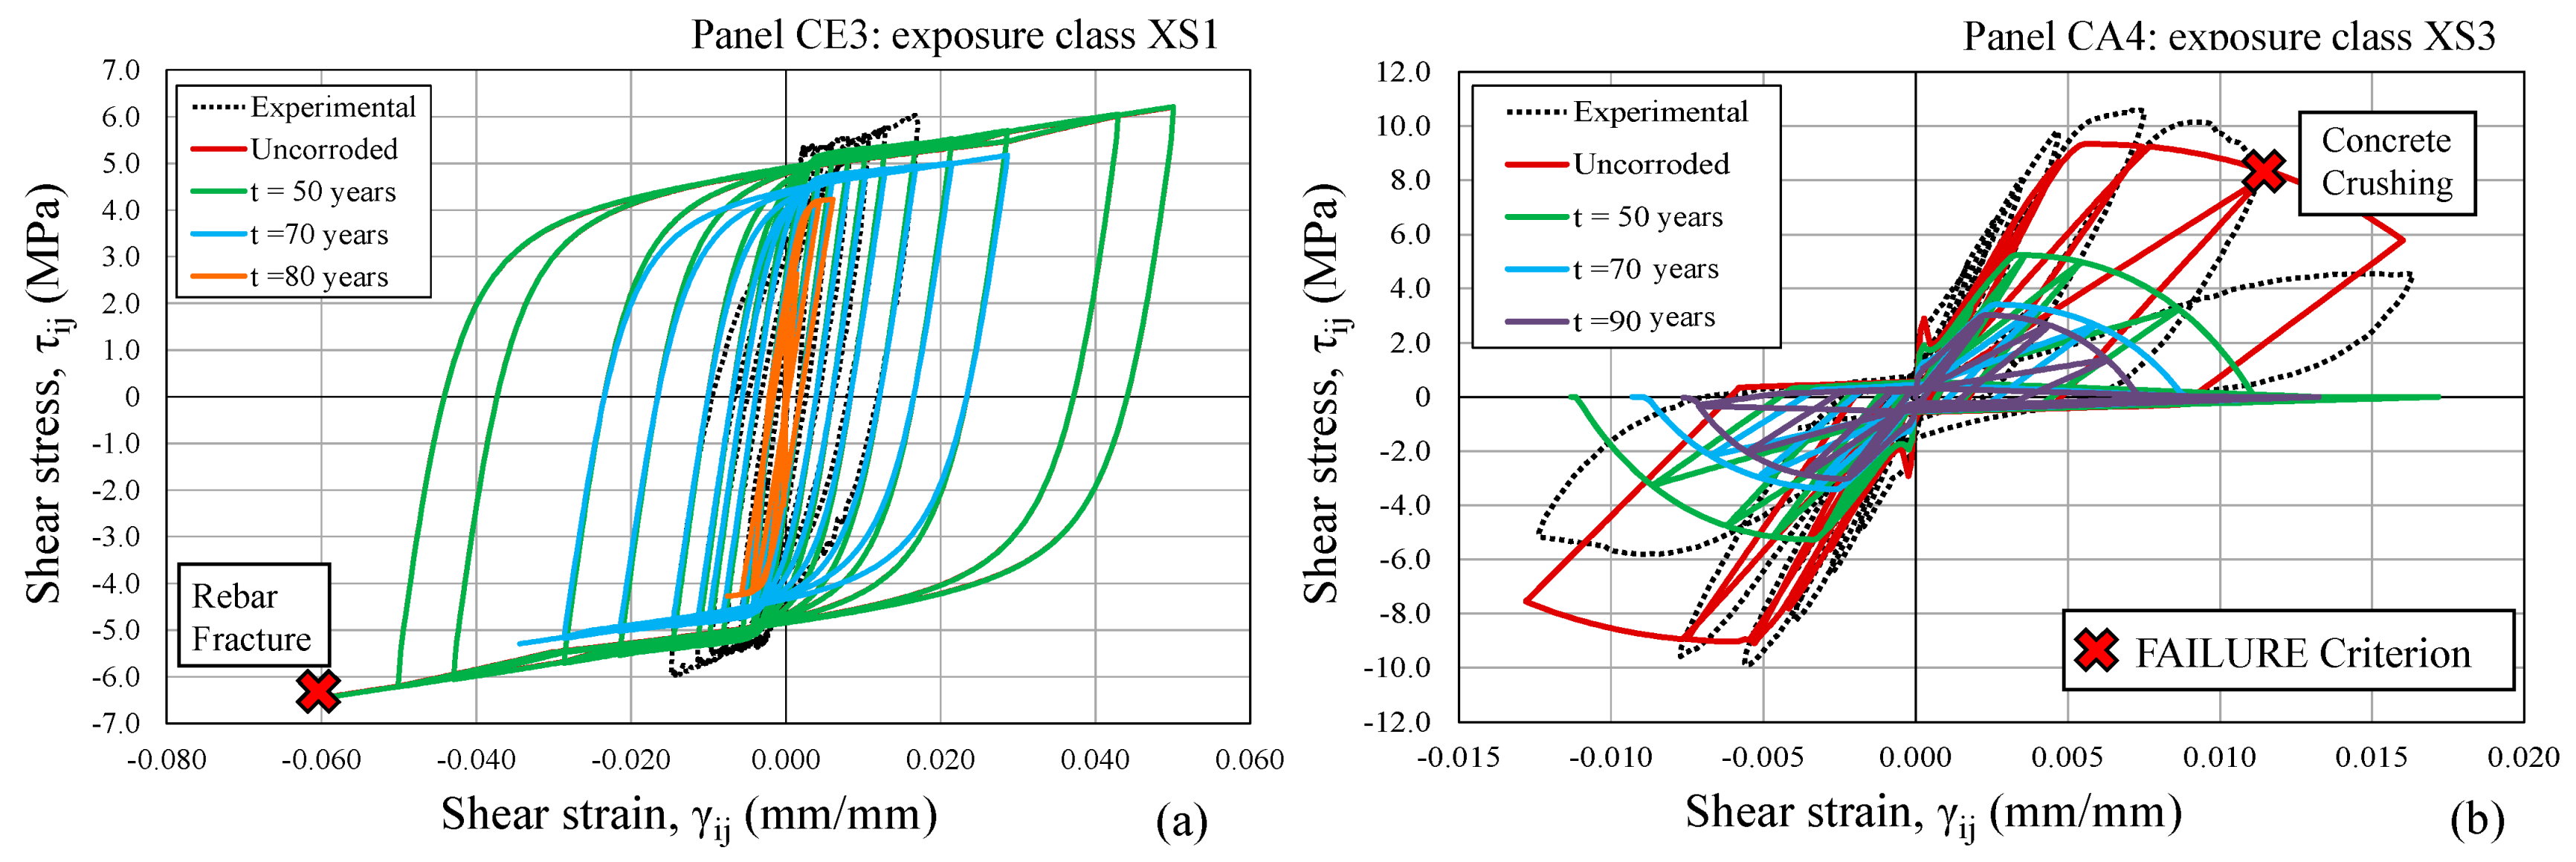
Figure 7.
Maximum shear stress, τmax, percentage reduction over time for different exposure classes: (a) panel CE3 and (b) panel CA4.
Figure 7.
Maximum shear stress, τmax, percentage reduction over time for different exposure classes: (a) panel CE3 and (b) panel CA4.
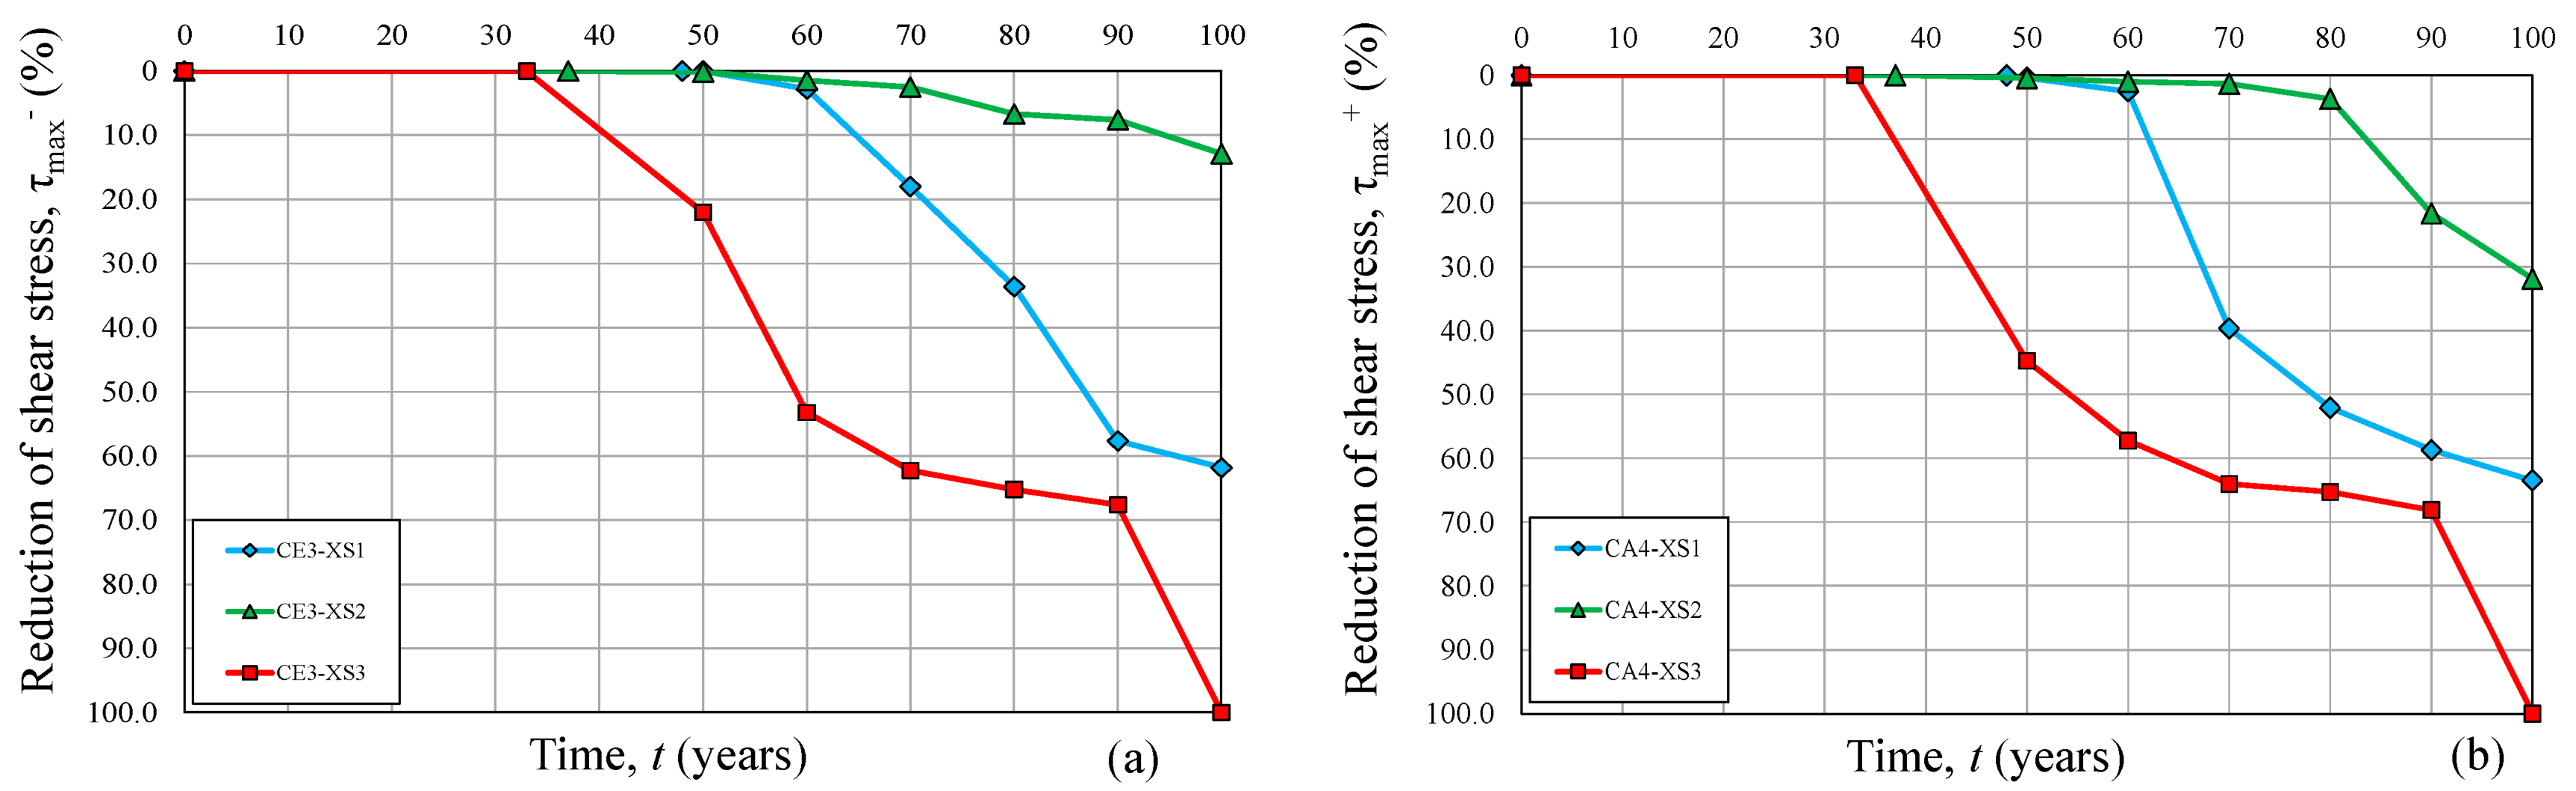
Figure 8.
Evaluation of the ductility, μp, reduction over time for different exposure classes: (a) panel CE3, and (b) panel CA4.
Figure 8.
Evaluation of the ductility, μp, reduction over time for different exposure classes: (a) panel CE3, and (b) panel CA4.
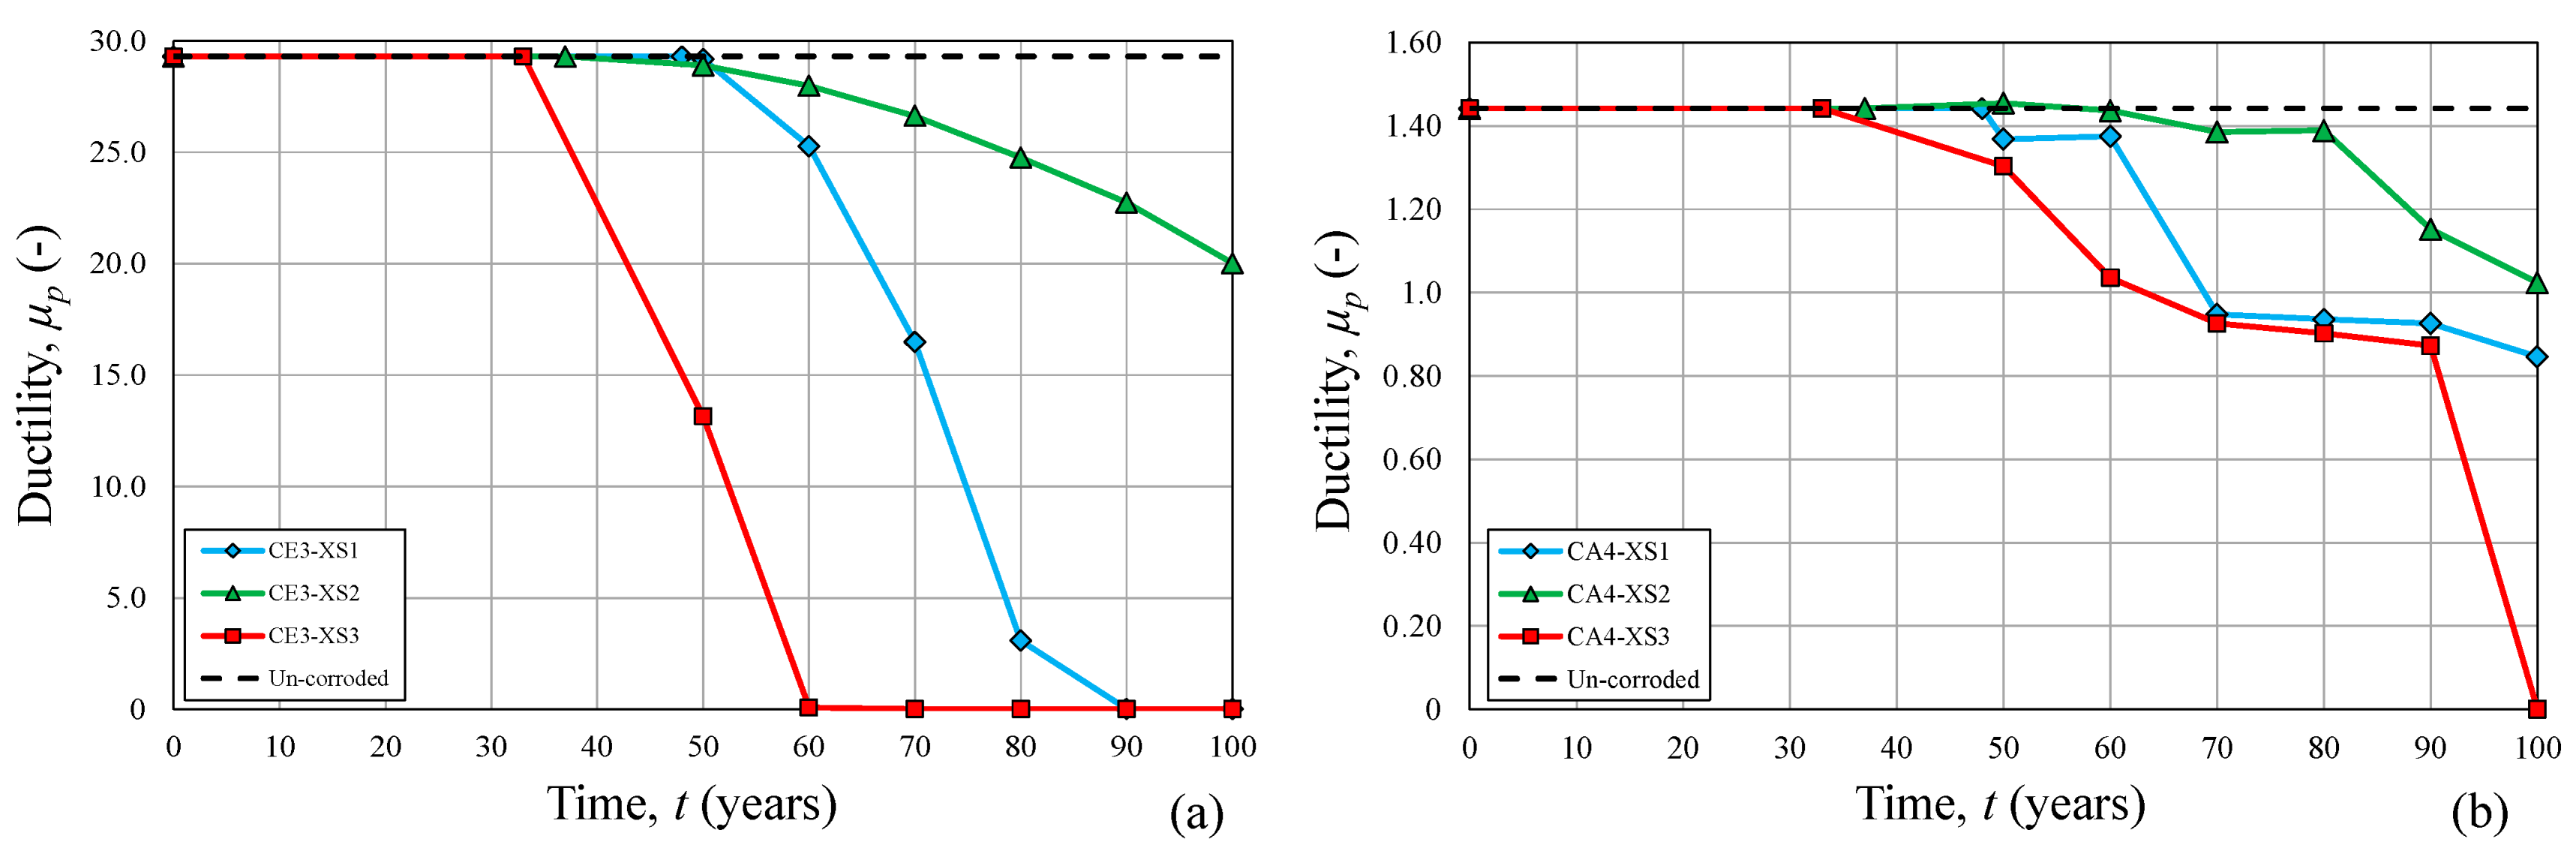
Figure 9.
Positive pre-yield shear stiffness, Kγ+, reduction over time for different exposure classes in case of panel CE3: (a) exposure class XS2, and (b) exposure class XS3.
Figure 9.
Positive pre-yield shear stiffness, Kγ+, reduction over time for different exposure classes in case of panel CE3: (a) exposure class XS2, and (b) exposure class XS3.
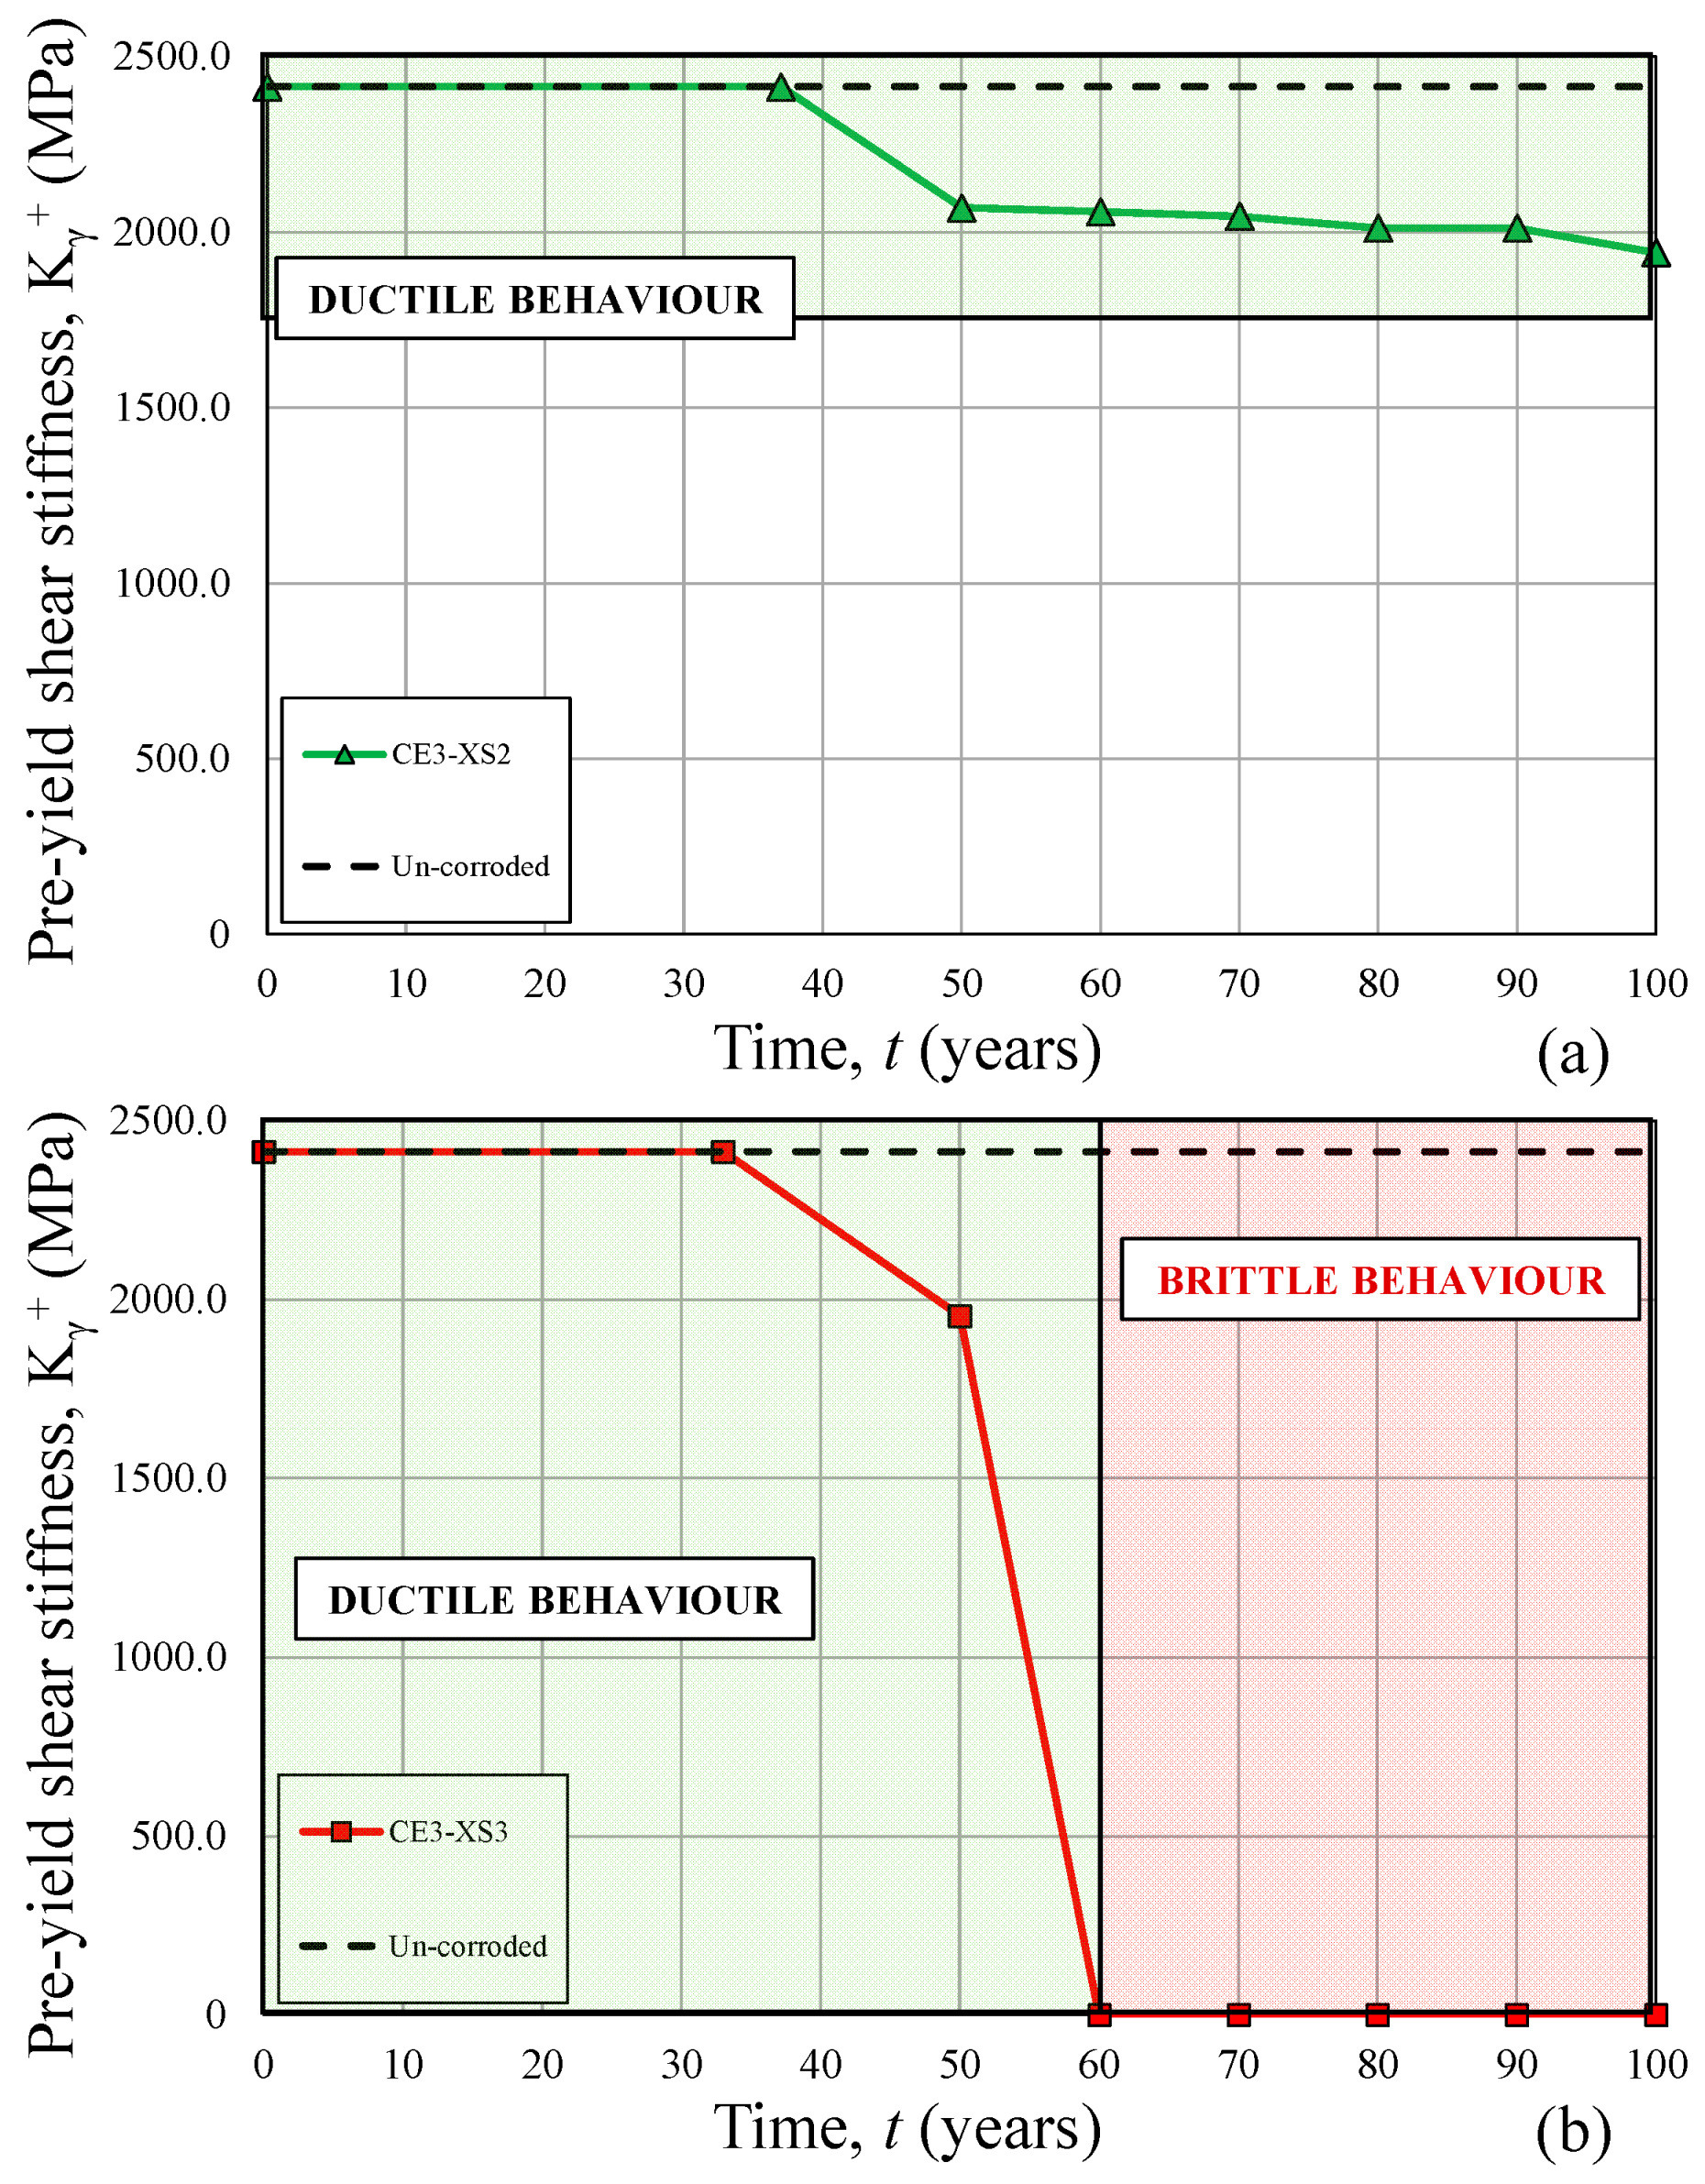
Table 1.
Uncorroded mechanical properties of reinforcements and concrete.
| Rebar Diameter, D0 (mm) | fy0 (MPa) | εy0 (-) | fu0 (MPa) | εu0 (-) |
| 19.00 | 425.40 | 0.002127 | 541.15 | 0.06 |
| 25.00 | 453.40 | 0.002267 | 568.87 | 0.06 |
| Panel | CE3 | CA4 | ||
| Ratio of longitudinal tension reinforcement, ρ | 0.012 | 0.027 | ||
| Cylinder compressive strength of concrete, fc0 | 50.00 | 45.00 | ||
| Concrete strain at maximum compressive stress, εc0 | 0.0024 | 0.0028 |
Table 2.
Input parameters and initiation period for different exposure classes.
| Exposure Classes | XS1 | XS2 | XS3 |
|---|---|---|---|
| Achieved surface chloride content, Csa (%), [19,20] | 0.45 | 0.50 | 0.36 |
| Critical chloride content, Ccr (%) | 0.25 | 0.25 | 0.17 |
| Initiation period–Depassivation time, ti (years) | 48 | 37 | 33 |
Table 3.
Maximum penetration depth and cross-sectional loss over time for the exposure classes analyzed.
Table 3.
Maximum penetration depth and cross-sectional loss over time for the exposure classes analyzed.
| Exposure Class | Parameters | Time of Analysis (Years) | |||||
|---|---|---|---|---|---|---|---|
| 50 | 60 | 70 | 80 | 90 | 100 | ||
| XS1 | Ppit(tp) (mm) | 0.39 | 2.37 | 4.34 | 6.31 | 8.28 | 10.25 |
| μmax (%) (D0 = 19 mm) | 0.09 | 2.93 | 9.40 | 18.88 | 30.78 | 44.41 | |
| μmax (%) (D0 = 25 mm) | 0.05 | 1.66 | 5.37 | 10.94 | 18.12 | 26.65 | |
| XS2 | Ppit(tp) (mm) | 0.75 | 1.33 | 1.91 | 2.49 | 3.07 | 3.65 |
| μmax (%) (D0 = 19 mm) | 0.31 | 0.95 | 1.94 | 3.25 | 4.87 | 6.78 | |
| μmax (%) (D0 = 25 mm) | 0.17 | 0.54 | 1.09 | 1.83 | 2.76 | 3.86 | |
| XS3 | Ppit(tp) (mm) | 4.93 | 7.83 | 10.73 | 13.63 | 16.50 | 19.43 |
| μmax (%) (D0 = 19 mm) | 11.95 | 27.87 | 47.87 | 69.67 | 89.57 | 100.00 | |
| μmax (%) (D0 = 25 mm) | 6.86 | 16.35 | 28.87 | 43.54 | 59.32 | 78.71 | |
Table 4.
Reduced compressive strength of concrete over time for the two RC panels analyzed.
| Exposure Class | Corroded RC Panels | Time of Analysis (Years) | |||||
|---|---|---|---|---|---|---|---|
| 50 | 60 | 70 | 80 | 90 | 100 | ||
| XS1 | CE3 | 50.00 | 49.71 | 45.10 | 42.75 | 41.28 | 40.29 |
| CA4 | 45.00 | 45.00 | 24.33 | 18.94 | 16.39 | 14.89 | |
| XS2 | CE3 | 50.00 | 50.00 | 50.00 | 49.27 | 47.59 | 46.30 |
| CA4 | 45.00 | 45.00 | 45.00 | 42.85 | 33.23 | 28.06 | |
| XS3 | CE3 | 44.26 | 41.57 | 40.09 | 39.24 | 38.90 | 37.30 |
| CA4 | 22.15 | 16.85 | 14.61 | 13.38 | 12.63 | 12.12 | |
Table 5.
Critical NLFEA points for uncorroded specimens (CE3 and CA4).
| Sample ID | τmax+ (MPa) | γmax+ (mm/mm) | τmax− (MPa) | γmax− (mm/mm) | Kγ + (MPa) | Kγ − (MPa) |
|---|---|---|---|---|---|---|
| CE3 | 6.22 | 0.0501 | −6.45 | −0.0600 | 2414 | 2576 |
| CA4 | 10.54 | 0.0075 | −10.2 | −0.0077 | 1791 | 1804 |
Publisher’s Note: MDPI stays neutral with regard to jurisdictional claims in published maps and institutional affiliations. |
© 2021 by the authors. Licensee MDPI, Basel, Switzerland. This article is an open access article distributed under the terms and conditions of the Creative Commons Attribution (CC BY) license (https://creativecommons.org/licenses/by/4.0/).
Share and Cite
MDPI and ACS Style
Franceschini, L.; Vecchi, F.; Belletti, B. The PARC_CL 2.1 Crack Model for NLFEA of Reinforced Concrete Elements Subjected to Corrosion Deterioration. Corros. Mater. Degrad. 2021, 2, 474-492. https://doi.org/10.3390/cmd2030025
AMA Style
Franceschini L, Vecchi F, Belletti B. The PARC_CL 2.1 Crack Model for NLFEA of Reinforced Concrete Elements Subjected to Corrosion Deterioration. Corrosion and Materials Degradation. 2021; 2(3):474-492. https://doi.org/10.3390/cmd2030025
Chicago/Turabian StyleFranceschini, Lorenzo, Francesca Vecchi, and Beatrice Belletti. 2021. "The PARC_CL 2.1 Crack Model for NLFEA of Reinforced Concrete Elements Subjected to Corrosion Deterioration" Corrosion and Materials Degradation 2, no. 3: 474-492. https://doi.org/10.3390/cmd2030025