Effectiveness of Visual vs. Acoustic Closed-Loop Stimulation on EEG Power Density during NREM Sleep in Humans


 and
and
Abstract
:1. Introduction
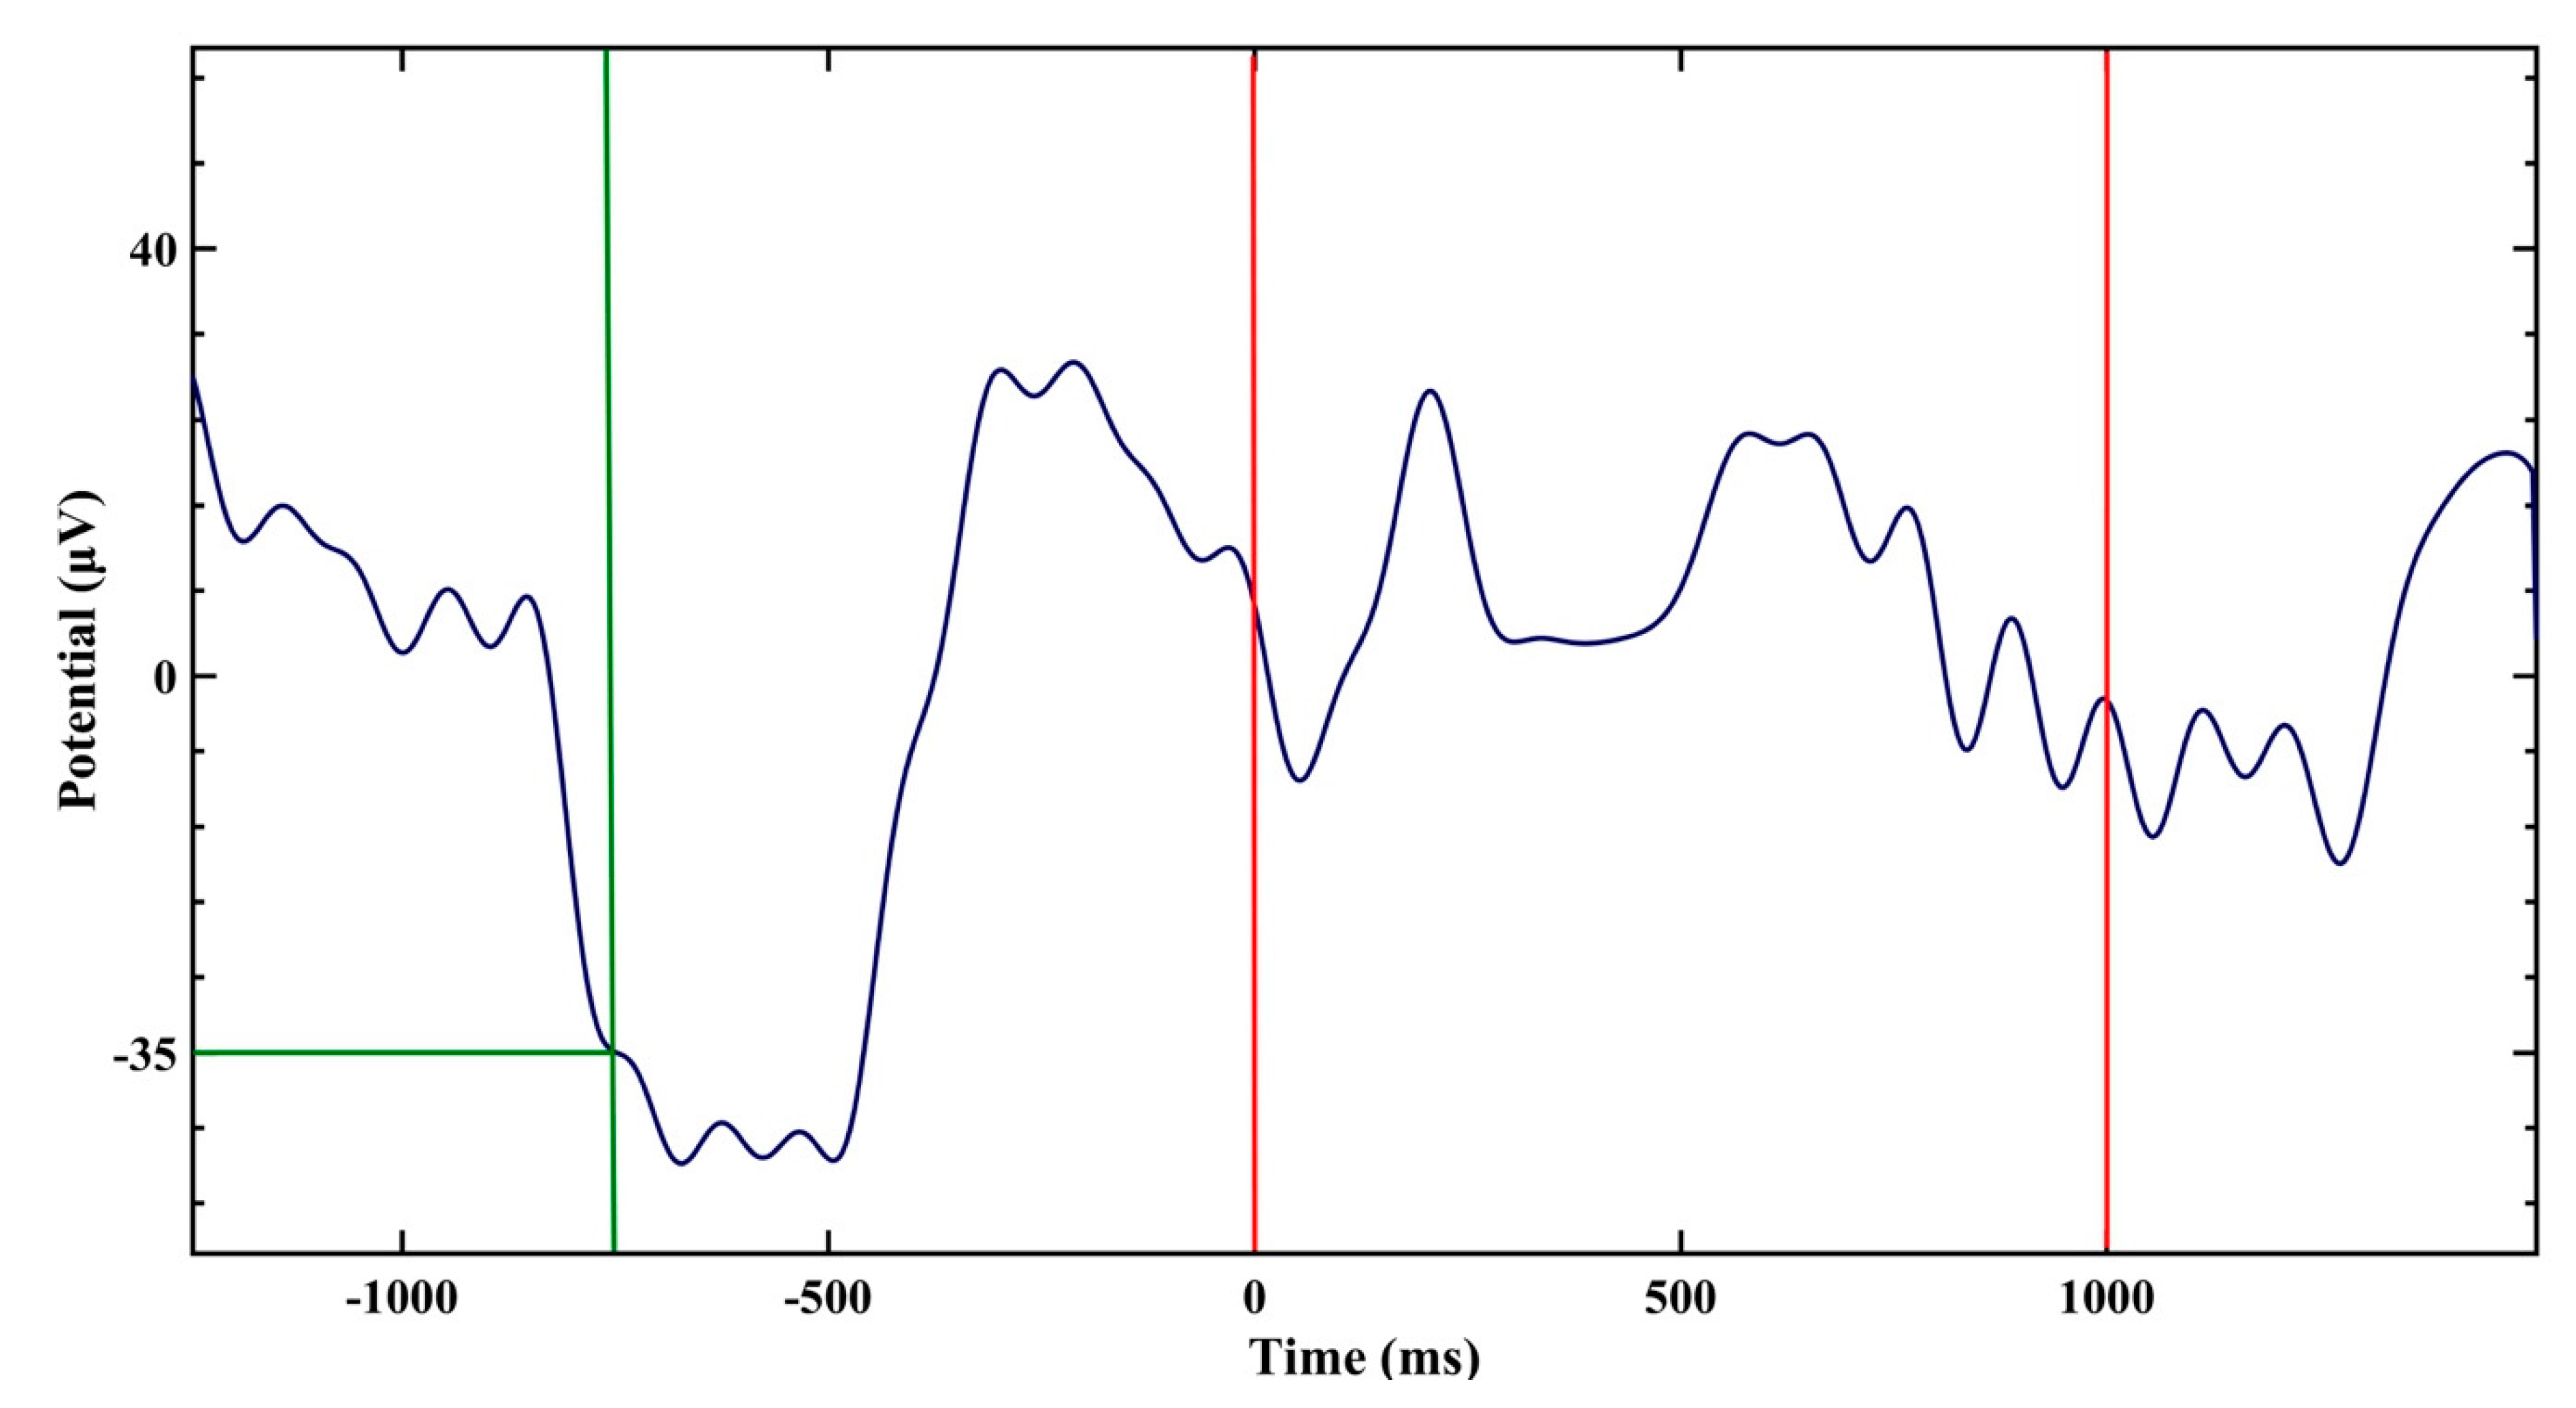
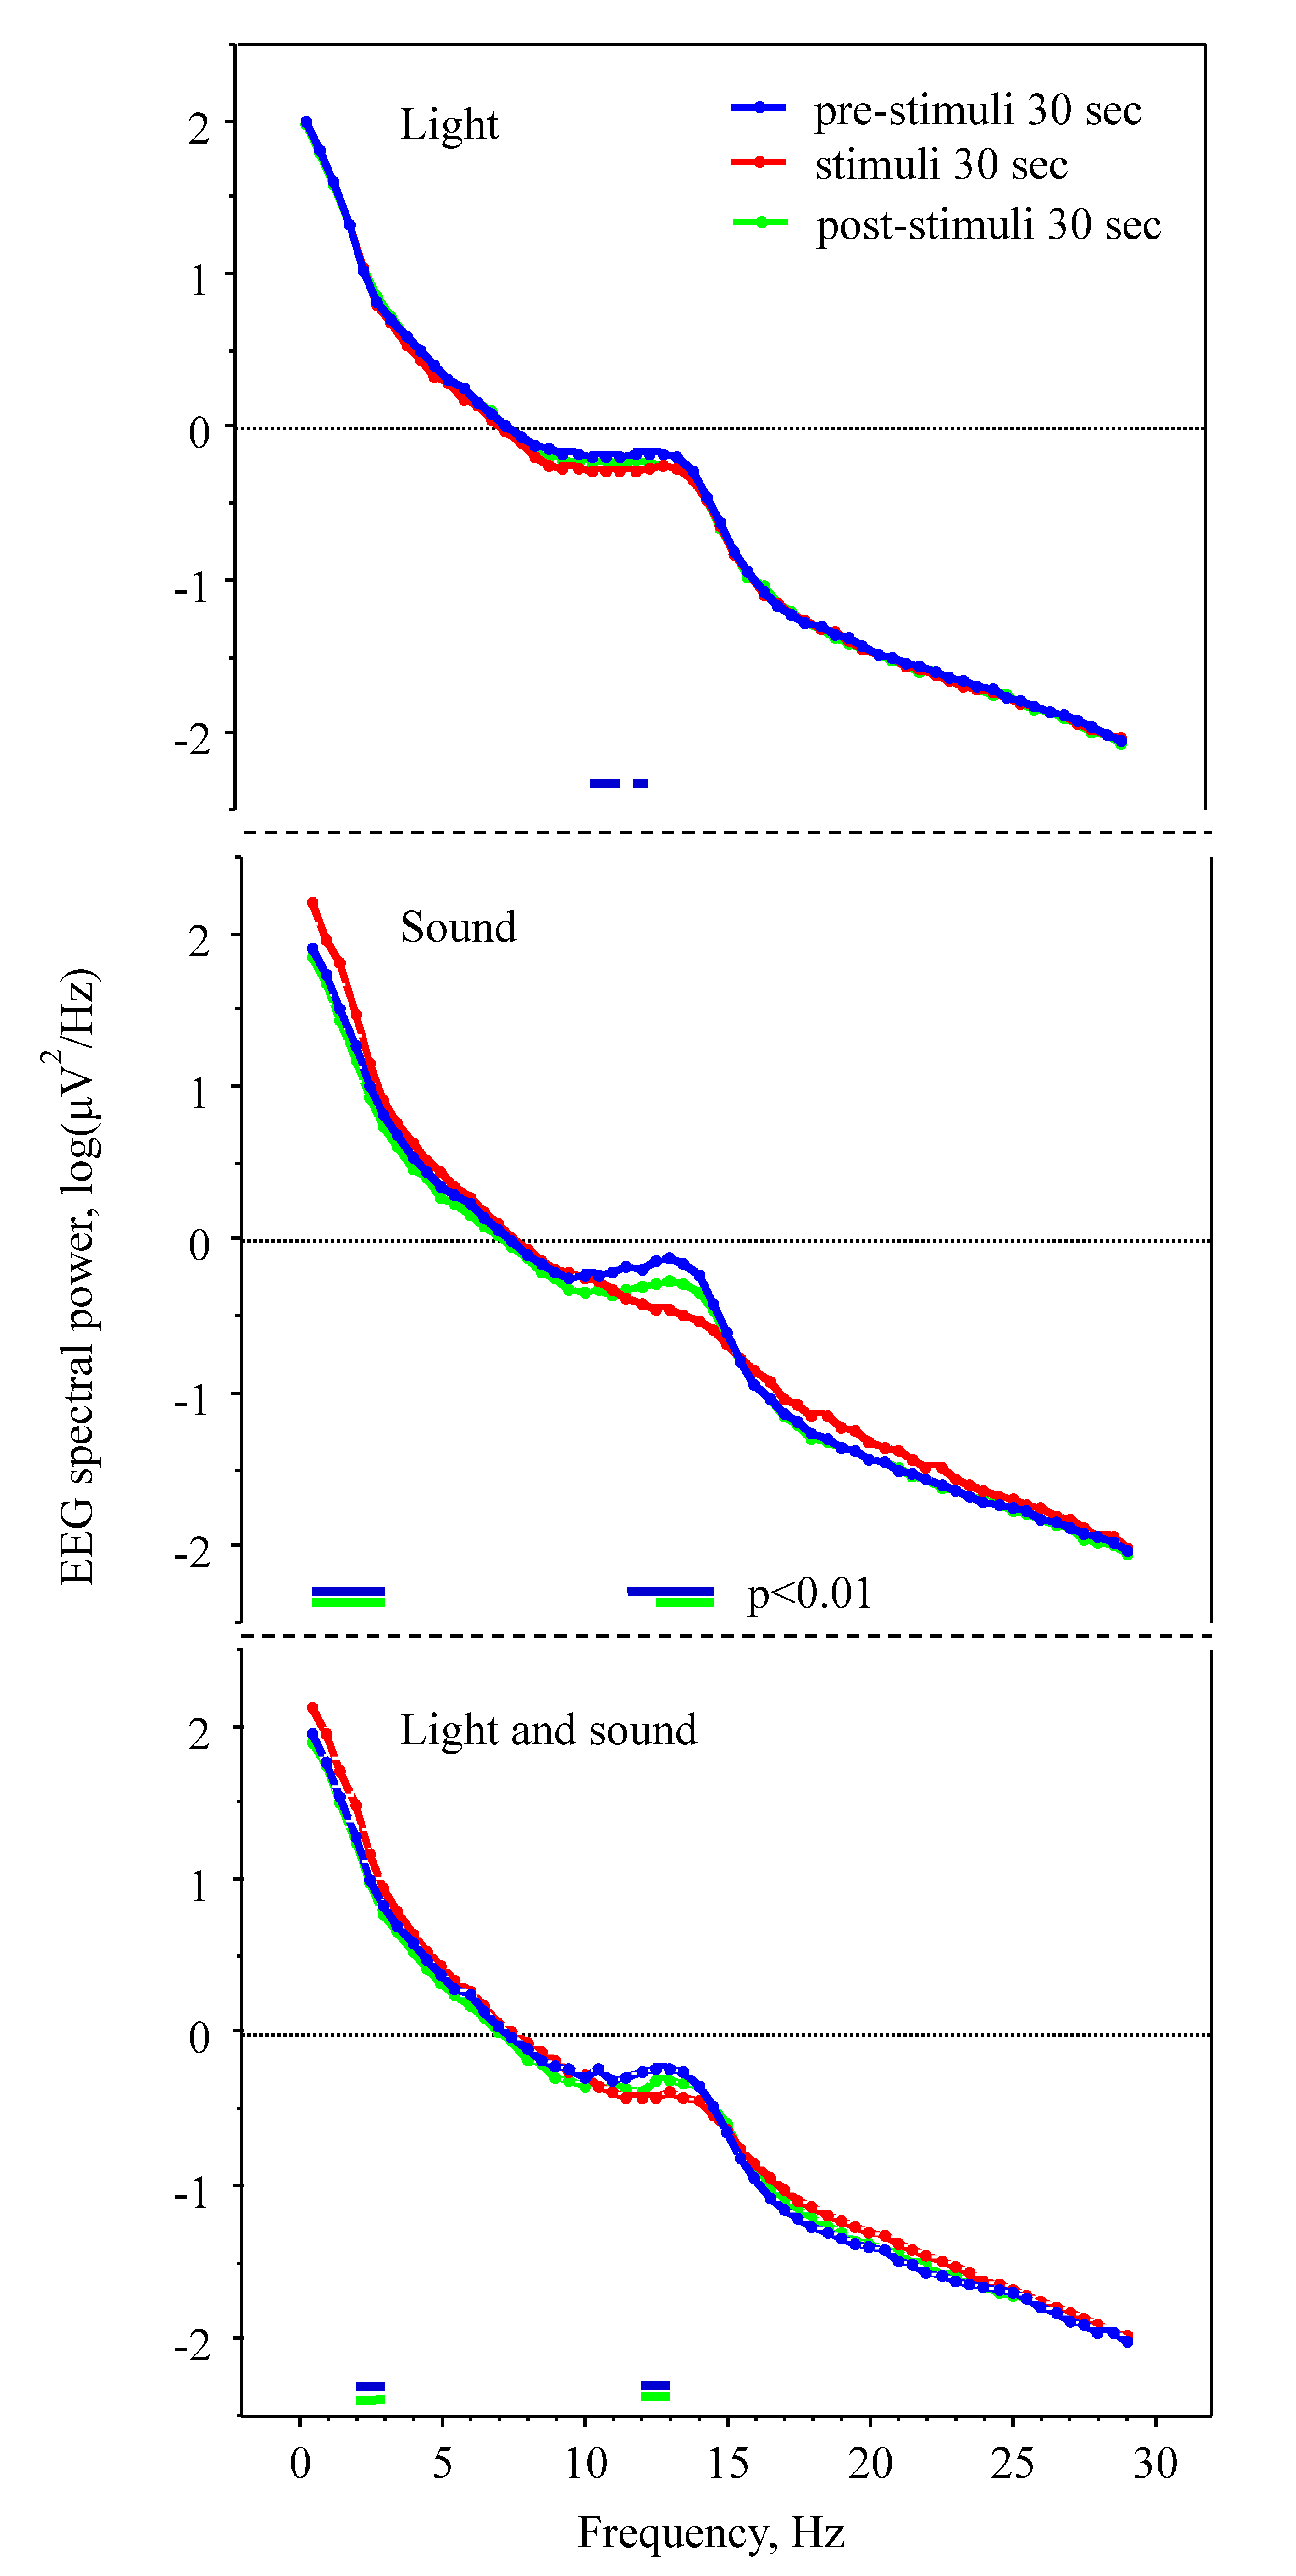
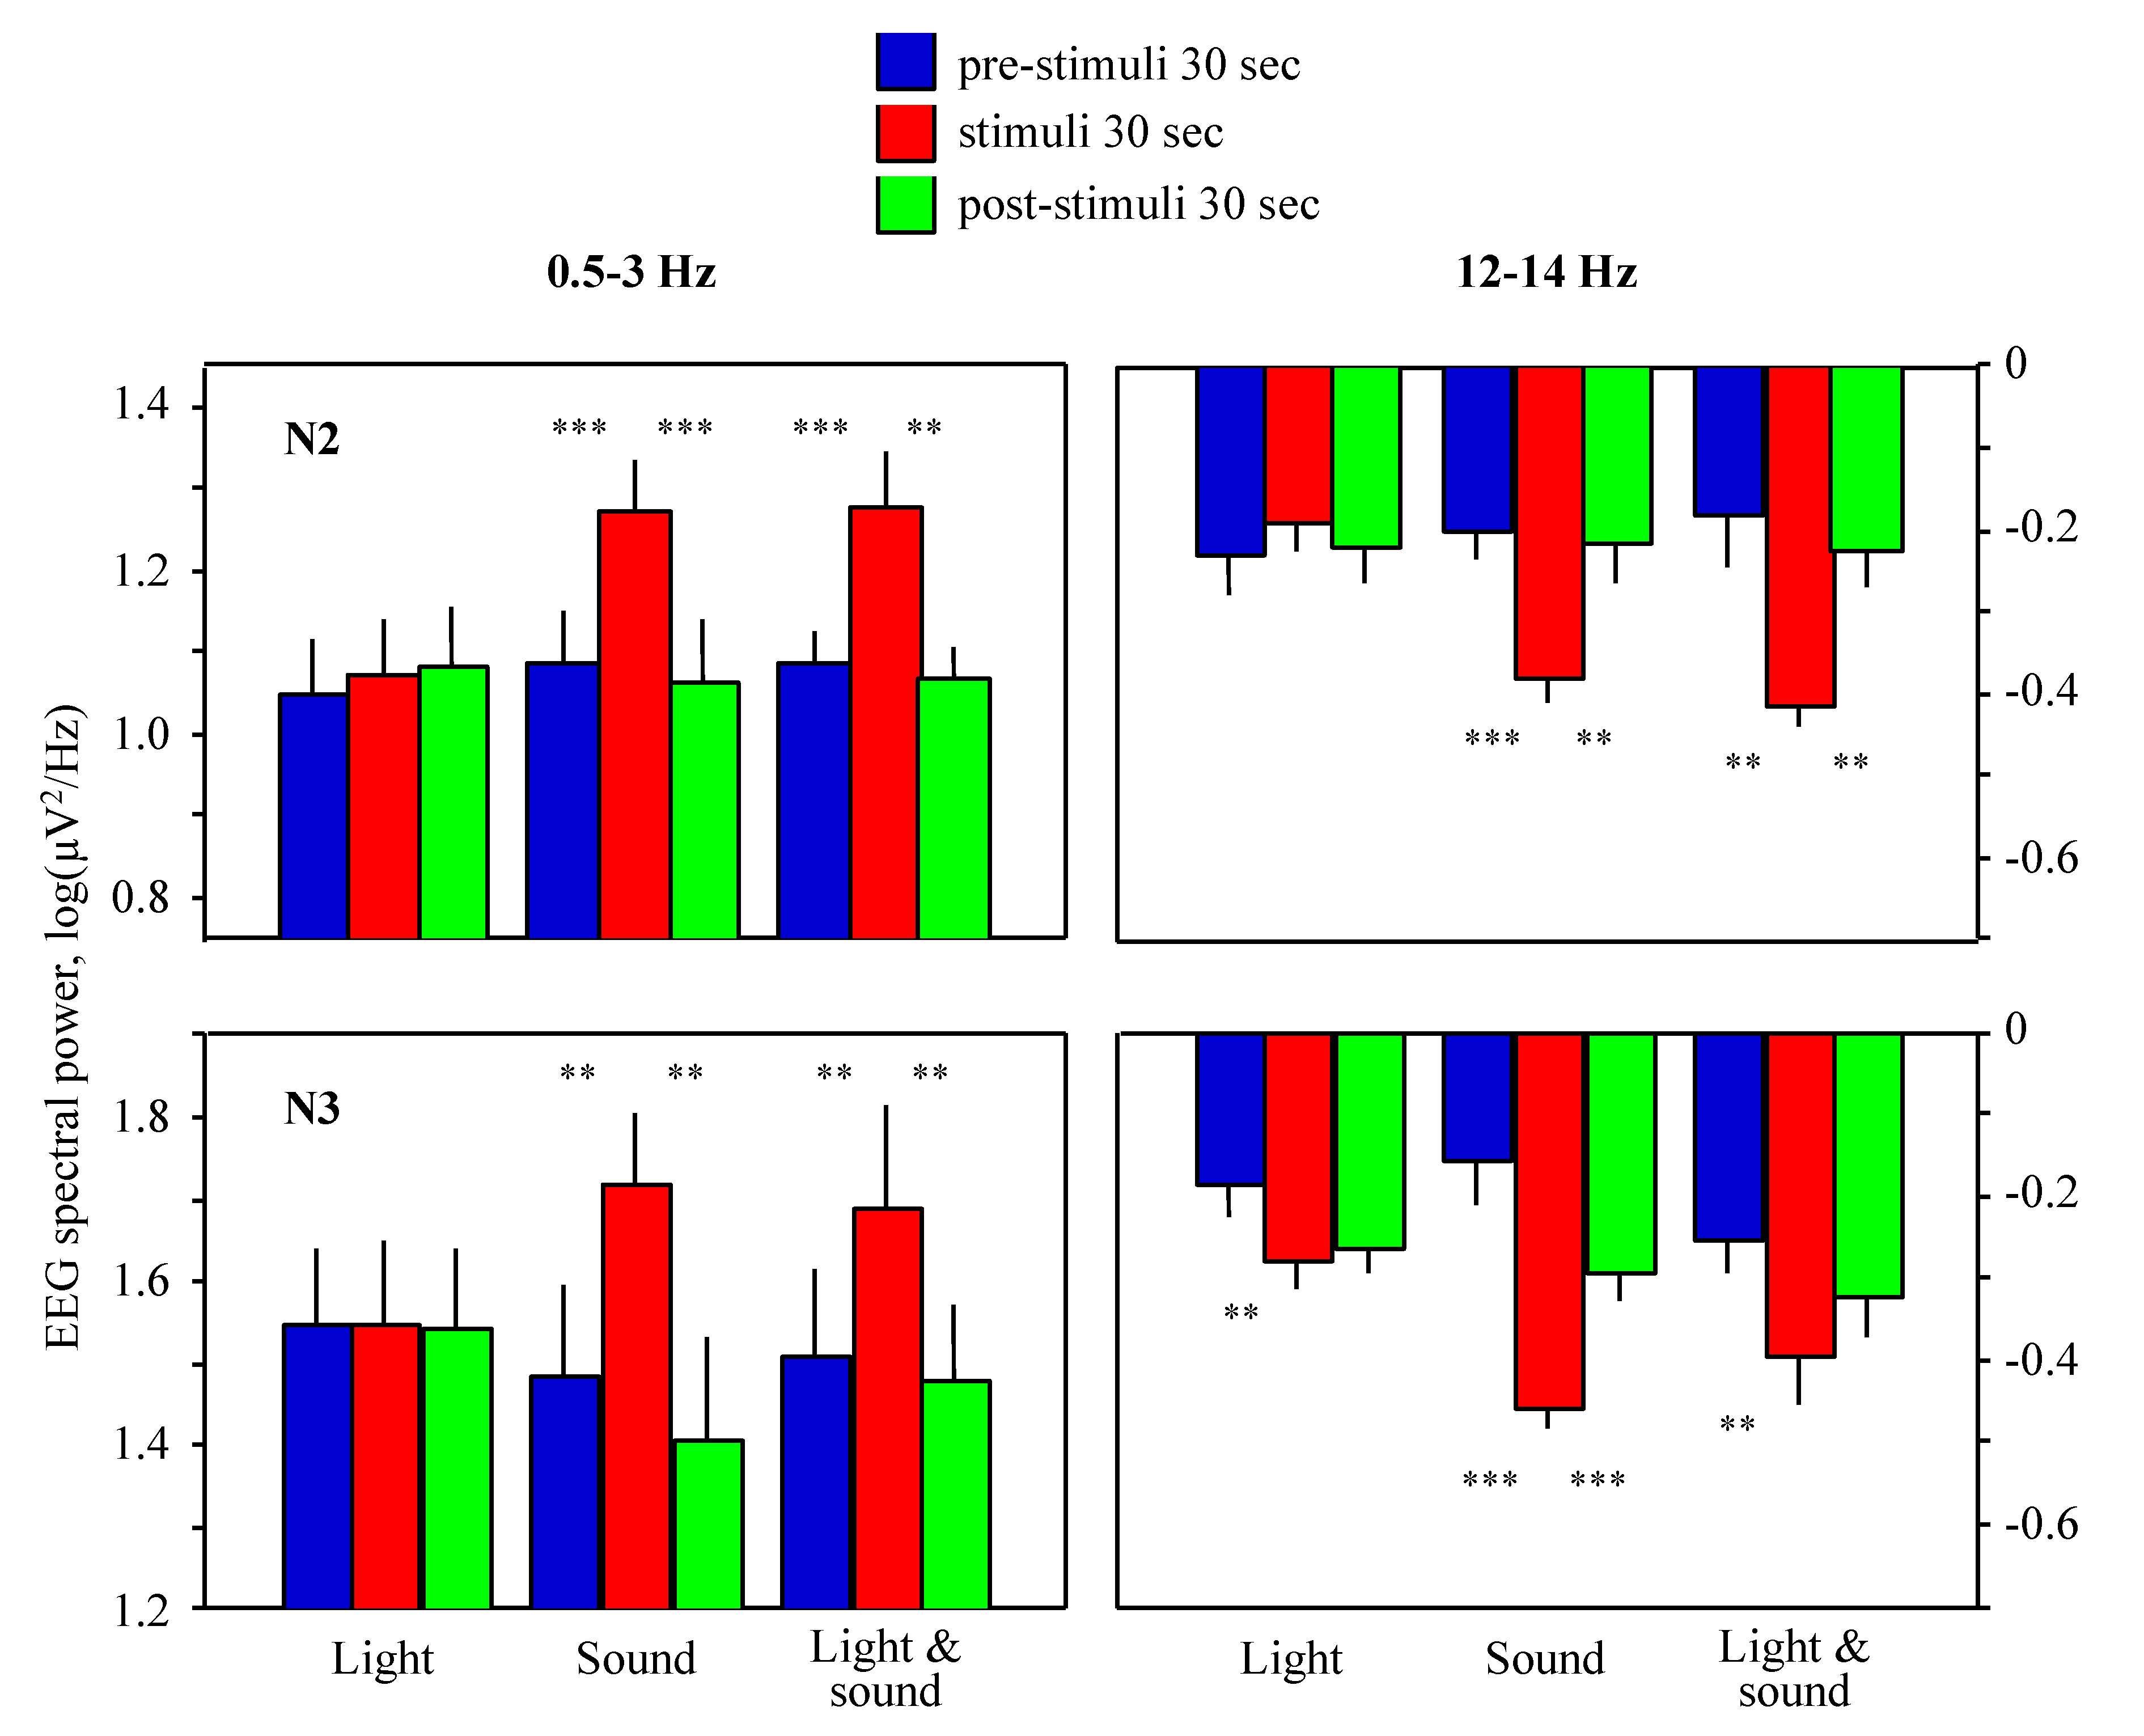
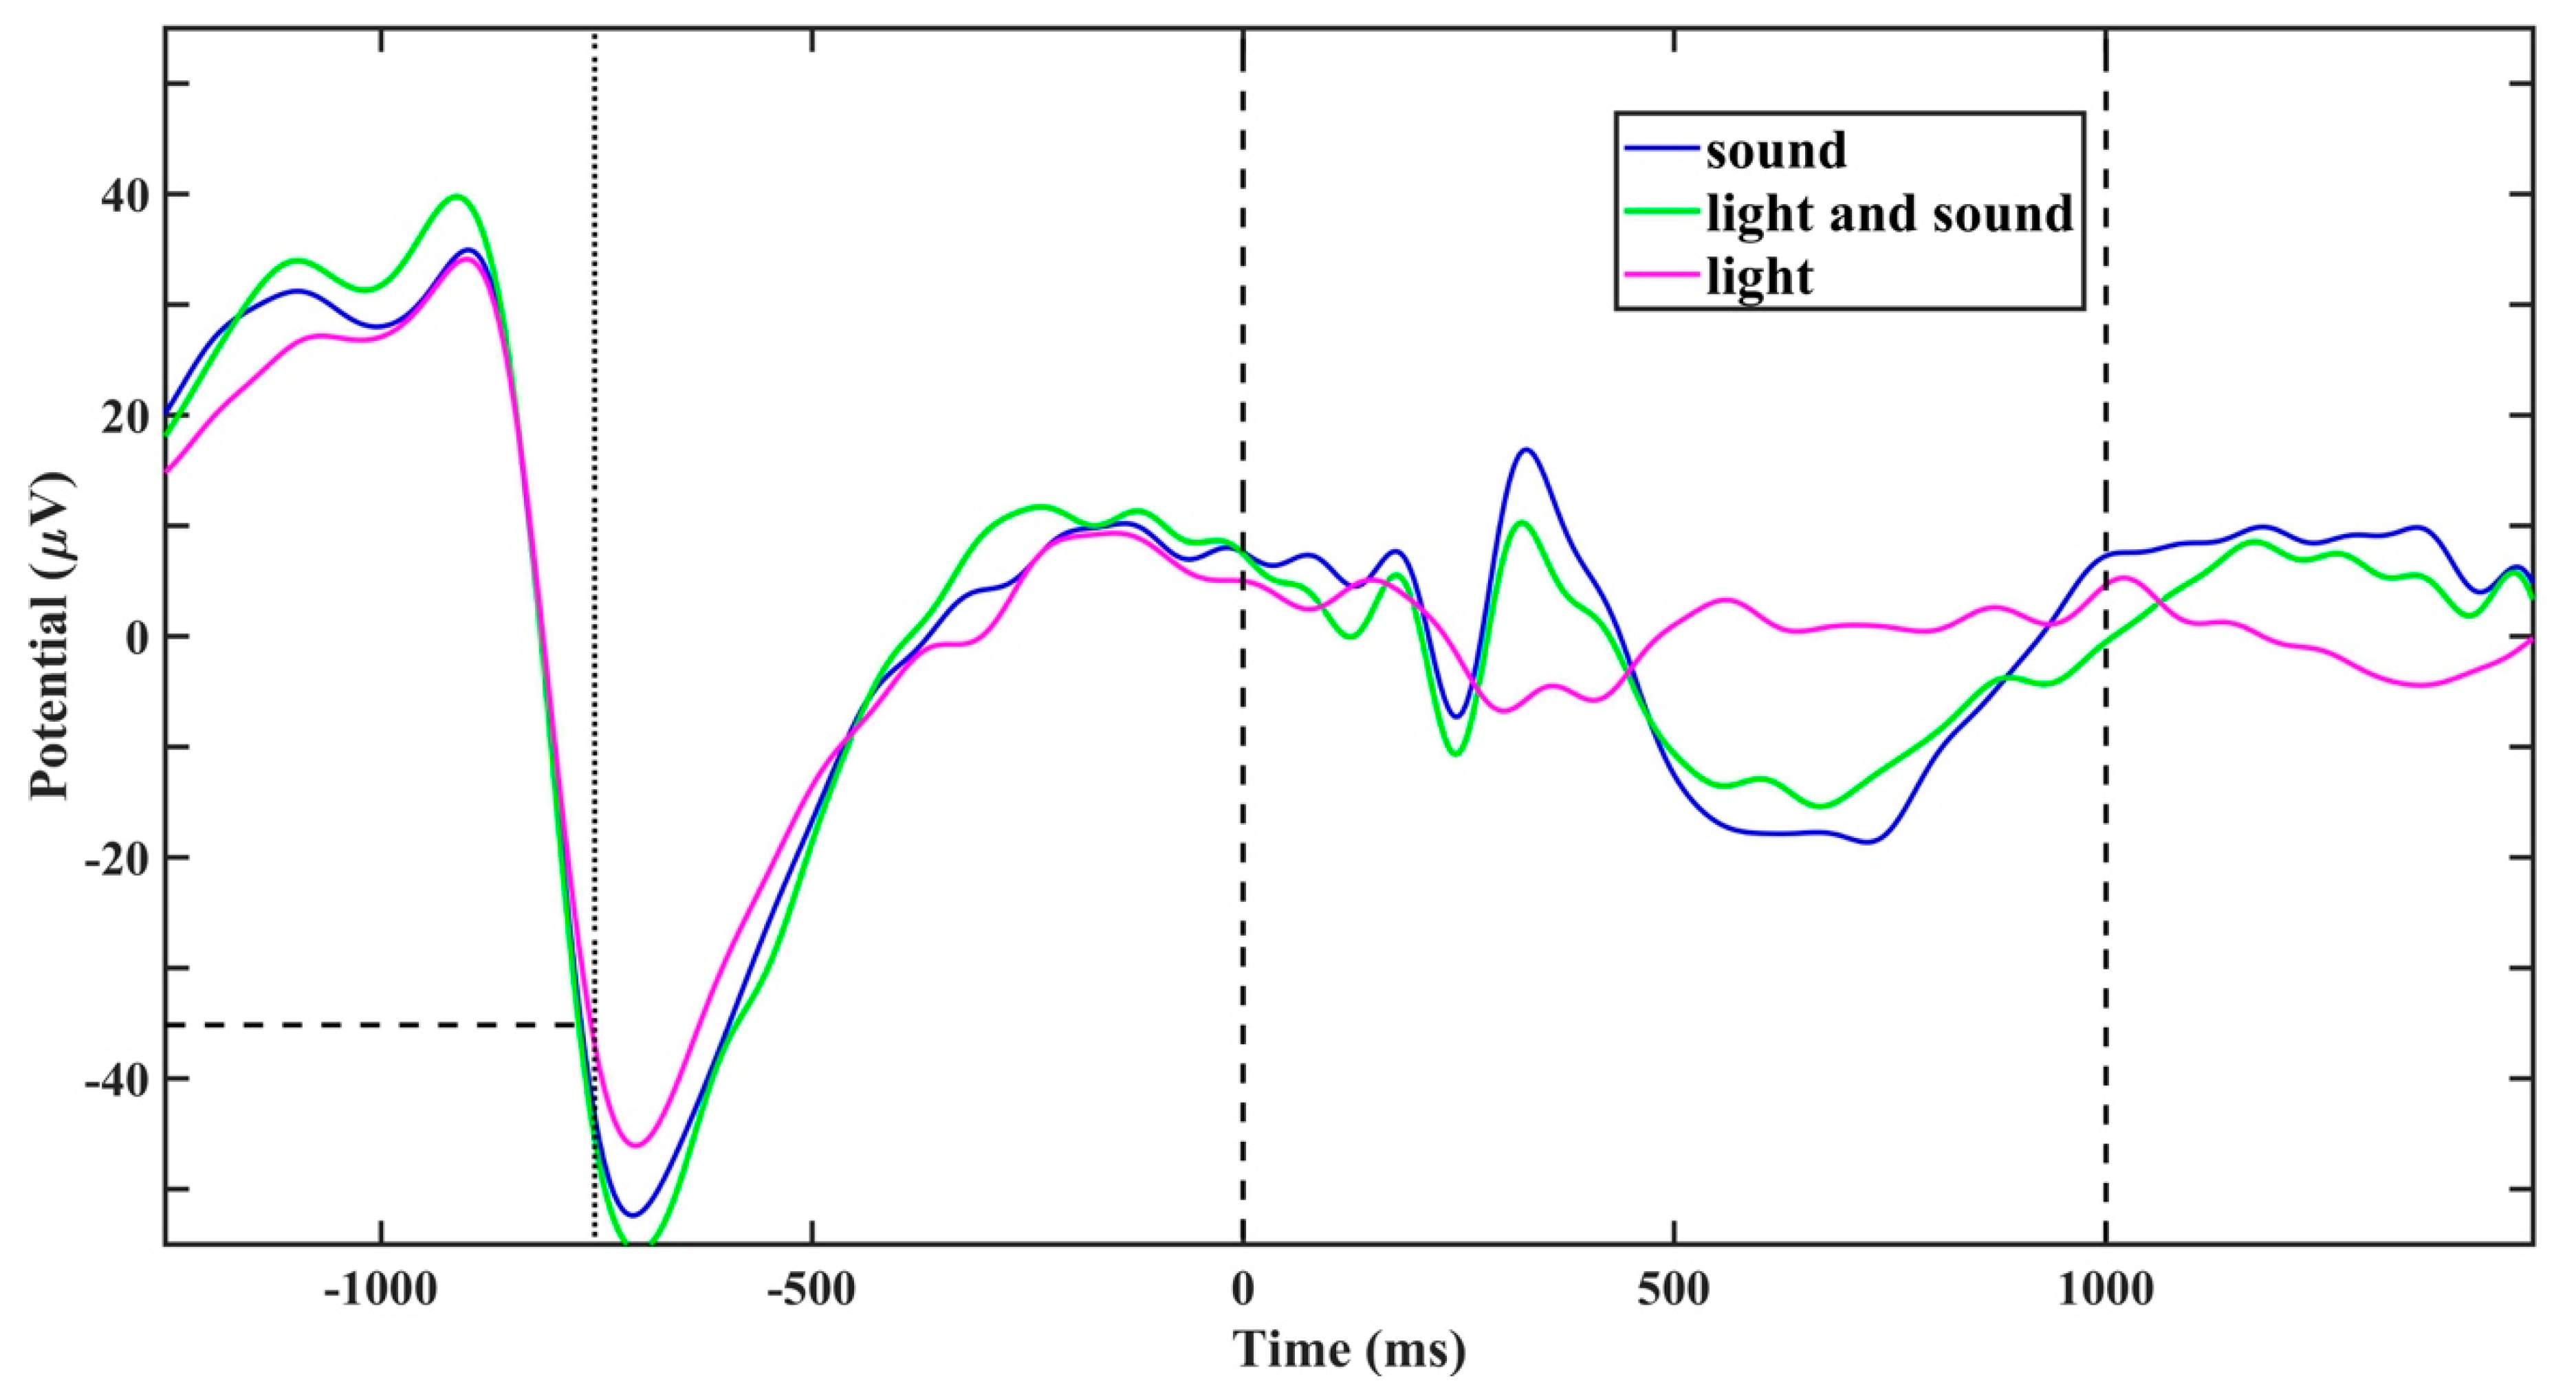
2. Results
3. Discussion
4. Materials and Methods
5. Conclusions
Author Contributions
Funding
Acknowledgments
Conflicts of Interest
References
- Berry, R.B.; Brooks, R.; Gamaldo, C.E.; Harding, S.M.; Marcus, C.L.; Vaughn, B.V. for the American Academy of Sleep Medicine. The AASM manual for the scoring of sleep and associated events. Rules Terminol. Tech. Specif. Darien IL Am. Acad. Sleep Med. 2012, 176, 2012. [Google Scholar]
- Dijk, D.J. Regulation and functional correlates of slow wave sleep. J. Clin. Sleep Med. 2009, 5 (Suppl. 2), S6–S15. [Google Scholar] [CrossRef] [PubMed] [Green Version]
- Achermann, P.; Borbély, A.A. Mathematical models of sleep regulation. Front. Biosci. 2003, 8, s683–s693. [Google Scholar] [CrossRef] [PubMed] [Green Version]
- Kupfer, D.J.; Frank, E.; McEachran, A.B.; Grochocinski, V.J. Delta sleep ratio. A biological correlate of early recurrence in unipolar affective disorder. Arch. Gen. Psychiatry 1990, 47, 1100–1105. [Google Scholar] [CrossRef] [PubMed]
- Duncan, W.C.; Sarasso, S.; Ferrarelli, F.; Selter, J.; Riedner, B.A.; Hejazi, N.S.; Yuan, P.; Brutsche, N.; Manji, H.K.; Tononi, G.; et al. Concomitant BDNF and sleep slow wave changes indicate ketamine-induced plasticity in major depressive disorder. Int. J. Neuropsychopharmacol. 2013, 16, 301–311. [Google Scholar] [CrossRef] [PubMed]
- Weber, F.D. SpiSOP Documentation. Available online: https://www.spisop.org/documentation/ (accessed on 28 April 2020).
- Corsi-Cabrera, M.; Guevara, M.A.; Del Río-Portilla, Y.; Arce, C.; Villanueva-Hernández, Y. EEG bands during wakefulness, slow-wave and paradoxical sleep as a result of principal component analysis in man. Sleep 2000, 23, 738–744. [Google Scholar] [CrossRef]
- Bellesi, M.; Riedner, B.A.; Garcia-Molina, G.N.; Cirelli, C.; Tononi, G. Enhancement of sleep slow waves: Underlying mechanisms and practical consequences. Front. Syst. Neurosci. 2014, 8, 208. [Google Scholar] [CrossRef] [Green Version]
- Riedner, B.A.; Hulse, B.K.; Murphy, M.J.; Ferrarelli, F.; Tononi, G. Temporal dynamics of cortical sources underlying spontaneous and peripherally evoked slow waves. Prog. Brain Res. 2011, 193, 201–218. [Google Scholar]
- Zhang, Y.; Gruber, R. Can slow-wave sleep enhancement improve memory? A review of current approaches and cognitive outcomes. Yale J. Biol. Med. 2019, 92, 63–80. [Google Scholar]
- Ngo, H.V.; Martinetz, T.; Born, J.; Mölle, M. Auditory closed-loop stimulation of the sleep slow oscillation enhances memory. Neuron 2013, 78, 545–553. [Google Scholar] [CrossRef] [Green Version]
- Fattinger, S.; de Beukelaar, T.T.; Ruddy, K.L.; Volk, C.; Heyse, N.C.; Herbst, J.A.; Hahnloser, R.H.R.; Wenderoth, N.; Huber, R. Deep sleep maintains learning efficiency of the human brain. Nat. Commun. 2017, 22, 15405. [Google Scholar] [CrossRef] [PubMed] [Green Version]
- Ngo, H.V.; Miedema, A.; Faude, I.; Martinetz, T.; Molle, M.; Born, J. Driving sleep slow oscillations by auditory closed-loop stimulation—A self-limiting process. J. Neurosci. 2015, 35, 6630–6638. [Google Scholar] [CrossRef] [PubMed] [Green Version]
- Ong, J.L.; Lo, J.C.; Chee, N.I.; Santostasi, G.; Paller, K.A.; Zee, P.C.; Chee, M.W.L. Effects of phase-locked acoustic stimulation during a nap on EEG spectra and declarative memory consolidation. Sleep Med. 2016, 20, 88–97. [Google Scholar] [CrossRef] [PubMed] [Green Version]
- Leminen, M.M.; Virkkala, J.; Saure, E.; Paajanen, T.; Zee, P.C.; Santostasi, G.; Hublin, C.; Müller, K.; Porkka-Heiskanen, T.; Huotilainen, M.; et al. Enhanced memory consolidation via automatic sound stimulation during Non-REM sleep. Sleep 2017, 40, zsx003. [Google Scholar] [CrossRef] [Green Version]
- Besedovsky, L.; Ngo, H.V.; Dimitrov, S.; Gassenmaier, C.; Lehmann, R.; Born, J. Auditory closed-loop stimulation of EEG slow oscillations strengthens sleep and signs of its immune-supportive function. Nat. Commun. 2017, 8, 1984. [Google Scholar] [CrossRef]
- Ando, K.; Kripke, D.F. Light attenuation by the human eyelid. Biol. Psychiatry 1996, 39, 22–25. [Google Scholar] [CrossRef]
- Remé, C.E.; Bush, R.; Hafezi, F.; Wenzel, A.; Grimm, C. Photostasis and beyond: Where adaptation ends. In Photostasis and Related Topics; Williams, T.P., Thistle, A., Eds.; Plenum Press: New York, NY, USA, 1998; pp. 199–206. [Google Scholar]
- Souman, J.L.; Tinga, A.M.; Te Pas, S.F.; van Ee, R.; Vlaskamp, B.N.S. Acute alerting effects of light: A systematic literature review. Behav. Brain. Res. 2018, 337, 228–239. [Google Scholar] [CrossRef]
- Danilenko, K.V.; Lebedinskaia, M.Y.; Gadetskaia, E.V.; Markov, A.A.; Ivanova, Y.A.; Aftanas, L.I. A 6-day combined wake and light therapy trial for unipolar depression. J. Affect. Disord. 2019, 259, 355–361. [Google Scholar] [CrossRef]
- Colrain, I.M.; Campbell, K.B. The use of evoked potentials in sleep research. Sleep Med. Rev. 2007, 11, 277–293. [Google Scholar] [CrossRef] [Green Version]
- Tononi, G.; Riedner, B.A.; Hulse, B.K.; Ferrarelli, F.; Sarasso, S. Enhancing sleep slow waves with natural stimuli. Medicamundi 2010, 54, 73–79. [Google Scholar]
- Nir, Y.; Staba, R.J.; Andrillon, T.; Vyazovskiy, V.V.; Cirelli, C.; Fried, I.; Tononi, G. Regional slow waves and spindles in human sleep. Neuron 2011, 70, 153–169. [Google Scholar] [CrossRef] [PubMed] [Green Version]
- Werth, E.; Achermann, P.; Borbély, A.A. Fronto-occipital EEG power gradients in human sleep. J. Sleep Res. 1997, 6, 102–112. [Google Scholar] [CrossRef] [PubMed]
- Finelli, L.A.; Borbély, A.A.; Achermann, P. Functional topography of the human nonREM sleep electroencephalogram. Eur. J. Neurosci. 2001, 3, 2282–2290. [Google Scholar]
- Krugliakova, E.; Volk, C.; Jaramillo, V.; Sousouri, G.; Huber, R. Changes in Cross-Frequency Coupling Following Closed-Loop Auditory Stimulation in Non-Rapid Eye Movement Sleep. bioRxiv 2019, 810861. [Google Scholar] [CrossRef]
- Fernandez, D.C.; Fogerson, P.M.; Lazzerini Ospri, L.; Thomsen, M.B.; Layne, R.M.; Severin, D.; Zhan, J.; Singer, J.H.; Kirkwood, A.; Zhao, H.; et al. Light affects mood and learning through distinct retina-brain pathways. Cell 2018, 175, 71–84. [Google Scholar] [CrossRef] [Green Version]
- Figueiro, M.G.; Bierman, A.; Rea, M.S. A train of blue light pulses delivered through closed eyelids suppresses melatonin and phase shifts the human circadian system. Nat. Sci. Sleep 2013, 5, 133–141. [Google Scholar] [CrossRef] [Green Version]

| Subject # | Gender | Age, y | Amplitude Threshold, µV | Sleep N2 Stage | Sleep N3 Stage | ||
|---|---|---|---|---|---|---|---|
| # of Epochs/# of Stimuli per Epoch 1 | # of Epochs Taken in Analysis 2 | # of Epochs/# of Stimuli per Epoch 1 | # of Epochs Taken in Analysis 2 | ||||
| 1 | female | 41 | −25 | 38/4.1 | 6 × 3 | 34/5.7 | 4 × 3 |
| 2 | male | 33 | −25 | 50/4.2 | 10 × 3 | 56/6.2 | 9 × 3 |
| 4 | male | 46 | −25 | 59/4.3 | 12 × 3 | 44/6.3 | 7 × 3 |
| 5 | female | 43 | −25 | 43/4.8 | 9 × 3 | 43/7.7 | 12 × 3 |
| 6 | female | 21 | −25 | 35/5.1 | 5 × 3 | 79/7.4 | 21 × 3 |
| 7 | female | 40 | −25 | 70/4.3 | 15 × 3 | 53/5.8 | 9 × 3 |
| 8 | female | 21 | −30 | 31/4.5 | 4 × 3 | 62/6.6 | 11 × 3 |
| 9 | female | 22 | −35 | 29/4.3 | 4 × 3 | 53/7.3 | 15 × 3 |
| 10 | female | 24 | −30 | 53/4.7 | 12 × 3 | 44/7.5 | 11 × 3 |
© 2020 by the authors. Licensee MDPI, Basel, Switzerland. This article is an open access article distributed under the terms and conditions of the Creative Commons Attribution (CC BY) license (http://creativecommons.org/licenses/by/4.0/).
Share and Cite
Danilenko, K.V.; Kobelev, E.; Yarosh, S.V.; Khazankin, G.R.; Brack, I.V.; Miroshnikova, P.V.; Aftanas, L.I. Effectiveness of Visual vs. Acoustic Closed-Loop Stimulation on EEG Power Density during NREM Sleep in Humans. Clocks & Sleep 2020, 2, 172-181. https://doi.org/10.3390/clockssleep2020014
Danilenko KV, Kobelev E, Yarosh SV, Khazankin GR, Brack IV, Miroshnikova PV, Aftanas LI. Effectiveness of Visual vs. Acoustic Closed-Loop Stimulation on EEG Power Density during NREM Sleep in Humans. Clocks & Sleep. 2020; 2(2):172-181. https://doi.org/10.3390/clockssleep2020014
Chicago/Turabian StyleDanilenko, Konstantin V., Evgenii Kobelev, Sergei V. Yarosh, Grigorii R. Khazankin, Ivan V. Brack, Polina V. Miroshnikova, and Lyubomir I. Aftanas. 2020. "Effectiveness of Visual vs. Acoustic Closed-Loop Stimulation on EEG Power Density during NREM Sleep in Humans" Clocks & Sleep 2, no. 2: 172-181. https://doi.org/10.3390/clockssleep2020014