Study of Iron Gall Inks, Ingredients and Paper Composition Using Non-Destructive Techniques


1
C2TN, Campus Tecnológico e Nuclear, Instituto Superior Técnico, Universidade de Lisboa, E.N. 10, 2686-953 Sacavém, Portugal
2
IPFN, Instituto Superior Técnico, Universidade de Lisboa, E.N. 10, 2695-066 Bobadela LRS, Portugal
*
Author to whom correspondence should be addressed.
†
These authors contributed equally to this work.
Heritage 2019, 2(4), 2691-2703; https://doi.org/10.3390/heritage2040166
Submission received: 29 July 2019
/
Revised: 18 September 2019
/
Accepted: 20 September 2019
/
Published: 24 September 2019
(This article belongs to the Special Issue Cultural Heritage—Science, Materials and Technologies)
Abstract
:Old manuscripts are among the most important elements of the cultural and historical heritage of ancient knowledge. Unfortunately, many of them suffer from degradation, mostly those written with iron gall inks. In the present work, a study using non-destructive techniques was designed with the aim of analyzing the elemental composition and structural characteristics of iron gall inks, reproduced in laboratory, paper and their interaction when the ink is deposited on paper, inducing the paper degradation. Proton induced X-ray emission, X-ray diffraction and Fourier-transform infrared spectroscopy provided the elemental and structural information, and photography under infrared (IR) and ultraviolet (UV) light allowed the differentiation between manufactured inks. Results show that the first step of inked paper deterioration is due to acid-hydrolysis of the cellulose and the presence of reactive Fe(II) species by reducing the crystallinity index of the paper, which is affected depending on the ink recipe and the starting raw materials. These results will be useful to future studies on ancient documents written with iron gall inks, which suffer deterioration due to ink corrosion, and to differentiate between the different paper degradation mechanisms.
1. Introduction
Nowadays, most of the manuscripts written with iron gall inks on paper show different degrees of degradation, mainly due to the cellulose hydrolysis (promoted by ink acidity), cellulose oxidation, which can be attributed to Fenton reactions, or cellulose depolymerization [1]. Metals, present as impurities in the starting materials of the iron gall inks [2,3,4], may be jointly with the Fe ions, responsible of these processes. In addition, in some documents, changes in color in inked areas (from brown-black to light brown), stains, foxing or loss of mechanical properties are also visible.
The first preparation records of iron gall inks date back to the fourth century AD and they were widely used until the beginning of the twentieth century in official documents once they were hard to erase from paper. The basic ingredients of iron gall inks are iron sulfate, Arabic gum, tannic acid extracted from oak galls and water [5]. Furthermore, depending on the recipe, on the time or the geographical place of their origin, additives (as vinegar or wine) can be found among the ingredients.
In a similar way, supports for writing or drawings were used since ancient times, covering different types of materials such as papyrus, parchment, vellum or paper. The latter was first used in China sometime in the second or third century BC, and it began its spread across the globe between the second and fourth centuries, reaching Morocco by the eleventh century and then entering into Europe (Islamic Spain) in the middle of that same century. Since then, the introduction of new raw materials, as fillers or brightening agents, jointly with the progress in manufacturing techniques makes paper the most popular and preferred support.
In the last years, efforts have been focused on the study of the interaction of iron gall inks when deposited on papers [1,6,7,8,9,10]; for example, the ink penetration into the paper, the influence of the oxidation of iron(II) into iron(III) or the pH of iron gall inks on the paper support.
Due to the uniqueness of these manuscripts, non-destructive analysis techniques are increasingly demanded to characterize them. Among them, X-ray fluorescence (XRF) and proton induced X-ray emission (PIXE) have been used to characterize the elemental composition of the inks and paper [2,11,12,13], Fourier-transform infrared spectroscopy (FTIR) or Raman spectroscopy are also used to study the composition and structural characteristics [9,14,15,16,17]. Mössbauer spectroscopy has also been used to measure the percentage of Fe(II) in dried inks [18,19].
The limited diffusion length of ink on paper, usually less than 1 μm, is one of the main challenges to overcome, since from these techniques it is difficult to separate the contribution from the small amount of ink in comparison with the amount of paper when an inked area is under study. For this reason, in many cases comparison between inked and bare areas of paper are studied, and deductions are extracted by comparison.
This work aims to investigate the capability of a set of non-destructive techniques, while avoiding sampling, for linking raw ingredients and reproducing traditional iron gall inks to inks deposited on paper and their interaction. This correlation aims to establish a set of useful techniques to study old and unique documents written with this type of ink, which usually show paper degradation, frequently attributed to Fe iron atoms. The techniques considered—PIXE, FTIR, X-ray diffraction (XRD)—are useful to characterize both the composition and the structural characteristics of ingredients, iron gall inks, as well as bare and inked paper. Images under ultraviolet (UV) and infrared (IR) light are also very useful tools to distinguish between bare papers and inks due to the different emission patters, and are also used to evaluate the degradation state, highlighting, for example, the foxing stains.
2. Materials and Methods
2.1. Inks
The ingredients used to reproduce the iron gall inks were iron (II) sulfate, Arabic gum, tannic acid and water. Two types of galls containing gallotannic acid and gallic acid were used as tannic acid sources: gall oaks and gall nuts. Additionally, commercial tannic acid powder was also used. All products, except galls and water, were purchased from a store of supplies for conservation and restoration professionals.
The preparation of iron gall ink formulations was as follows: pour the tannic acid powder (or crushed nuts) in a glass container with water and heat until the solution boils. After cooling, iron sulfate and Arabic gum are added and mixed until a homogeneous solution is obtained.
The compositions of the inks were:
Ink #1: 2.3 g of tannic acid, 1 g of Arabic gum, 3 g of iron sulfate and 100 mL of water.
Ink #2: 7 g of tannic acid, 3.3 g of Arabic gum, 14.7 g of iron sulfate and 100 mL of water.
Ink #3: 0.5 g of tannic acid (commercial or from gall oaks/nuts), 2 g of Arabic gum, 12 g of iron sulfate and 100 mL of water.
All inks have a pH around 2–3 and densities close to 1 g/cm3. When prepared, inks were deposited on one side of an uncoated bond paper (75 g/m2) page by means of soft round brushes (one for each ink to avoid contamination).
2.2. Proton Induced X-ray Emission (PIXE)
PIXE is a powerful technique to study the elemental composition of a wide variety of materials, mainly due to its sensitivity (in the order of ppm).
The measurements were performed on air using the external microprobe set-up of the CTN/IST facility, in Portugal. The Van de Graaff accelerator produces a 2 MeV proton beam, which is focused by means of a set of quadrupole lenses reaching a final beam dimension of 70 × 70 μm2 [20]. An X-ray silicon drift detector (Si-SDD) was placed at 2.8 cm from the sample at an angle of 45° to the beam direction. It has an active area of 30 mm2 and 145 eV resolution at 5.9 keV. During measurements a 50 μm foil of Mylar was placed in front of the detector, mostly to avoid the entrance of scattered protons into the detector.
The beam current was set at 300 pA and the acquisition time was about 15 min for each measurement. Except for Arabic gum, where measurements were done in a polished surface, pellets (hydraulic press reading 8 ton) with 15 mm diameter and 1 mm thick were used for the analysis of the rest of the ingredients. Also, measurements were performed in both, bare paper areas and inked regions in order to differentiate the elements from the paper and the ink. Data acquisition and beam control was performed with the OMDAQ V5.2 software package. PIXE spectra evaluation and quantification was done with the GUPIX software [21].
2.3. Evaluation under UV and IR light
A high-resolution camera with a digital sensor (Nikon 5700) was used to record images under visible and UV light. The UV source is composed of four lamps of long-wave UV light at 350 nm, oriented at 45° with the documents. Near-IR images were recorded with a Sony camera with a Carl Zeiss® Vario-Tessar lens.
2.4. X-ray Diffraction (XRD)
A Bruker D8 Discover diffractometer was used to study ingredients, dried inks and papers (bare and inked regions), using the θ–2θ geometry. A collimated (0.6 mm) Cu-Kα1 monochromated radiation (1.540597 Å) was used as excited radiation beam and the diffracted beam was detected by means of a scintillation detector, after passing a 0.32 mm slit. Each diffractogram took about 4–5 h and was analyzed using Match! and PhasanX software programs together with Pearson’s database [22].
As with PIXE measurements, XRD experiments in Arabic gum were done in a polished surface and for the other ingredients, measurements were done in pellets. Dried inks measurements were done on the residues after evaporation of ink drops deposited on glass substrates. No sample preparation was needed for XRD measurements on paper (inked and bare regions).
2.5. Fourier-Transform Infrared Spectroscopy (FTIR)
The experiments were performed using a Thermo Scientific Nicolet IS50 FT-IR model with the attenuation total reflectance (ATR) module with a slide diamond crystal. The experiments were performed at room temperature (21 °C) and ambient humidity (42%). Data were acquired in the 4000–400 cm-1 range at a resolution of 4 cm-1, performing 64 scan acquisitions for each sample.
Ingredients and dried inks (powder flaked away from glass substrates after ink evaporation) were measured by means of pellets using a Specac hydraulic press by mixing a few micrograms of material with potassium bromide (KBr).
For inked and bare papers, the ATR module was used due to its dimensions. A criterion for successful FTIR-ATR measurement is to apply sufficient pressure in order to ensure an intimate contact between the sample and the ATR crystal.
The spectra obtained are plots of transmittance of energy at a given wavelength. The OMNIC software was used for spectra acquisition and data manipulation [23]. For better visualization in the figures, signals were shifted onto the vertical axis to permit suitable comparisons, so that no transmittance scale is given. In some spectra, absorptions at 2853 cm-1 and 2918 cm-1 can be associated to the asymmetric C–H stretching vibration and the symmetric C–H stretching vibration, respectively, of the CH2 and CH3 groups, probably related to contamination from the machine-oil, or to the presence of natural aldehydes on natural tannin sources (O = C–H stretch).
3. Results
3.1. Ingredients
The purity of the raw materials was checked by PIXE technique, taking advantage of its high sensitivity. By this way, it was possible to identify the impurities present in all the ingredients used for ink preparation. PIXE spectra of the ingredients are shown in Figure S1 (Supplemental Materials).
In the Arabic gum it was possible to identify as minor elements: potassium, titanium, copper, zinc and barium. In the iron sulfate, besides iron and sulfur as main constituents, it was detected the presence of manganese and zinc in very low concentrations. The tannic acid pellets also showed potassium and titanium (in trace levels), even in the commercial powder. All ingredients had sulfur, chlorine, calcium and iron in common.
XRD diffractograms for Arabic gum and tannin sources are shown in Figures S2 and S3 (Supplemental Materials). The Arabic gum diffractogram shows two wide bands centered at 18° and 35°, similar to that shown in the literature [24]. Regarding the tannin sources, no differences between the natural galls (nut and oak) were detected, showing two broad bands centered at 15° and 22°. On the other hand, the commercial tannic acid shows broad bands centered at 15° and 25°.
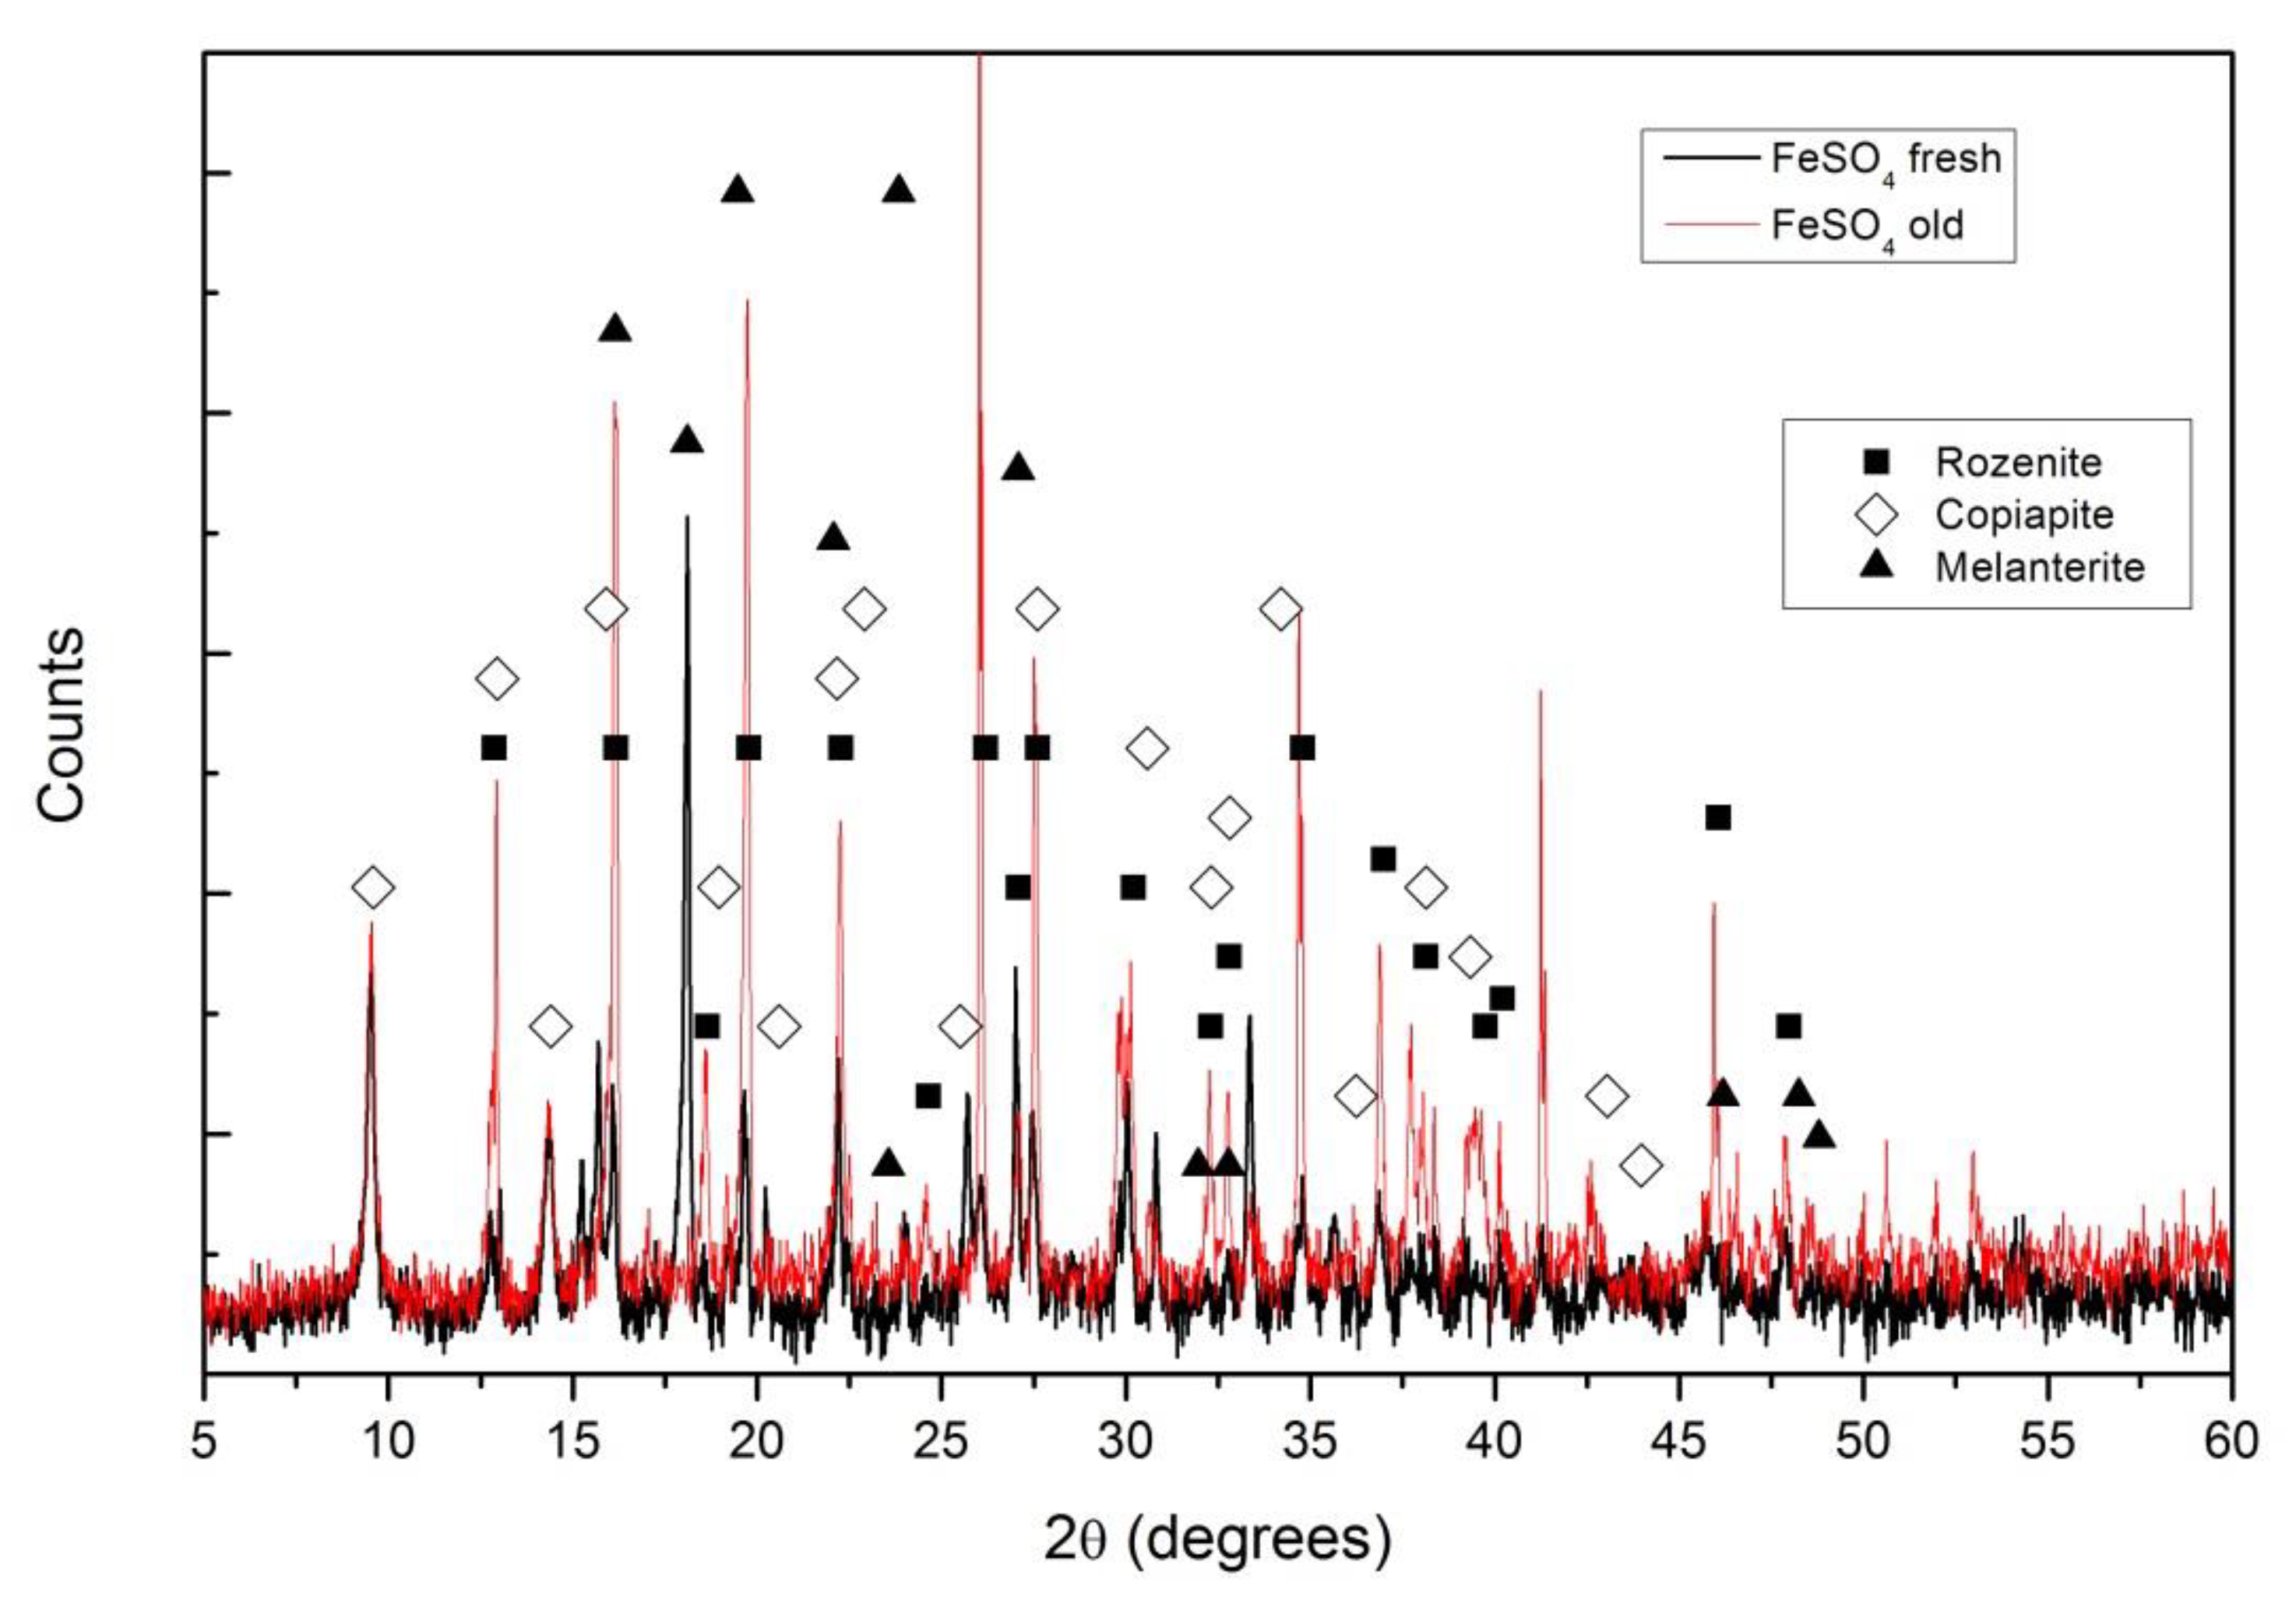
XRD diffractograms for the FeSO4 pellets, fresh and after two weeks exposed to air, are shown in Figure 1. The main difference among the compounds identified is the level of hydration, while for fresh pellets the melanterite (FeSO4·7H2O) and copiapite (Fe14O3(SO4)18·63H2O) are the main compounds; in the air pellets exposed to air, the melanterite is mainly replaced by rozenite (FeSO4·4H2O).
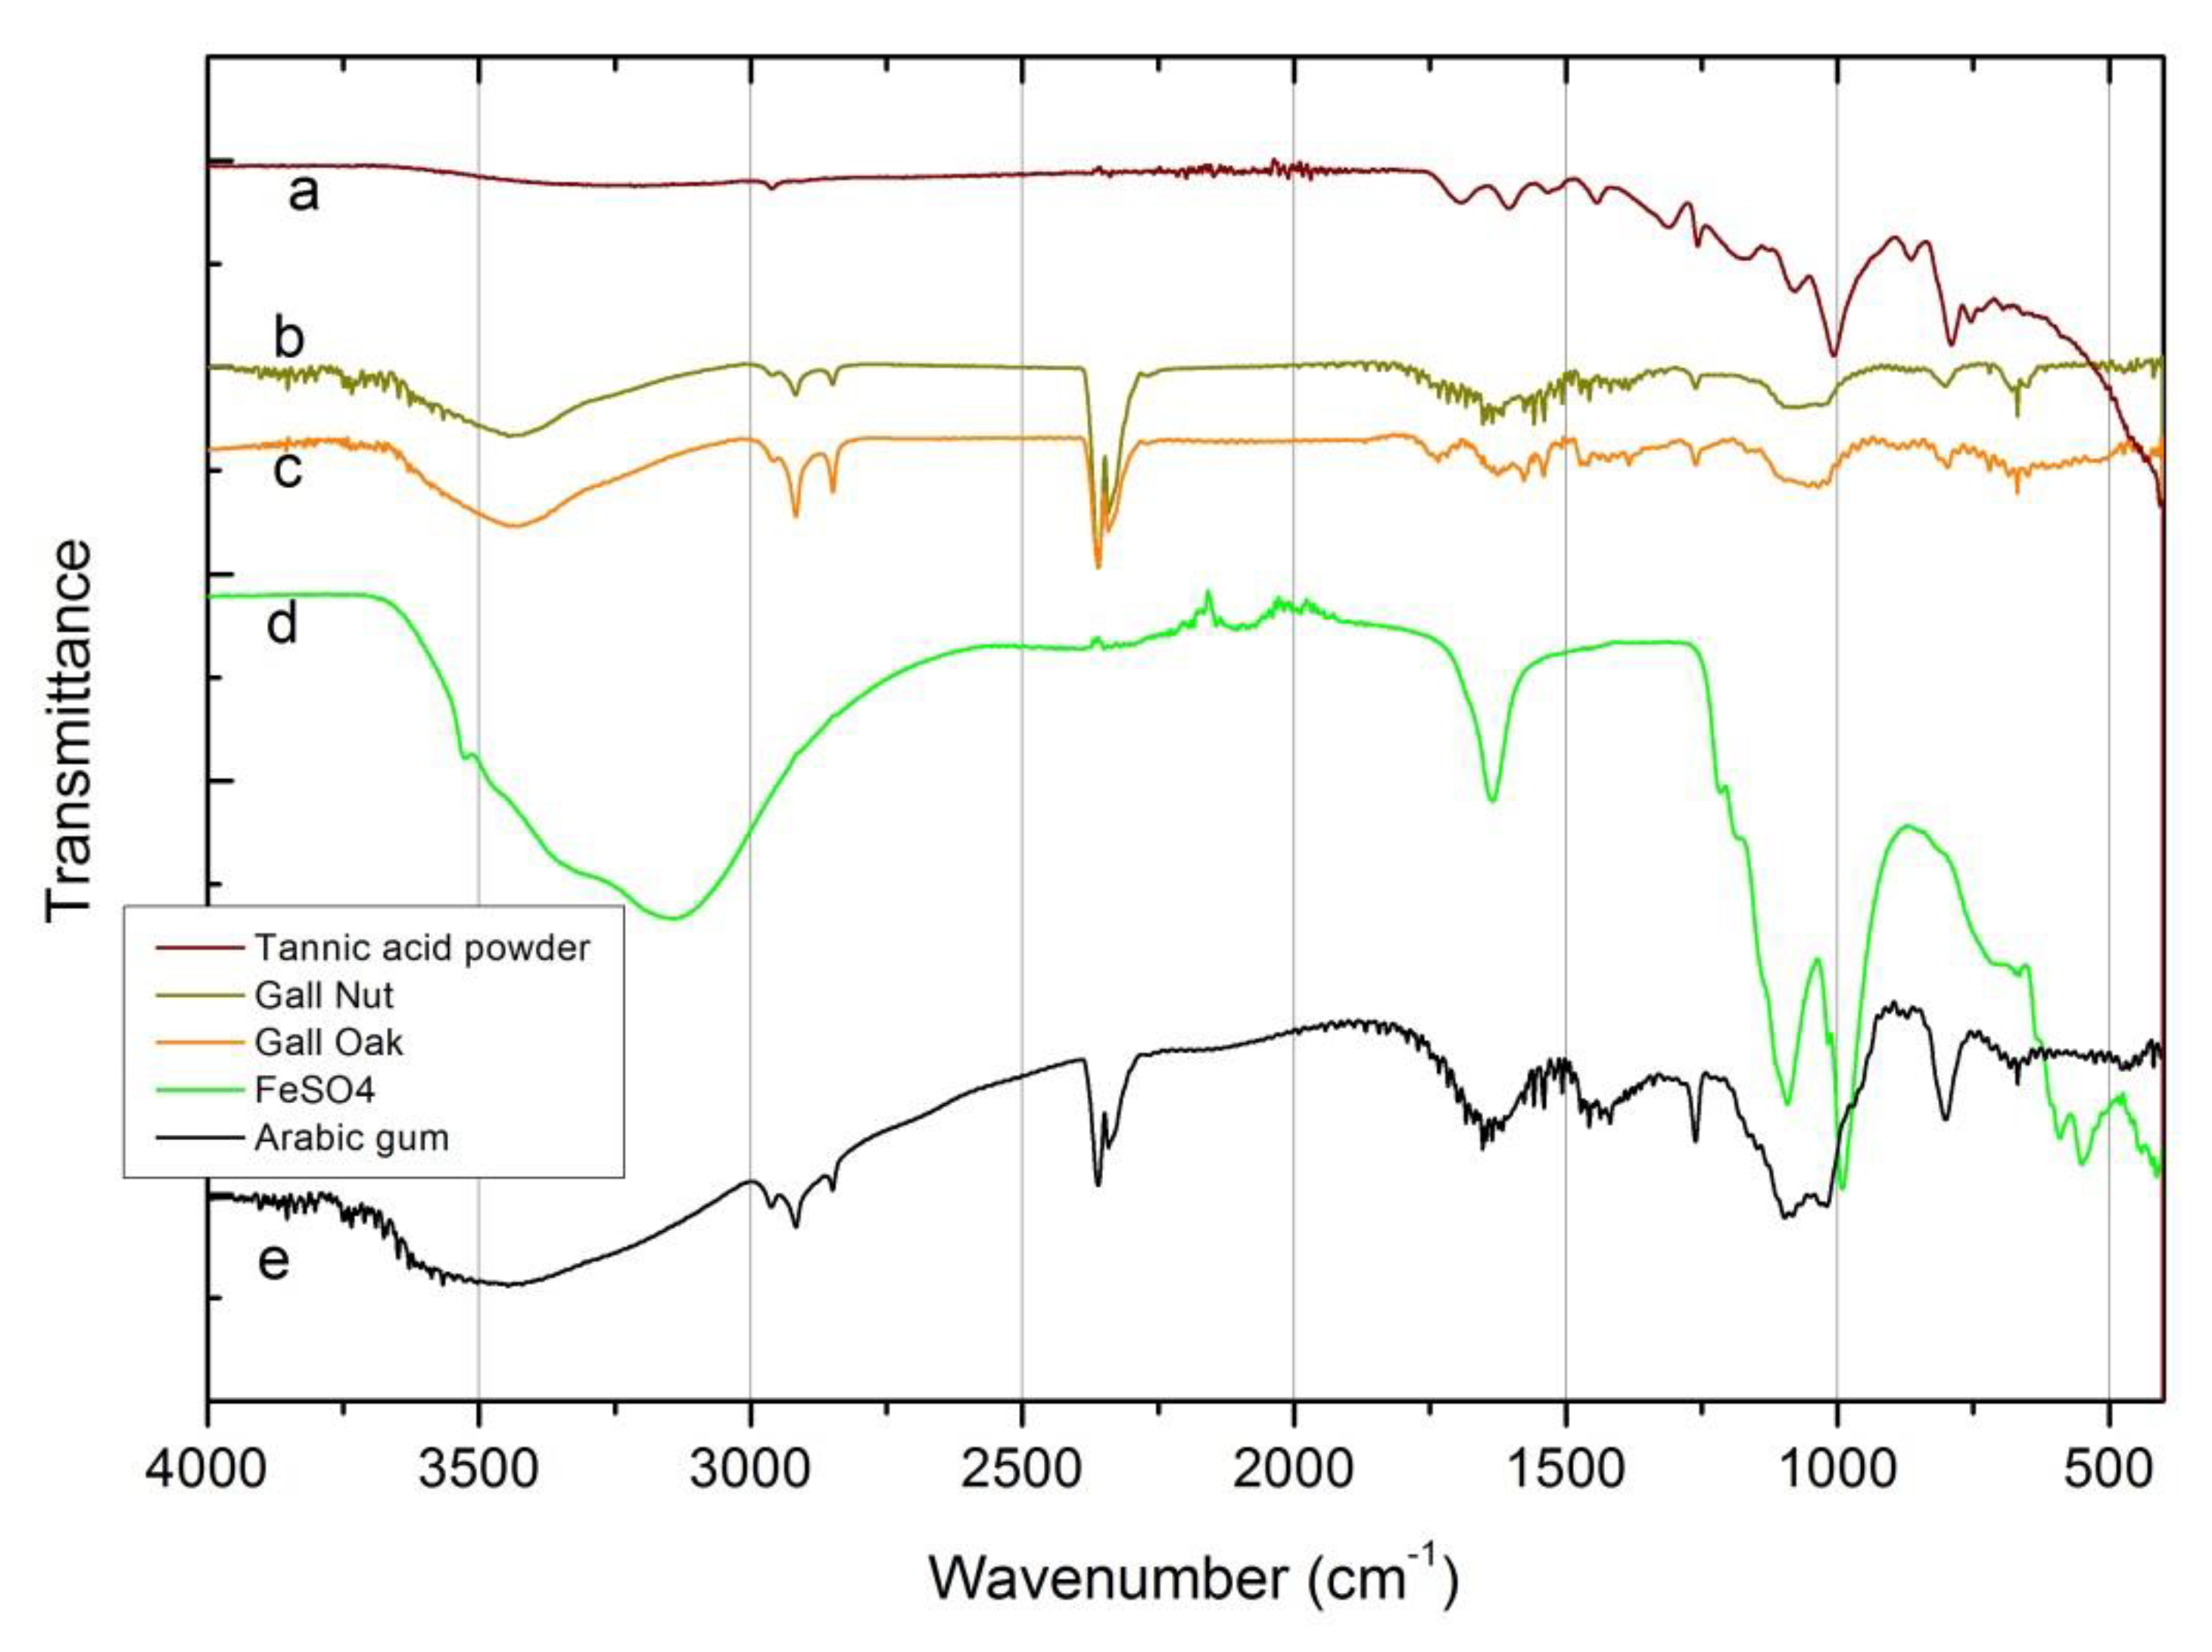
Finally, FTIR spectra of ingredients are shown in Figure 2. Concerning the tannic acid sources, as in XRD, there are no significant changes in the FTIR spectra for the oak and gall nuts. Nevertheless, the broad band around 3430 cm-1, assigned to hydroxyl group (–OH) stretching vibrations, characteristic of polyphenols, only appears with a slight expression in the commercial tannic acid spectra. This unexpected result may be due to several factors, which could act in concert:
(i) Tannic acid is a mixture of polygalloyl glucoses or polygalloyl quinic acid esters, in which the type and content ratios depend on the plant(s) used as an extraction source. Even being polyphenolic compounds, the vibration expression of the –OH group could vary depending on the ratio content of tannic acid and on the wide variety of hydrogen bonding between –OH (including the presence or absence of free OH) [25]. The commercial tannic acid used in this work (not a pro-analysis (p.a.) reagent) does not came labeled with the origin description, neither with the tannins content (it was not possible to clarify this with the seller);
(ii) Tannic acid is naturally hygroscopic and, just like for other commercial products, it can be packaged with some stabilizer additives which could inhibit some fundamental vibration modes;
(iii) The spectra of commercial tannic acid itself, even not showing too much signal noise, denote a low concentration of tannic acid in the KBr pellet analyzed.
The same situation occurred with the sharp peaks around 2927 cm-1 and 2860 cm-1 associated respectively with the symmetric and asymmetric –C–H– stretching vibrations of –CH2 and –CH3 groups, which clearly appear in natural tannic acid source’s spectrum and show a weak signal in the commercial tannic acid spectra.
On the other hand, the group of aromatic ring vibrations in the range of 1600–1400 cm-1 is better resolved in the commercial powder than in the galls. The same behavior is observed for the absorption frequencies related to the vibration phenols groups, close to 1000 cm-1, and for carbonyl groups in the range of 1670–1820 cm-1 [15,17].
This behavior can also be associated to the degree of purity of the different tannic acids:
(i) A higher degree of hydration of the “natural” tannic acids (obtained from oak and gall nuts) compared with the pure commercial tannic acid may justify the broad band of these ingredients around 3430 cm-1;
(ii) The purer commercial tannic acid presents, as expected, a better vibrational expression of its characteristic functional groups’ (aromatic and phenols groups) content in the fingerprint region of the spectra, without vibrational expression of possible contaminants (peaks and shoulders at 2400–2250 cm-1), such as atmospheric carbon dioxide and/or alkynes and/or nitriles [26]. Alkynes and nitriles occur naturally in a diverse set of plants (fruits, galls, tree barks and exudates from trunks) and can appear as contaminants in natural-based products [27,28]. Nitrile contaminations may also originate on laboratory protective gloves and/or on the nitrile-based sealers found on bottle caps. Even so, carbon dioxide does not seem to be the most likely contaminant present in the ingredients spectra given that only its symmetric stretch peak (2400–2300 cm-1) appears clearly defined; the symmetric stretch (1400–1300cm-1) it is not visible and the scissors bend (near 700 cm-1) vibration has almost no expression in all spectra.
The Arabic gum FTIR spectrum also shows the absorption connected with the vibrations of the OH– group and the characteristic stretching vibrations of the COOH and COO– groups (1630 cm-1 and 1413 cm-1 broad peaks, respectively). The stretching vibrations of the C–O group are also visible at 1072 cm-1 and 1023 cm-1 [17]. The presence of alkynes and/or nitriles compounds, possible as contaminants, is also detected through the peak and shoulder at 2400–2250 cm-1.
The FeSO4 spectrum can be divided into two regions: a broad band in the 3600–3200 cm-1 range and a group of sharp peaks in the 1700–400 cm-1 range. The first region can be deconvoluted (not shown in the figure) in three main peaks centered at 3530, 3357 and 3145 cm-1. All of them, jointly with the 1638 cm-1 peak, related to the stretching and bending vibrations of the OH– group, showing a high content of water. The sharp peaks at 1093, 989, 610 and 536 cm-1 are associated with the stretching vibrations both, symmetric and asymmetric, of the SO42- group [9,15,17].
3.2. Inks
By PIXE it was possible to measure a drop of ink #1, deposited on a polymeric support. In this configuration, it was possible to detect the presence of sulfur and iron as major elements, and in minor concentrations the presence of chlorine, potassium, calcium and manganese. Similar results were obtained for the other inks in dried form.
By XRD it was not possible to obtain proper diffractograms from dried inks on glass supports, due to the small amount of ink in comparison with the X-ray penetration into the glass.
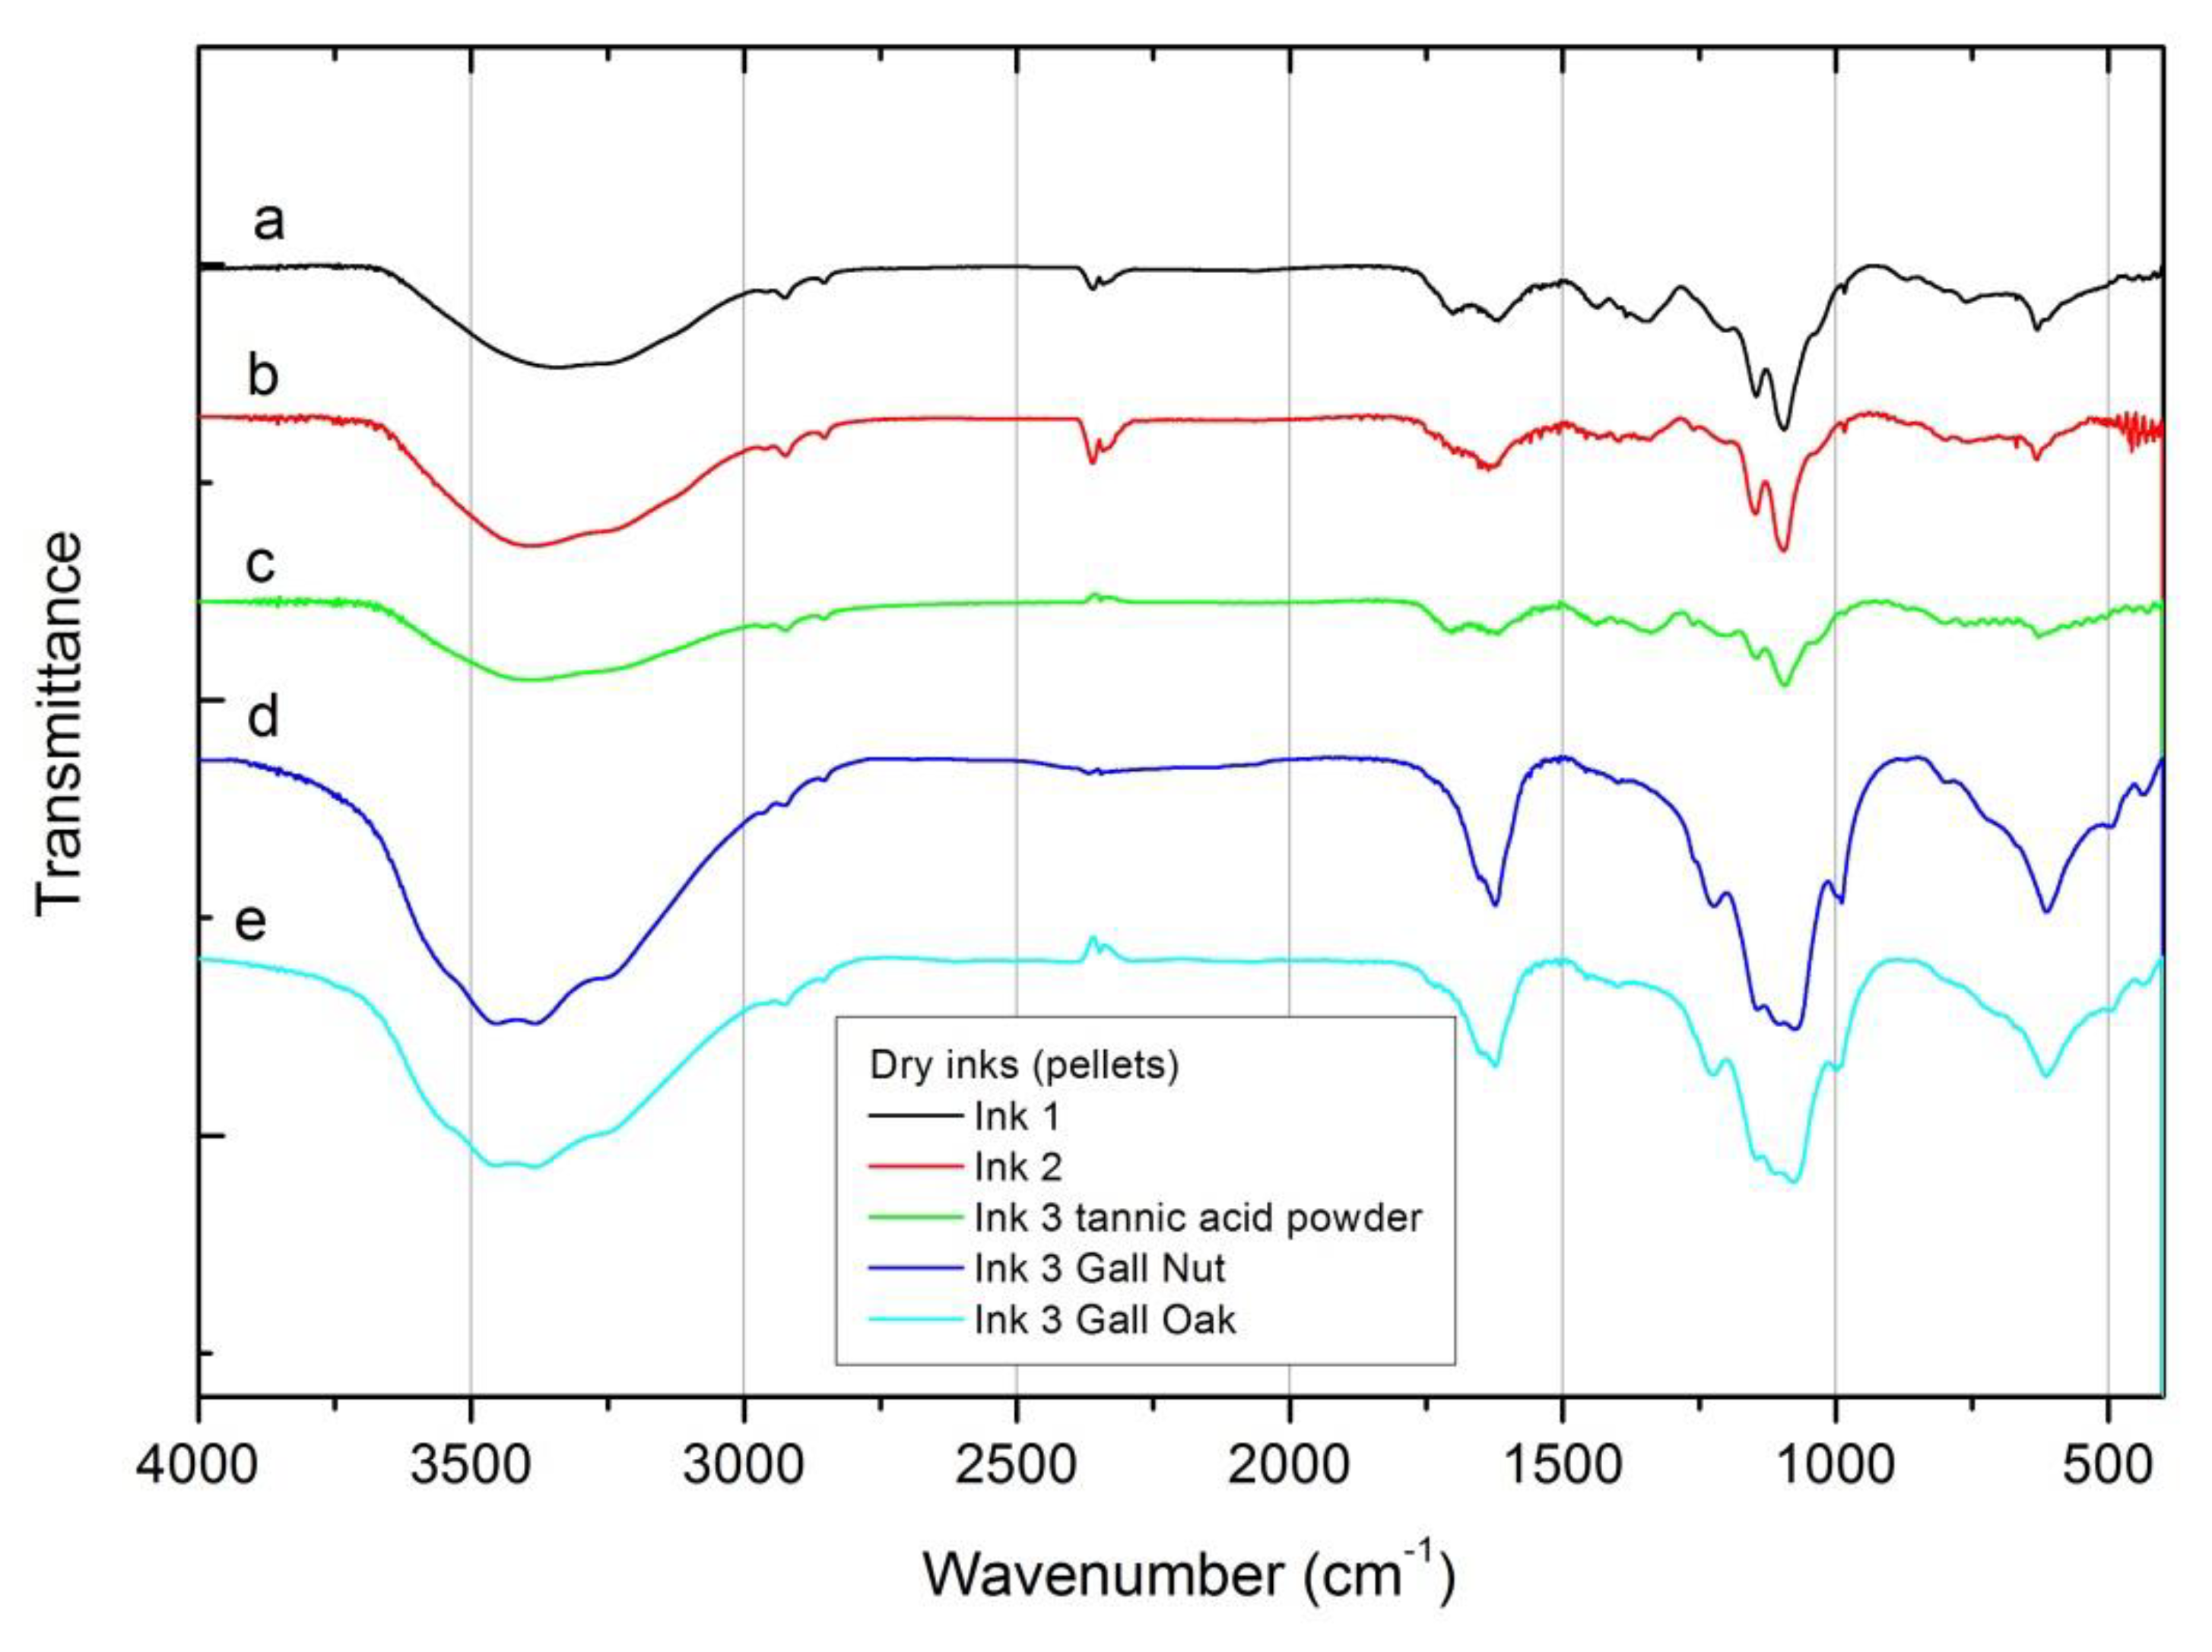
FTIR spectra of dry inks are shown in Figure 3. Spectra can be divided in two groups, independently of the recipe used: those containing commercial tannic acid powder and those made with tannin source from gall oaks and nuts. In the 3600–3000 cm-1 range the signal of the inks produced using the galls can be deconvoluted (not shown in the figure) in four main peaks centered at 3546, 3457, 3381 and 3245 cm-1, related to the stretching vibrations of OH– group, being slightly shifted when compared with the FeSO4 ingredient peaks in this region. This structure is not so well resolved when considering the inks prepared from the commercial tannic acid source, perhaps due to the reasons stated before (see Section 3.1). Similarly the peaks previously identified in the FeSO4 ingredient (1093, 989, 610 and 536 cm-1) and the absorptions related to the COOH and COO– groups (1630 cm-1 and 1413 cm-1) are observed in all inks, although better resolved in the ink #3 produced with the natural tannins from gall oak, which may be associated with the type and natural concentration of tannins in this source.
3.3. Inks on Paper
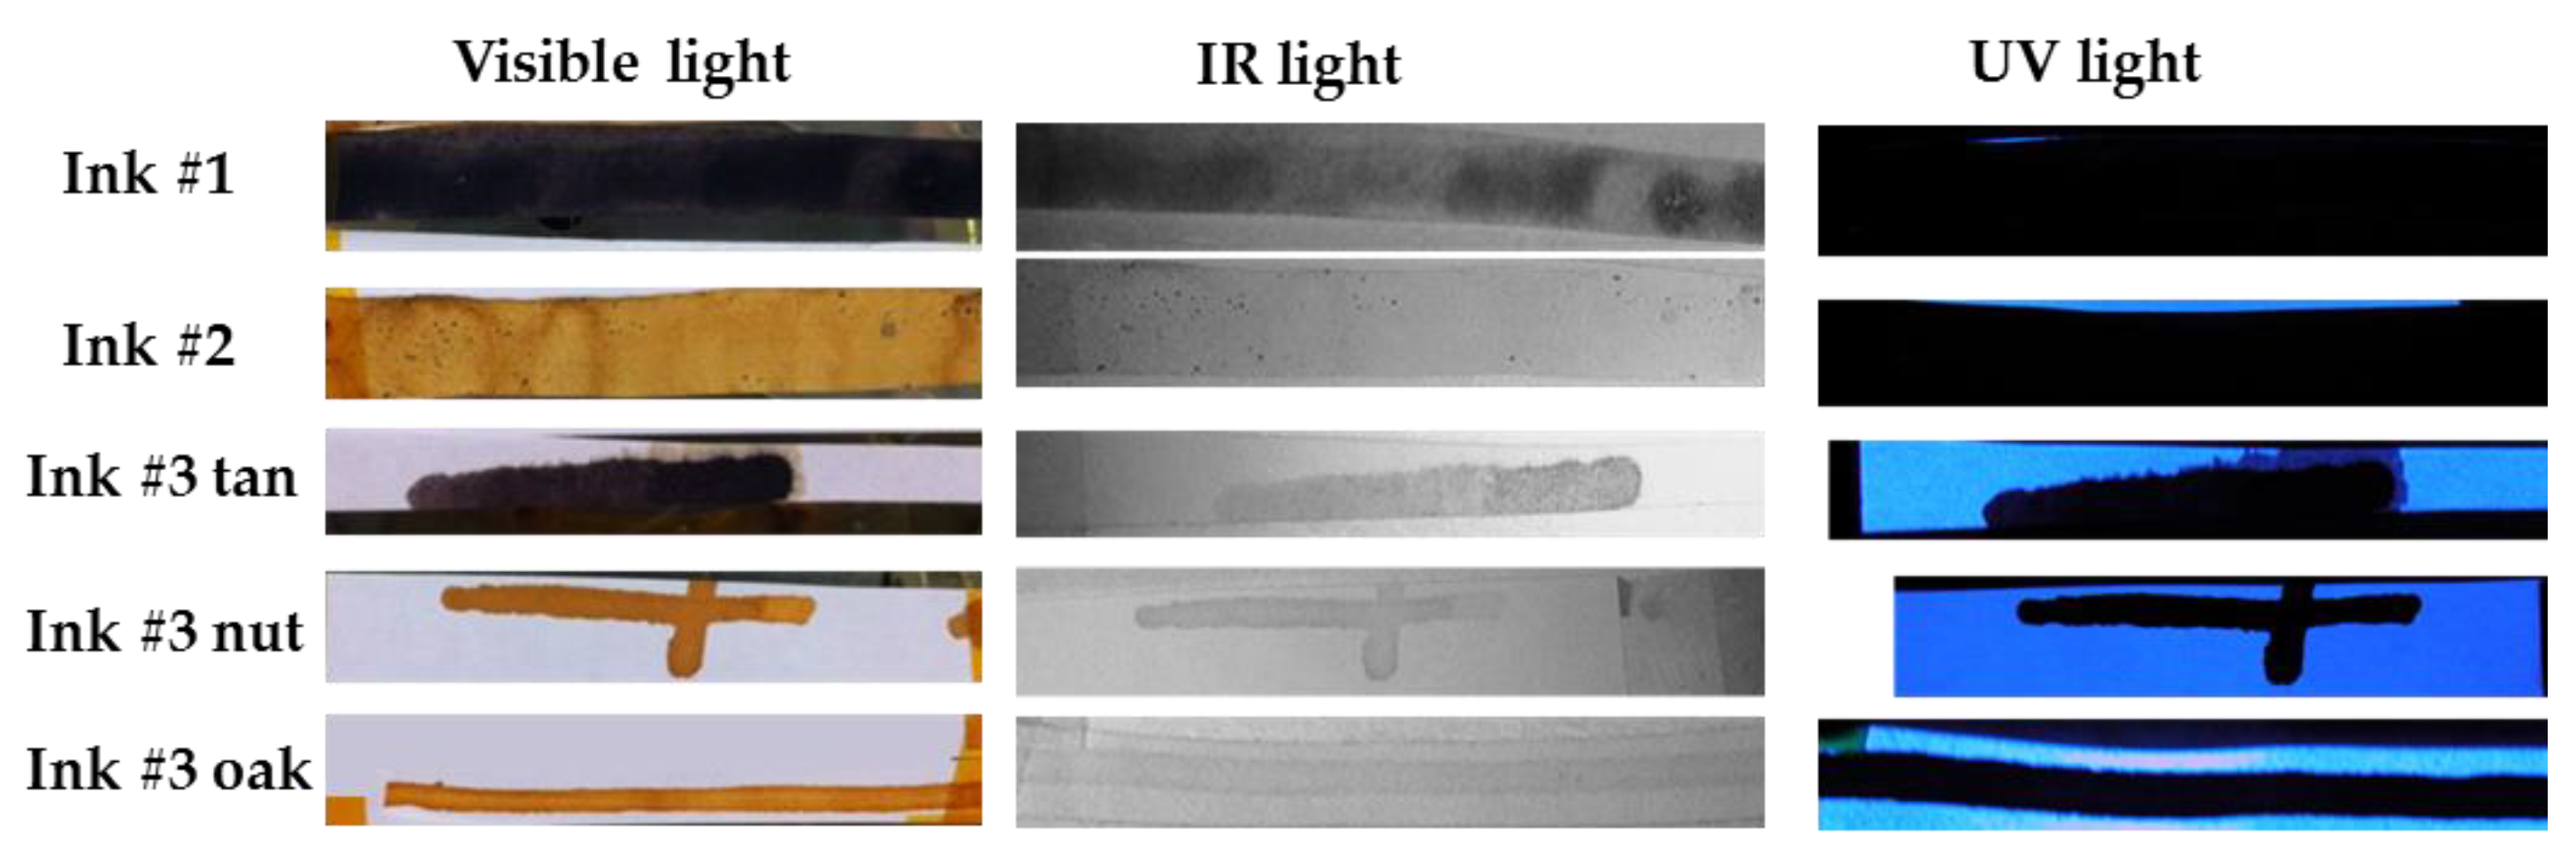
Photographs of the ink deposited on papers under visible, IR and UV light are shown in Figure 4. Black color inks were obtained for inks #1 and #3 using commercial tannic acid while pale brown colors were obtained for inks #2 and #3 (with gall nuts and gall oaks). It should be noted that the dark color of these inks is due to the presence of stable Fe(III) complexes, resulting from the iron sulfate’s oxidation due to oxygen in the environment and the tannic acid.
As shown in the photograph under visible light, ink #2 shows small dark points, which indicates that the mixture was not well stirred. Ink #3 with commercial tannic acid shows more ink migration over the paper than the other inks, being also visible under UV illumination. Under this UV light, all bare regions show similar whitish emission. Furthermore, all inks (except ink #1) are almost transparent to the IR radiation.
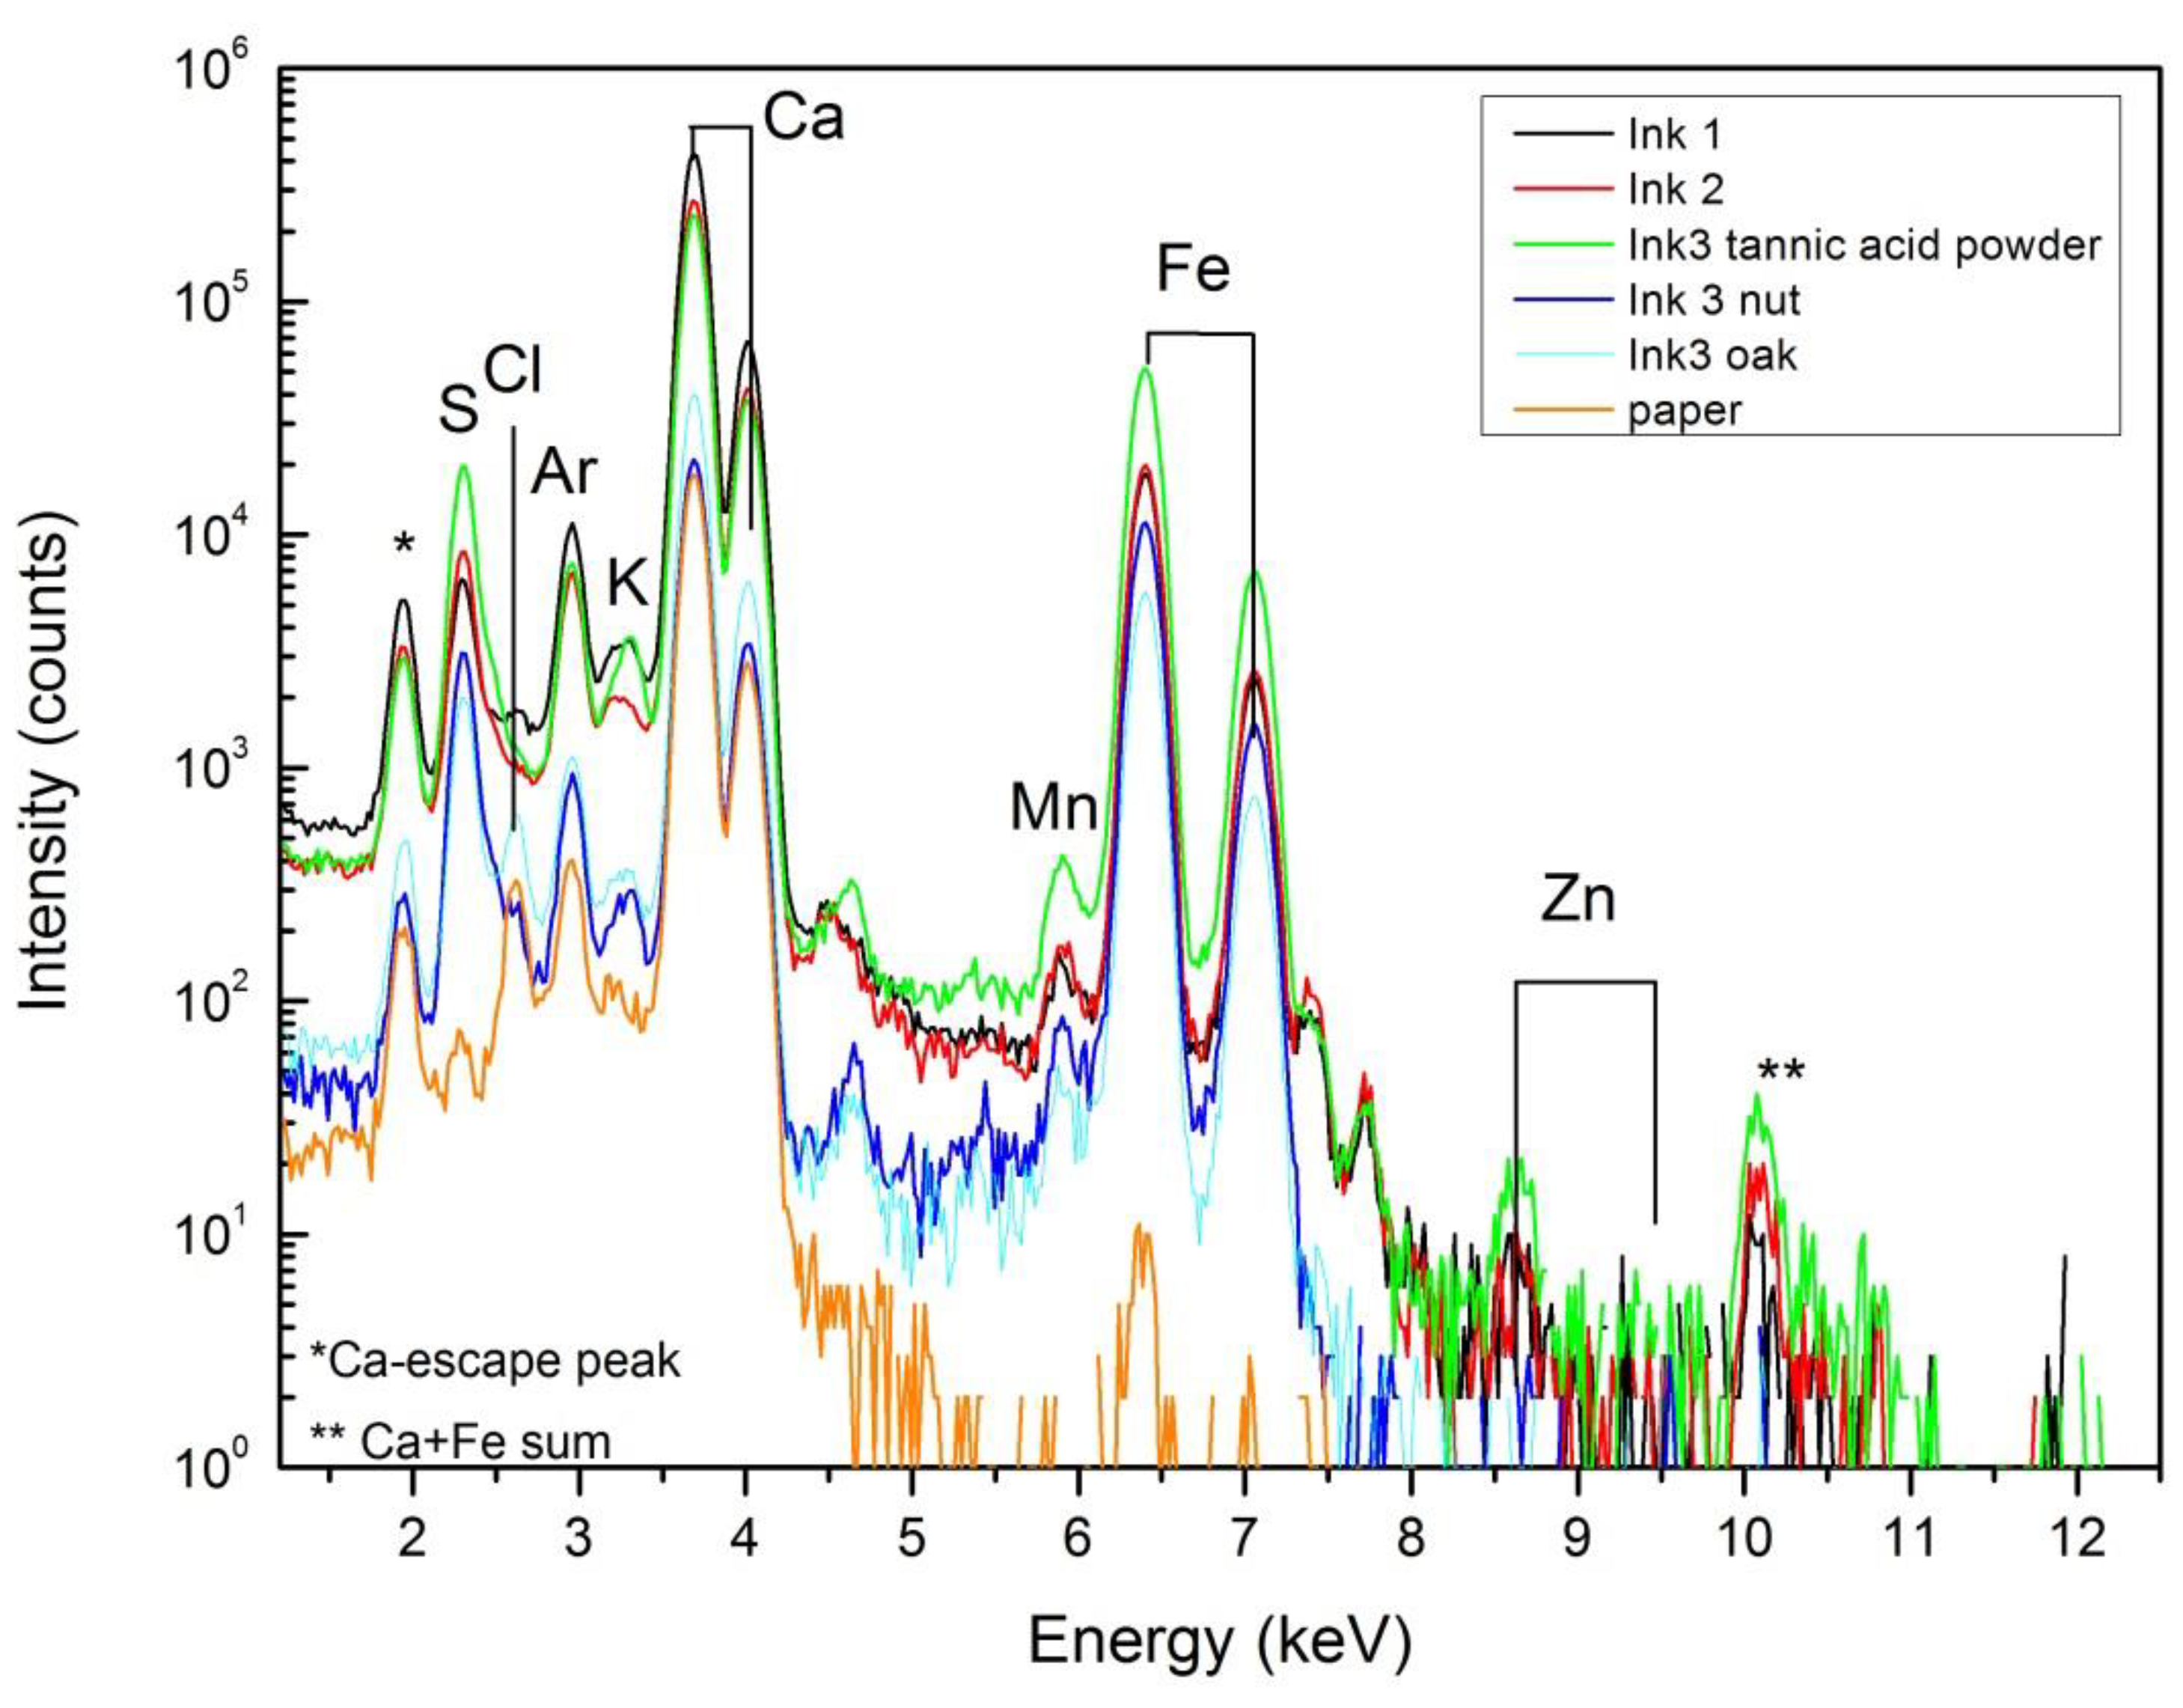
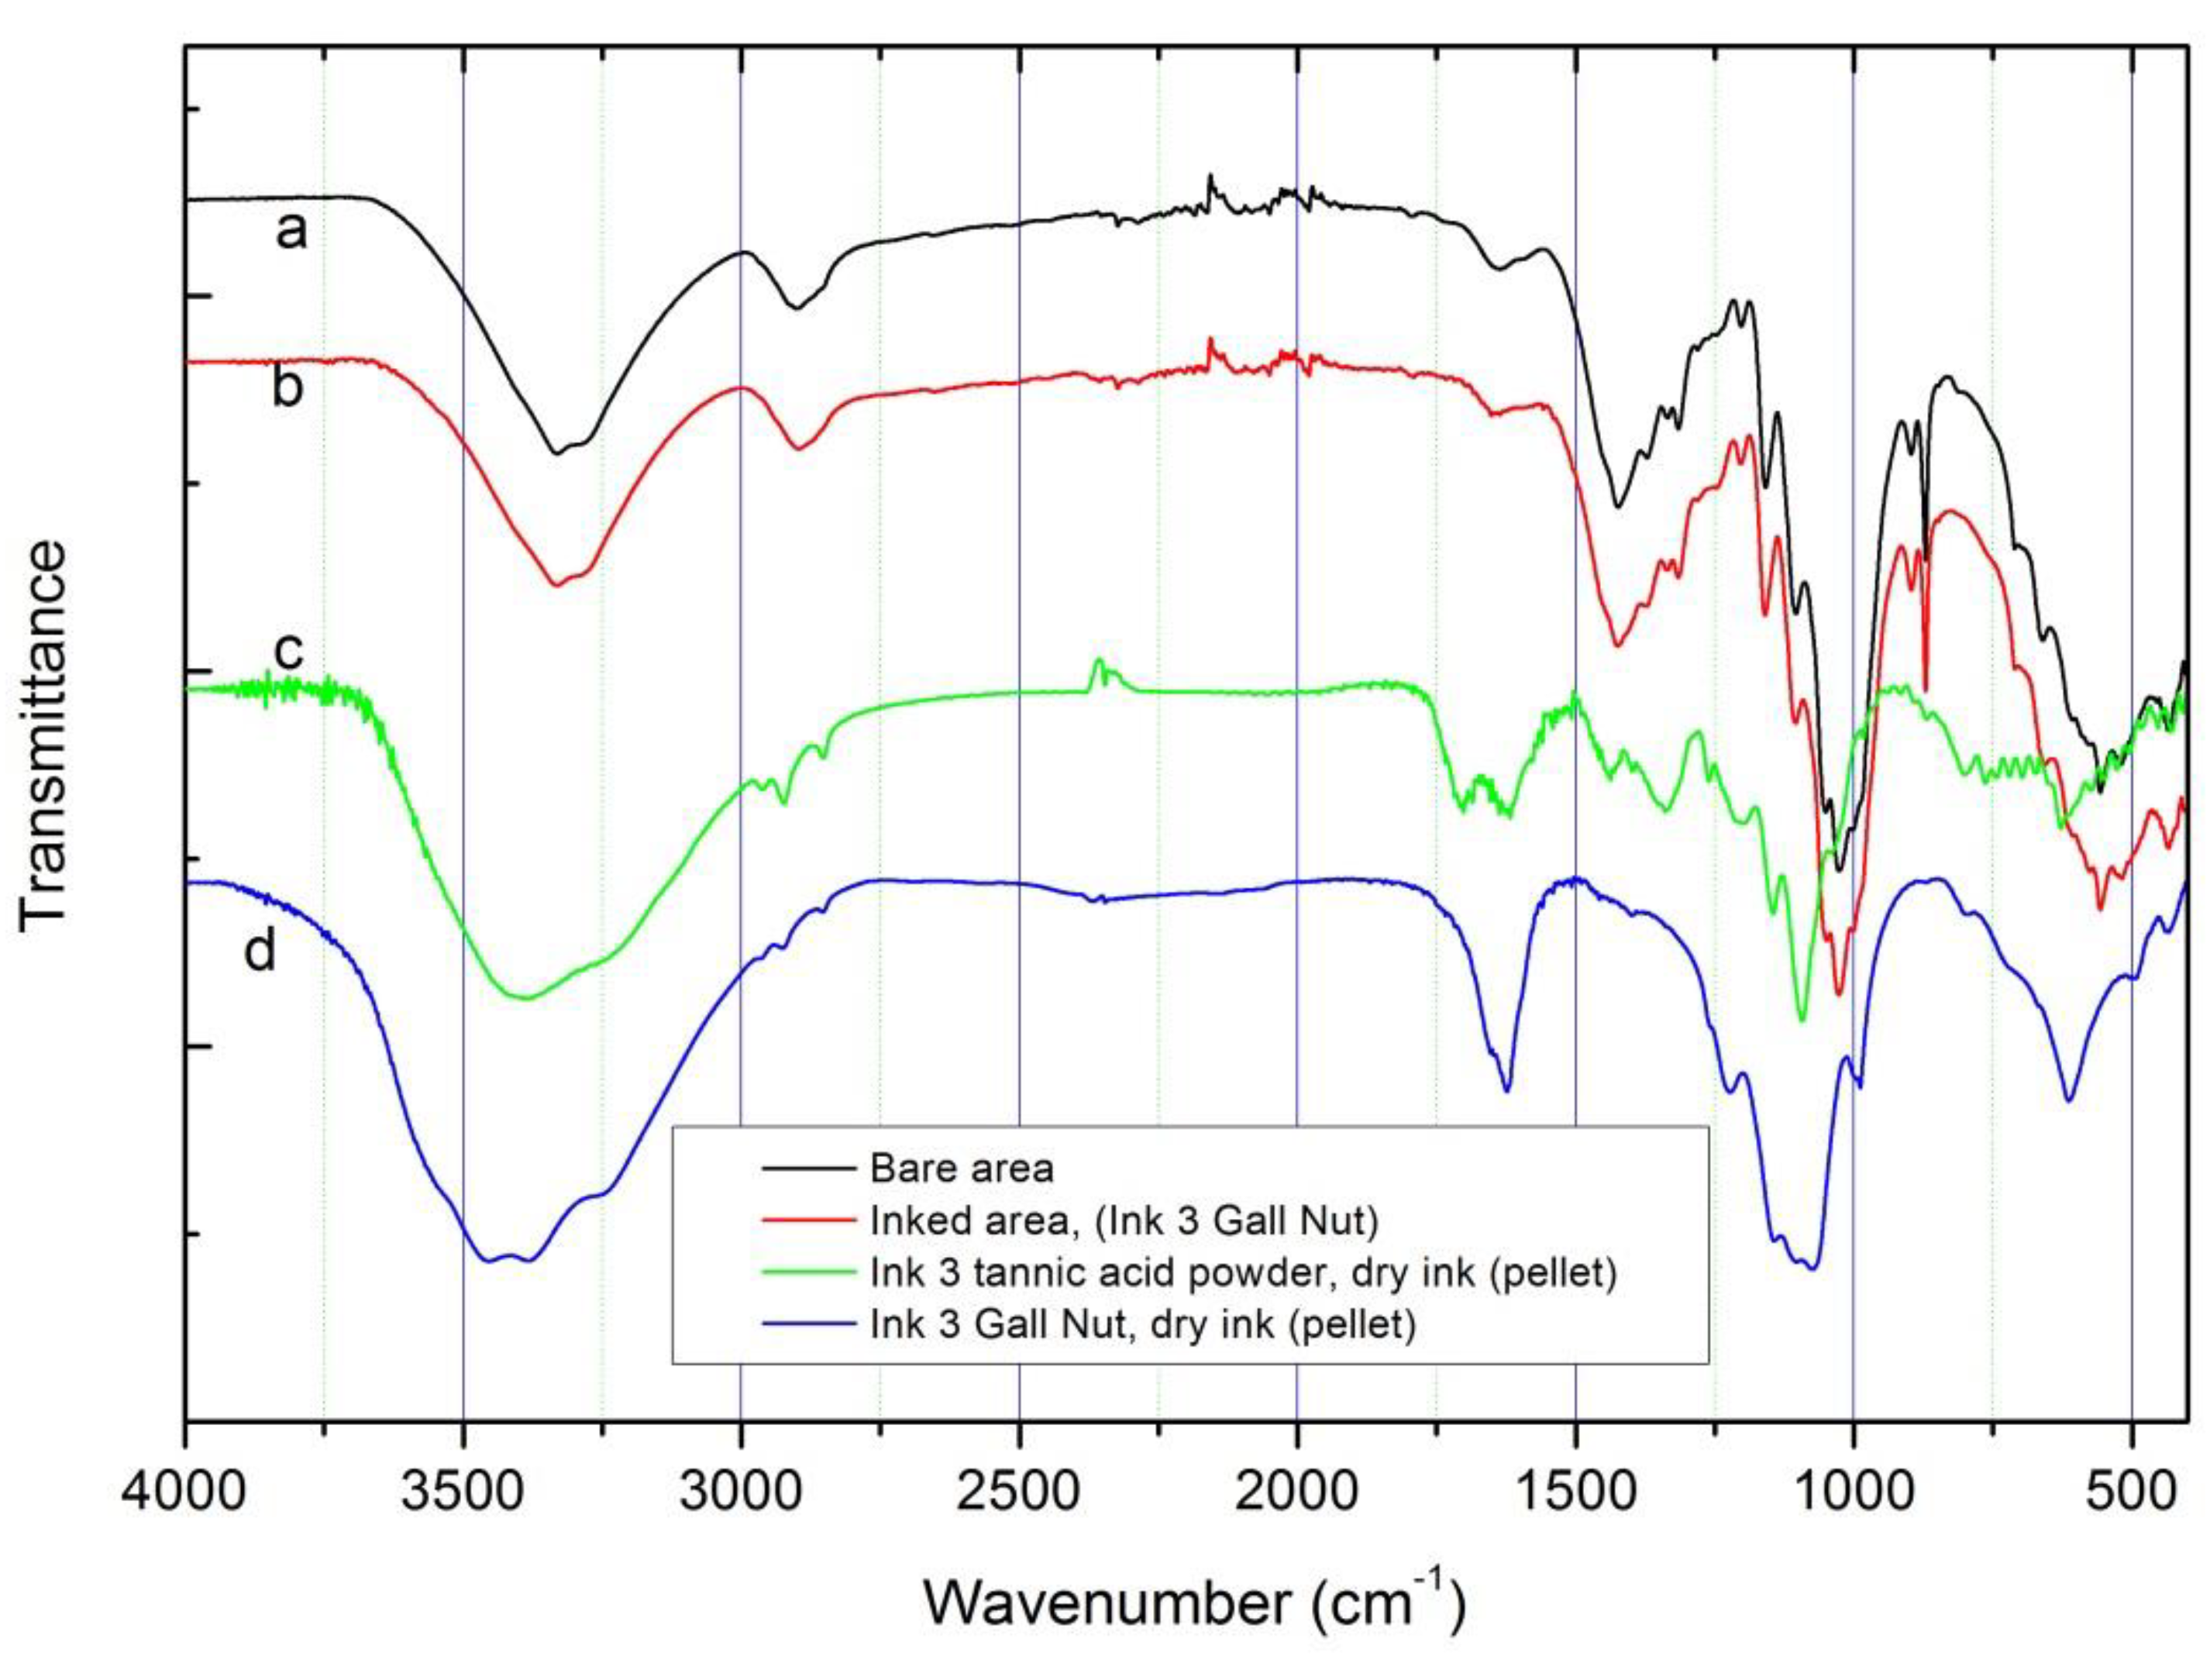
From the point of view of elemental composition, PIXE (see Figure 5) cannot differentiate between the inks since the initial ingredients, except the tannin sources, are identical. Due to the sensibility of the technique, it is possible to detect in the inked areas the presence of impurities like zinc and manganese (also present in the FeSO4 ingredient). Other impurities such as chlorine and potassium were also detected by PIXE, which could be related either to the ink or to the paper composition. The high calcium signal comes mainly from the paper support that, as shown by FTIR spectroscopy and XRD, could be related to the presence of calcite (absorption peaks at 1418 and 875 (sharp) cm-1) and calcium sulfate (absorption peaks and 1150, 1115, 1095 and 1008 (sharp) cm-1) [9]. These absorption peaks, observed on bare and inked FTIR spectra, are not present on the spectra of dry ink #3 with tannic acid powder and dry ink #3 with gall nuts (Figure 6c,d, respectively).
By FTIR spectroscopy it was not possible to distinguish clear differences between inked and not inked areas of paper, possibly due to the low amount of ink deposited on the paper. The FTIR spectra recorded in this work on inked areas are similar to that published by Librando et al. [14] where no-print areas of books printed in the twentieth and twenty-first centuries were characterized.
FTIR spectra recorded for all inked areas and bare paper are almost identical (Figure 6a,b). For a better comparison FTIR spectra of ink #3 pellets (with commercial tannic acid and gall nuts) are included. As can be observed, the characteristic absorption of the SO42- group (from calcium sulfate) are also visible in the inked paper spectrum; exceptions are observed for absorptions near 610 cm-1 (associated with SO42- out of plane bending vibrations). Some absorption bands associated with inks, in the range of 1300–1000 cm-1, are partially covered probably due to the cellulose molecular vibrations in this range (assigned to C–O stretching from carbohydrate units of cellulose) [14]. In addition to the bands related to OH groups (at 3400–3200 cm-1), the C–H stretching vibration at 2894 cm-1 can be observed, as well as the bending vibrations of CH–COH at 1423 cm-1, CCH–COH group (at 1370, 1335 and 1316 cm-1) and the COC stretching at 1150 cm-1 (all also associated to cellulose molecular vibrations). This is more evident in the spectrum of the inked area with ink #3 (gall nuts). These data suggest that the paper cellulose content maintains a good structural cohesion after ink deposition, a fact that was confirmed by the low decrease of crystallinity obtained by XRD analysis (see below).
Calcium oxalates, iron oxalates or iron potassium oxalates, detected by other researchers [9] in old documents written with iron gall inks, could not be detected in the studied samples.
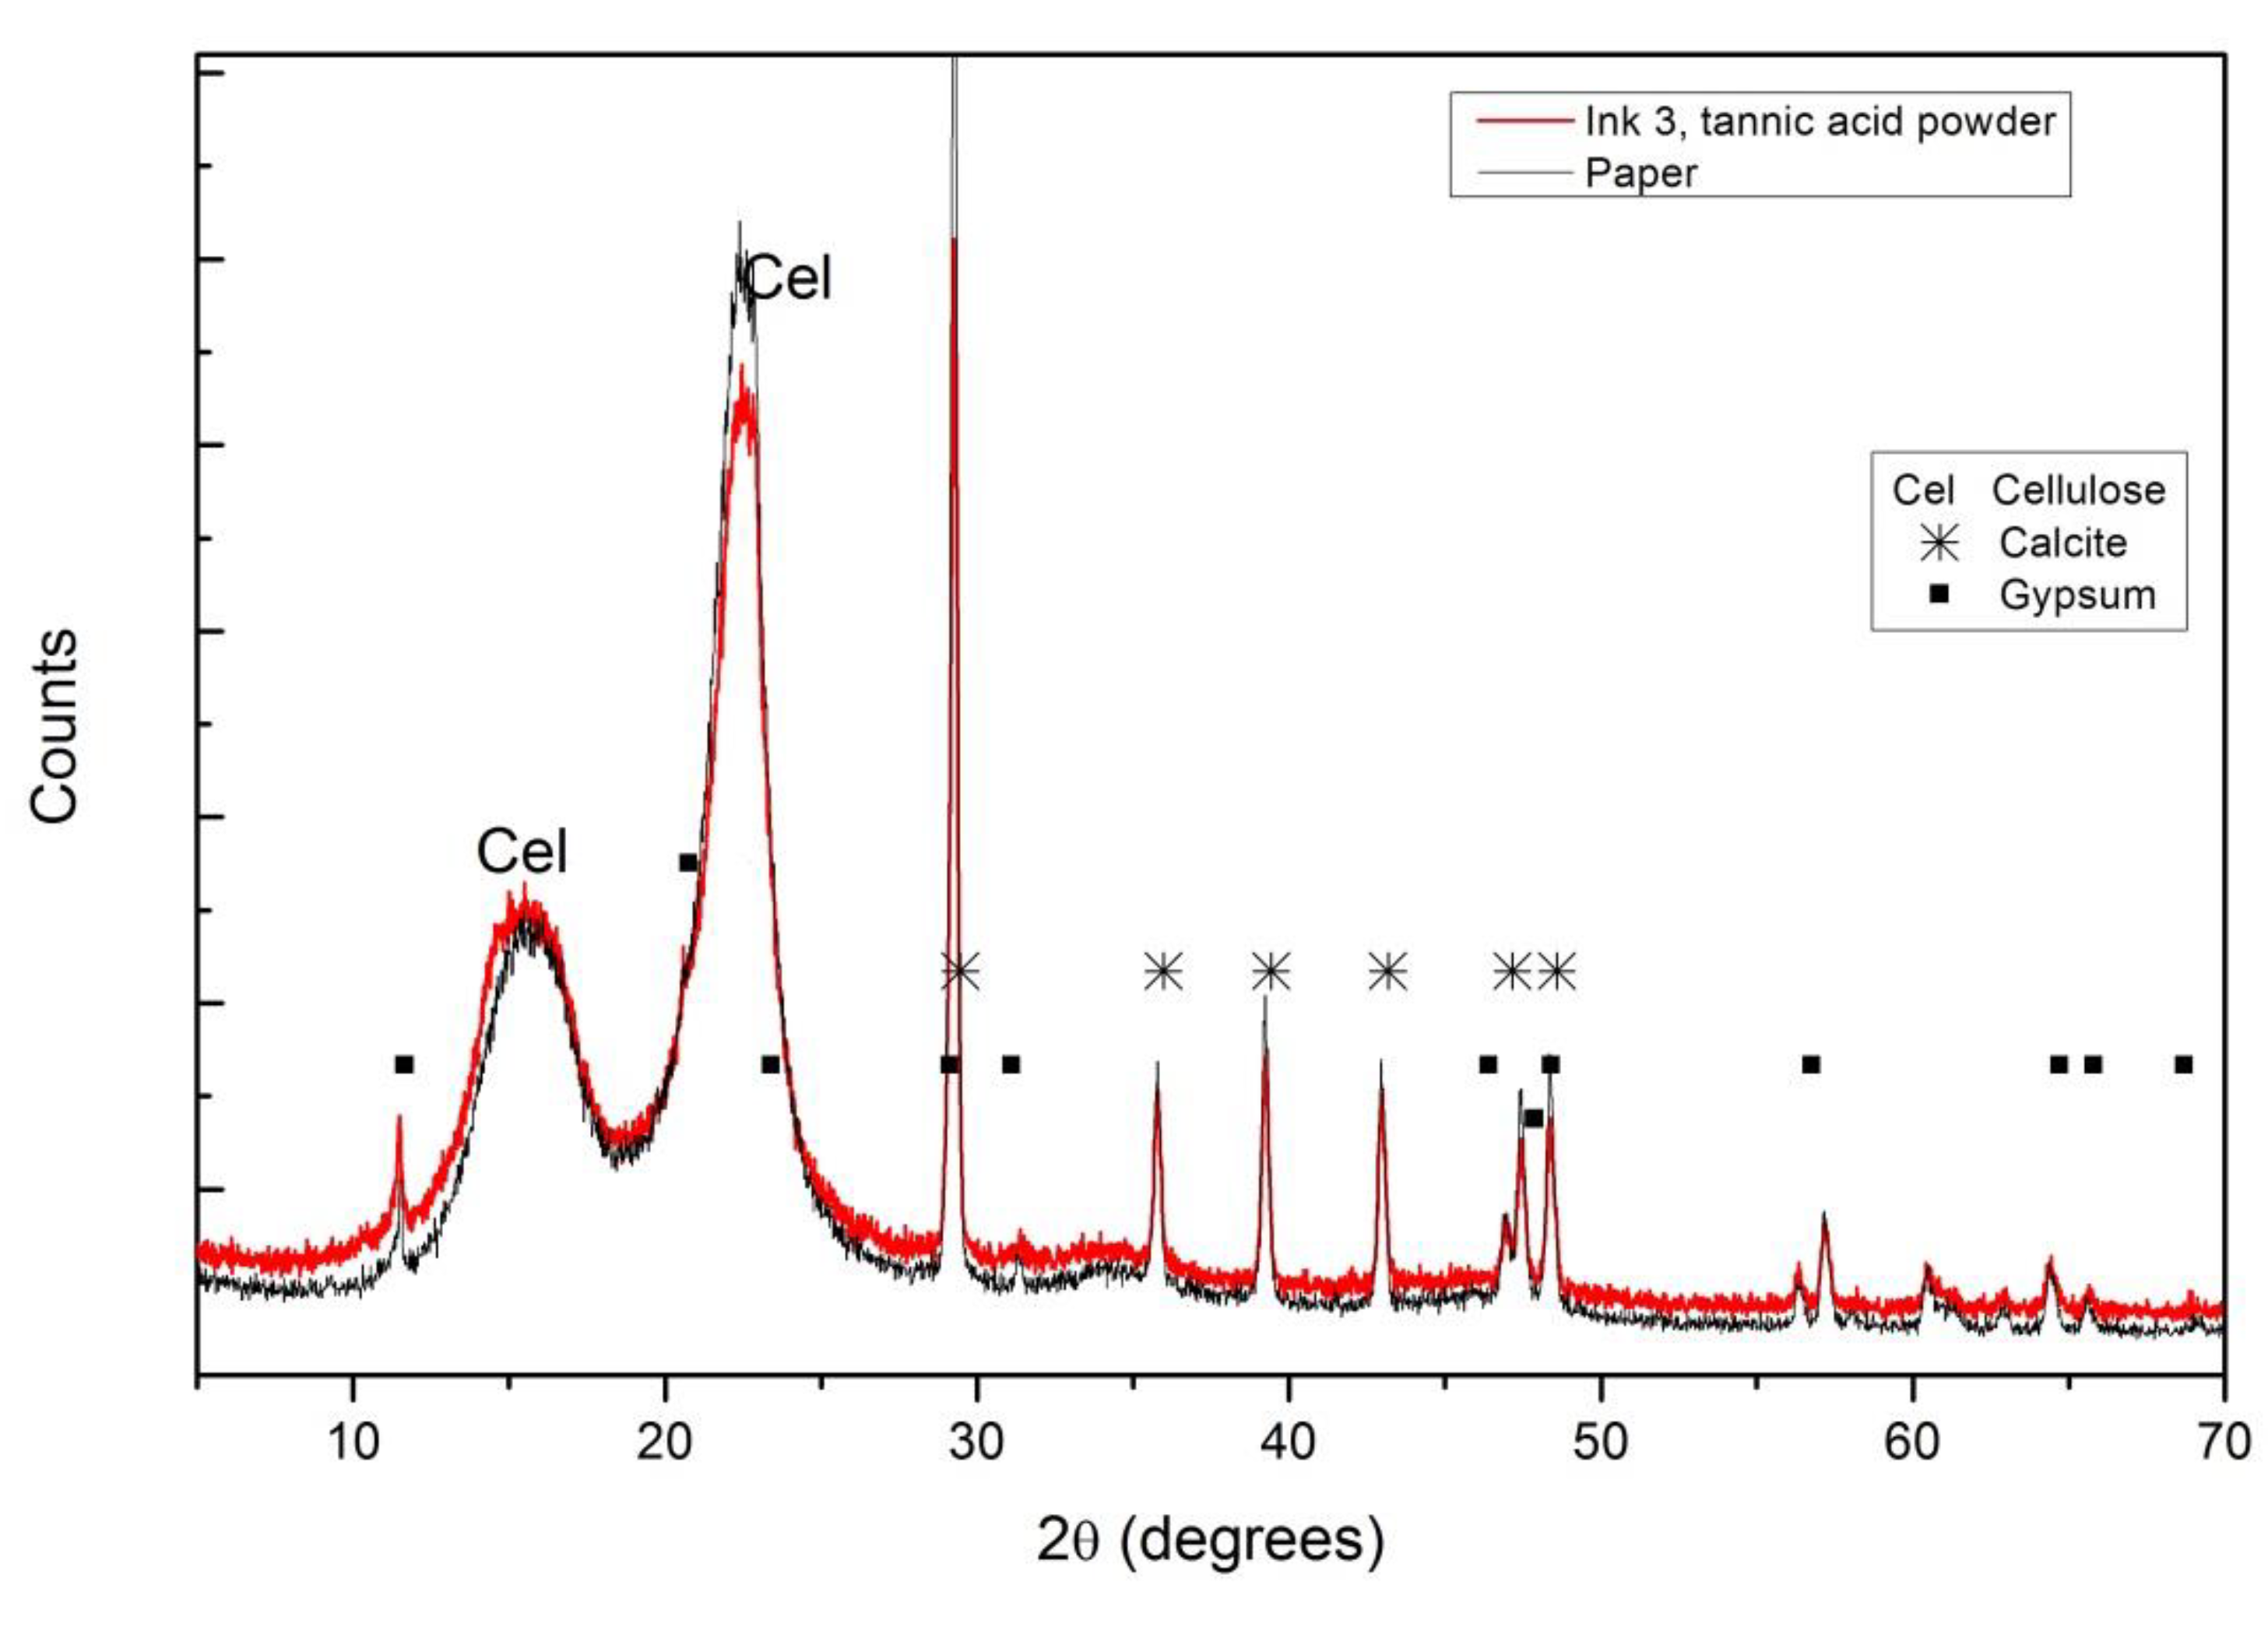
The composition of paper can also be obtained from the XRD diffractograms, where (as in the case of FTIR) no differences between the inked (all inks) and not inked areas were observed. Figure 7 shows the diffractogram obtained from the paper covered by ink #3 produced with commercial tannic acid and the same paper without ink. In addition to the peaks related to cellulose (C6H10O5), it is also possible to identify calcite (CaCO3) and gypsum (calcium sulfate dehydrated) used as fillers to obtain better gloss and opacity properties for the paper.
The relative degree of crystallinity index (CrI) of bare and inked areas was calculated following the method suggested by Segal et al. [29]. From the most simplistic viewpoint, paper can be modeled as cellulosic fibers connected by strong intramolecular hydrogen bonds with additives. About 80% of these fibers are ordered (crystalline forms) and the remainders are unordered (amorphous cellulose). Thus, the CrI can be calculated as shown in Equation (1), where I002 is the intensity of the cellulose crystalline peak at 22.7° and Iam is the intensity of the amorphous reflection at 18.6°. CrI calculated values are summarized in Table 1.
4. Discussion
The use of commercial products to reproduce ancient iron gall inks and study the paper degradation produced by these inks implies the use of pure materials with low amounts of impurities (as has been confirmed by the PIXE technique) in comparison with the impurity concentrations found in ancient iron gall inks [2,12,13,30,31]. On one hand, it allows the effect of iron ions on cellulose fibers to be studied, but on the other, the undesired metal-catalyzed reactions of transition metal impurities such as copper or zinc (contaminants in the raw materials) cannot be studied in detail.
Furthermore, the reduced penetration of the ink into the paper (less than 1 μm) makes it difficult to separate the signals from the paper and the ink by means of the characterization techniques used in this study. By Rutherford backscattering spectrometry, using a 2 MeV alpha particle beam and vacuum conditions, it was possible to obtain the depth penetration of these inks always being lower than 550 nm [32]. Nevertheless, it should be pointed out that under those experimental conditions, the beam induces non-reversible damage on the samples.
In this sense, the 2 MeV proton beam penetrates into the cellulose matrix about 60 μm [33], in the FTIR-ATR spectroscopy technique, the radiation can penetrate into the sample approximately by 1–3 μm where part of the radiation is absorbed, and lower if considering the radiation used during the XRD measurements. This could be the reason why it was only possible by XRD to infer the effect of the ink, just after deposition on the paper, on the degradation process of the cellulose.
Since all samples were under identical exogenous factors that can affect the paper stability, as external temperature, humidity or oxygen content, the loss of crystallinity observed in all samples, even not so high, should be then related to endogenous factors, and more specifically linked to the ink. The acidic elements of the inks result in the acid-hydrolysis of cellulose shortening the chains, thus reducing the content of the crystalline form. This mechanism will be among the first stages of inked paper degradation, followed by oxidation involving free radicals and Fenton reactions, inducing the progressive fragmentation of the cellulose fibers resulting in brittleness and, in extreme cases, fractures and loss of material. It should be noted that oxidized groups such as carbonyl and carboxyl groups or oxalates, usually found in old documents with signs of corrosion [9], were not identified in the studied samples.
Nevertheless, old documents are written on paper with different compositions, containing natural hemp, cotton or linen fibers with a high content of cellulose, starch or animal glue. Furthermore, paper manufacturing has changed along the centuries and geographically, and composition may differ depending on the destined market. Proietti et al. [34] reported differences in the morphology and uniformity of the fibers and glue of paper manufactured in Italy in the fourteenth century. Thus, the arrangement of those ancient fibers, and paper composition, may also be affected by the iron gall ink just after deposition, and along the centuries, being possible and likely to show different signs of corrosion.
Considering the inks reproduced, all of them absorb the UV light [35] in a similar way but they are different under IR and visible light. Under visible light inks #2 and #3 (with gall nuts and gall oaks), are pale brown, showing less of a concentration of Fe(III) complexes than the other inks. Using Mössbauer spectroscopy Dzinavatonga et al. [19] found that the discolored inks on ancient manuscripts are related to the presence of Fe(II) ions. Ink #2 has the highest content of iron sulfate and tannic acid, resulting in a more acidic ink and high concentration of Fe(II) ions, which can transform into particularly reactive hydroxyl radicals and iron(III) ions by Fenton reactions. This combination results in a more degraded cellulose structure than the cellulose inked with the other inks produced with commercial tannic acid, under identical external conditions. Moreover, if different tannin sources are used following the same recipe, those containing natural galls show a lower degree of crystallinity; ink #3 produced with gall nuts showed the lowest CrI index. This could be related to the fact that in natural galls, tannic acid concentration is higher, having other acid compounds, as gallic acid.
5. Conclusions
From the PIXE technique it was possible to know the composition of iron gall inks, including the presence of impurities at very low concentrations, which are present even when commercial starting ingredients are used.
The FTIR spectroscopy technique characterized the starting materials and differentiated between natural and commercial tannin sources regarding their relative level of hydration and organic contamination. Nevertheless, it did not clearly distinguish the differences between inked and not inked regions on paper.
The XRD technique also checked the hydration level of the iron sulfate ingredient, which tends to change when exposed to air. From the point of view of compound identification, differences between inked and not inked areas of paper were not detected by this technique, but it could diagnose loss of crystallinity on inked areas, which are related to the first steps of paper degradation due to endogenous factors.
This work was conducted to check the suitability of a set of non-destructive techniques to study manuscripts written with iron gall inks, providing information on the first step of paper deterioration due to the presence of iron gall inks. XRD results show that paper degradation is mainly due to acid-hydrolysis of the cellulose and the presence of Fe(II) ions, factors that lead to the shortening of cellulose chains, which could be an explanation to the observed reduction in its crystallinity. This process depends on the recipe and starting raw materials. The use of ingredients with different concentrations of natural antioxidant polyphenols, besides tannic acid, can extend or reduce the conversion of Fe(II) into Fe(III), interfering by this way in the degradation kinetic of cellulose-based matrices.
These preliminary results obtained will be considered to the study of ancient documents written with these inks. However, it should be noted that the composition of ancient paper and its manufacture process is different, so the degradation mechanism and respective kinetic could be altered by the presence, for example, of natural fibers, starch or animal glue.
Supplementary Materials
The following are available online at https://www.mdpi.com/2571-9408/2/4/166/s1, Figure S1: PIXE spectra of the ingredients. (A) Arabic gum; (B) iron sulfate; (C) tannic acid powder, Figure S2: XRD diffractogram for Arabic gum, Figure S3. XRD diffractograms for tannin sources.
Author Contributions
Conceptualization, V.C. and R.V.; methodology, V.C. and R.V.; validation, V.C. and R.V.; formal analysis, V.C. and R.V.; investigation, V.C., R.V., L.M.F. and L.C.A.; resources, V.C., R.V., L.M.F. and L.C.A.; writing—original draft preparation, V.C. and R.V.; writing—review and editing, V.C., R.V., L.M.F. and L.C.A.; visualization, V.C., R.V., L.M.F. and L.C.A.; supervision, V.C.; project administration, V.C.
Funding
This research was partly funded by FCT (Fundação para a Ciência e a Tecnologia, Portugal) through the UID/Multi/04349/2013 and UID/FIS/50010/2013 projects and by private funds.
Acknowledgments
Technical support from Tiago Monteiro and Rute Pinheiro is acknowledged. We thank Dr. N. Franco for the helpful discussions and XRD measurements. Impersol Lda. is acknowledged for providing access to UV and IR set-ups. Special thanks to Ciência Viva participants for their help. V.C. acknowledges the support from UID/Multi/04349/2019.
Conflicts of Interest
The authors declare no conflicts of interest.
References
- Rouchon, V.; Bernard, S. Mapping iron gall ink penetration within paper fibres using scanning transmission X-ray microscopy. J. Anal. At. Spectrom. 2015, 30, 635–641. [Google Scholar] [CrossRef] [Green Version]
- Hahn, O.; Malzer, W.; Kanngiesser, B.; Beckhoff, B. Characterization of iron-gall inks in historical manuscripts and music compositions using x-ray fluorescence spectrometry. X-Ray Spectrom. 2004, 33, 234–239. [Google Scholar] [CrossRef]
- Zaccaron, S.; Potthast, A.; Henniges, U.; Draxler, J.; Prohaska, T.; McGuiggan, P. The disastrous copper. Comparing extraction and chelation treatments to face the threat of copper-containing inks on cellulose. Carbohydr. Polym. 2019, 206, 198–209. [Google Scholar] [CrossRef] [PubMed]
- Strlič, M.; Kolar, J.; Šelih, V.S.; Kočar, D.; Pihlar, B. A comparative study of several transition metals in fenton-like reaction systems at circum-neutral pH. Acta Chim. Slov. 2003, 50, 619–632. [Google Scholar]
- Mitchell, C.A.; Hepworth, T.C. Inks: Their Composition and Manufacture; Charles Griffin & Company, Ltd.: London, UK, 1904. [Google Scholar]
- Remazeilles, C.; Rouchon, V.; Bernard, J.; Calligaro, T.; Dran, J.; Pichon, L.; Salomon, J.; Eveno, M. Influence of Gum Arabic on iron-gall ink corrosion. Restaurator 2005, 26, 118–133. [Google Scholar]
- Rouchon, V.; Duranton, M.; Burgaud, C.; Pellizzi, E.; Lavédrine, B.; Janssens, K.; de Nolf, W.; Nuyts, G.; Vanmeert, F.; Hellemans, K. Room-Temperature Study of Iron Gall Ink Impregnated Paper Degradation under Various Oxygen and Humidity Conditions: Time-Dependent Monitoring by Viscosity and X-ray Absorption Near-Edge Spectrometry Measurements. Anal. Chem. 2011, 83, 2589–2597. [Google Scholar] [CrossRef] [PubMed] [Green Version]
- Csefalvayová, L.; Havlínová, B.; Čeppan, M.; Jakubíková, Z. The Influence of Iron Gall Ink on Paper Ageing. Restaurator 2007, 28, 129–139. [Google Scholar] [CrossRef]
- Ferrer, N.; Sistach, M.C. Characterisation by FTIR Spectroscopy of Ink Components in Ancient Manuscripts. Restaurator 2005, 26, 105–117. [Google Scholar]
- Strlič, M.; Menart, E.; Cigić, I.K.; Kolar, J.; de Bruin, G.; Cassar, M. Emission of reactive oxygen species during degradation of iron gall ink. Polym. Degrad. Stab. 2010, 95, 66–71. [Google Scholar] [CrossRef] [Green Version]
- Kakuee, O.; Fathollahi, V.; Oliaiy, P.; Lamehi-Rachti, M.; Taheri, R.; Jafarian, H.A. External PIXE analysis of an Iranian 15th century poetry book, Nucl. Instrum. Methods Phys. Res. Sect. B Beam Interact. Mater. At. 2012, 273, 178–181. [Google Scholar] [CrossRef]
- Viegas, R.; Corregidor, V.; Peña, M.T.; Alves, E.; Alves, L.C. Preliminary studies on iron gall inks composition using an external ion beam. Int. J. Conserv. Sci. 2013, 4, 593–602. [Google Scholar]
- Remazeilles, C.; Quillet, V.; Calligaro, T.; Dran, J.C.; Pichon, L.; Salomon, J. PIXE elemental mapping on original manuscripts with an external microbeam. Application to manuscripts damaged by iron-gall ink corrosion. Nucl. Instrum. Methods Phys. Res. Sect. B Beam Interact. Mater. At. 2001, 181, 681–687. [Google Scholar] [CrossRef]
- Librando, V.; Minniti, Z.; Lorusso, S. Ancient and modern paper characterization by FTIR and Micro-Raman spectroscopy. Conserv. Sci. Cult. Herit. 2011, 11, 249–268. [Google Scholar]
- Ursescu, M.; Malutan, T.; Ciovica, S. Iron gall inks influence on papers´thermal degradation FTIR spectroscopy applications. Eur. J. Sci. Theol. 2009, 5, 71–85. [Google Scholar]
- Zotti, M.; Ferroni, A.; Calvini, P. Microfungal biodeterioration of historic paper: Preliminary FTIR and microbiological analyses. Int. Biodeterior. Biodegrad. 2008, 62, 186–194. [Google Scholar] [CrossRef]
- Kaminari, A.-A.; Boyatzis, S.C.; Alexopoulou, A. Linking Infrared Spectra of Laboratory Iron Gall Inks Based on Traditional Recipes with their Material Components. Appl. Spectrosc. 2018, 72, 1511–1527. [Google Scholar] [CrossRef]
- Burgaud, C.; Rouchon, V.; Wattiaux, A.; Bleton, J.; Sabot, R.; Refait, P. Determination of the Fe(II)/Fe(III) ratio in iron gall inks by potentiometry: A preliminary study. J. Electroanal. Chem. 2010, 650, 16–23. [Google Scholar] [CrossRef]
- Dzinavatonga, K.; Bharuth-Ram, K.; Medupe, T.R. Mössbauer spectroscopy analysis of valence state of iron in historical documents obtained from the National Library of South Africa. J. Cult. Herit. 2015, 16, 377–380. [Google Scholar] [CrossRef]
- Corregidor, V.; Alves, L.C.; Barradas, N.P.; Reis, M.A.; Marques, M.T.; Ribeiro, J.A. Characterization of mercury gilding art objects by external proton beam. Nucl. Instrum. Methods Phys. Res. Sect. B Beam Interact. Mater. At. 2011, 269, 3049–3053. [Google Scholar] [CrossRef]
- Maxwell, J.A.; Teesdale, W.J.; Campbell, J.L. The Guelph PIXE software package II. Nucl. Instrum. Methods Phys. Res. Sect. B Beam Interact. Mater. At. 1995, 95, 407–421. [Google Scholar] [CrossRef]
- Crystal Impact. 2019. Available online: https://www.crystalimpact.de (accessed on 10 September 2019).
- OMNIC. 2019. Available online: https://www.thermofisher.com/order (accessed on 11 September 2019).
- Andrade, K.C.S.; Carvalho, W.W.P.; Takeiti, C.Y. Cashew Gum (Anacardium occidentale): Evaluation of Chemical and Physical Changes by Thermoplastic Extrusion. Polimeros 2012, 23, 667–671. [Google Scholar] [CrossRef]
- Pantoja-Castro, M.A.; González-Rodríguez, H. Study by infrared spectroscopy and thermogravimetric analysis of Tannins and Tannic acid. Revista latinoamericana de Química 2011, 39, 107–112. [Google Scholar]
- Silverstein, R.M.; Bassler, G.C.; Morril, T.C. Spectrometric Identification of Organic Compounds, 7th ed.; John Wiley & Sons Inc.: New York, NJ, USA, 1981. [Google Scholar]
- Legras, J.L.; Chuzel, G.; Arnaud, A.; Galzy, P. Natural nitriles and their metabolism. World J. Microbiol. Biotechnol. 1990, 6, 83–108. [Google Scholar] [CrossRef] [PubMed]
- Shun, A.L.K.S.; Tykwinski, R.R. Synthesis of Naturally Occurring Polyynes. Angew. Chem. Int. Ed. 2006, 45, 1034–1057. [Google Scholar] [CrossRef] [PubMed]
- Segal, L.; Creely, J.J.; Martin, A.E.; Conrad, C.M. An Empirical Method for Estimating the Degree of Crystallinity of Native Cellulose Using the X-Ray Diffractometer. Text. Res. J. 1959, 29, 786–794. [Google Scholar] [CrossRef]
- Duh, J.; Krstić, D.; Desnica, V.; Fazinić, S. Non-destructive study of iron gall inks in manuscripts. Nucl. Instrum. Methods Phys. Res. Sect. B Beam Interact. Mater. At. 2018, 417, 96–99. [Google Scholar] [CrossRef]
- Lucarelli, F.; Mandò, P.A. Recent applications to the study of ancient inks with the Florence external-PIXE facility. Nucl. Instrum. Methods Phys. Res. Sect. B Beam Interact. Mater. At. 1996, 109–110, 644–652. [Google Scholar] [CrossRef]
- Viegas, R. Compositional Characterization of Iron Gall Inks in Manuscripts Using Non-Destructive Techniques; Instituto Superior Técnico: Lisbon, Portugal, 2014; p. 100. [Google Scholar]
- Ziegler, J.F.; Ziegler, M.D.; Biersack, J.P. SRIM—The stopping and range of ions in matter (2010). Nucl. Instrum. Methods Phys. Res. Sect. B Beam Interact. Mater. At. 2010, 268, 1818–1823. [Google Scholar] [CrossRef]
- Proietti, N.; Roselli, G.; Capitani, D.; Pettinari, C.; Pucciarelli, S.; Basileo, S.; Scognamiglio, F. Characterization of Handmade Papers (13th–15th century) from Camerino and Fabriano (Marche, Italy). J. Cult. Herit. 2019. [Google Scholar] [CrossRef]
- Montani, I.; Sapin, E.; Pahud, A.; Margot, P. Enhancement of writings on a damaged medieval manuscript using ultraviolet imaging. J. Cult. Herit. 2012, 13, 226–228. [Google Scholar] [CrossRef]
Figure 1.
X-ray diffraction (XRD) diffractograms for a fresh iron sulfate pellet (black) and an iron sulfate pellet after two weeks exposed to air, “old” (red). Different compounds were identified: ■ for rozenite, ◊ for copiapite and ▲ for melanterite.
Figure 1.
X-ray diffraction (XRD) diffractograms for a fresh iron sulfate pellet (black) and an iron sulfate pellet after two weeks exposed to air, “old” (red). Different compounds were identified: ■ for rozenite, ◊ for copiapite and ▲ for melanterite.

Figure 2.
Fourier-transform infrared spectroscopy (FTIR) spectra of the ingredients. (a) Commercial tannic acid source; (b) gall nut tannic acid; (c) gall oak tannic acid; (d) Arabic gum; (e) FeSO4.
Figure 2.
Fourier-transform infrared spectroscopy (FTIR) spectra of the ingredients. (a) Commercial tannic acid source; (b) gall nut tannic acid; (c) gall oak tannic acid; (d) Arabic gum; (e) FeSO4.

Figure 3.
FTIR spectra for the dry inks, measured as pellets. (a) Ink #1; (b) ink #2; (c) ink #3 with tannic acid powder; (d) ink #3 with gall nuts; (e) ink #3 with gall oaks.
Figure 3.
FTIR spectra for the dry inks, measured as pellets. (a) Ink #1; (b) ink #2; (c) ink #3 with tannic acid powder; (d) ink #3 with gall nuts; (e) ink #3 with gall oaks.

Figure 4.
Photographs under visible, infrared (IR) and ultraviolet (UV) light of the inks deposited on commercial paper.
Figure 4.
Photographs under visible, infrared (IR) and ultraviolet (UV) light of the inks deposited on commercial paper.

Figure 5.
Proton induced X-ray emission (PIXE) spectra obtained from inked and bare areas of paper.

Figure 6.
FTIR spectra for: (a) bare area; (b) ink #3 with gall nut deposited on paper; (c) dry ink #3 with tannic acid powder (pellet); (d) dry ink #3 with gall nut (pellet).
Figure 6.
FTIR spectra for: (a) bare area; (b) ink #3 with gall nut deposited on paper; (c) dry ink #3 with tannic acid powder (pellet); (d) dry ink #3 with gall nut (pellet).

Figure 7.
XRD diffraction patterns for ink #3 with tannic acid powder on paper and bare paper. Different compounds were identified: Cel for cellulose, ✳ for calcite and ■ for gypsum.
Figure 7.
XRD diffraction patterns for ink #3 with tannic acid powder on paper and bare paper. Different compounds were identified: Cel for cellulose, ✳ for calcite and ■ for gypsum.


Table 1.
Relative degree of crystallinity index (CrI) values obtained for bare and inked areas.
| Paper | Ink #1 | Ink #2 | Ink #3 (Powder) | Ink #3 (Nut) | Ink #3 (Oak) | |
|---|---|---|---|---|---|---|
| CrI | 79.9 | 74.5 | 70.1 | 76.6 | 64.7 | 73.9 |
© 2019 by the authors. Licensee MDPI, Basel, Switzerland. This article is an open access article distributed under the terms and conditions of the Creative Commons Attribution (CC BY) license (http://creativecommons.org/licenses/by/4.0/).
Share and Cite
MDPI and ACS Style
Corregidor, V.; Viegas, R.; Ferreira, L.M.; Alves, L.C. Study of Iron Gall Inks, Ingredients and Paper Composition Using Non-Destructive Techniques. Heritage 2019, 2, 2691-2703. https://doi.org/10.3390/heritage2040166
AMA Style
Corregidor V, Viegas R, Ferreira LM, Alves LC. Study of Iron Gall Inks, Ingredients and Paper Composition Using Non-Destructive Techniques. Heritage. 2019; 2(4):2691-2703. https://doi.org/10.3390/heritage2040166
Chicago/Turabian StyleCorregidor, Victoria, Rita Viegas, Luís M. Ferreira, and Luís C. Alves. 2019. "Study of Iron Gall Inks, Ingredients and Paper Composition Using Non-Destructive Techniques" Heritage 2, no. 4: 2691-2703. https://doi.org/10.3390/heritage2040166