Article

Multi-Scale Investigation of Body-Glaze Interface in Ancient Ceramics

1
Institut de Minéralogie de Physique des Matériaux et de Cosmochimie (IMPMC), Sorbonne Université, CNRS UMR 7590, MNHN, IRD UMR 206, 75005 Paris, France
2
IPANEMA CNRS, Site du Synchrotron Soleil, BP48 St Aubin, F91192 Gif sur Yvette, France
3
Chimie ParisTech, CNRS, Institut de Recherche de Chimie Paris (IRCP), PSL Research University, 75005 Paris, France
4
Centre de Recherche et de Restauration des Musées de France (C2RMF), CNRS, Institut de Recherche de Chimie Paris (IRCP), PSL Research University, 75001 Paris, France
5
Cité de la Céramique—Sèvres et Limoges, 2 Place de la Manufacture, 92310 Sèvres, France
*
Author to whom correspondence should be addressed.
Heritage 2019, 2(3), 2480-2494; https://doi.org/10.3390/heritage2030152
Submission received: 31 July 2019 / Revised: 23 August 2019 / Accepted: 24 August 2019 / Published: 28 August 2019
(This article belongs to the Special Issue Cultural Heritage—Science, Materials and Technologies)

Abstract

:
Bernard Palissy is a French Renaissance ceramist renowned for his masterpieces called Rustiques Figulines on which dozens of glazes of different chemistries (and thus firing behaviors) coexist harmoniously. This study aims at gathering information on the master procedure -never revealed- by investigating the body-glaze interface region (focusing on iron-colored honey transparent glaze-white body system). Optical and electron microscopies including transmission electron microscopy (TEM) are used to characterize the micro and nanostructure of both archaeological and replicas interfaces elaborated in controlled conditions (firing time, cooling rate, addition of Al in the glazing mixture). Both types of interfaces are comparable: a modified paste area from which are growing a relatively continuous layer of interfacial crystals identified as lead feldspars (K,Ca)PbAl2Si2O8 micro-sized single-crystals incorporating mullite 3Al2O3.2SiO2 nano-sized single-crystals. Modification of the firing parameters and removal of Al from the glazing mixture change essentially the interface extension and the micro-crystals morphology. By comparing archaeological and replica interfaces and considering previous studies, we can now state that Palissy was very likely adding clay (Al) in his frit. Moreover, he was probably working with a firing time of more than 1 h followed by slow cooling in the oven.

Graphical Abstract

1. Introduction

Bernard Palissy (1510–1590) is one of the most famous French Renaissance ceramists. His masterpieces called the Rustique Figulines are ceramic plates, vases or architectural elements adorned with molded animals (reptiles, fishes, shells, etc.) or plants laying on a rockery-style base [1]. To enhance the realistic appearance, Palissy was using colorful lead glazes to decorate the ceramic pieces. The artist was able to deal with a dozen of glazes of different colors and transparencies (and thus different chemical compositions and firing behaviors) to obtain at the end a single object illuminated by a harmonious set of glazes cohabiting perfectly together, without any elaboration defects (burr, cracks, etc.). In his writings, Palissy highlights how these results have been achievable only after long years of sacrifice and hard labor [2]. Consequently, he always refuses to reveal his recipe secrets: very few information about the elaboration process of his glazed ceramics (raw materials, firing parameters) are available in his publications.
In the 1980s, Palissy workshop in the Tuileries garden (Paris) was excavated in the context of the Louvre Pyramid construction. Inside, a lot of glazed ceramics fragments including crockery and architectural elements, plus some materials used for their production (clay molds, saggars, etc.) were found [3]. These precious archaeological samples represent a wealth of information for scientists. Glazes and pastes microstructures, including the glaze-paste interface area on which we are going to focus in this paper, were thoroughly investigated to obtain information on the ceramist elaboration method [1,4,5,6]. More generally, detailed investigation of ancient ceramics provides valuable information on the raw materials used, their provenance, their thermal history, and thus gives us a glimpse on arts and crafts of the past. For this purpose, scientists often proceed by comparing archaeological pieces with replicas elaborated under controlled conditions in the laboratory to precise the artist manufacturing procedure [7].
Why looking especially at the glaze-paste interface region? First it should be recalled that during the firing of glazed ceramic, strong interactions occur between glaze and paste which are going to modify the chemistries of both parts [
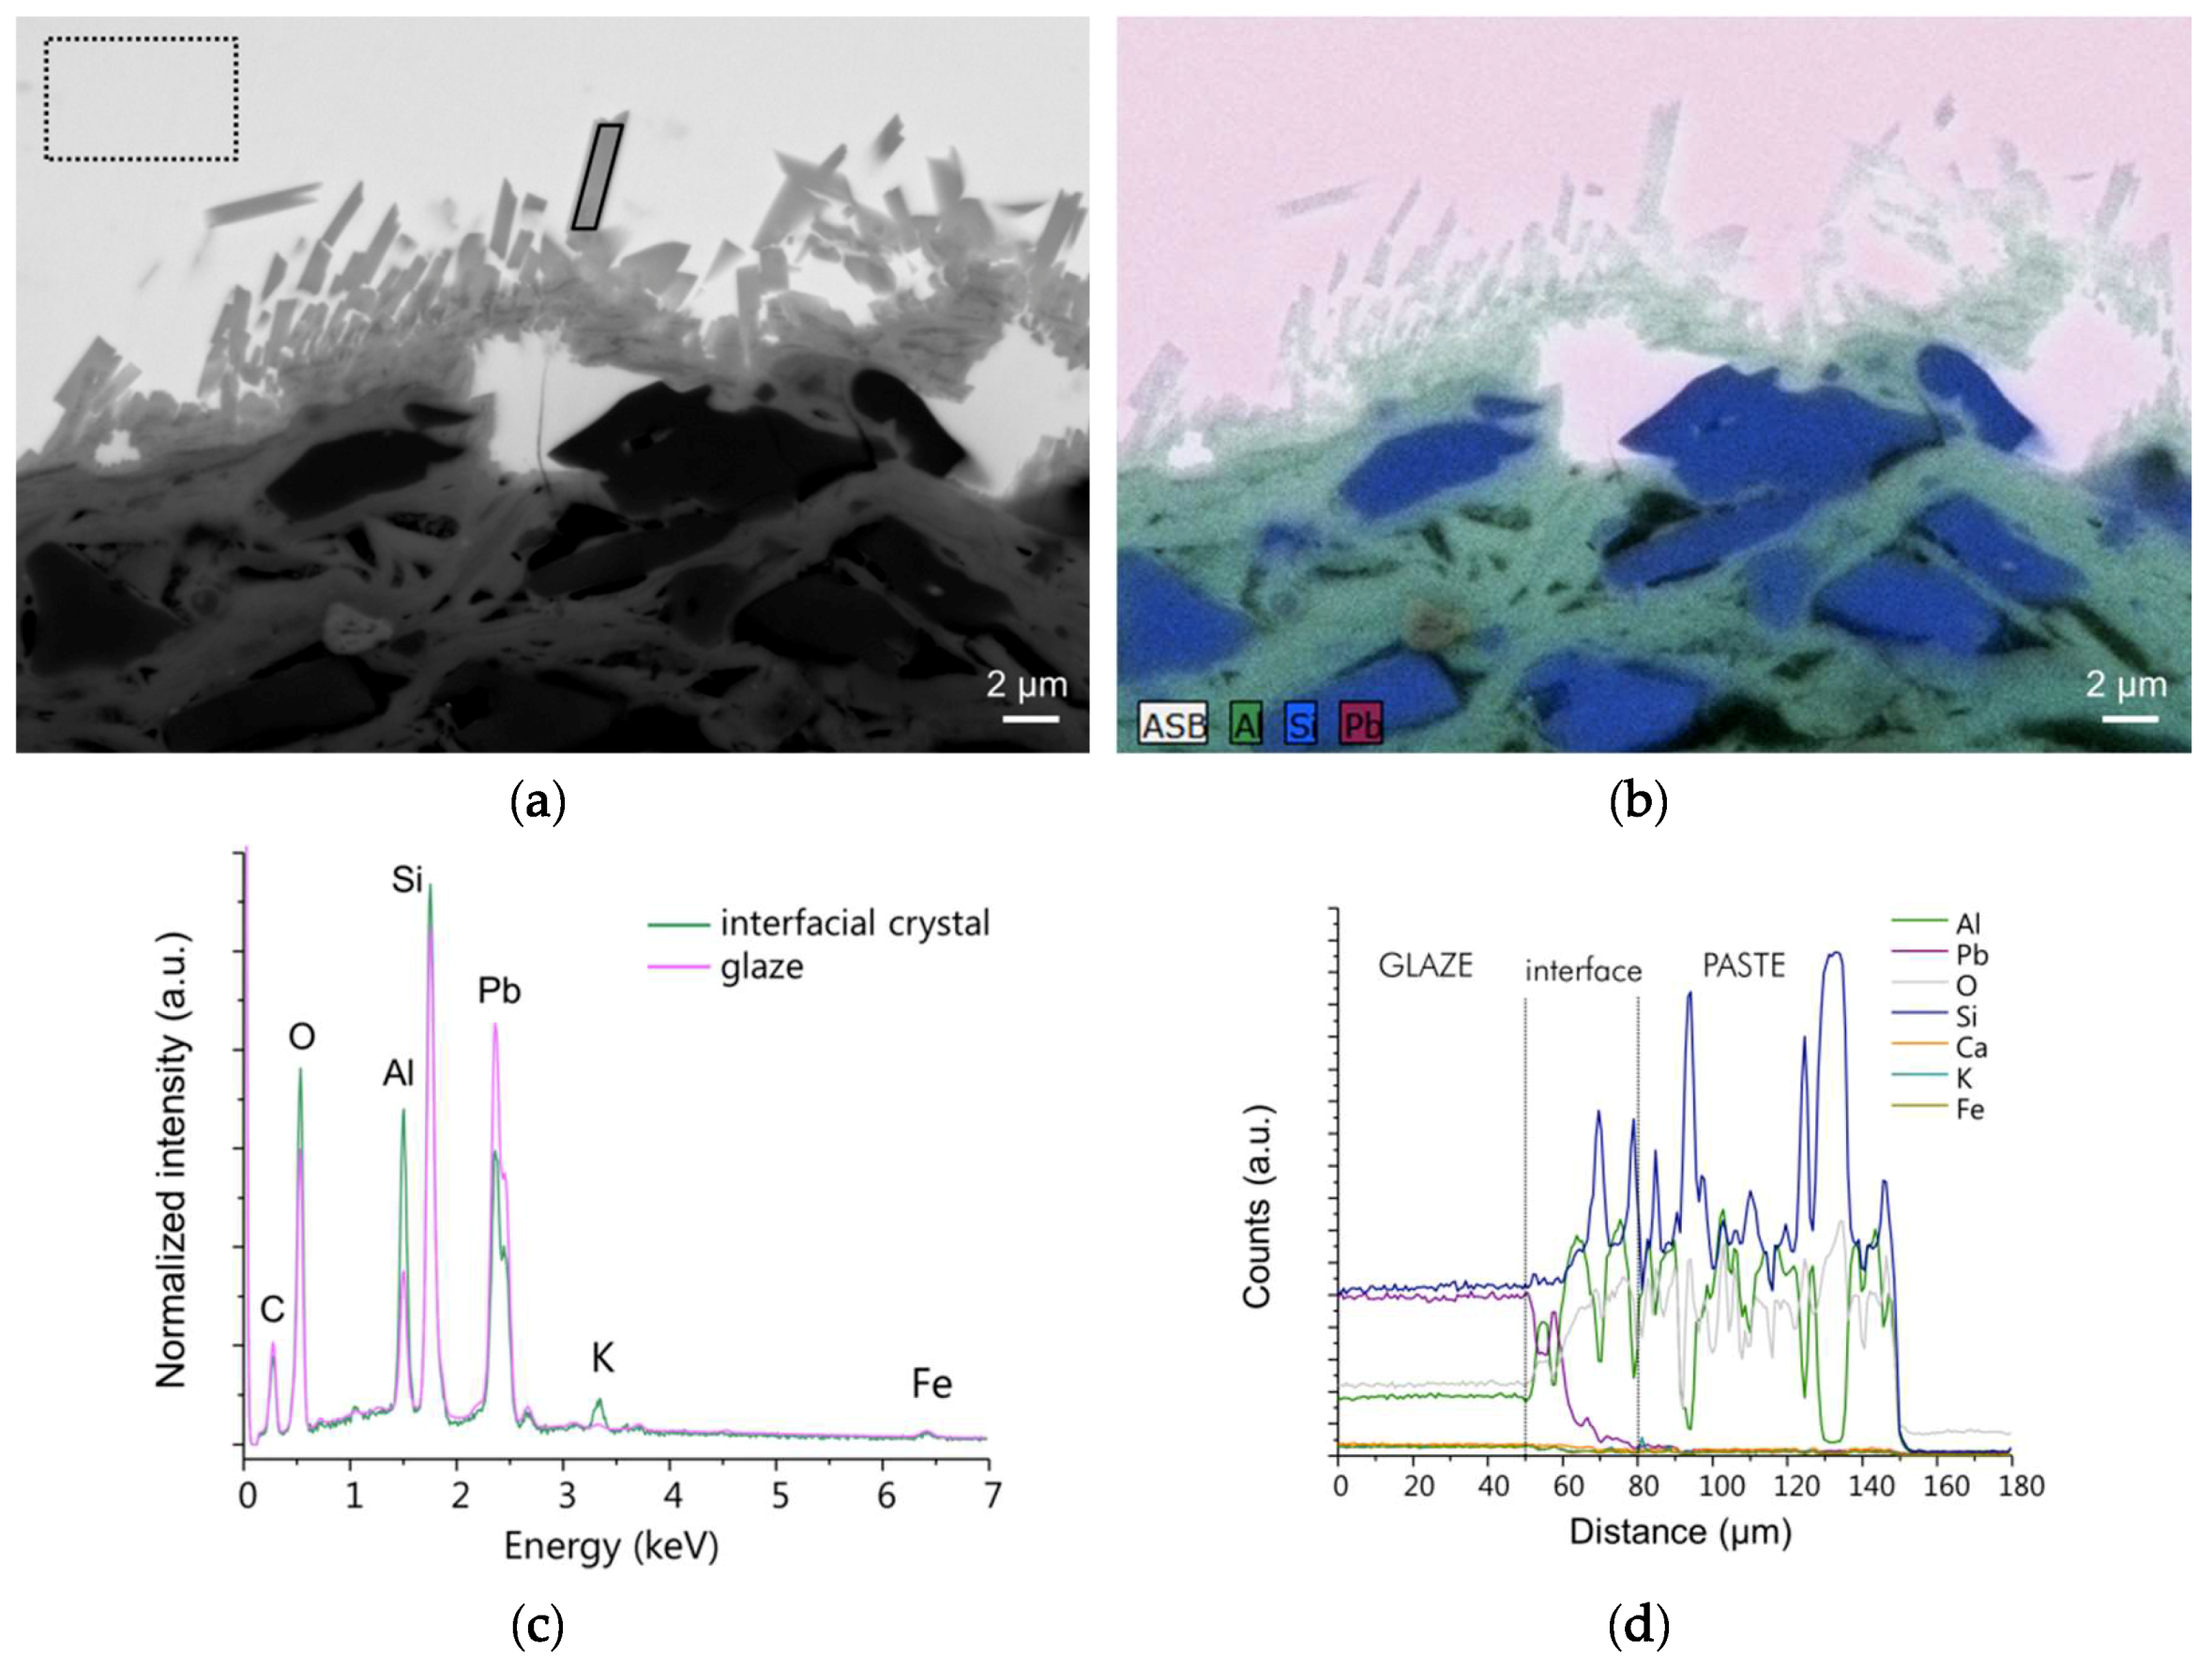
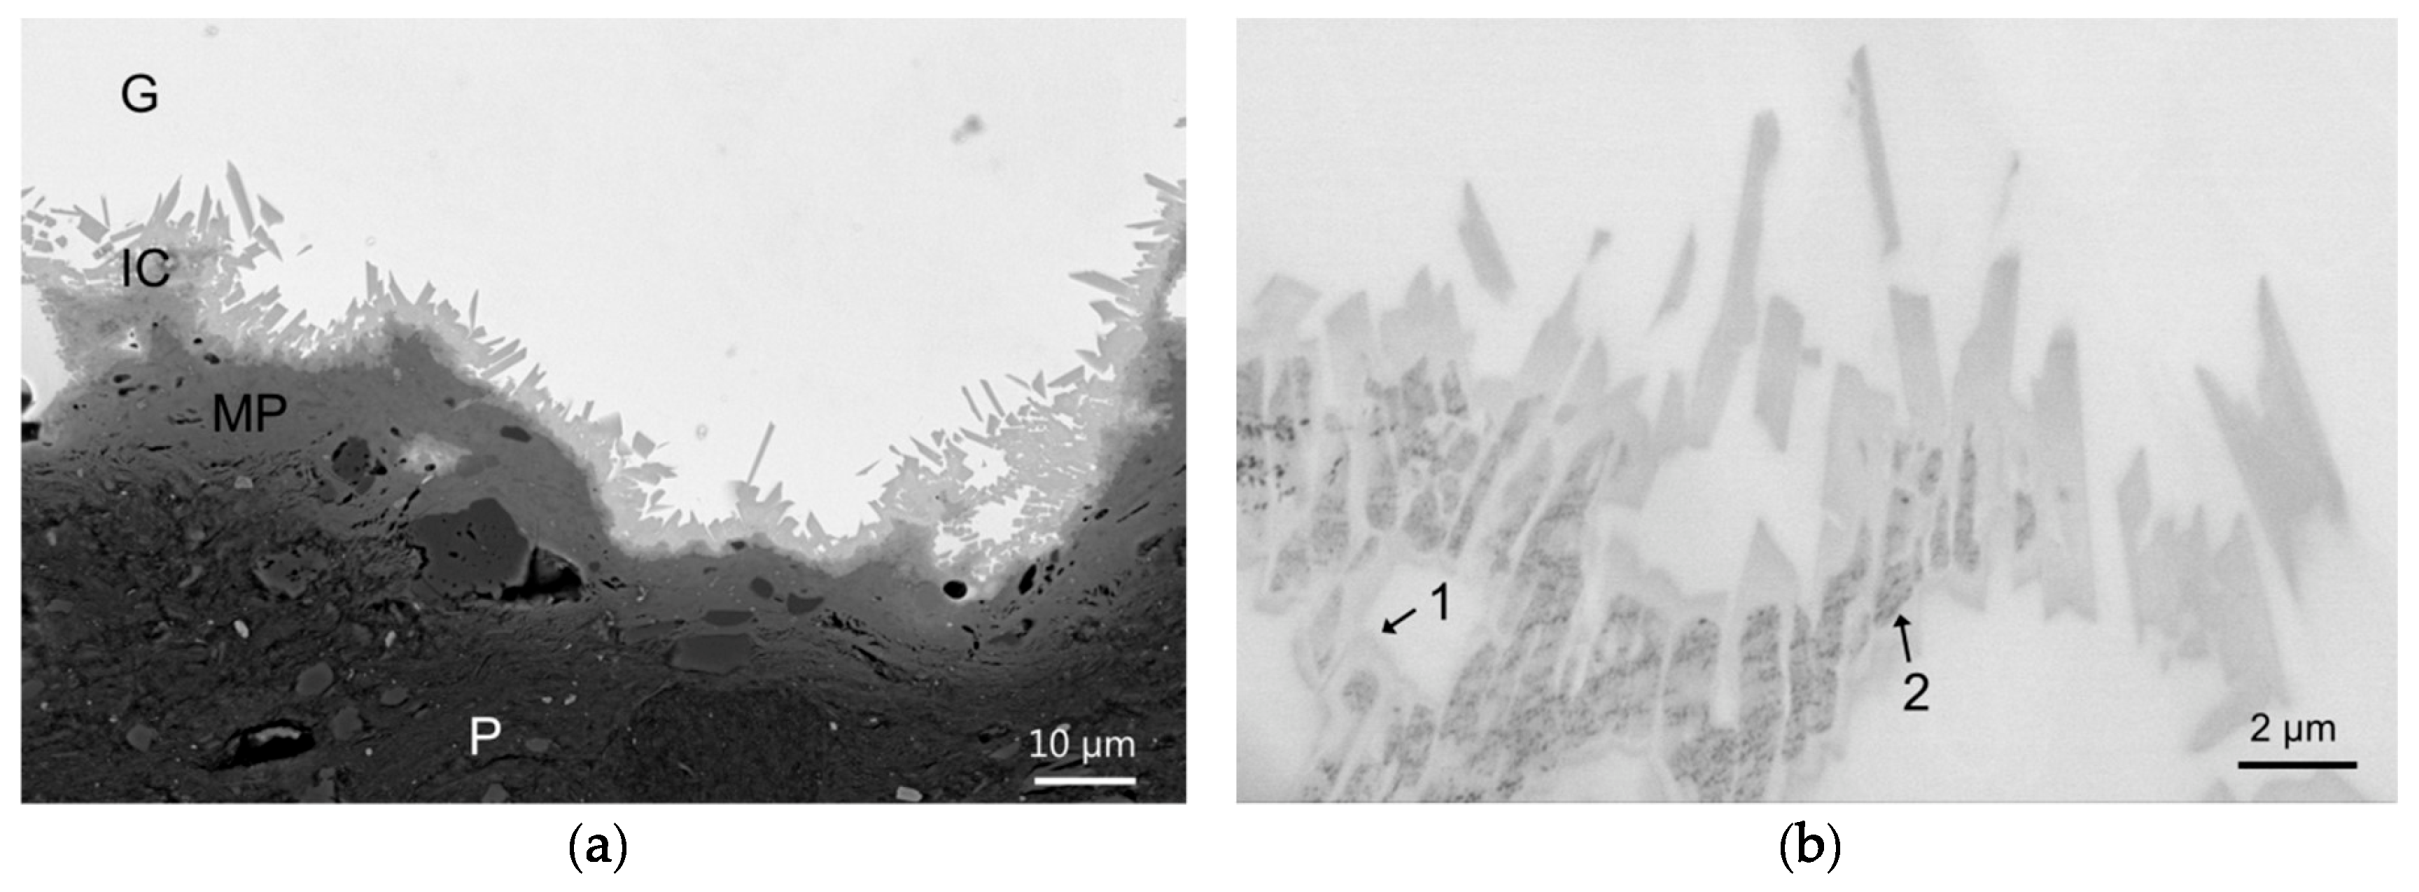
8]. Due to the presence of concentration gradients at the interface, the diffusion process occurs between the thin liquid layer of melted glaze (~100 µm) and the paste. In the case of transparent high lead glazes for instance, lead (Pb) will diffuse from the glaze to the paste whereas aluminum (Al), silicon (Si), iron (Fe), titanium (Ti), alkalis (Na, K), and alkaline elements (Mg, Ca) will diffuse from the paste to the glaze. The diffusion process is accompanied by a digestion mechanism: the hot liquid melt induces a decomposition of the paste components. This digestion-diffusion process leads afterwards to the development of new devitrification crystallizations creating the so-called interface area [9].
It is important to note that the interface definition may vary depending on the authors. For instance, Coentro et al. (2017) define the interface as the “layer with mineral inclusions that result from the reaction between the glaze and the ceramic body” [10]. Furthermore, Molera et al. (2001) distinguish between the body part digested by the melt and the interface layer which is formed by small crystallites of K-Pb feldspars [
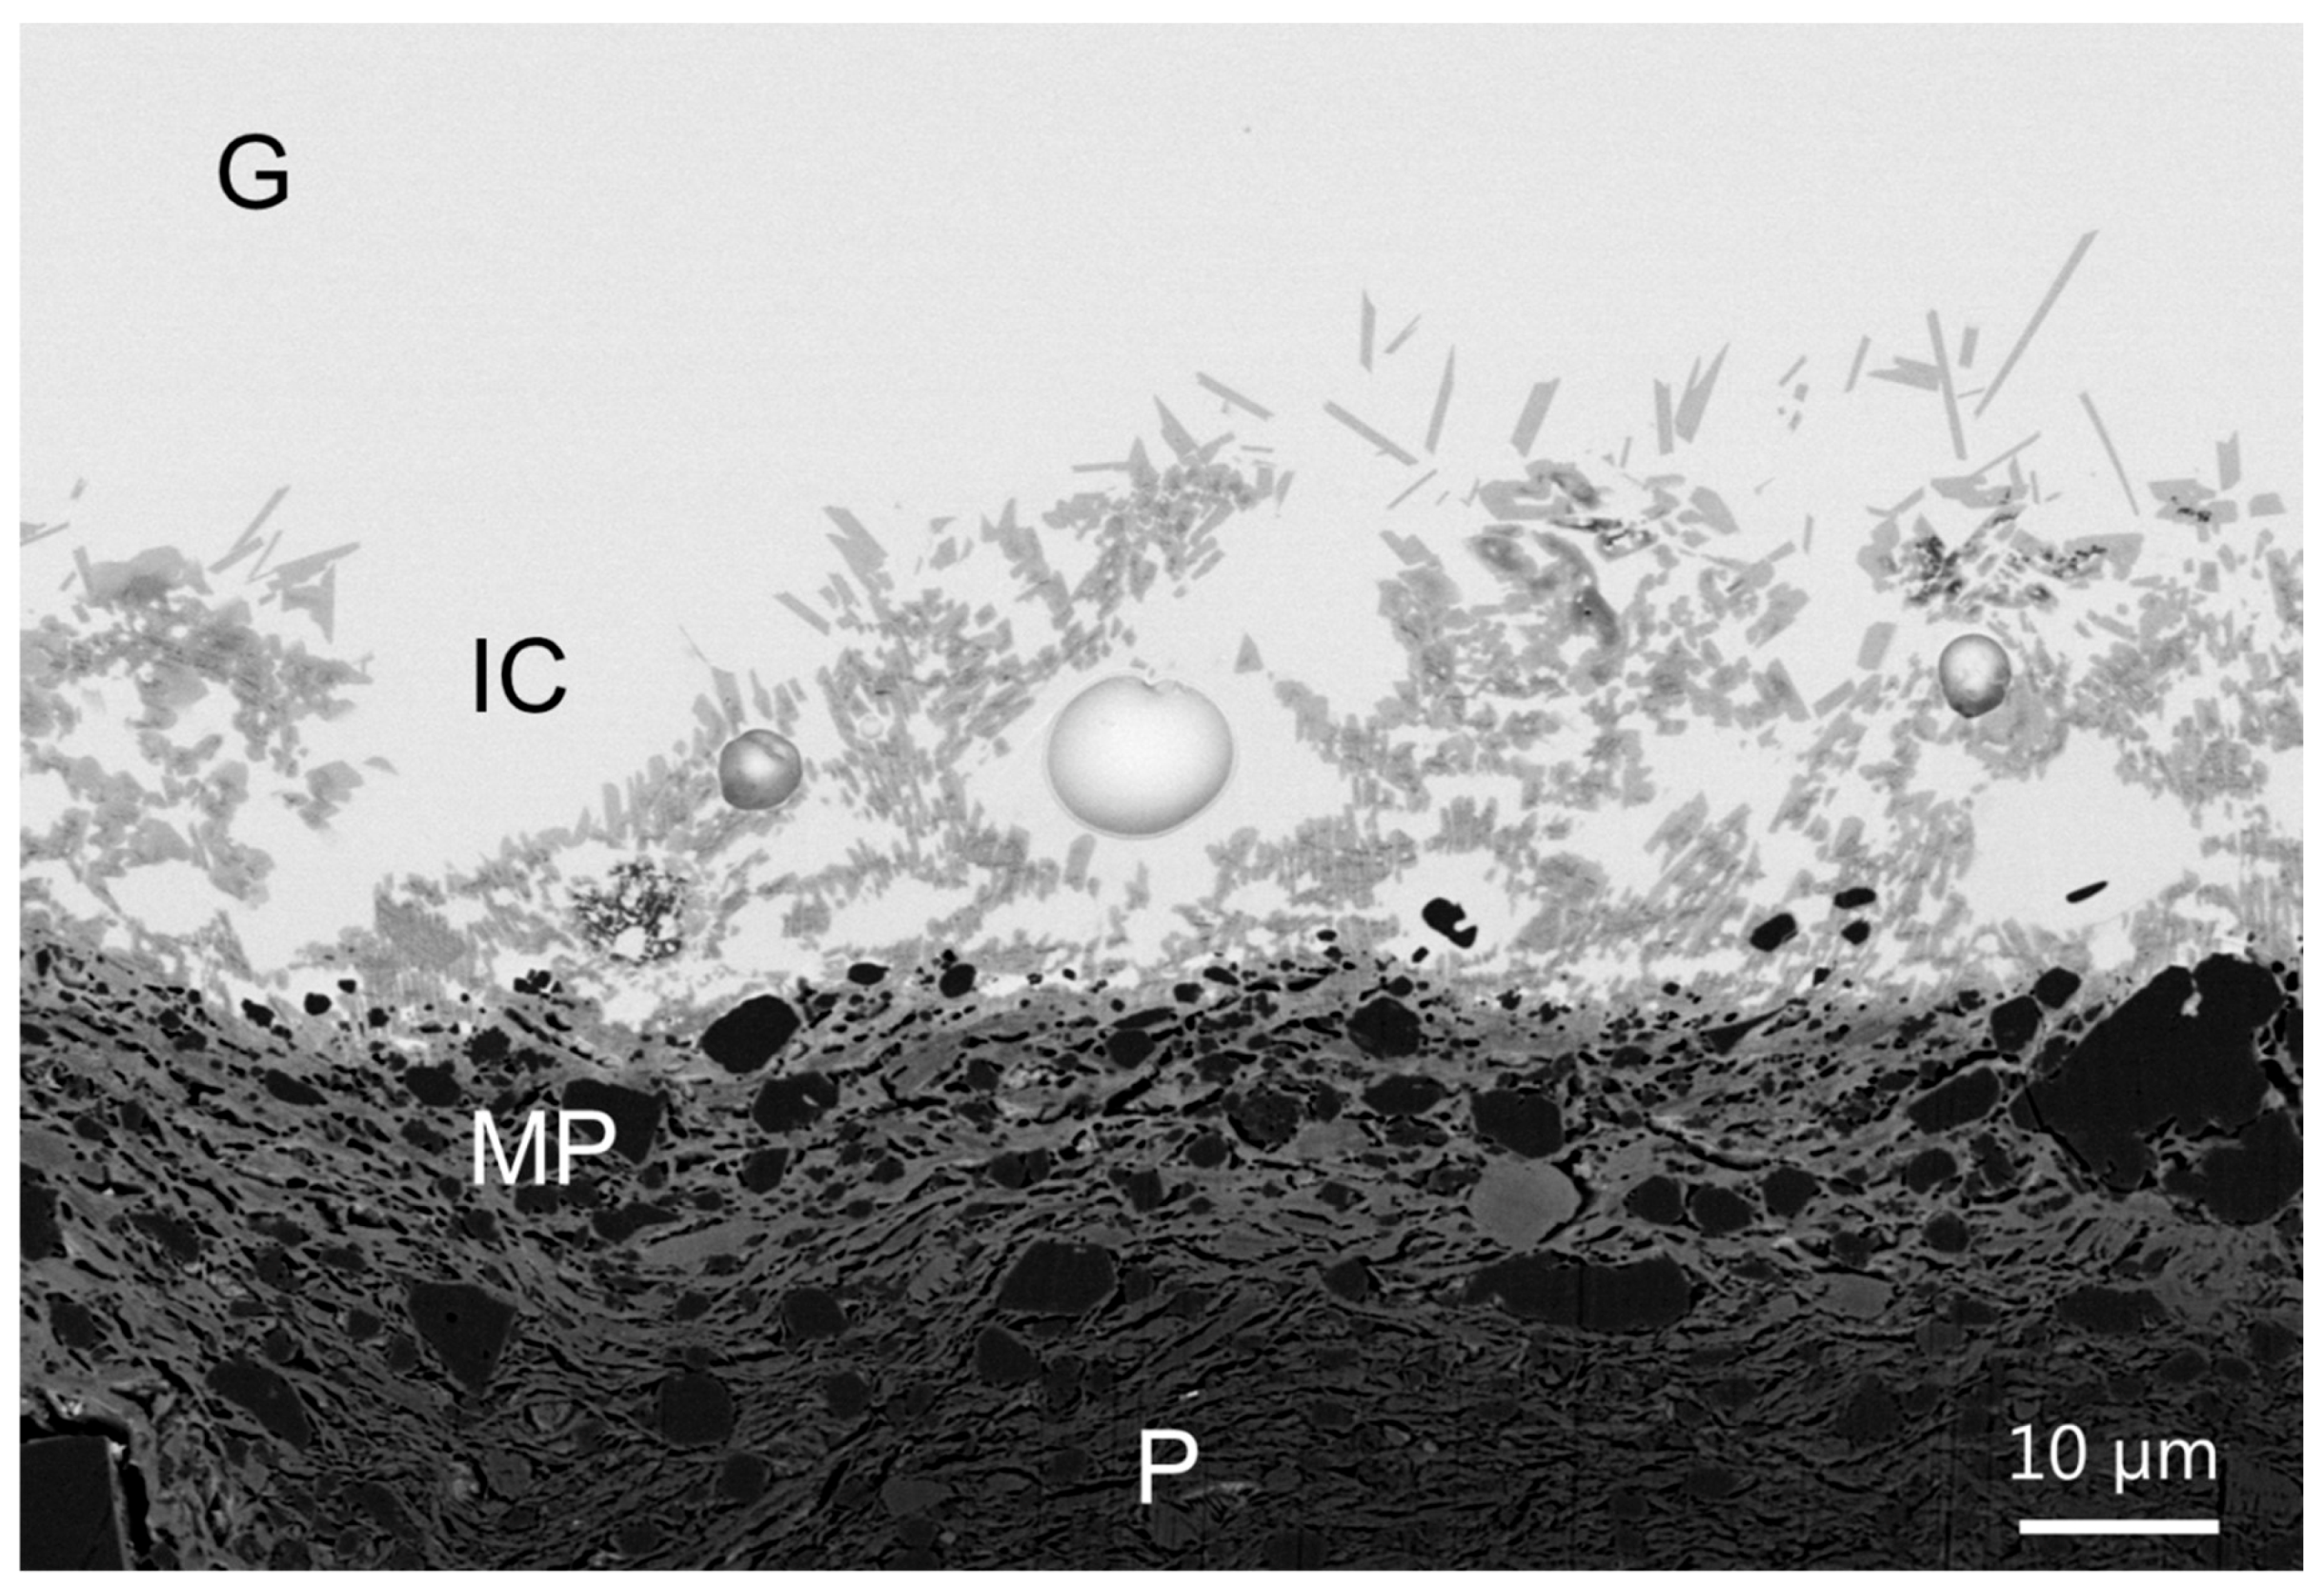
9]. Consequently, one should always consider the interface definition before comparing the interface extension obtained in different studies. In the present study, the interface extension will be defined as the sum of both the modified paste (part of the paste that has reacted with the melt) and the interfacial crystals regions extensions.
Numerous studies conducted on glazed ceramic replicas have demonstrated that the interface extension and microstructure depend on the following parameters: glaze and paste chemical composition, firing temperature, firing time, cooling rate, use of single- or double-firing method [9,11,12]. Thus, investigating the interface allows gathering information on all these parameters which help to understand Palissy’s elaboration process.
In the case of transparent high lead glazes, it was found that an increase in firing temperature, duration, and a decrease in cooling rate induces a larger interface. Besides, the same glaze applied to different types of paste (illitic, kaolinitic, calcareous) leads to different interfaces thicknesses. Concerning the glaze chemistry, one major question is to determine to what extent the aluminum (Al) commonly detected in the glazes is due to the deliberate addition of clay by the ceramist and to what extent it is due to diffusion process from the body during the firing [8]. Experiments recently conducted using two Palissy-style honey glazes replicas (one with 6%wt alumina and one without) applied on the same white body (kaolinitic) revealed that the final glazes were both containing 6%wt alumina after the thermal process [6]. This result reveals how important the Al diffusion process is during the firing and that there seems to be a saturation limit. Examining the interface of these samples which have not yet been analyzed would be very useful to know if Palissy was intentionally adding Al or not in his glazing mixture. Lastly, several authors have tried to relate the interface expansion with the firing method (single or double) but no evident relationships have been found since two decades [8,13,14]. Luckily we know that Palissy was very probably using the double firing method [2,4].
In addition to the interface expansion, the chemistry and the morphology of the interfacial crystals are also highly related to the above-mentioned parameters. In the case of a lead glaze applied on a calcareous paste, wollastonite microcrystals CaSiO3 were often detected using scanning electron microscopy coupled to an X-ray energy dispersive spectrometer (SEM-EDX) [15]. Besides, various other crystals such as andradite Ca3Fe2Si3O12, magnesioferrite MgFe2O4, diopside CaMgSi2O6, etc. were also identified using Raman spectroscopy and synchrotron micro X-ray diffraction (syn-µ-XRD) [10,16]. In the case of low calcareous pastes (such as those used by Palissy [17]), a solid solution of K-Pb feldspars (Kx, Pby, Caz)AlαSiβOδ microcrystals was mostly evidenced using SEM-EDX [18,19,20] and in one study using Raman spectroscopy [10]. In particular, a corpus composed of Palissy glazed ceramics samples (honey iron-colored glaze on white kaolinitic body) was characterized by SEM and K-Pb feldspars crystals were described in all the examined interfaces [6].
Here one could realize that most of the interfacial compounds have been identified using SEM-EDX point analysis on micro-sized crystals. Although relatively simple to implement, this technique has several drawbacks: the EDX probed volume (~1 µm3) is often too large for submicro- and nano-sized crystals which have been evidenced in the interface area [16] and which thus have not been characterized, EDX quantitative analysis can only be achieved on homogeneous sample (yet the microcrystals are sometimes heterogeneous at the microscale), and finally this method does not provide a direct structural analysis. As shown above, some studies have thus turned to structural techniques such as Raman spectroscopy or syn-µ-XRD [21,22]. Both are very powerful techniques as they can detect sub micrometric species even if the beam is much larger (few microns for Raman and few tens of microns for syn-µ-XRD). However, the spatial resolution information is lost, and these techniques are still not perfectly adapted for nanoscale studies.
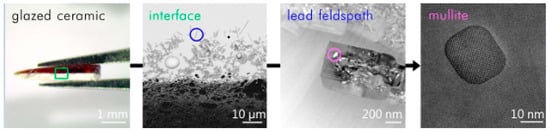
Hence in the present study, a multi-scale analysis has been developed including transmission electron microscopy (TEM) and associated techniques (electron diffraction, chemical analysis). This analytical strategy is used to characterize the morphology, chemistry, and microstructure of Palissy glazed ceramics interfaces areas (focusing on honey glaze on white body system) down to the nanoscale. In parallel, the influence of some elaboration parameters on the interface (firing time, cooling rate and addition of Al in the glazing mixture) is assessed through the preparation of Palissy-style replicas samples. Finally, archaeological and replicas samples are compared to shed some light on how Palissy was proceeding to achieve such masterpieces.

2. Materials and Methods

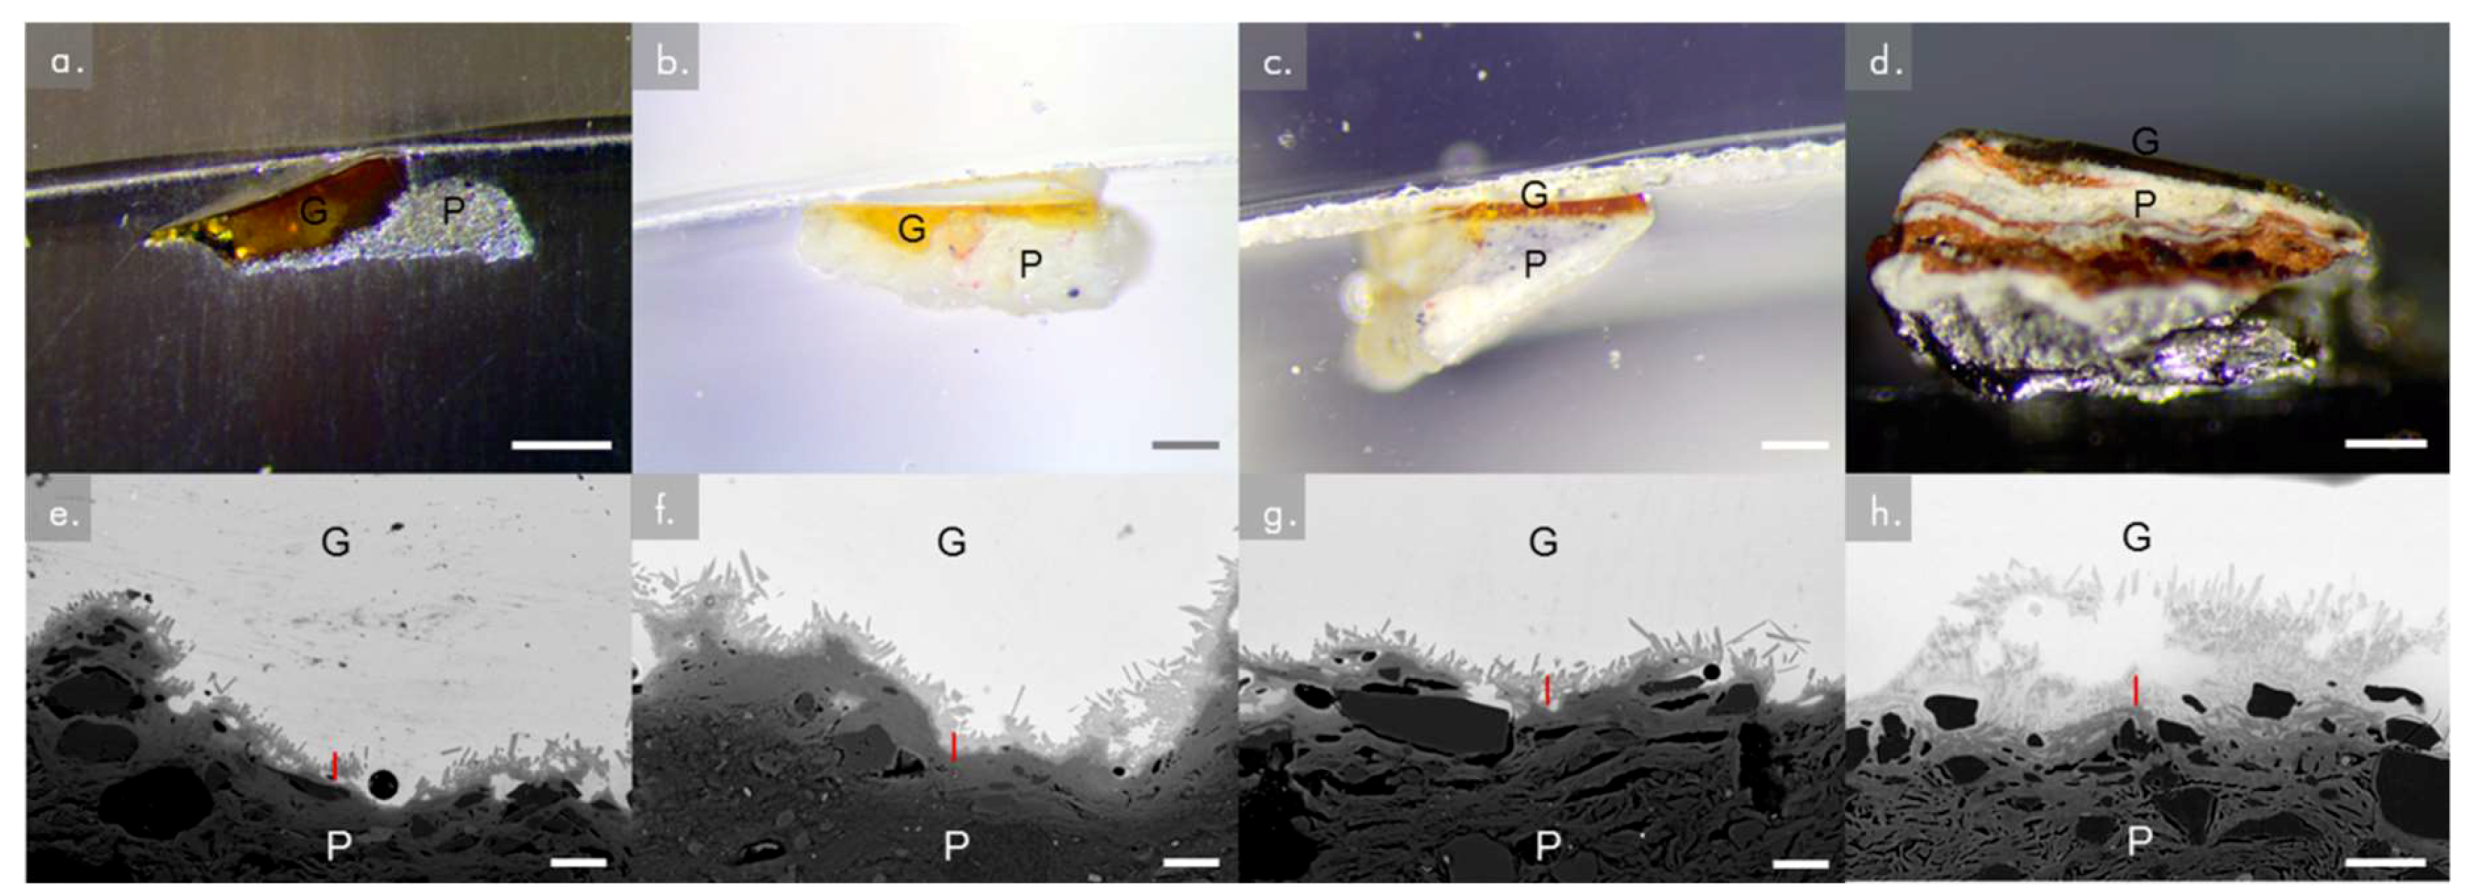
Four archaeological glazed ceramic shards (honey glaze on white body) coming from Palissy workshop in Paris (Tuileries) were selected. Three-millimeter sized fragments of these shards (EP422, EP470, and EP600) were embedded in cross-sections using acrylic resin before being mechanically polished. The last one (EP2319) was directly polished using a Leica TXC ion polisher (8 kV, 3 mA, 4 h) in order to investigate the capabilities of this facility to prepare glazed ceramic specimen compared to traditional preparation method (embedding and mechanical polishing).
The samples were first observed using optical microscopy to examine the morphology at the sub-milliscale. They were then carbon coated and analyzed using a scanning electron microscope (SEM) FEG Zeiss Ultra55 (7–15 kV) coupled to a Bruker Quantax Energy Dispersive X-ray (EDX) detector to investigate the morphology and the qualitative chemical composition of the glaze-paste interface at the microscale. Imaging was essentially performed in backscattered electron mode (BSE). Hypermaps were acquired from which elementary maps, spectra, and profiles can be extracted afterwards.
As the samples show nano-sized heterogeneities, a Focused Ion Beam (FIB) section (about 15 µm × 5 µm × 100 nm) was prepared in the interface area of one sample (EP2319) with a FEI Strata DB235 (IEMN) before being analyzed using a transmission electron microscope (TEM) JEOL2100F at 300 kV equipped with a scanning transmission electron microscope (STEM) device and a Si(Li) EDX detector. TEM coupled to selected area electron diffraction (SAED) and high-resolution TEM (HRTEM) imaging were performed to characterize the morphology, the crystallinity, and the structure of the interfacial compounds. STEM coupled to high angle annular dark field (HAADF) imaging (providing Z contrast images) and EDX analysis were used to examine the morphology and correlate it to the chemical composition of the interface compounds at the nanoscale. Images, SAED, and HRTEM data were treated using Image J whereas EDX hypermaps were treated using Analysis Station and Origin64 software.
In parallel, glazed ceramic replicas were elaborated taking into account the chemical compositions previously measured on a corpus of archeological honey glazed samples [6,7]. A kaolinitic clay originating from Provins in France (RP299) with a mineralogy very similar to those of Palissy white pastes was used to prepare these replicas (Table 1).
Following the procedure detailed in [6], 4 kg of clay was mixed with 0.4 kg of Fontainebleau sand (used as filler) and 6 L of water using a planetary mill for 30 min. The liquid mixture was then dried in a plaster shell before being worked and shaped into clay tiles (3 × 3 × 0.5 cm3). The tiles were dried two weeks in the air after which they were fired at 1000 °C during 10 min (heating rate 50 °C·h−1 until 400 °C, 100 °C·h−1 until 1000 °C, cooling rate 50 °C·h−1 until room temperature). A double firing procedure was chosen as Palissy was probably using this method. The paste is first fired alone (obtention of a biscuit); then glazing mixture is applied on the dried biscuit and the whole is fired a second time to produce the glazed ceramic.
Concerning the type of glazing mixture, previous examination of honey glazes replicas elaborated with either oxides powders or glass frit suggests that Palissy was most likely working with a glass frit [6]. Indeed, glaze elaborated using oxides powders is very heterogeneous after firing: un-melted particles from the raw materials and cristobalite crystals are observed, contrary to glaze elaborated using a frit which has a more homogeneous appearance, similar to that of Palissy honey glazes. Furthermore, frit residues and crucibles were found in Palissy Parisian workshop during the 1980s excavations. Consequently, in the present study, a glass frit was elaborated by mixing γ-Al2O3 (99.99%, fine, Baikowski), SiO2 (99.5%, <50 µm, Alfa Aesar), α-Fe2O3 (99%, <40 µm, Prolabo), and PbO (99.9%, <10 µm, Sigma Aldrich) in the proportions indicated in Table 2 which correspond to the average of the chemical compositions measured on the archaeological honey glazes composing the corpus above mentioned [6].
To study the effect of adding (or not) aluminum in the glazing mixture on the interface extension and microstructure, a second type of frit was elaborated by removing aluminum from the initial mix.
The powder mixtures were first fired in Pt or Pt/Au crucibles at 1050 °C for 30 min (heating rate 7 °C·h−1). Unfortunately, both melts were too viscous at that time and cannot be casted. The glass was thus re-fired for 10 min at 1200 °C. A first quench was then performed on a metallic plate at room temperature. To increase homogeneity, the glass was then roughly crushed before being replaced in the crucibles in the oven for 30 min at 1200 °C. A thin ( <40 µm) glass powder easily dispersible in water was prepared. To make the glazed ceramic replicas, 2.5 g of frit were mixed with 2.0 g of water and applied on the dried biscuits. For comparison, one sample was prepared using the frit without aluminum.
The samples were then fired at 1000 °C (heating rate 100 °C·h−1) under different conditions. 1000 °C was chosen as an in-depth mineralogical study conducted by Wallez and Coquinot (detailed in [6] (p. 35–37)) on Palissy pastes has demonstrated that his white pastes were fired between 950 and 1040 °C.
-
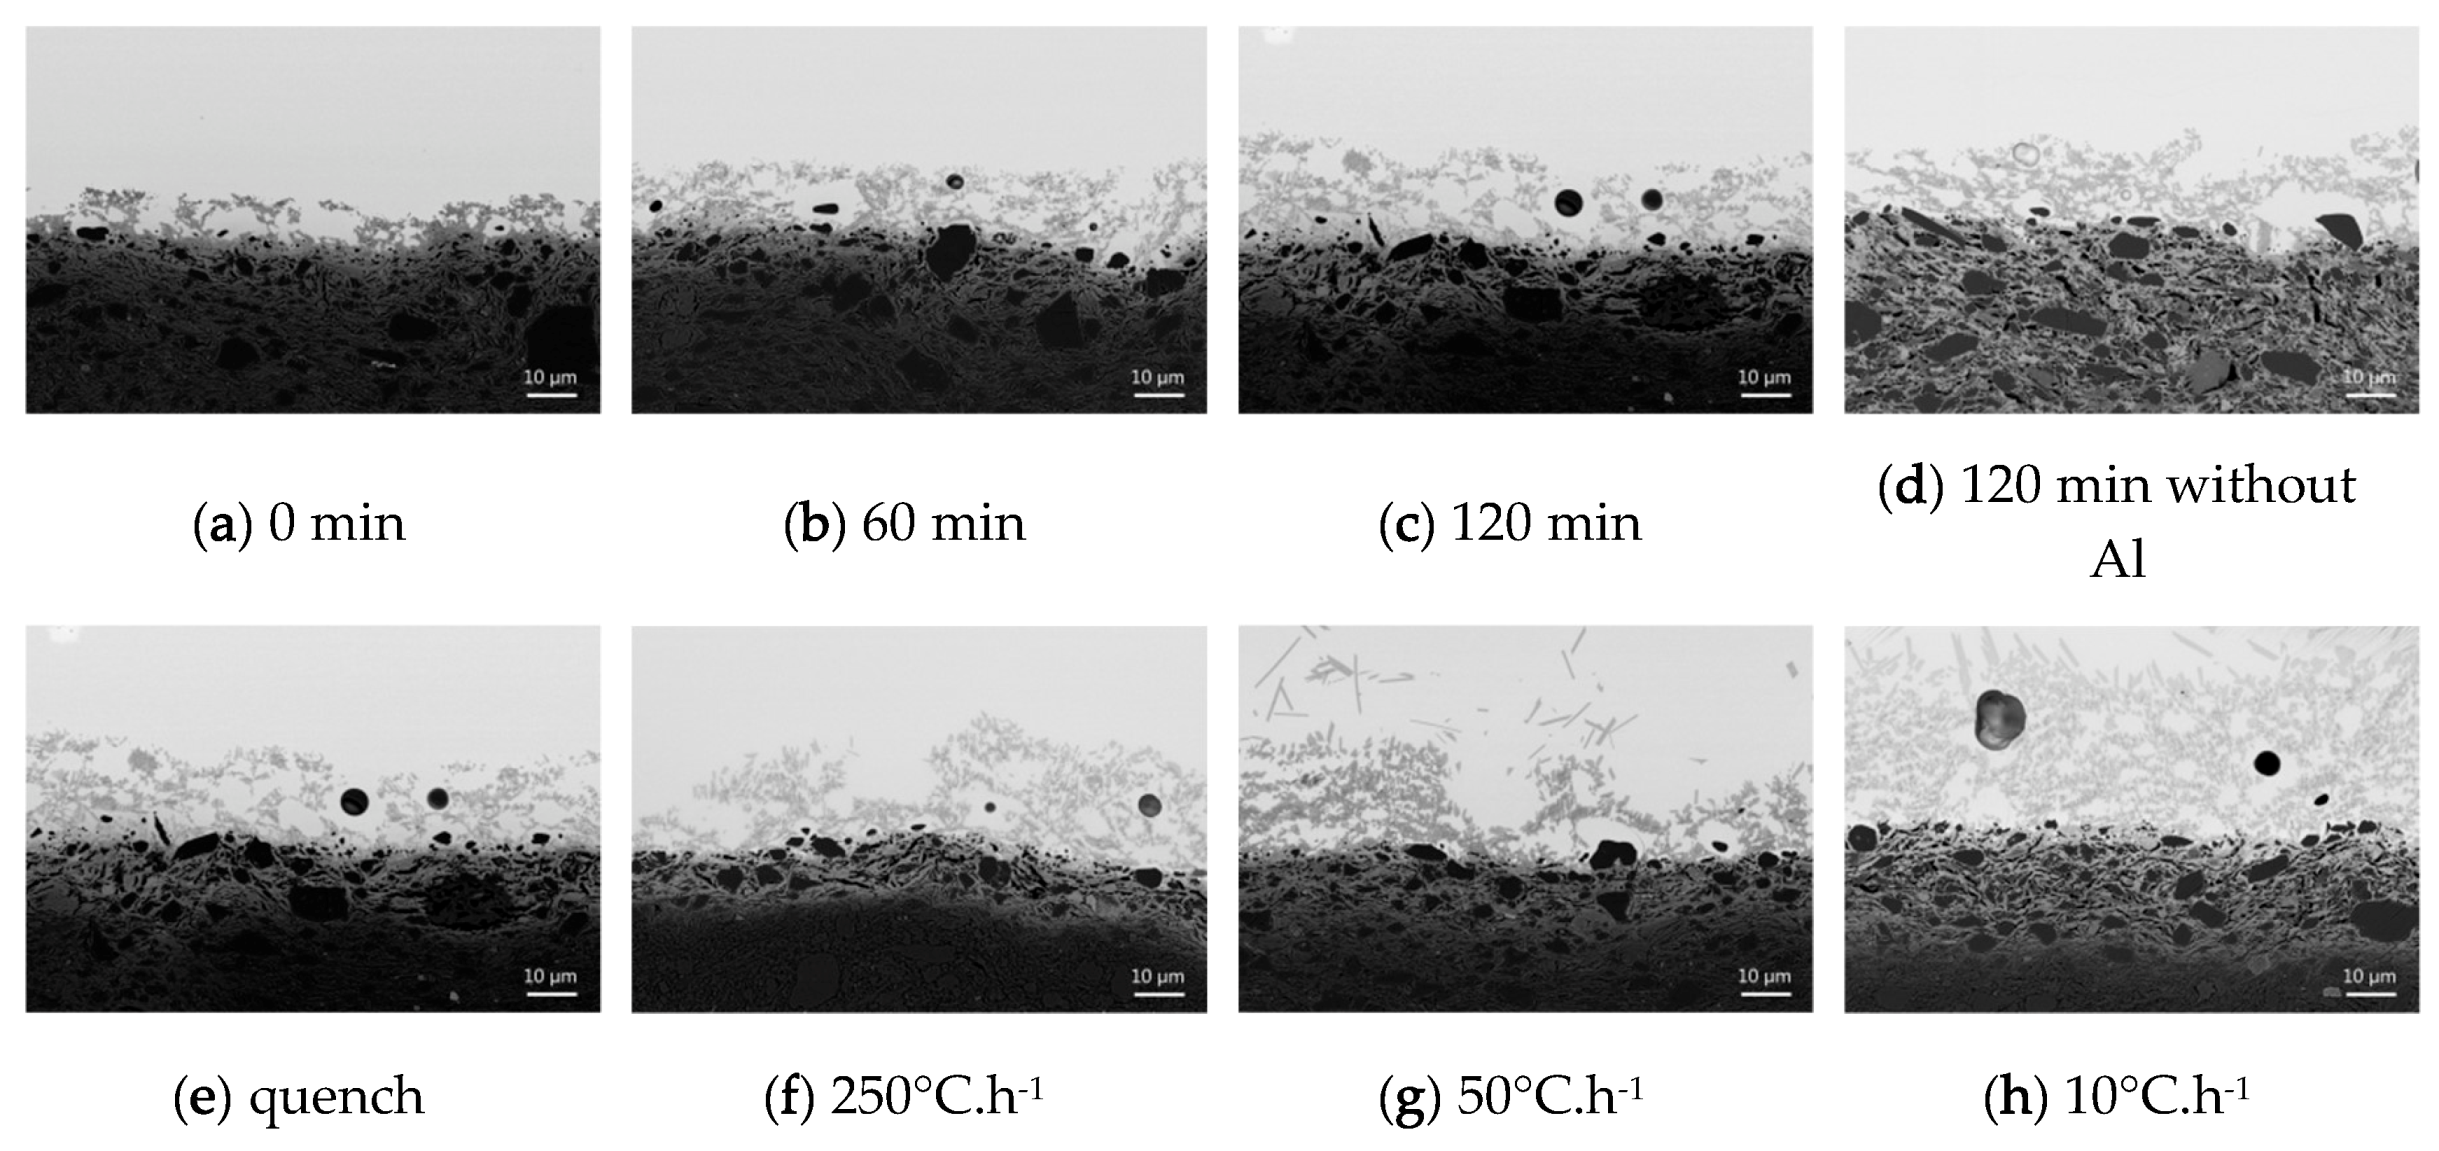
Five samples were quenched at different times (0, 10, 30, 60, 120 min) after reaching 1000 °C to examine the influence of the firing duration on the interface area.
-
Three samples fired during 120 min were cooled using different rates to look at the influence of cooling rate on the interface area (10, 50, 250 °C·h−1 and quench). 50° C·h−1 corresponds approximatively to a slow cooling in the oven.
-
The sample prepared using the frit without Al2O3 was fired during 120 min and slowly cooled in the oven (50 °C·h−1).
The quenching was performed in a metallic plate covered with a thin layer of water (lower than the thickness of the ceramic samples) at the bottom so that the ceramic substrates were cooled down rapidly.
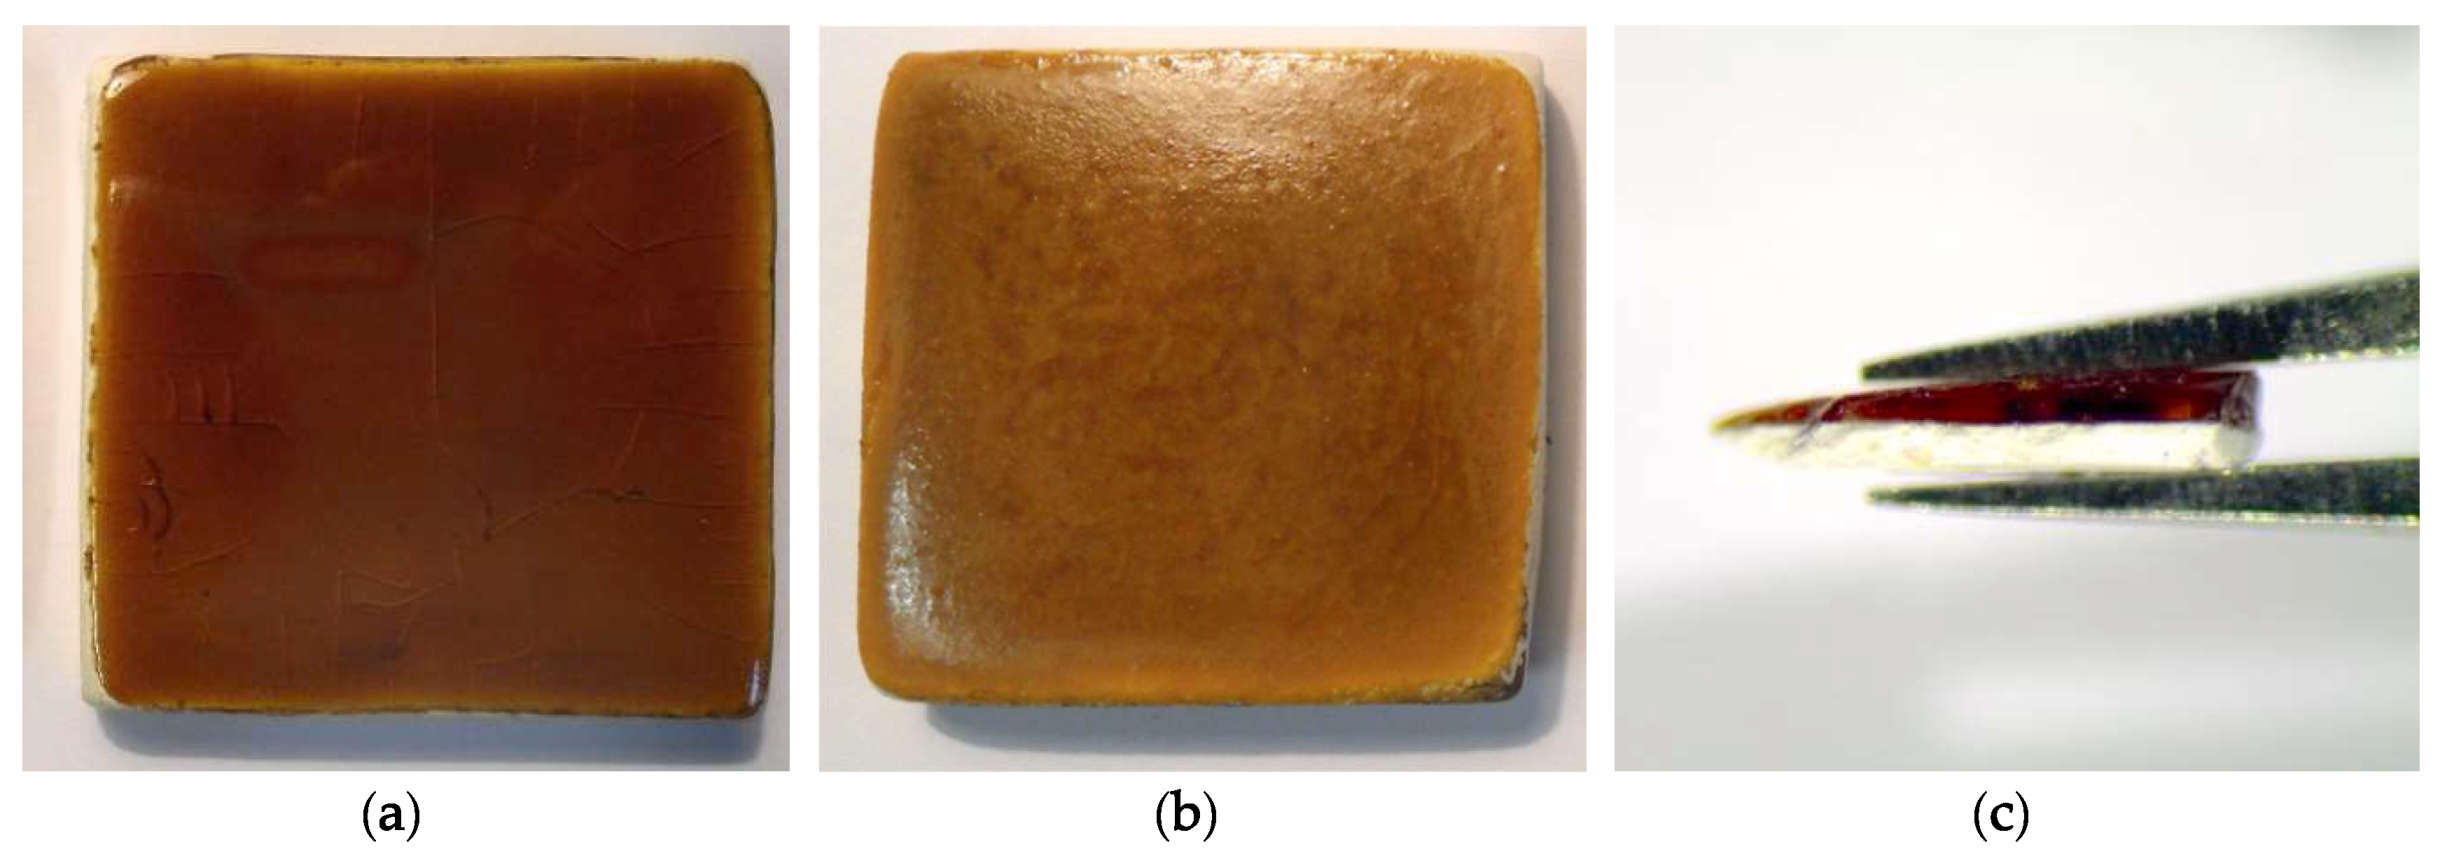
After the firing process, 3 × 3 × 0.5 cm3 glazed ceramic tiles (with a honey transparent glaze covering a white body) were obtained. A millimeter-sized fragment of glazed ceramic was collected from each tile. The fragments were then ion polished using the above-mentioned facility and parameters. They were then analyzed following exactly the same procedure as the one used for archaeological samples.

3. Results

3.1. Archaelogical Interfaces

Micro-Scale Characterization

Under the optical microscope, the honey glazes appear relatively homogeneous with a thickness of about 100 µm (Figure 1a–d). The paste is white for the three embedded samples (EP422, EP470, EP600) and is a mixture of white and red pastes for the last sample (EP2319). For the latter, the honey glaze is however essentially covering a white paste area in the fragment we collected.
Between the glaze and the paste, SEM-BSE imaging shows with a clear contrast that an interface area has formed, with a chemistry different from both paste and glaze. Ion polished sample appearance (Figure 1h) is better than mechanical polished samples ones (Figure 1e–g) with hardly any visible polishing marks (scratches). Besides, it allows distinguishing more details at the sub-micro and nanoscales. The interface areas present a comparable microstructure for all the different archaeological fragments investigated (Figure 1e–h). They are showing a great heterogeneity at the microscale and can be divided into two parts: a modified paste region and an interfacial crystals region (Figure 2).
The modified paste region corresponds to the part of the body that has reacted with the glaze during the firing, hence showing a microstructure different from the unaffected paste. It appears lighter and SEM-EDX mapping shows that it is due to lead impregnation into the paste. It also seems less porous and more compact. Dark grains (corresponding mostly to quartz or aluminosilicates particles) are less numerous, often smaller (less than a few microns) and more altered than those present in the unaffected paste (Figure 2a). This can be explained by the fact that during the firing lead is acting as a flux and induces an amorphization of the body, leading to a more homogeneous aspect with fewer porosities and inclusions. Moreover, the modified paste matrix is showing a lot of submicro- and nano-metric contrasts (visible in BSE mode), indicating that submicro- and nano-sized compounds with different chemistries are present in it (not analyzable using EDX which is probing a micro-sized volume). In particular, aggregate of dark lines with an individual thickness smaller than 1 µm, are often observed more or less easily depending on the samples.
The interfacial crystals region is forming a relatively continuous area above the modified paste region. Micro-sized compounds of various forms (generally forming irregular aggregates when close to the paste and having more sharp-edged forms when away in the glaze) and sizes (few microns) seem to be growing from the surface of the modified paste. They are sometimes spreading into the glaze, forming a curved farandole of crystals disconnected from the surface. Typical EDX hypermap (here of EP422 sample) from which spectra can be extracted reveals that these crystals contain O, Al, Si, Pb, K in various proportions (Figure 3a–c). Different BSE imaging contrasts are also distinguished inside the interfacial compounds, indicating again that micro- and nano-compounds with different chemistries are present in it. Dark lines (compared to the crystals) are frequently observed. In the case of EP2319, the interfacial crystals present an even more complex microstructure as some compounds (containing dark lines inside) are surrounded by a micro-sized lighter border which is itself surrounded by a nano-sized darker one, the whole conveying to these crystals an illusion of relief in the glaze (Figure 2b).
Typical EDX profiles extracted from hypermaps are presented in Figure 3d and give information about the element’s diffusion through the interface. In the glaze, Pb, Al, and Si profiles are flat. Then the profiles are marked by an abrupt minimum (Pb) or maximum (Al) corresponding to the interfacial crystals’ region. The Si profile is still flat in this area, meaning that the Si content is approximatively the same in the glaze and in the crystals. In the modified paste region, the Pb profile is decreasing continuously until reaching zero in the unaffected paste. Al and Si profiles globally increase and are marked by high amplitude oscillations, corresponding to quartz, aluminosilicates particles, and clay matrix heterogeneities.
Concerning the interface extension, it can be measured either by using the Pb decreasing through the interface (more accurate) or by looking at the BSE imaging contrasts (more approximate). However, as the interface is not a continuous layer, it is more relevant to measure its extension using a range of thicknesses. Here the analyzed archaeological interfaces have a thickness of about 10 to 30 µm.
Archaeological interfaces have a complex microstructure composed of a modified paste region (body impregnated by the lead melt) and an interfacial crystals region (with microcrystals growing from the modified paste area to the glaze). Examination using SEM has highlighted the presence of micro and nano-sized heterogeneities which we are now going to identify using TEM.

Nano-Scale Characterization

The interface of EP2319 sample is very heterogeneous at the nanoscale and two main types of compounds are observed using STEM-HAADF imaging (Figure 4):
-
Big crystals measuring a few microns with irregular rounded to sharp-edged forms. The crystals observed in the glaze almost always have borders (with a thickness of a few hundred nanometers) (Figure 4a–b) whereas the one located near the modified paste region have no lighter borders (Figure 4c). These compounds correspond to the interfacial crystals observed by SEM (Figure 2b).
-
Small crystals measuring a few tens of nanometers, rod- or rectangular-shaped, either localized inside the big compounds (Figure 4a–b) or in the modified paste area (Figure 4c). These small crystals are forming the dark lines or the nano-sized contrasts visible inside the microcrystals that were highlighted by SEM (Figure 2b). It is interesting to notice that the small crystals present inside the microcrystals with borders are constrained inside the core of the compounds and no one is observed either in the border or the surrounding glaze.
Both types of compounds were identified using STEM-EDX analysis coupled to crystallographic analysis (SAED or HRTEM).
EDX analysis shows that big crystals contain mostly O, Al, Si, Pb plus K and Ca (sometimes Ti) in low amounts (Figure 5). According to the Pb map, the border seems slightly enriched in Pb, however, the difference is not perceptible on the normalized spectra (Figure 5c). As small crystals are incorporated inside the big ones, it is quite difficult to avoid completely the latter contribution to the analysis. Furthermore, due to their size, several small crystals may be present in depth of the FIB cut. The EDX analysis will, therefore, average all their contributions. Nevertheless, EDX analysis indicates that the small crystals contain mostly O, Al, Si, and Pb and are richer in Al than the big ones. If we subtract the normalized EDX spectra of big and small crystals, we obtain a spectrum containing approximatively O, Al, and Si, indicating that these small compounds may be aluminosilicates.
SAED diffraction was performed on several big compounds and reveals that they all have a PbAl2Si2O8 structure (Figure 6a–c). This result thus demonstrates that the big crystals are (K,Ca)PbAl2Si2O8 lead feldspars single-crystals, which is consistent with previous studies conducted on lead glaze-white body interfaces [10,18]. An interesting result is that different diffraction patterns acquired both on the core and border of this big crystal are identical, meaning that the whole monocrystal has the same crystallographic orientation. This is coherent with the fact that no border is visible in TEM-BF mode.
Small compounds were too small to be analyzed using SAED method ( <100 nm). They were thus characterized using HRTEM imaging which is very appropriate for nano-crystals analysis. Using a Fourier filtering transformation, it was found that the small crystals are single-crystals and that they have a mullite structure 3Al2O3.2SiO2 (Figure 6d–f).
To conclude, TEM and associated techniques have demonstrated that the interfacial crystals are composed of micro-sized lead feldspars single-crystals surrounded sometimes by a border slightly enriched in lead and incorporating nano-sized mullite single-crystals. Besides, we now know that the dark lines observed in the modified paste area correspond in fact to lines of mullite nanocrystals.
How does that peculiar microstructure have formed? Mullite has been previously identified in Palissy white bodies [6]. We can thus suppose that during the firing process, the liquid melt digests the clay body except mullite crystals and that afterwards lead feldspars crystallize and grow around them. A comparable reaction has been previously described for Hispano-Moresque pottery: sanidine (Kx, Pby, Ca1-x-y)AlSi3O8 microcrystals were observed growing around a K-feldspar crystal originating from the paste [18].
Another explanation would be that during the feldspar’s growth, an excess of Si an Al coming from the paste digestion lead to the precipitation of mullite crystals inside the feldspars.
We will now focus on replicas interfaces to characterize their micro and nanostructures depending on the conditions used and compare them with archaeological ones to precise the elaboration parameters potentially used by Palissy.

3.2. Replicas Interfaces

Replicas tiles obtained after firing at 1000 °C during different times and different cooling rates all have a similar aspect: a red-brownish translucid and brilliant glaze is covering a white body (Figure 7a). For the replica elaborated without alumina, the glaze appears opaque and matte with a light honey tonality (Figure 7b). A typical millimeter sized fragment collected from the tiles and used for analyses is shown on Figure 7c.
As for archaeological samples, a modified paste area from which are growing interfacial crystals of various forms and sizes (few micrometers) are observed (Figure 8). Numerous dark grains (quartz or aluminosilicates particles) are present in this region, often small (sub-micrometric) and altered. Besides, dark lines (measuring a few microns long and less than one micron thick) are observed in the body lighter matrix. The interfacial crystals region is a relatively continuous layer of microcrystals showing irregular to sharp-edged forms (mostly when away from the surface). Again, submicro- and nano-sized heterogeneities are detected inside the crystals using BSE imaging, indicating that micro- and nano-compounds with different chemistries are present.
Variation of firing time, cooling rate, and removal of alumina from the glazing mixture results in modification of both the interface extension and the interfacial micro-compounds morphology (size and form).

Influence of the Firing Time

Increase the firing time from 0 to 120 min increases the interface extension from 10–25 to 35–45 µm (Figure 9a–c). Both the modified paste and the interfacial compounds regions enlarge. Besides, the microcrystals morphology is changed. Their forms become less irregular and more rectangular, with smoothed corners. After firing for 60 min, some microcrystals with a lighter border appear near the modified paste surface.

Influence of the Cooling Rate

Slowing the cooling rate from quenching to 10 °C·h−1 increases the interface extension from 35–45 to 60–75 µm (Figure 9e–h). Again, this expansion is due to both modified paste and interfacial crystals regions enlarging. This result indicates that cooling is a crucial stage in the interface formation: lead melt continues to impregnate the paste and interfacial crystals keep growing during this step. For replicas cooled at less than 250 °C·h−1, rectangular sharp-edged microcrystals are observed, added to the more irregular ones observed in the quenched replica. The biggest of these rectangular crystals can reach 10 µm long and are free from any submicro- and nano-heterogeneities (see Figure 8 high in the glaze for instance). Following his writings, Palissy was probably leaving his glazed ceramics to cool down slowly in the oven (~50 °C·h−1) [2]. This would be consistent with the observation of rectangular sharp-edged crystals measuring a few microns in the archaeological interfaces.

Influence of Alumina Removal from the Frit

Removing alumina from the glazing mixture affects drastically the modified paste expansion which increases to about 100 µm in depth. Its microstructure remains the same compared to the replica with Al (Figure 9c–d). In contrast, the extension of the interfacial crystals’ region seems not modified. This can be explained by the fact that addition of Al2O3 increases the glaze viscosity which will limit its diffusion in the paste. By removing it, the melt become less viscous and impregnates more deeply the paste [23].
Concerning the interfacial crystals, they are more rectangular and sharp-edged than the ones observed in the replica elaborated with Al. Crystallization of tridymite is also noticed up in the glaze (responsible of the sample matte appearance), but this result will not be detailed more here as it does not concern directly the interface area.
At the nanoscale, a morphology and a chemistry similar to the one observed in the archaeological samples were found in all the replicas samples quite regardless of the elaboration parameters. Big crystals incorporating small crystals were identified as being respectively lead feldspars with traces of calcium and sometimes titanium (Ca,Pb)Al2Si2O8 and mullite 3Al2O3.2SiO2 (Figure 10 and Figure 11).

4. Discussion: Comparison between Archaeological and Replicas Interfaces

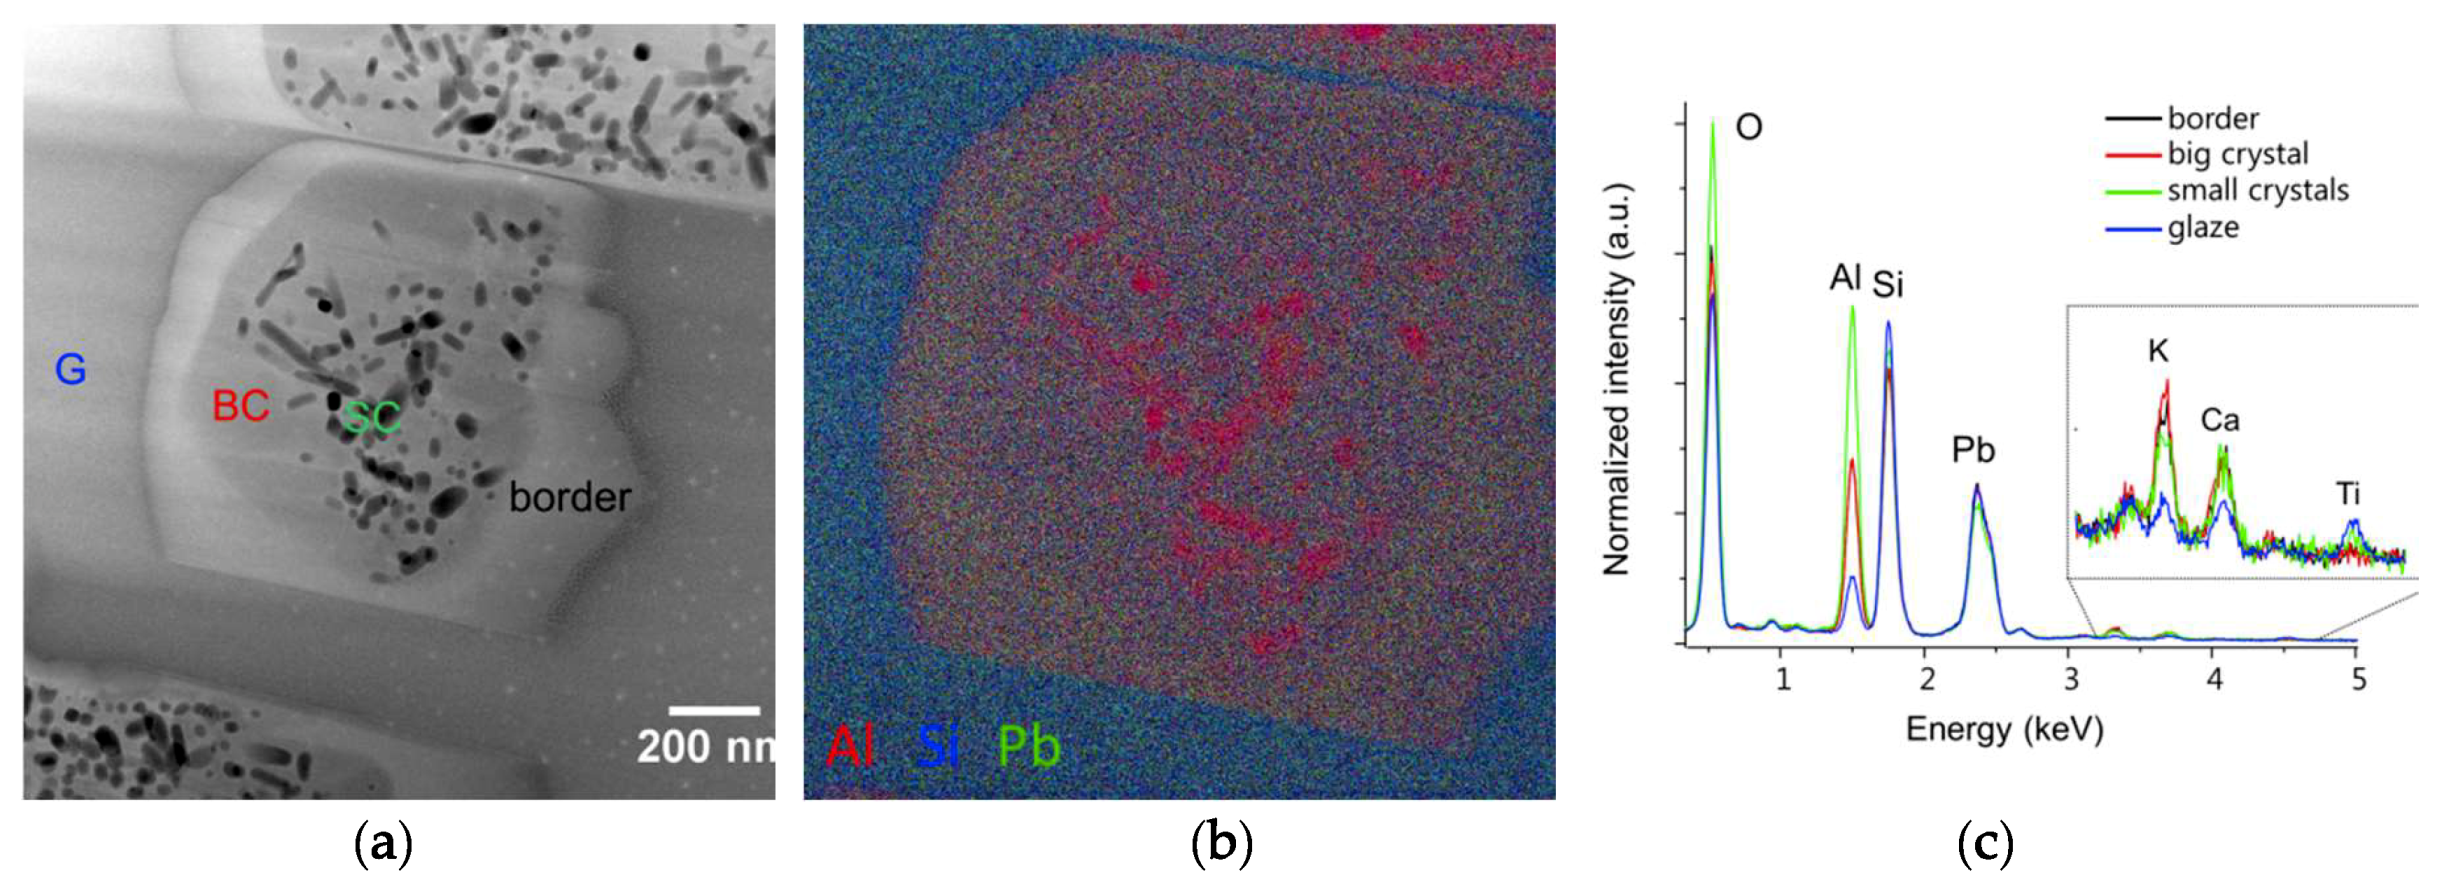
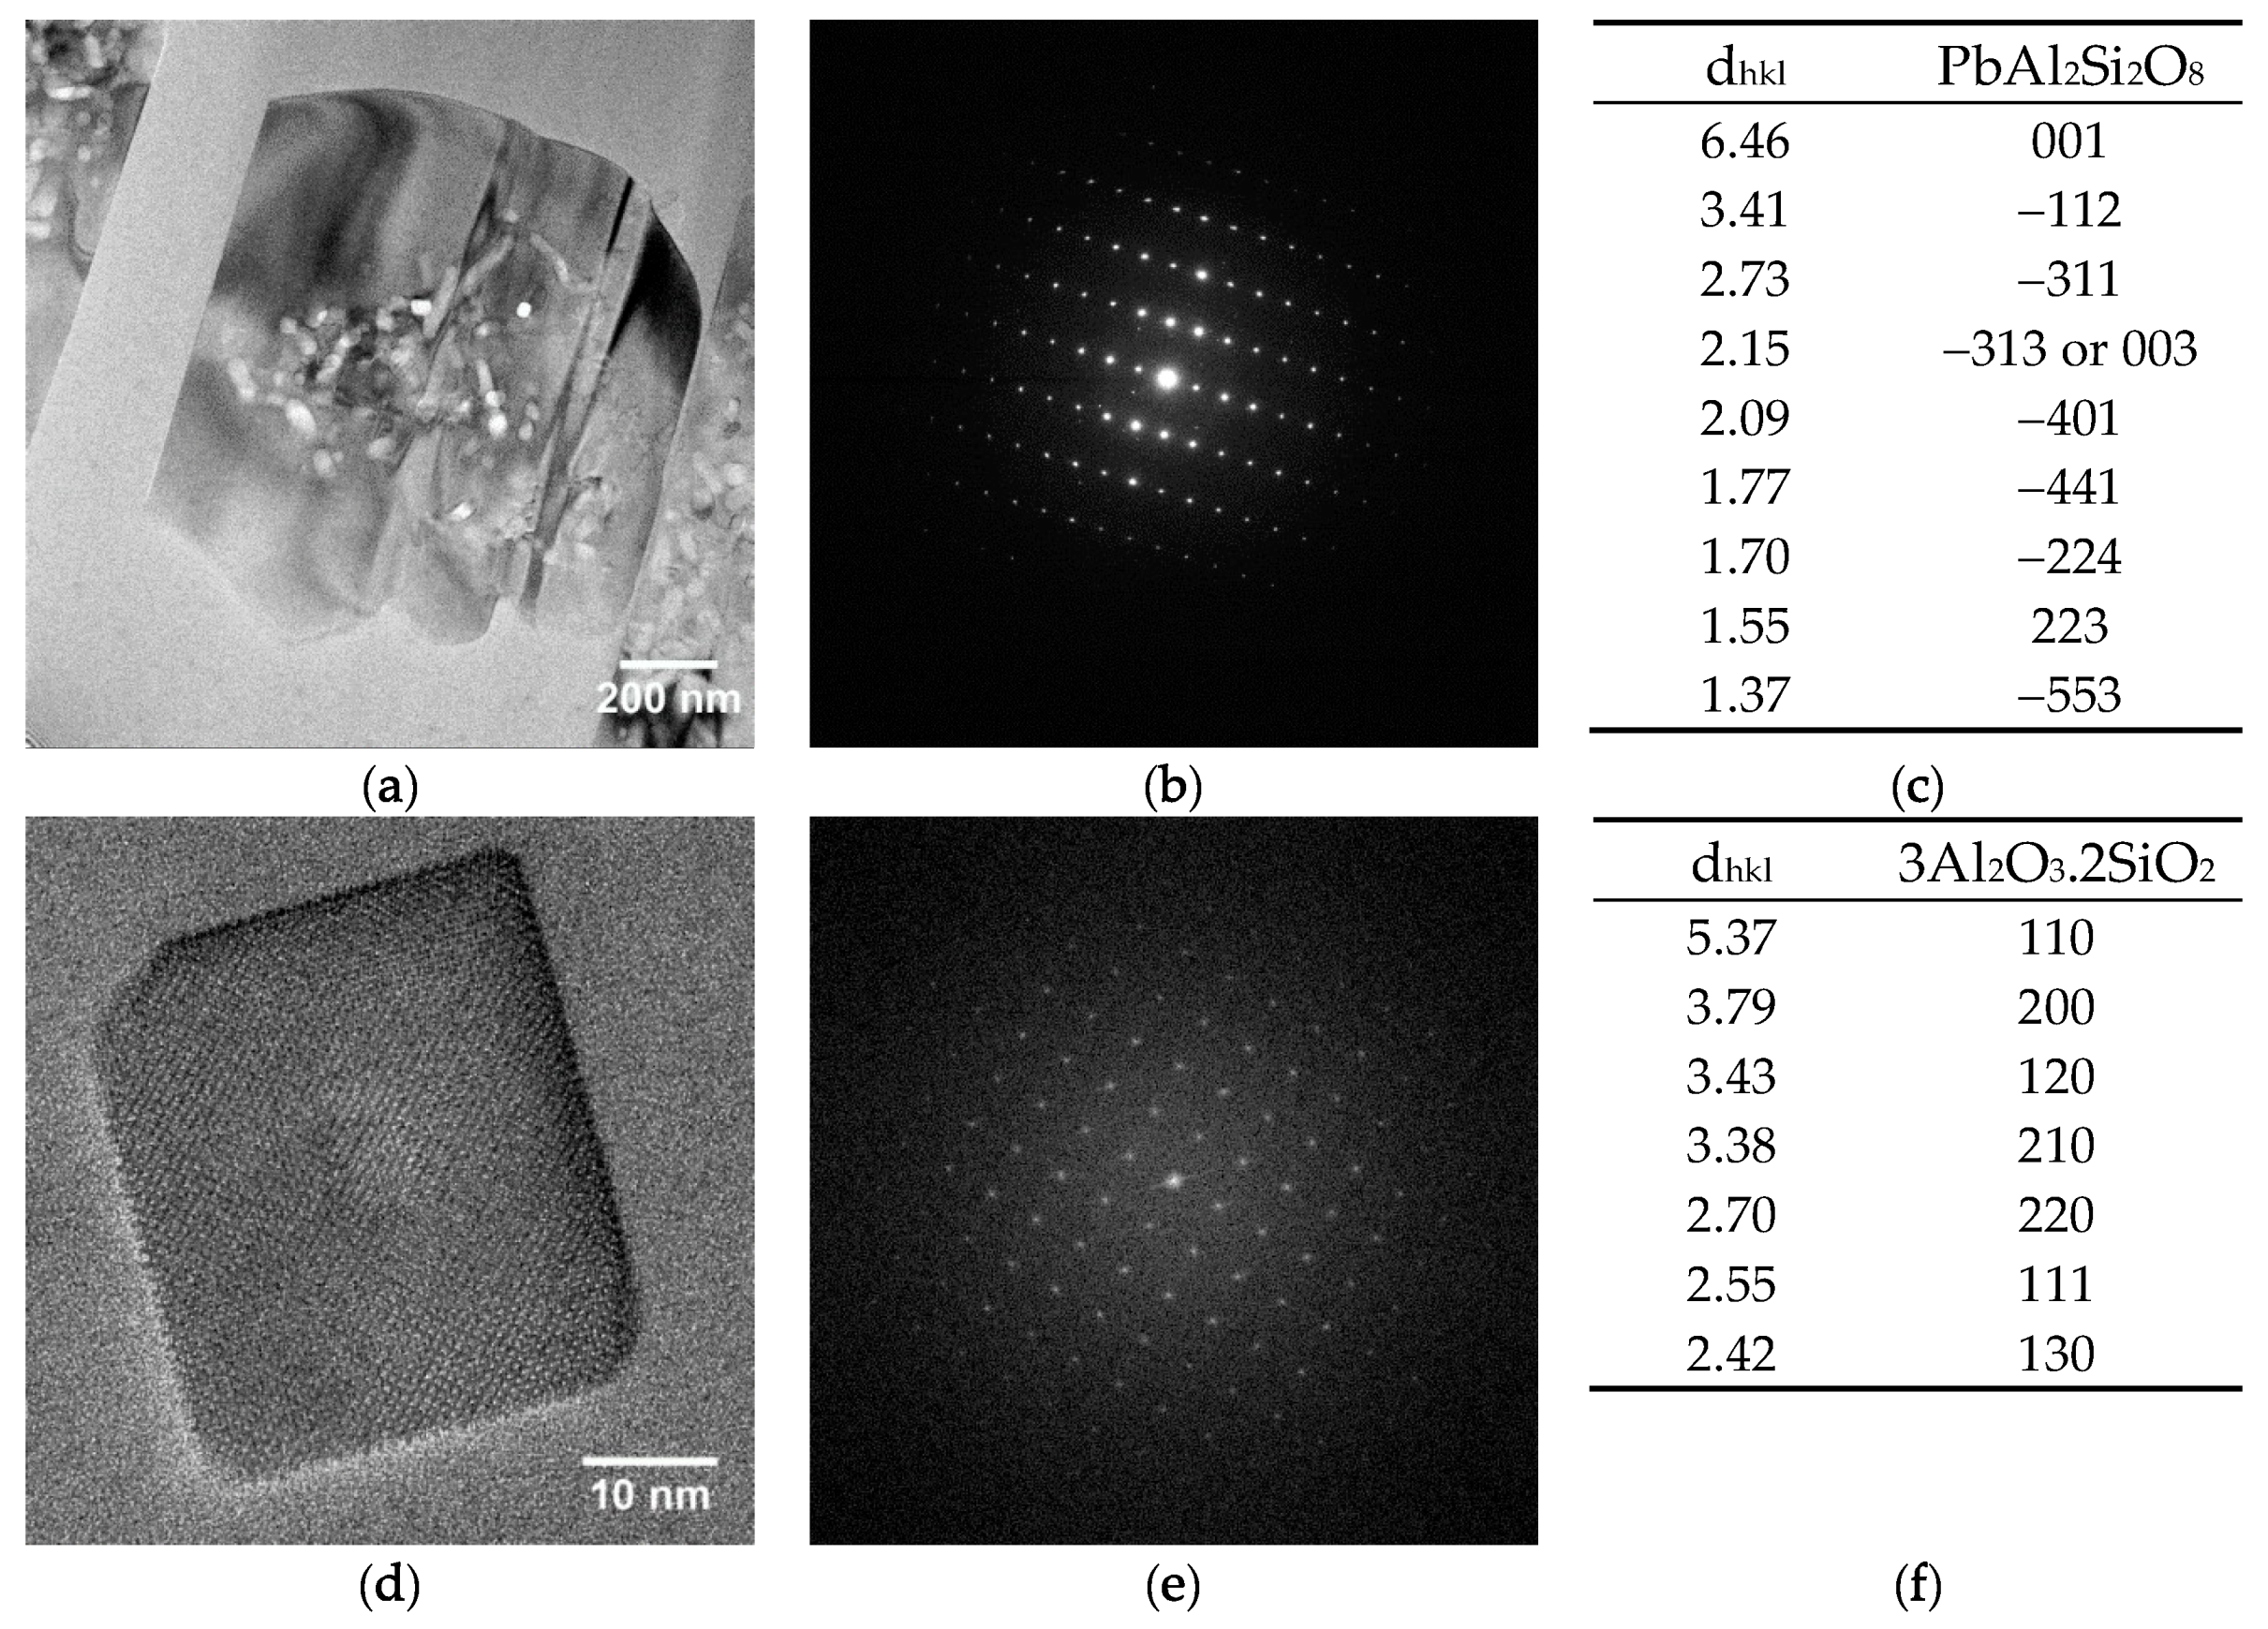
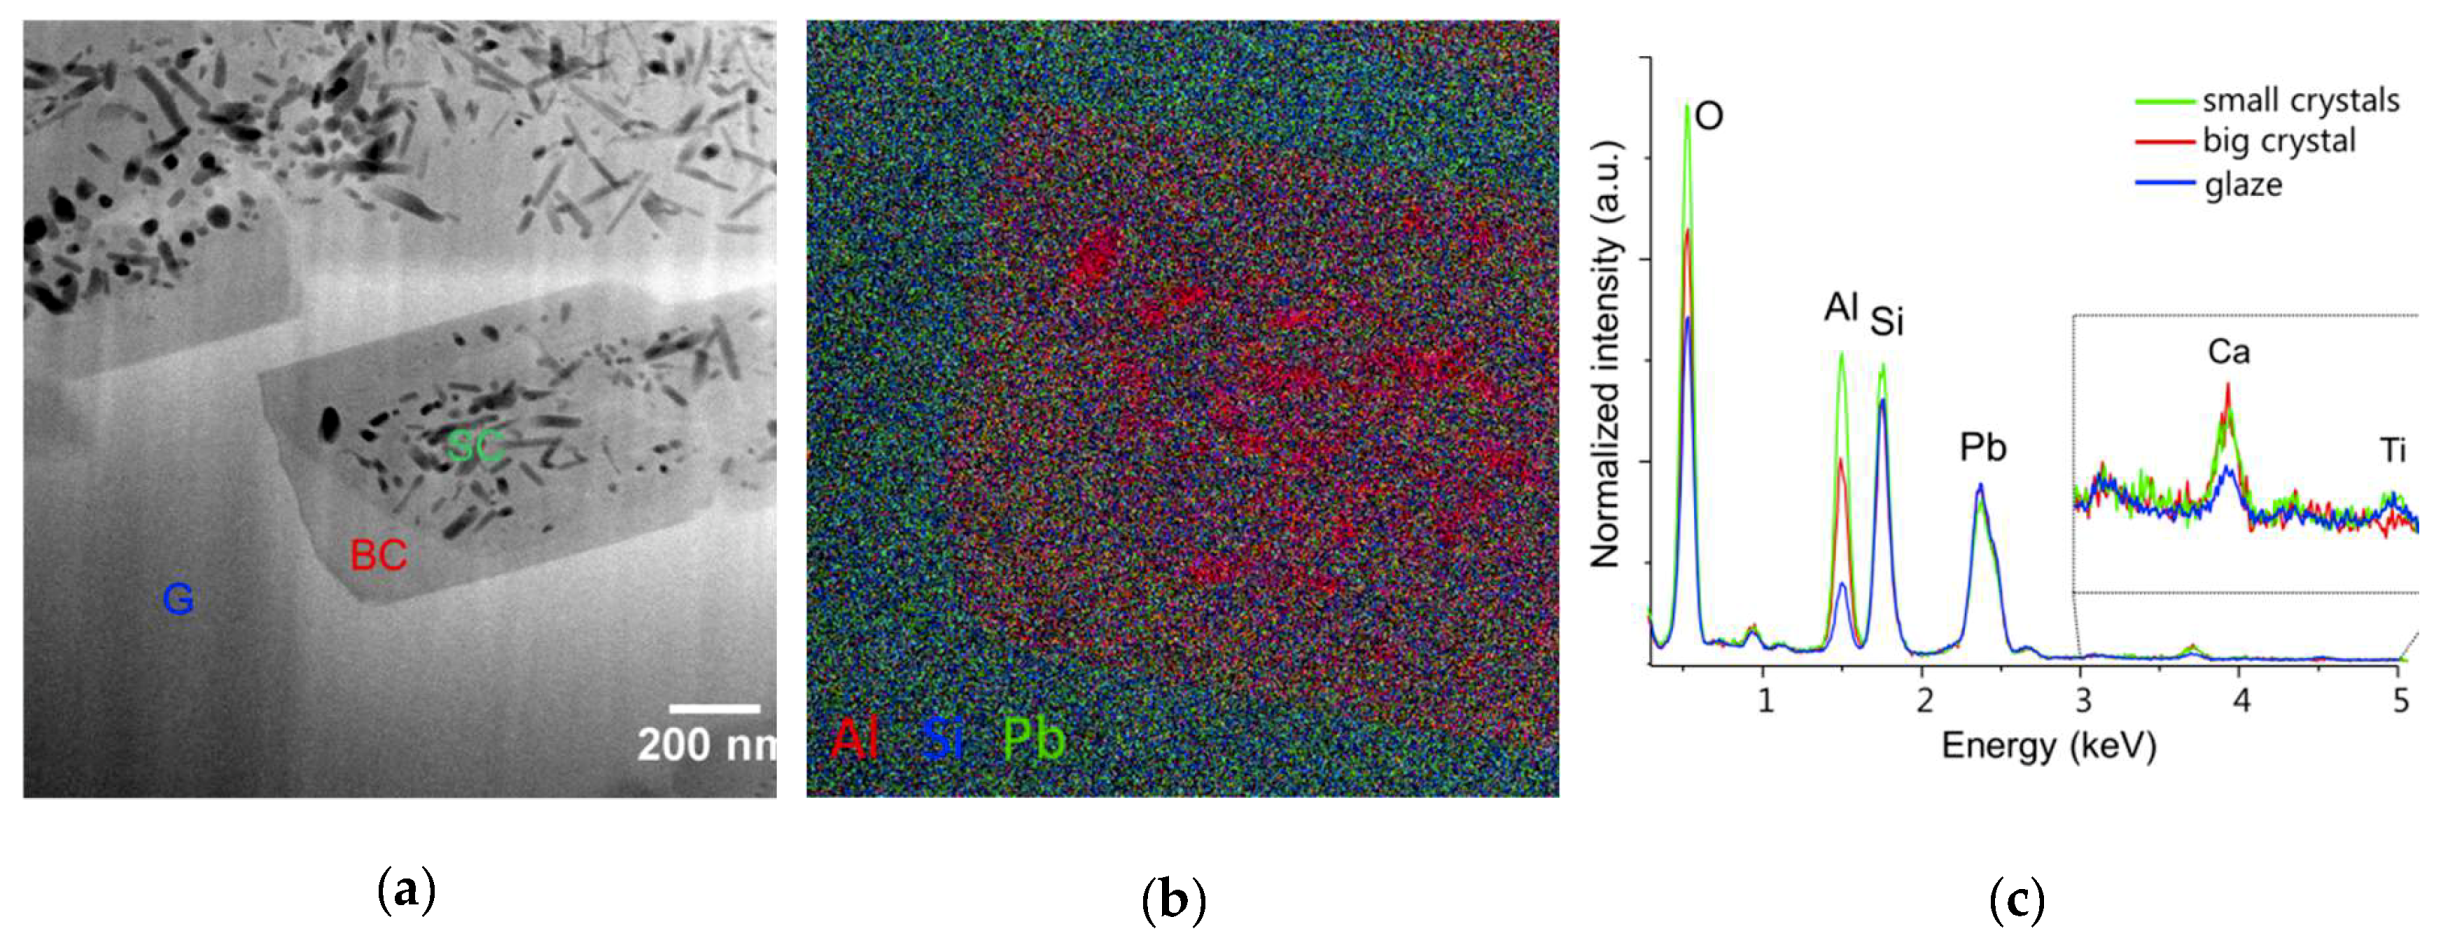
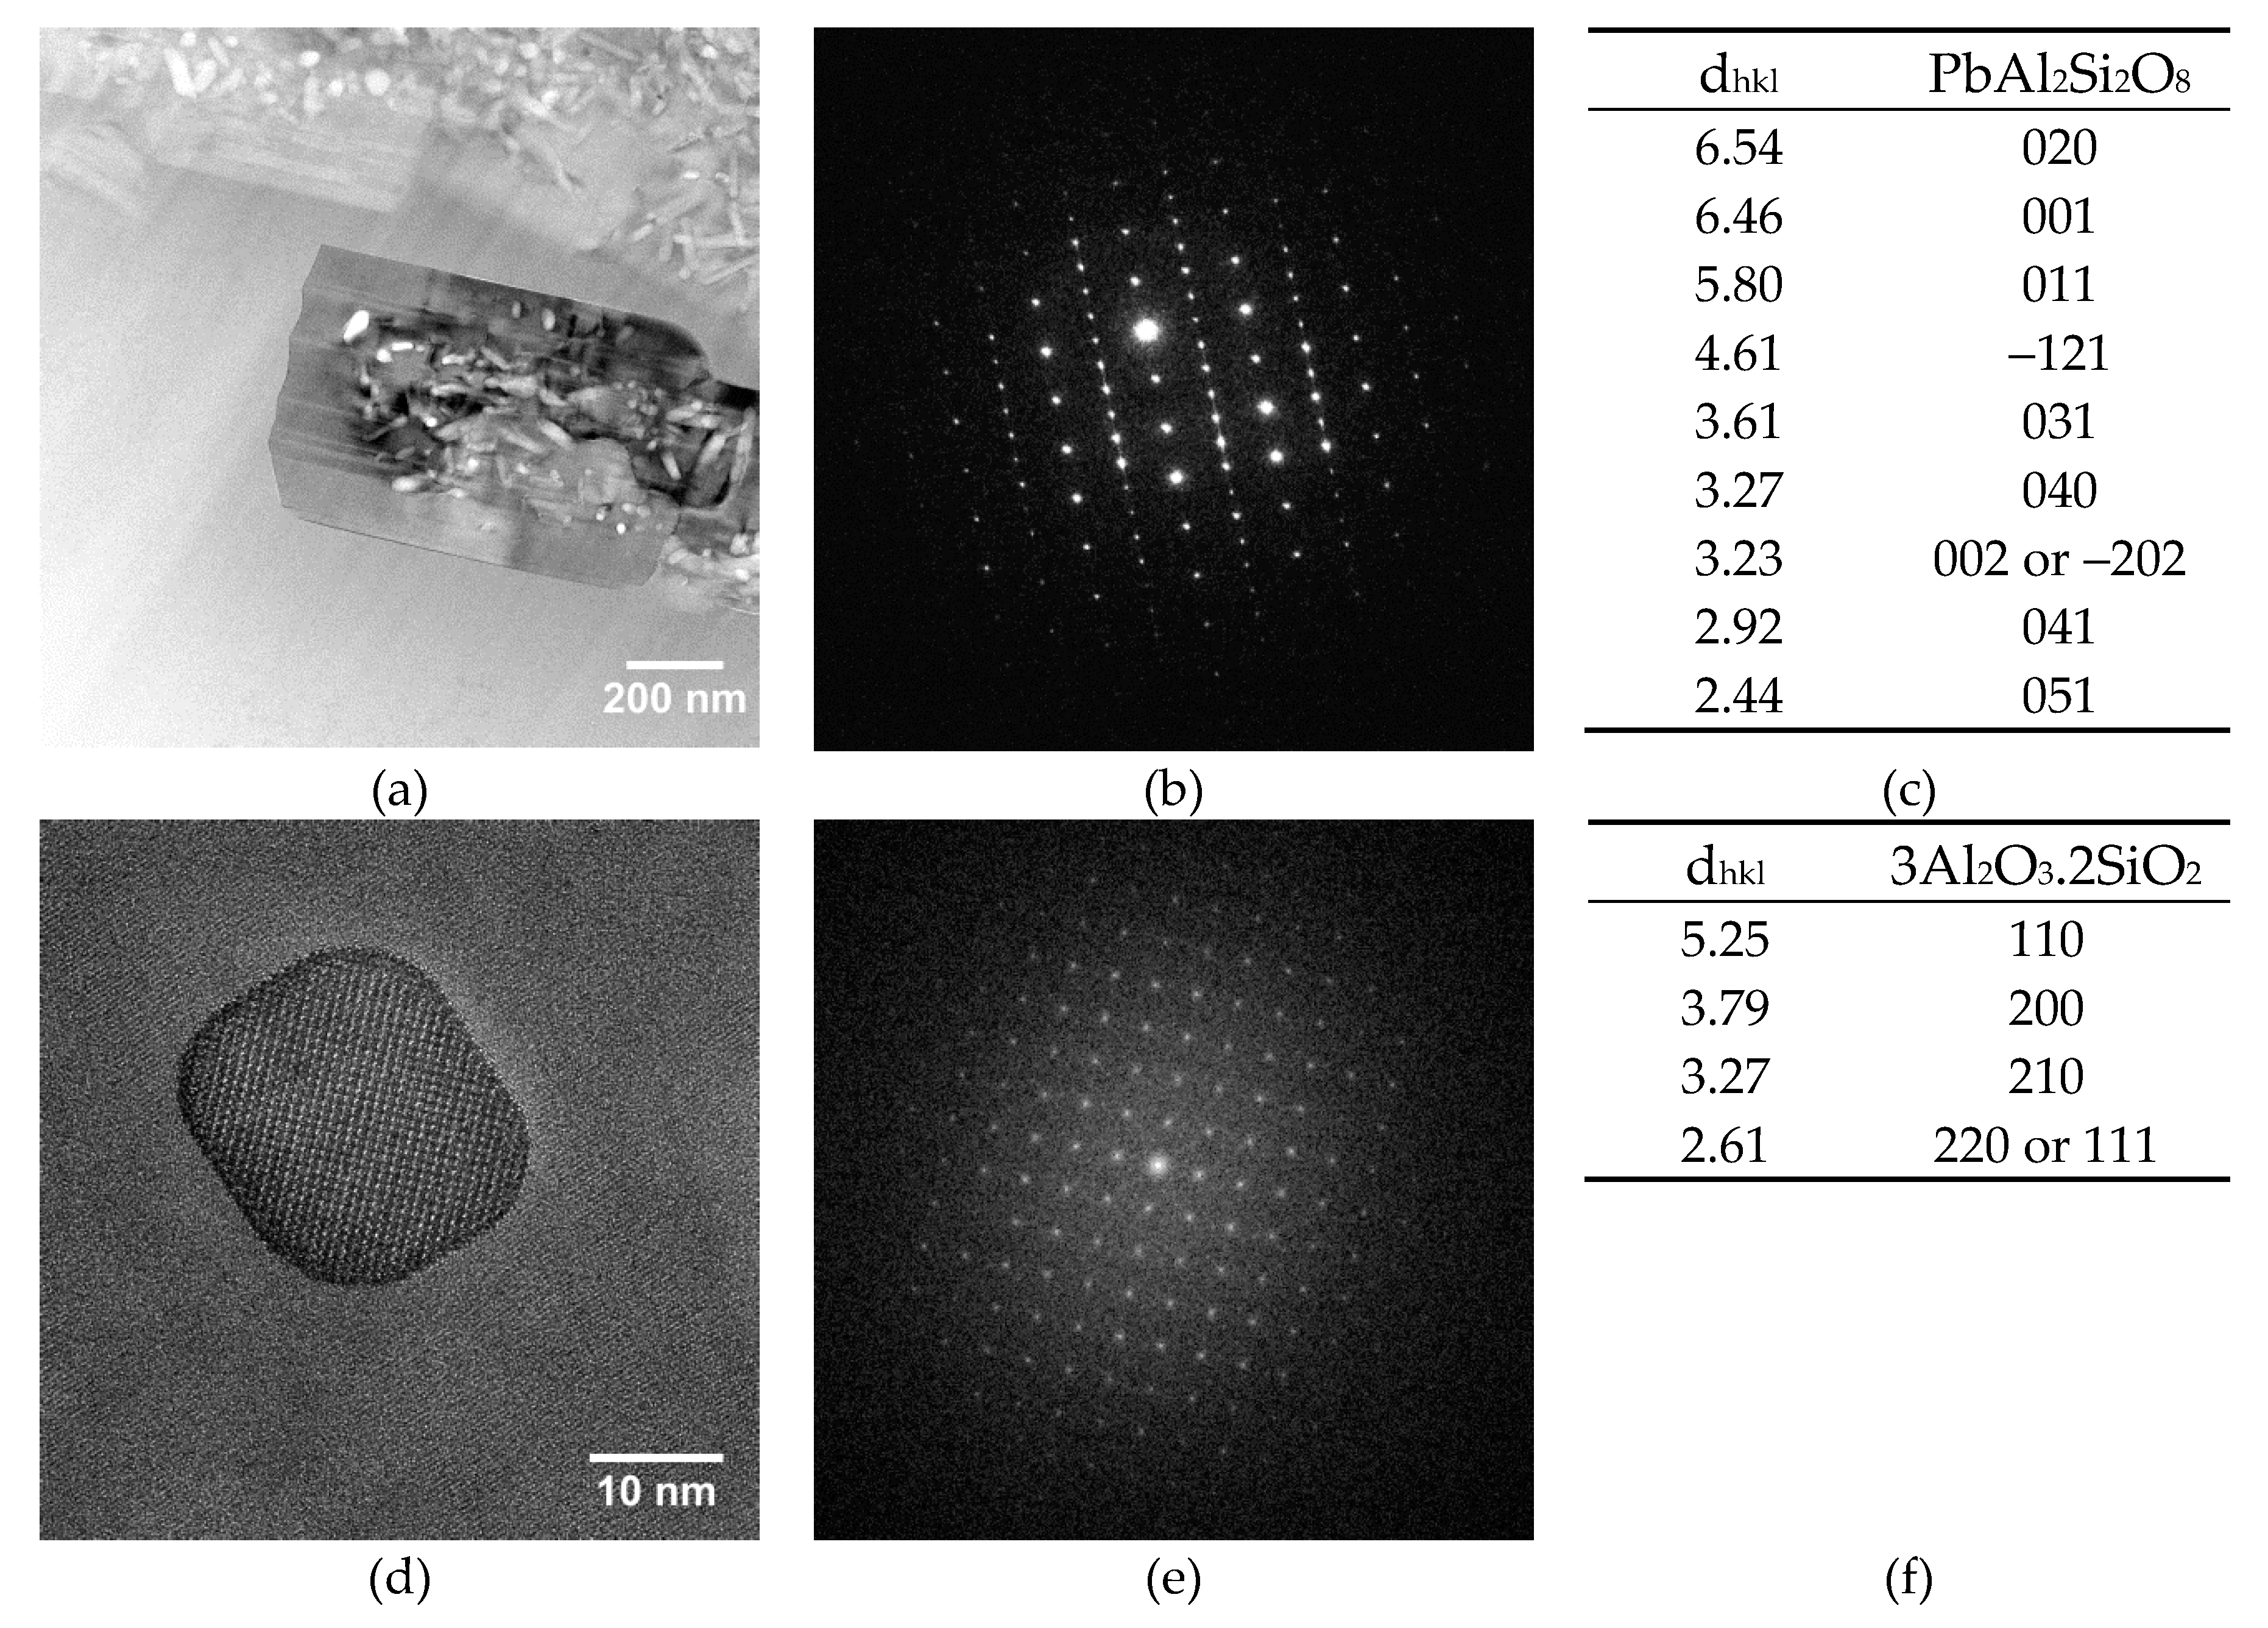
Both archaeological and replicas interfaces have comparable micro- and nano-structures. A modified paste area plus an interfacial crystals layer composed of lead feldspars monocrystals incorporating mullite monocrystals have been evidenced in both cases. The feldspars PbAl2Si2O8 observed in archaeological interfaces contain small amounts of K and Ca (less than a few %wt) and sometime Ti in trace amounts. These three elements have probably diffused from the paste during the firing and entered the feldspars crystal structure, considering their size compatibility with Pb2+ ion (K+ = 1.5 Å; Ca2+ = 1.14 Å, Ti2+ = 1 Å, and Pb2+ = 1.33 Å). The lead feldspars observed in the replicas have the same composition except that they contain no K. This might be explained by the fact that the white paste of EP2319 sample contains slightly more K than the white paste used for the replicas (0.90 vs. 0.50 %wt of K2O). A similar type of feldspars of average composition (K0.85Pb0.12 Ca0.03)Al1.08 Si2.92O8 have been previously observed at the body-glaze interfaces of a corpus of Hispano-Moresque pottery [18]. The interfacial crystals chemical composition is, in fact, a solid solution ranging between lead feldspars PbAl2Si2O8, anorthite CaAl2Si2O8, and K-feldspars KAlSi3O8.
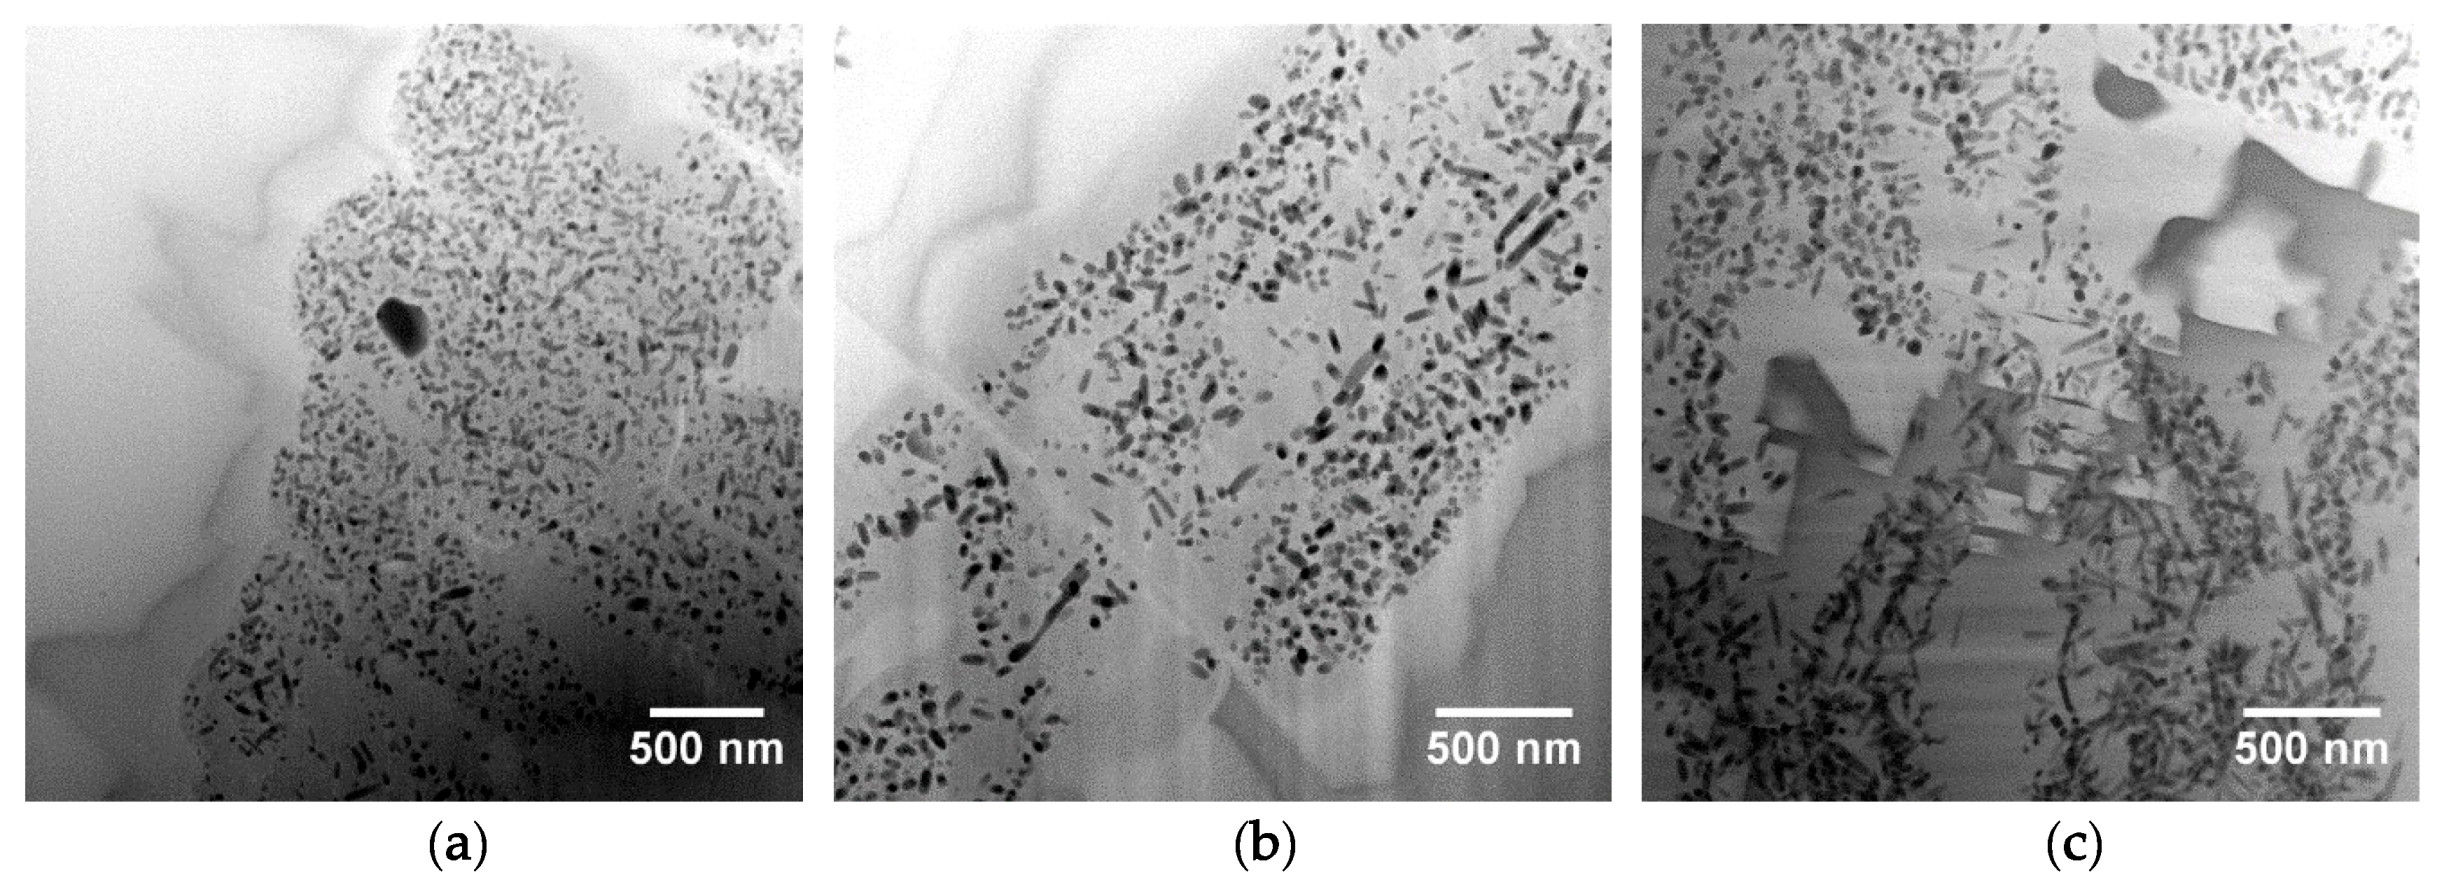
Increasing the firing time and decreasing the cooling rate increase significantly the interface extension and the feldspars crystals become larger and more rectangular. These results are consistent with observations made by other authors [9,12] and can be explained by the fact that by staying longer at high temperature, the melt is less viscous. Thus, it penetrates more into the paste and crystallization process is promoted. The mullite crystals size seems not affected by these parameters’ modification. This tends to indicate that at least a part of the mullite crystals incorporated inside the feldspars are originating from the body [6], rather than being newly formed compounds crystallizing during the thermal process.
Removing alumina from the glazing mixture induces an opaque and matte visual appearance linked to the crystallization of trydimite in the glaze. Furthermore, it increases significantly the modified paste extension to about 100 µm. Yet Palissy honey glazes (on white body) always have a transparent and brilliant aspect with no crystallization, and the interfaces are always measuring between 10–30 µm thick (in particular the modified paste area is about 10 µm). The ceramist was thus very probably adding intentionally Al into the glazing mixture (in the form of clay), knowing that the presence of Al increases the melt viscosity and thus reduces any potential crystallization process in the glaze [23]. Another argument in favor of this hypothesis is that the amount of Al2O3 measured in different colored glazes (including yellow, grey, green, brown, etc.) decorating two authenticated Rustiques Figulines was found to be varying between 0.8 to 11%wt, depending on the color [5]. This result reinforces the hypothesis that the ceramist was controlling very precisely the amount of Al added in the glazing mixture, or else it would have been in the same order of magnitude on the whole object (only diffusing from the paste).
If we suppose that Palissy was working at 1000 °C and consider the interface extension, we can deduce that he was probably working with a firing time of 1 h. However, hematite crystallizations stable only between 915 and 950 °C were recently evidenced in some of Palissy honey iron-rich glazes (3.2–4.9 %wt Fe2O3) applied on red pastes [6]. This result indicates that Palissy may have also worked with a temperature lower than 1000 °C. In addition, preliminary tests conducted on a replica fired at 900 °C and quenched immediately revealed an interface extension of about 2–3 µm using SEM. Therefore, if Palissy was working at lower temperatures than 1000 °C, he was probably using a firing time longer than 1 h which constitutes quite a technical achievement at his time. The cooling in the oven was then leading to the growth of an interface of 10–30 µm with rectangular sharp-edged feldspars crystals.

5. Conclusions

Bernard Palissy white body-honey glaze interface areas (10–30 µm thick) were characterized down to the nanoscale: a modified paste region on which interfacial sharp-edged microcrystals are growing have been observed. These crystals have been identified as lead feldspars microcrystals (Pbx, Cay, Tiz, K1-x-y-z)Al2Si2O8 incorporating mullite 3Al2O3.2SiO2 nanocrystals.
Replica samples fired at 1000 °C show different interface extensions and crystal shapes depending on the elaboration conditions used. The importance of adding Al to the glaze mixture was demonstrated since otherwise an opaque matte glaze was produced and the interface extension was much wider (~100 µm) than the archaeological ones. Besides, it was found that longer firing times and slower cooling rates lead to wider interfaces and more well-formed sharp-edged crystals. At 1000 °C, a firing time of 1 h followed by a cooling in the oven (50 °C·h−1) lead to an interface extension and microstructure comparable to those of Palissy samples.
Finally, from a methodological point of view, the multi-scale analytical procedure including TEM and associated techniques has proved its worth. It has now to be applied for the investigation of others colored glazes and pastes to gain a deeper understanding of the elaboration conditions used in Palissy workshop.

Author Contributions

Conceptualization, A.B., D.C., O.M., N.M. and L.C.; funding acquisition, A.B. and L.C.; investigation, M.G., G.R. and E.B.; methodology, M.G., G.R. and N.M.; resources, N.M. and O.D.; supervision, D.C., A.B. and L.C.; visualization, M.G.; writing—original draft, M.G.; writing—review & editing, M.G., G.R., E.B., D.C. and L.C.

Funding

This research was funded by Région Ile de France (DIM Matériaux anciens et patrimoniaux) and Sorbonne Université. The APC was funded by European Materials Research Society.

Acknowledgments

The archaeological samples were kindly made available by the conservation department of the National Museum of the Renaissance (Ecouen, France). IMPMC MEB platform (Imène Estève, Béatrice Doisneau and Stéphanie Delbrel), David Troadec (IEMN) and Claudie Josse (Raymond Castaing) are warmly thanked for the sample preparation. J-M Guigner is acknowledged for his kind help with TEM.

Conflicts of Interest

The authors declare no conflict of interest.

References

  1. Bouquillon, A.; Barbe, F.; Lehuédé, P.; Castaing, J.; Crépin-Leblond, T. Bernard Palissy, Scientist and Potter of the Renaissance in France; Saunders, D., Spring, M., Meek, A., Eds.; The Renaissance Workshop. Archetype Publications: British Museum, London, UK, 2013; pp. 152–159. [Google Scholar]
  2. Palissy, B. Discours Admirables; le Jeune, M., Ed.; Martin Le Jeune: Paris, France, 1580. [Google Scholar]
  3. Dufay, B.; Kisch, Y.; Trombetta, P.-J.; Poulain, D.; Roumégoux, Y. L’atelier parisien de Bernard Palissy. Rvart 1987, 78, 33–60. [Google Scholar] [CrossRef]
  4. Bouquillon, A. Heaven and Earth–′Madonne col Bambino’ and ‘Rustiques figulines’. Appl. Phys. A. 2004, 79, 161–166. [Google Scholar] [CrossRef]
  5. Bouquillon, A.; Castaing, J.; Barbe, F.; Paine, S.R.; Christman, B.; Crépin-Leblond, T.; Heuer, A.H. Lead-Glazed Rustiques Figulines (Rustic Ceramics) of Bernard Palissy (1510–1590) and his Followers: Lead-glazed rustiques figulines of Bernard Palissy and followers. Archaeometry 2017, 59, 69–83. [Google Scholar] [CrossRef]
  6. Roisine, G. Céramiques Glaçurées De Bernard Palissy: A La Recherche Des Secrets d’un Maître De La Renaissance. Ph.D.Thesis, Paris Sciences et Lettres (PSL Research University), Paris, France, 2018. [Google Scholar]
  7. Roisine, G.; Capobianco, N.; Caurant, D.; Wallez, G.; Bouquillon, A.; Majérus, O.; Cormier, L.; Gilette, S.; Gerbier, A. The art of Bernard Palissy (1510–1590): influence of firing conditions on the microstructure of iron-colored high-lead glazes. Appl. Phys. A 2017, 123, 501. [Google Scholar] [CrossRef]
  8. Tite, M.S.; Freestone, I.; Mason, R.; Molera, J.; Vendrell-Saz, M.; Wood, N. Lead glazes in Antiquity: Methods of production and reasons for use. Archaeometry 1998, 40, 241–260. [Google Scholar] [CrossRef]
  9. Molera, J.; Pradell, T.; Salvadó, N.; Vendrell-Saz, M. Interactions between Clay Bodies and Lead Glazes. J. Am. Ceram. Soc. 2001, 84, 1120–1128. [Google Scholar] [CrossRef]
  10. Coentro, S.X. An Iberian Heritage: Hispano-Moresque Architectural Tiles in Portuguese and Spanish Collections. Ph.D.Thesis, Faculdade de Ciencias e Tecnologia, Lisboa, Portugal, 2017. [Google Scholar]
  11. Ben Amara, A. Céramiques Glaçurées De l’espace Méditerranéen (IX-XVII Siècles ap. J.-C.)-Matériaux, Techniques Et Altération. Ph.D.Thesis, Université Michel de Montaigne Bordeaux, Bordeaux, France, 2002. [Google Scholar]
  12. Walton, M.S. A Materials Chemistry Investigation of Archaeological Lead Glazes. Ph.D.Thesis, Oxford University, Oxford, UK, 2004. [Google Scholar]
  13. Ben Amara, A. Interactions between Lead Glazes and Bodies: Research on the Mode of Application of the Glazing Mixture; Institución Fernando el Católico: Zaragoza, Spain, 2006; pp. 399–404. [Google Scholar]
  14. Fortina, C.; Memmi Turbanti, I.; Grassi, F. Glazed ceramic manufacturing in southern Tuscany (Italy): evidence of technological continuity throughout the medieval period (10th–14th centuries). Archaeometry 2008, 50, 30–47. [Google Scholar] [CrossRef]
  15. Walton, M.S.; Tite, M.S. Production technology of Roman lead-glazed pottery and its continuance into late Antiquity. Archaeometry 2010, 52, 733–759. [Google Scholar] [CrossRef]
  16. Pradell, T.; Molera, J.; Salvadó, N.; Labrador, A. Synchrotron radiation micro-XRD in the study of glaze technology. Appl. Phys. A 2010, 99, 407–417. [Google Scholar] [CrossRef]
  17. Bouquillon, A.; Castaing, J.; Dufoumier, D.; Bergeret, J. Le problème particulier des “suites de Palissy” du Pré d’Auge. Techné 2004, 20, 83–91. [Google Scholar]
  18. Molera, J.; Pradell, T.; Martinez-Manent, S.; Vendrell-Saz, M. The growth of sanidine crystals in the lead of glazes of Hispano-Moresque pottery. Appl. Clay Sci. 1993, 7, 483–491. [Google Scholar] [CrossRef]
  19. Benedetto, G.D.; Acquafredda, P.; Masieri, M.; Quarta, G.; Sabbatini, L.; Zambonin, P.G.; Tite, M.; Walton, M. Investigation on Roman lead glaze from Canosa: Results of chemical analyses. Archaeometry 2004, 46, 615–624. [Google Scholar] [CrossRef]
  20. Ben Amara, A.; Gourdon-Platel, N.; Bechtel, F.; Schvoerer, M.; Bon, P. Carreaux glaçurés provenant d’un château du Duc de Berry (Mehun-sur-Yèvre, fin XIVe siècle): Recherche d’indices techniques. Archeosciences 2005, 29, 21–34. [Google Scholar] [CrossRef]
  21. Pradell, T.; Molina, G.; Molera, J.; Pla, J.; Labrador, A. The use of micro-XRD for the study of glaze color decorations. Appl. Phys. A 2013, 111, 121–127. [Google Scholar] [CrossRef]
  22. Coentro, S.; Trindade, R.A.; Mirão, J.; Candeias, A.; Alves, L.C.; Silva, R.M.; Muralha, V.S. Hispano-Moresque ceramic tiles from the Monastery of Santa Clara-a-Velha (Coimbra, Portugal). J. Archaeol. Sci. 2014, 41, 21–28. [Google Scholar] [CrossRef]
  23. Kara, A. Characterization of the Interfaces between Leadless Glazes and A Bone China Body. Ph.D. Thesis, University of Bath, Bath, UK, 1999. [Google Scholar]
Figure 1. Microscale examination of archaeological fragments, (ad). OM images of EP422, EP470, EP600 and EP2319, (eh). corresponding SEM-BSE images showing the interface area between the honey glaze and the white paste; legend: G = glaze; I = interface area; P = paste; scale bar = 200 µm for OM images; 10 µm for SEM images.
Heritage 02 00152 g001
Figure 2. Archaeological glaze-paste interfaces showing micro-heterogeneities: (a). EP470, (b). EP2319 (SEM-BSE images); legend: G = glaze; IC = interface crystals region; MP = modified paste region; P = unaffected paste; 1. interfacial compound with borders; 2. dark lines inside crystals.
Heritage 02 00152 g002
Figure 3. SEM-EDX investigation of EP422 archaeological interface, (a). interface area with EDX analysis localization (SEM-BSE image), (b). hypermaps superposition including BSE image (greyscale), Al (green), Si (blue) and Pb (purple), (c). normalized EDX spectra extracted from the areas indicated in (a,d). evolution of the chemical composition across the whole sample, 0 µm correspond to a point in the glaze (50 µm above the interface) and 150 µm corresponds to the bottom of the sample (EDX profiles).
Heritage 02 00152 g003
Figure 4. Archaeological glaze-paste interface (EP2319) showing nano-heterogeneities (STEM-HAADF images), from (a) to (c), the images have been taken from the glaze to the paste area.
Heritage 02 00152 g004
Figure 5. STEM-EDX analysis of interfacial compounds (EP2319), (a) STEM-HAADF image, the white points on the right are Pt deposition due to FIB preparation, (b) hypermaps superposition including Al (red), Si (blue) and Pb (green), (c). EDX spectra extracted from the four regions of interest indicated in (a), normalized to Cu intensity (the Cu originates from the TEM grid), the small peak before K peak is an artefact (Al sum peak), legend: G = glaze, BC = big crystal, SC = small crystal.
Heritage 02 00152 g005
Figure 6. Crystallographic analysis of big (ac) and small (df) crystals (EP2319), (a). TEM-BF image, (b). SAED diffraction pattern acquired on the big crystal, (c). interreticular distances dhkl extracted from (b). and corresponding diffracting planes, (d). HRTEM image, (e). Fourier filtering of (d,f). interreticular distances extracted from (e) and corresponding diffracting planes.
Heritage 02 00152 g006
Figure 7. Honey glazed replicas tiles (3 × 3 × 0.5 cm), (a). with aluminium, (b). without aluminium (all others conditions being similar, 1000 °C, 120 min, 50 °C·h−1), (c). millimetre-size fragment held by a pair of tweezers collected from a. before ion polishing (3 mm long).
Heritage 02 00152 g007
Figure 8. Typical replica glaze-paste interface (corresponding to the sample presented in Figure 7a) showing great micro-heterogeneities (SEM-BSE image); legend: G = glaze; IC = interface crystals region; MP = modified paste region; P = unaffected paste.
Heritage 02 00152 g008
Figure 9. Replicas glaze-paste interfaces (SEM-BSE images): (ac). influence of firing time at 1000 °C, (d). influence of alumina removal at 1000 °C, (eh). influence of cooling rate after firing at 1000 °C during 120 min.
Heritage 02 00152 g009
Figure 10. STEM-EDX analysis of interfacial compounds (replica fired 1 h at 1000 °C, quenched), (a). STEM-HAADF image, (b). hypermaps superposition including Al (red), Si (blue), and Pb (green), (c). EDX spectra extracted from the three regions of interest indicated in (a)., normalized to Cu intensity (the Cu originates from the TEM grid), the small peak before Ca peak is an artefact (Al sum peak); legend: G = glaze, BC = big crystal, SC = small crystal.
Heritage 02 00152 g010
Figure 11. Crystallographic analysis of big (ac) and small (df) compounds (replicas), (a). TEM-BF image, (b). SAED diffraction pattern acquired on the big crystal, (c). interreticular distances dhkl extracted from (b). and corresponding diffracting planes, (d). HRTEM image, (e). Fourier filtering of (d,f). interreticular distances extracted from (e). and corresponding diffracting planes.
Heritage 02 00152 g011
Table 1. Chemical composition of the white clay (RP299, Provins) used to make the replicas body (provided by the manufacturer).
OxidesNa2OMgOAl2O3SiO2K2OCaOTiO2Fe2O3
Compo (%wt)Non detected0.2828.3268.800.500.391.661.27
Table 2. Chemical composition (wt%) of the glass frit used to make the replica glaze.
OxidesAl2O3SiO2Fe2O3PbO
Glass frit with Al2O36303.560
Glass frit without Al2O3-31.93.764.4

