A Spatial Pattern Analysis of Frontier Passes in China’s Northern Silk Road Region Using a Scale Optimization BLR Archaeological Predictive Model


Abstract
:1. Introduction
2. Study Area, Materials, and Methods
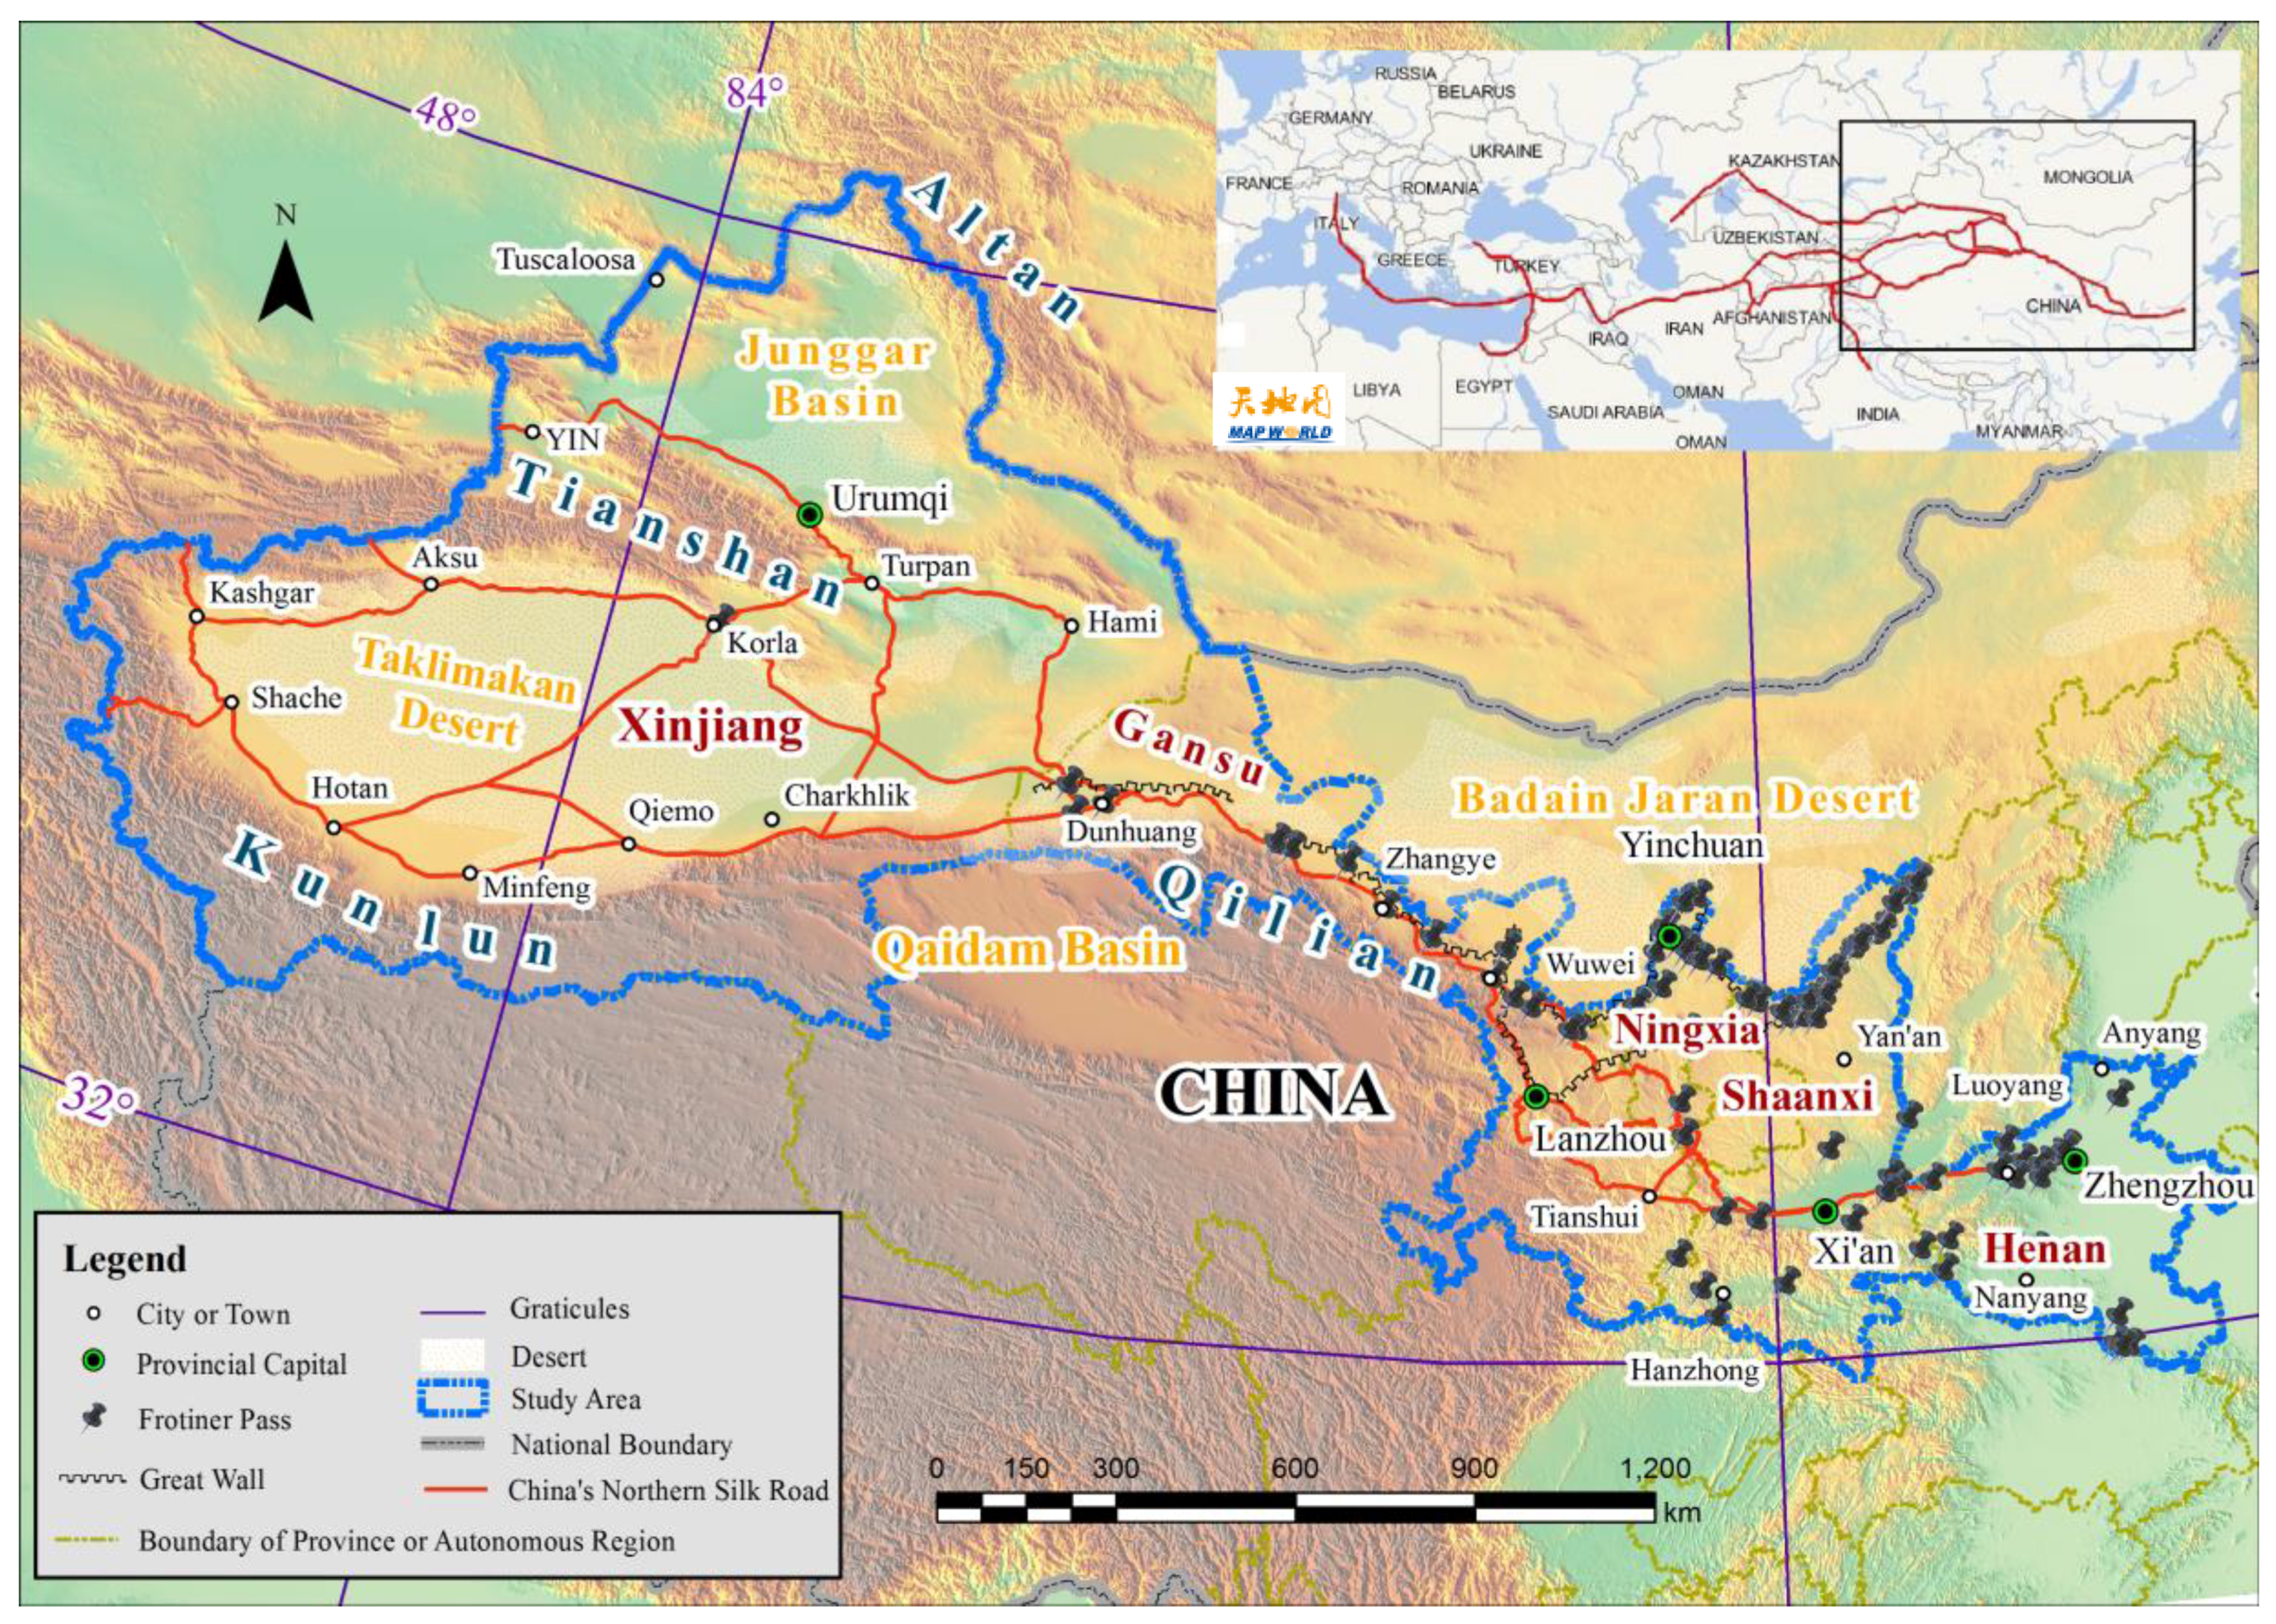
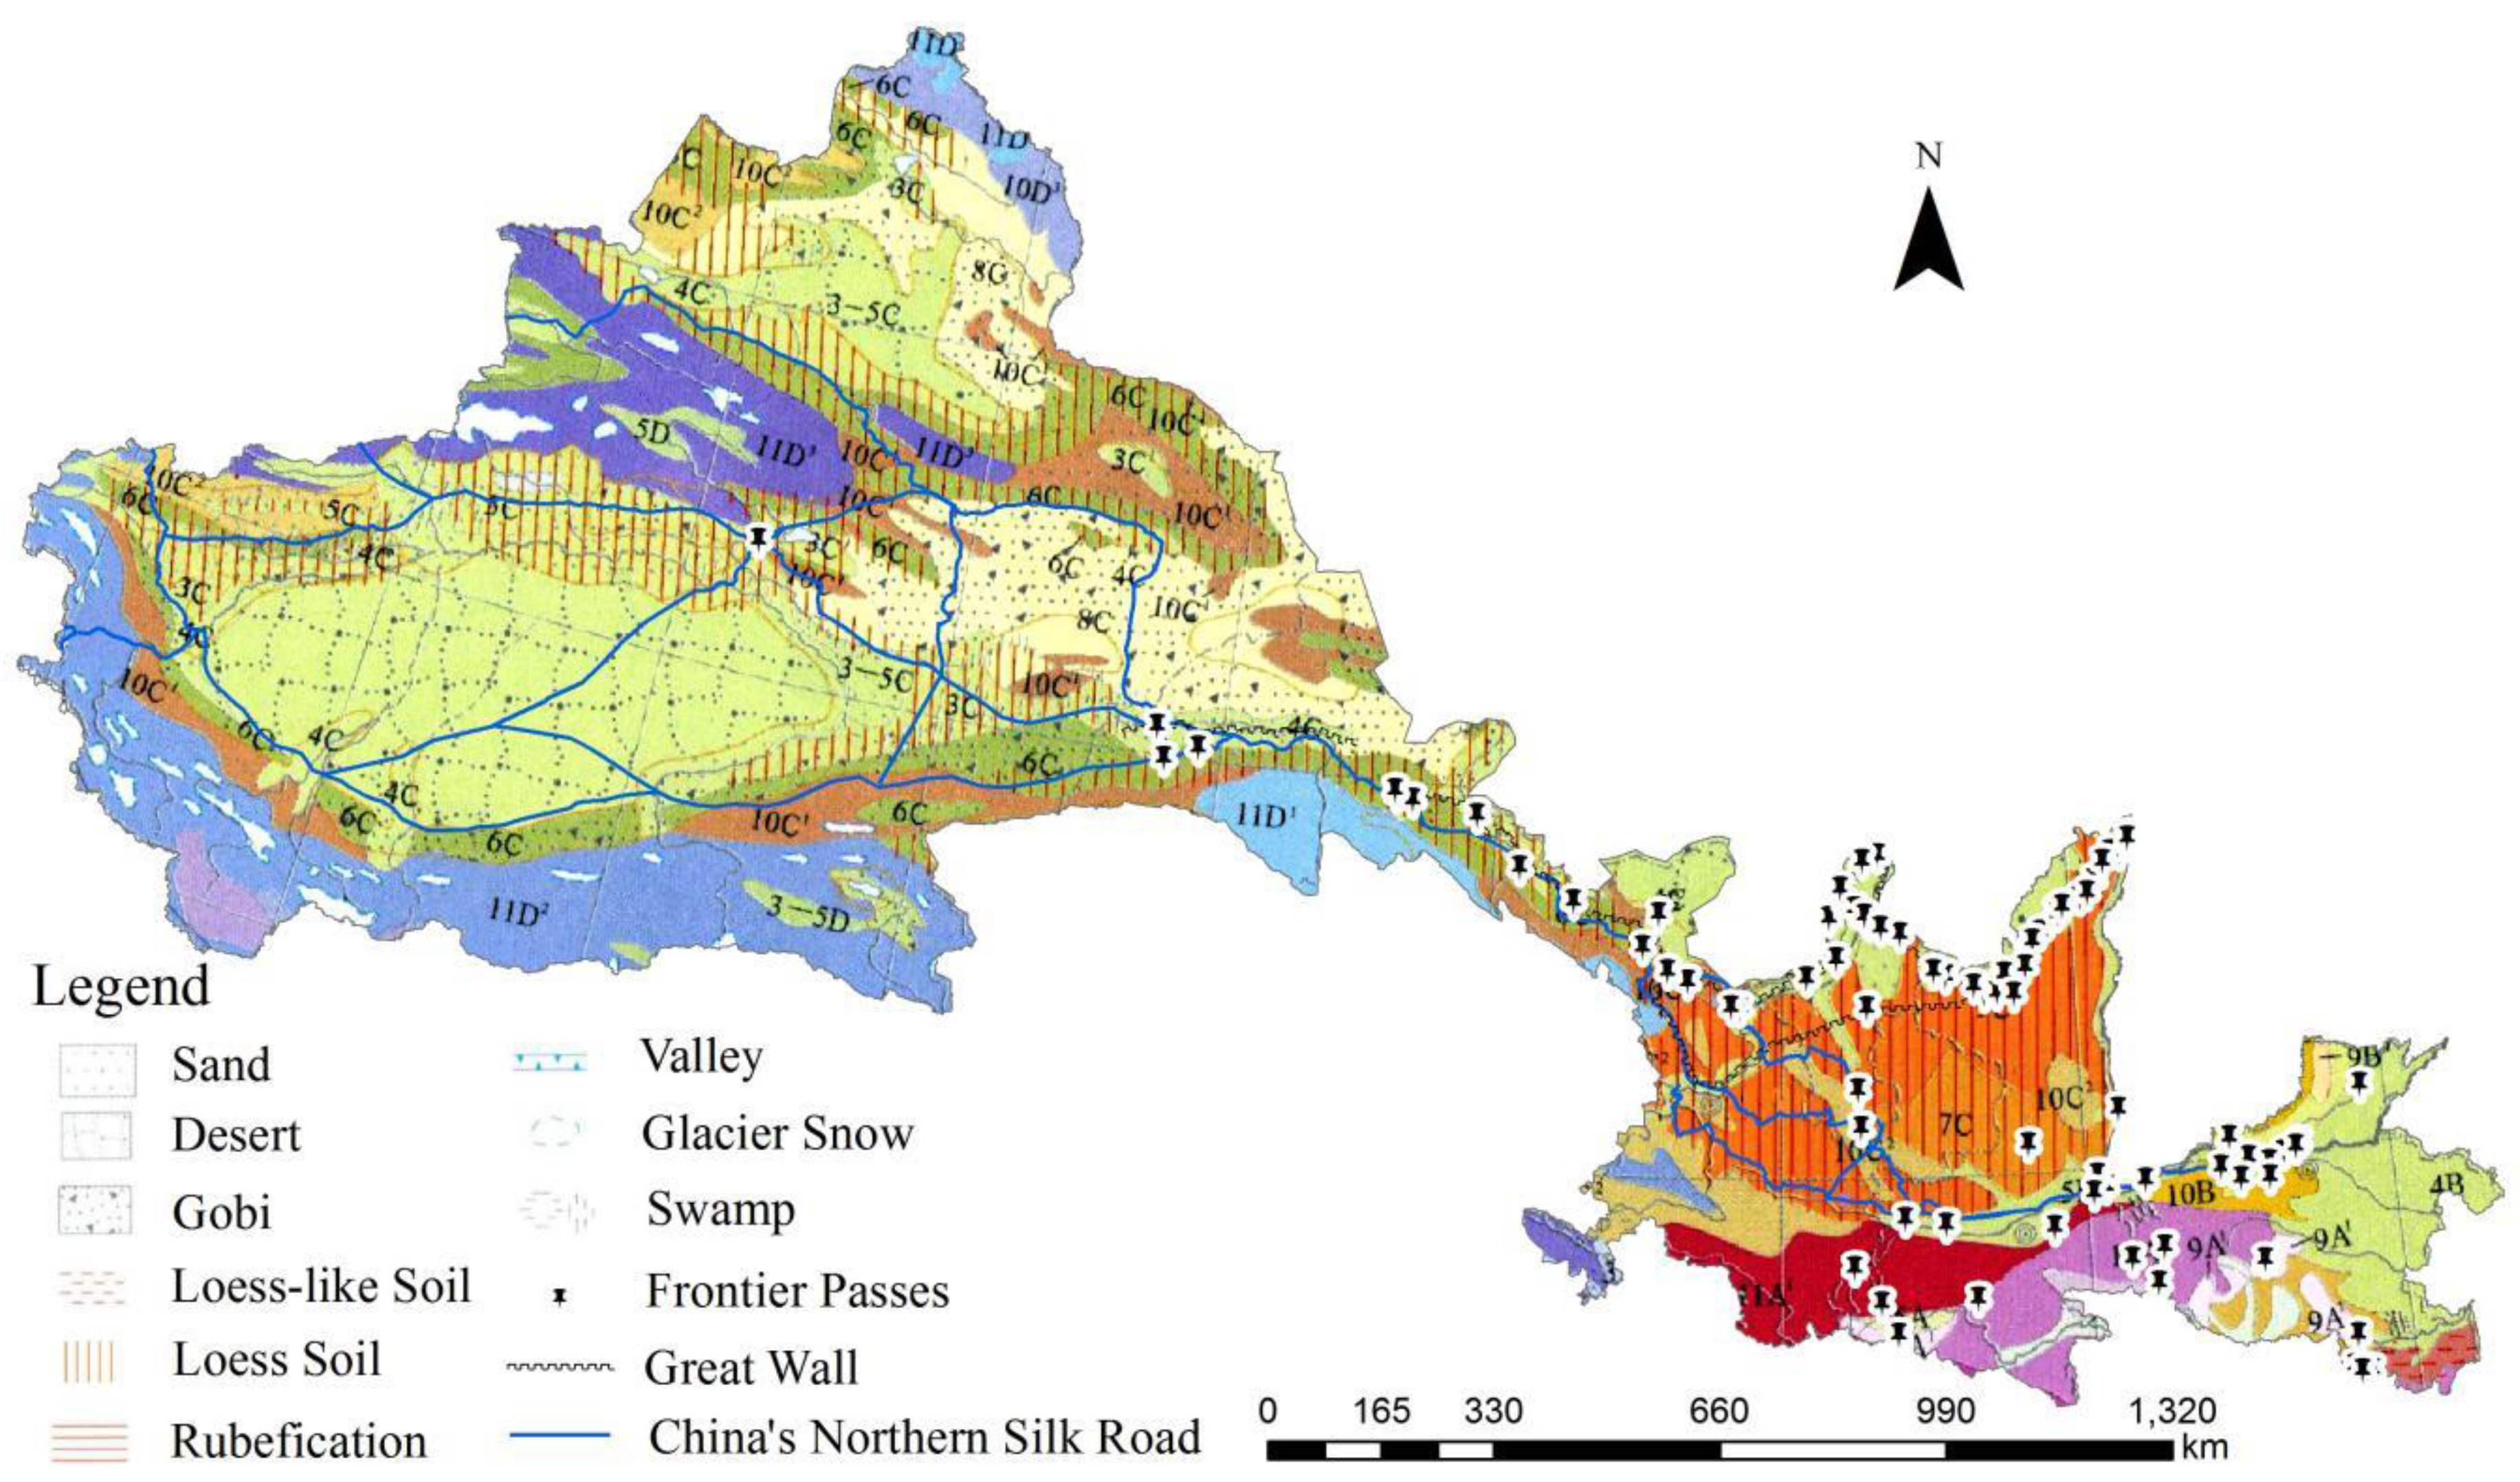
2.1. Study Area
2.2. Materials
2.2.1. General Geographical Spatial Data
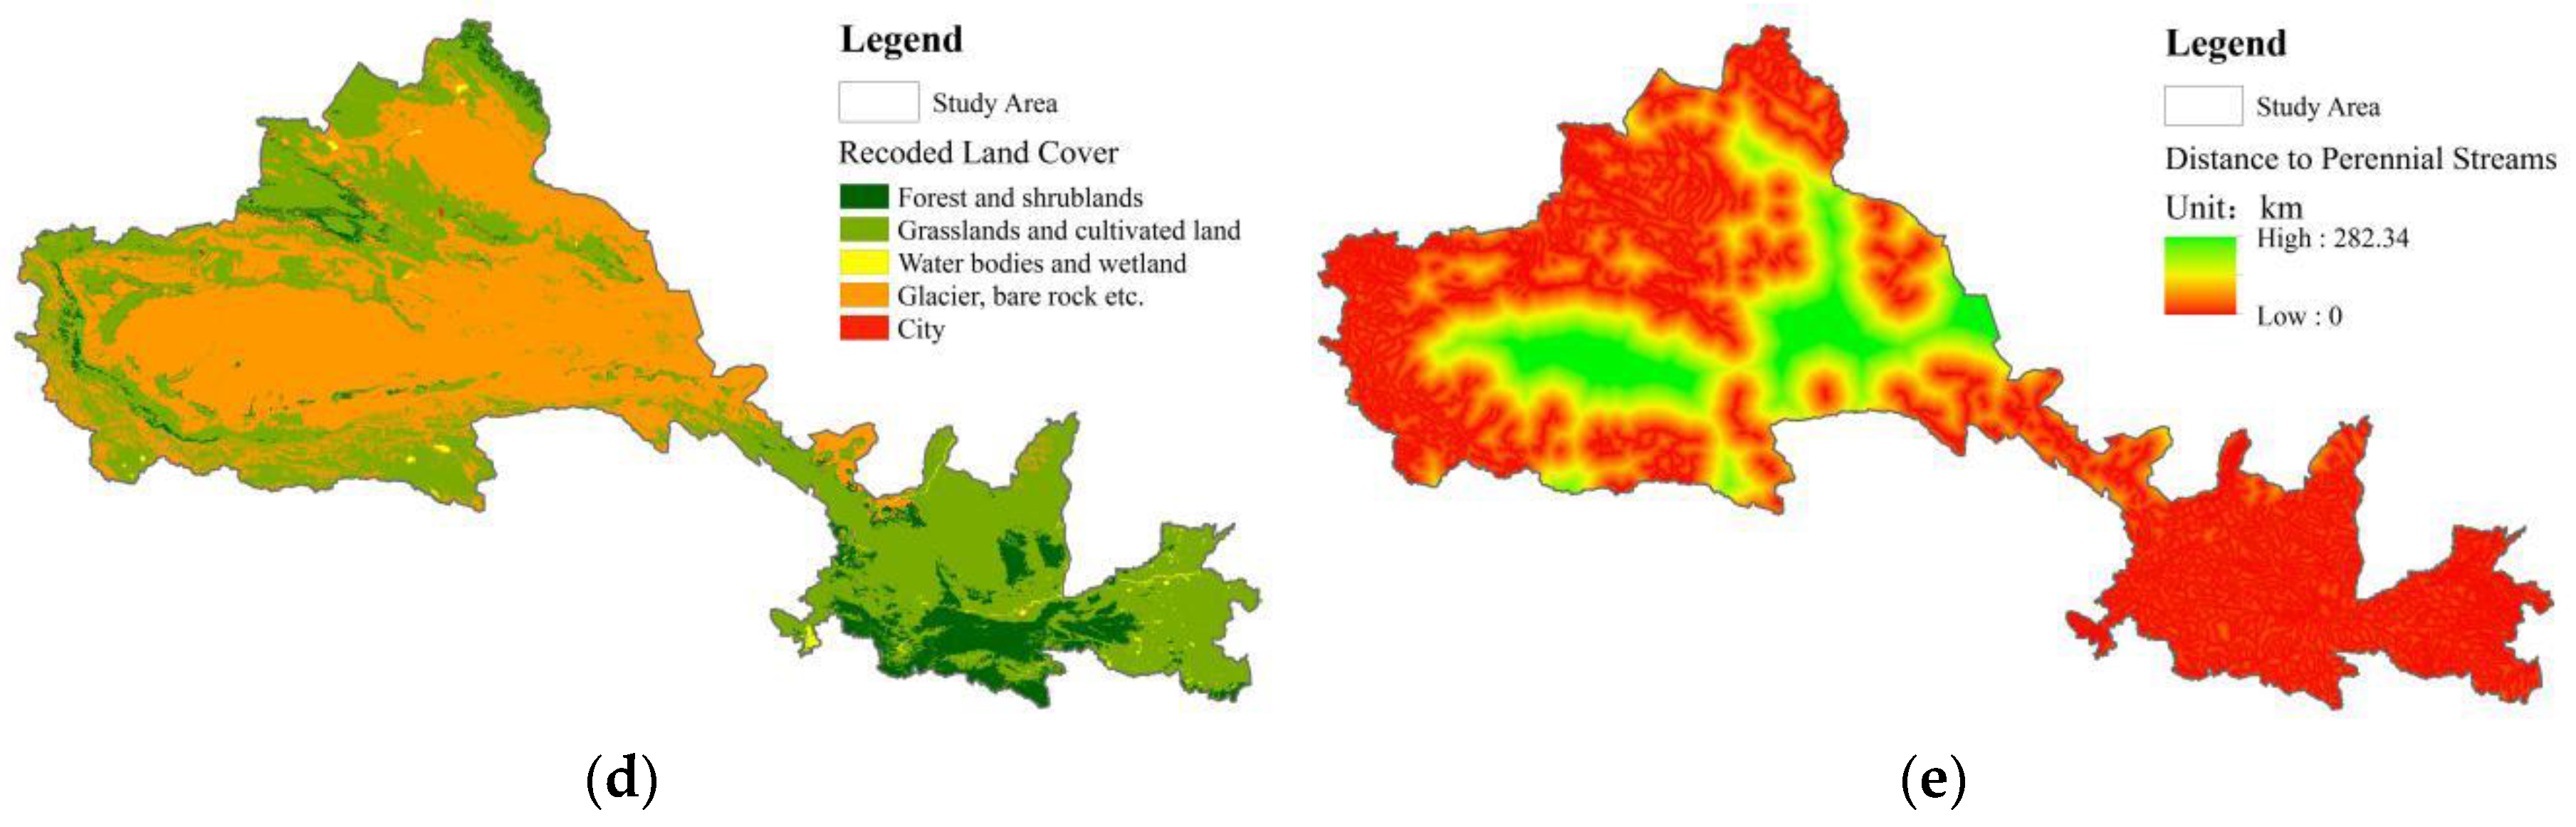
- Five land cover products, including the International Geosphere Biosphere Programme (IGBP) global land cover dataset (IGBP-DISCover) Version 2 [32], global land cover for the year 2000 (GLC2000) [33], the University of Maryland (UMd) land cover dataset [34], the MODerate resolution Imaging Spectroradiometer (MODIS) global land cover [35,36], and the WESTDC land cover product 2.0, as well as soil classes based on the United Nations Food and Agriculture Organization (FAO90) from the Harmonized World Soil Database (HWSD), version 1.1, were provided by the Cold and Arid Regions Science Data Centre at Lanzhou, which maintains a web portal [37] to distribute these datasets and was the source for all the geographic information system (GIS) data layers used in this research. The 30-meter Global Land Cover Dataset (GL30) collected by the National Geomatics Centre of China and Map World [38] was also explored.
- Hydrology and administrative boundary data were extracted from 1:4,000,000 national GIS data. The intermittent and perennial stream lines from Diva data [39] were also used to analyse the impact of water on site distribution.
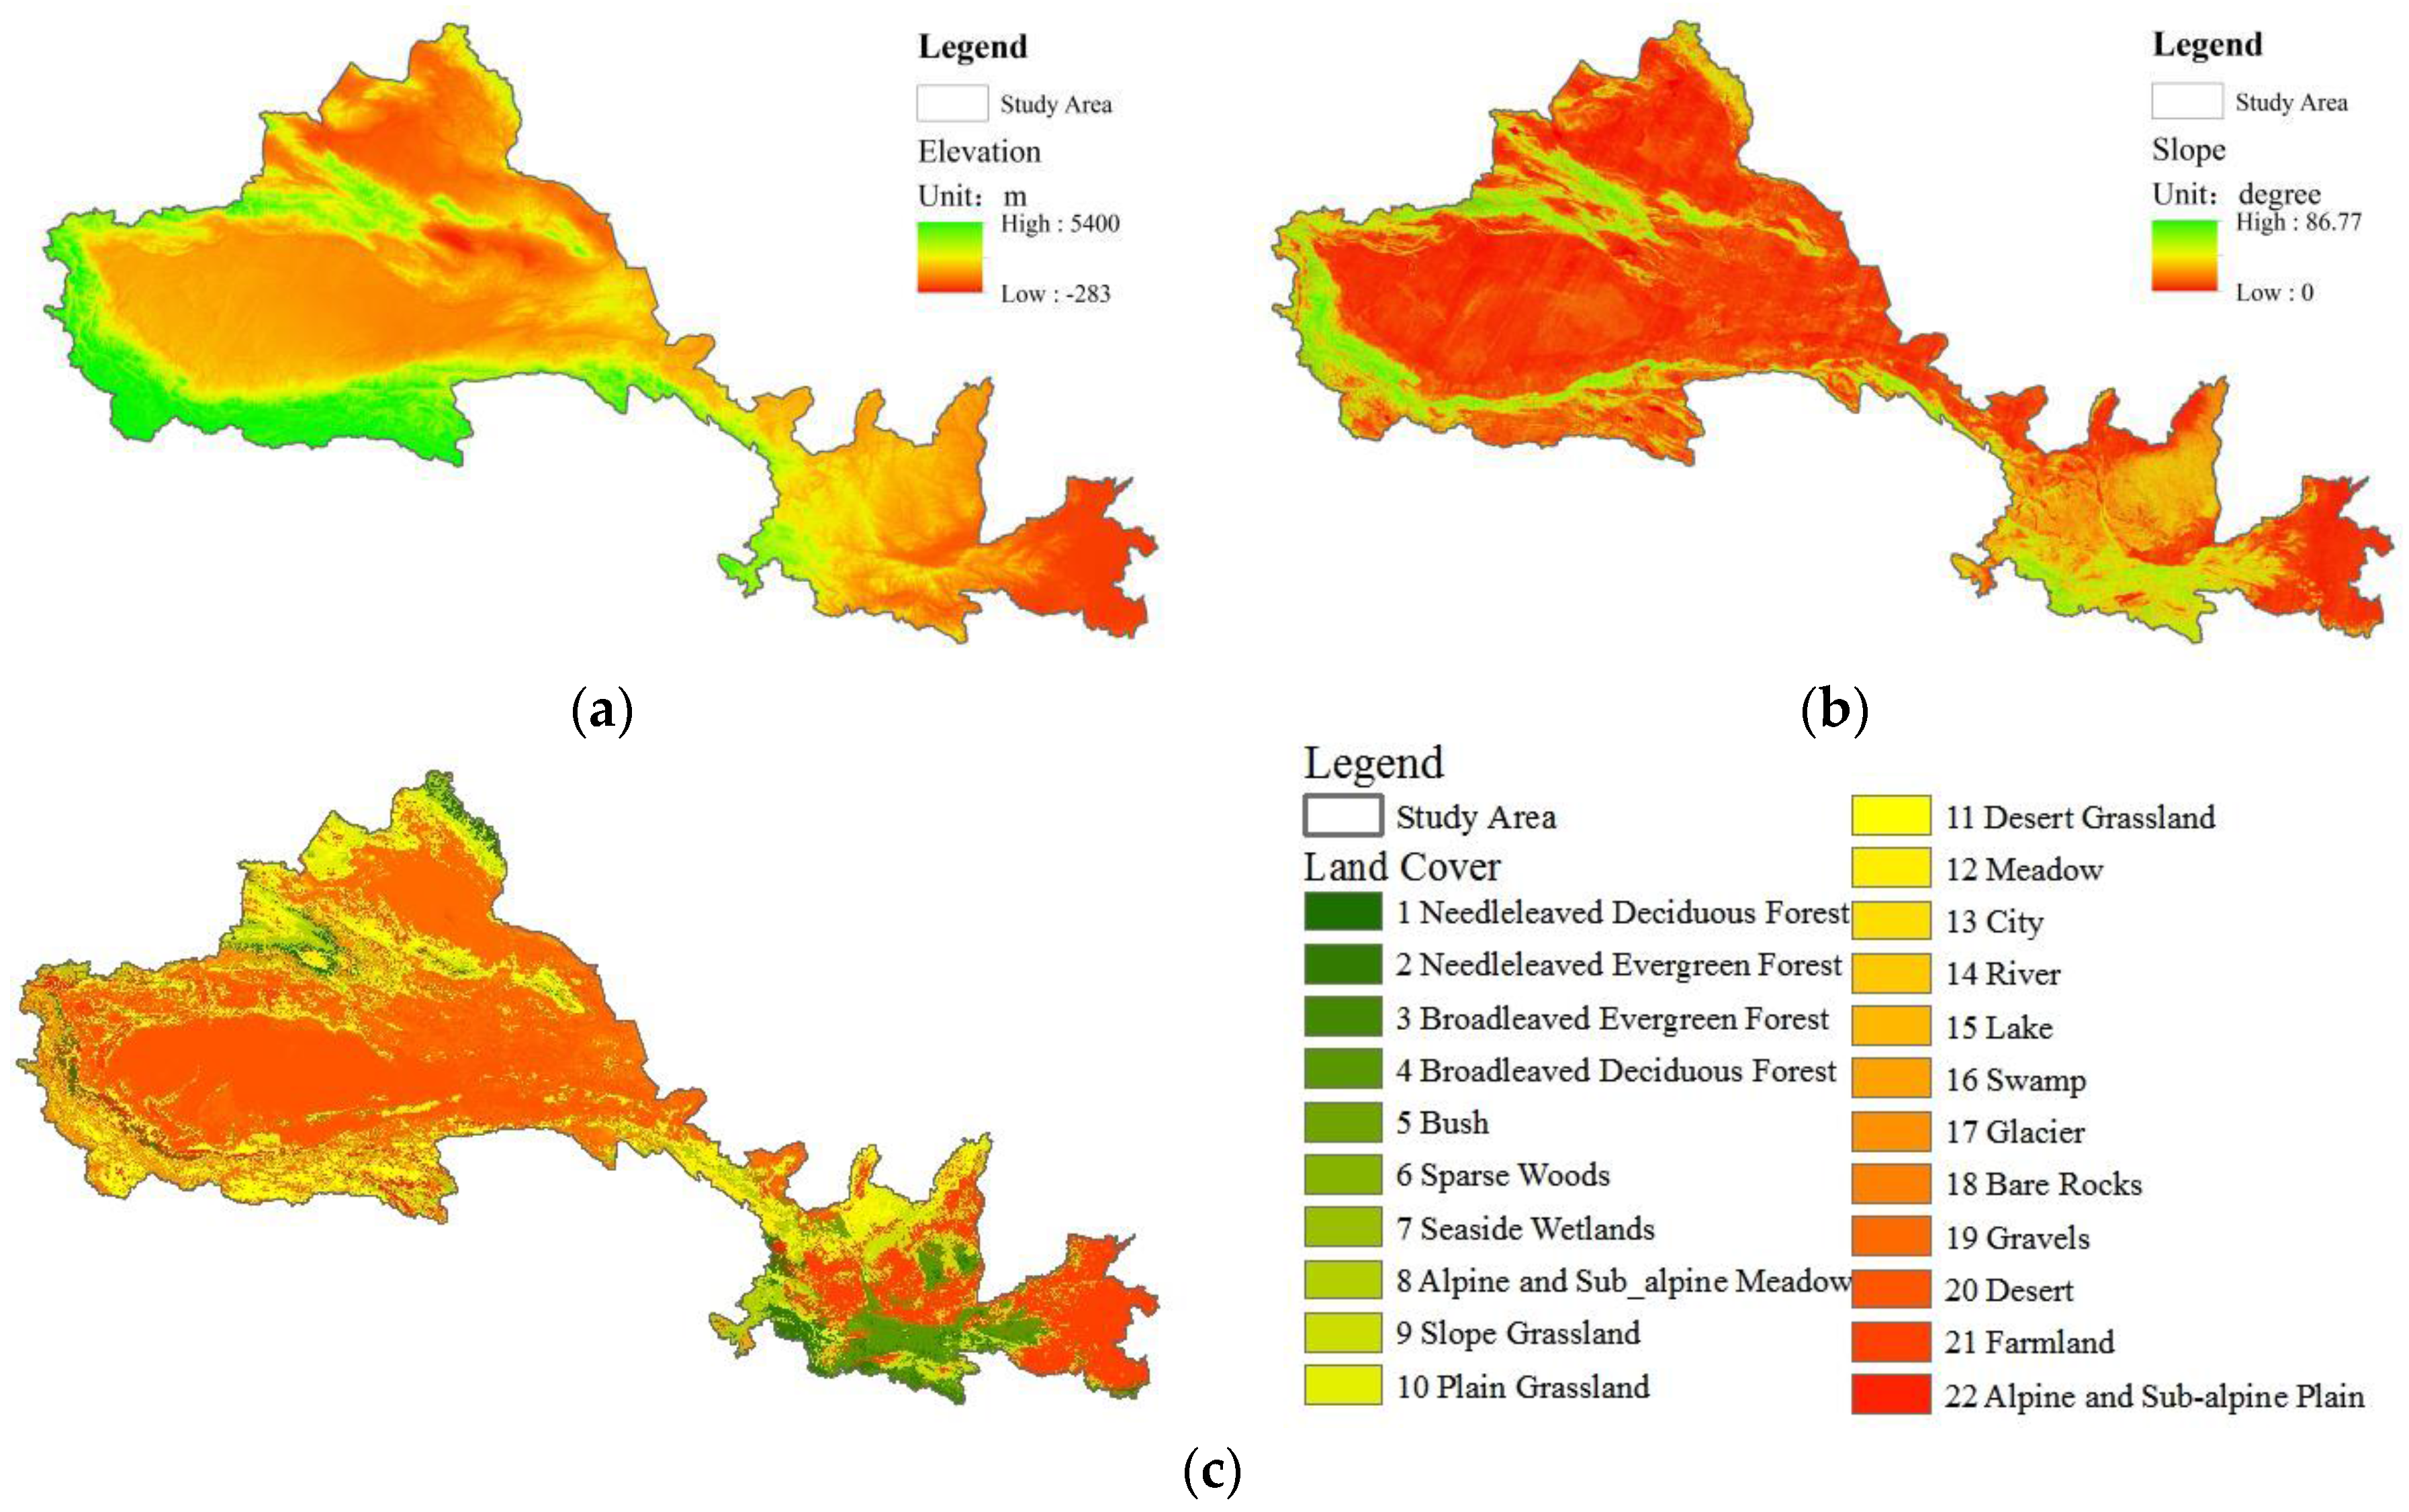
- Advanced Spaceborne Thermal Emission and Reflection Radiometer Global Digital Elevation Model version 2 (ASTER GDEMV2) [40] data for the study area were also obtained and applied to extract terrain-independent variables, such as elevation, slope, aspect, curvature, and trend surface data to calculate water flow distances.
- The landform type and Average annual precipitation data set were applied to analyse the pattern of the frontier passes and provided by Data Centre for Resources and Environmental Sciences, Chinese Academy of Sciences (RESDC) [41].
2.2.2. Archaeological Data
2.3. Method
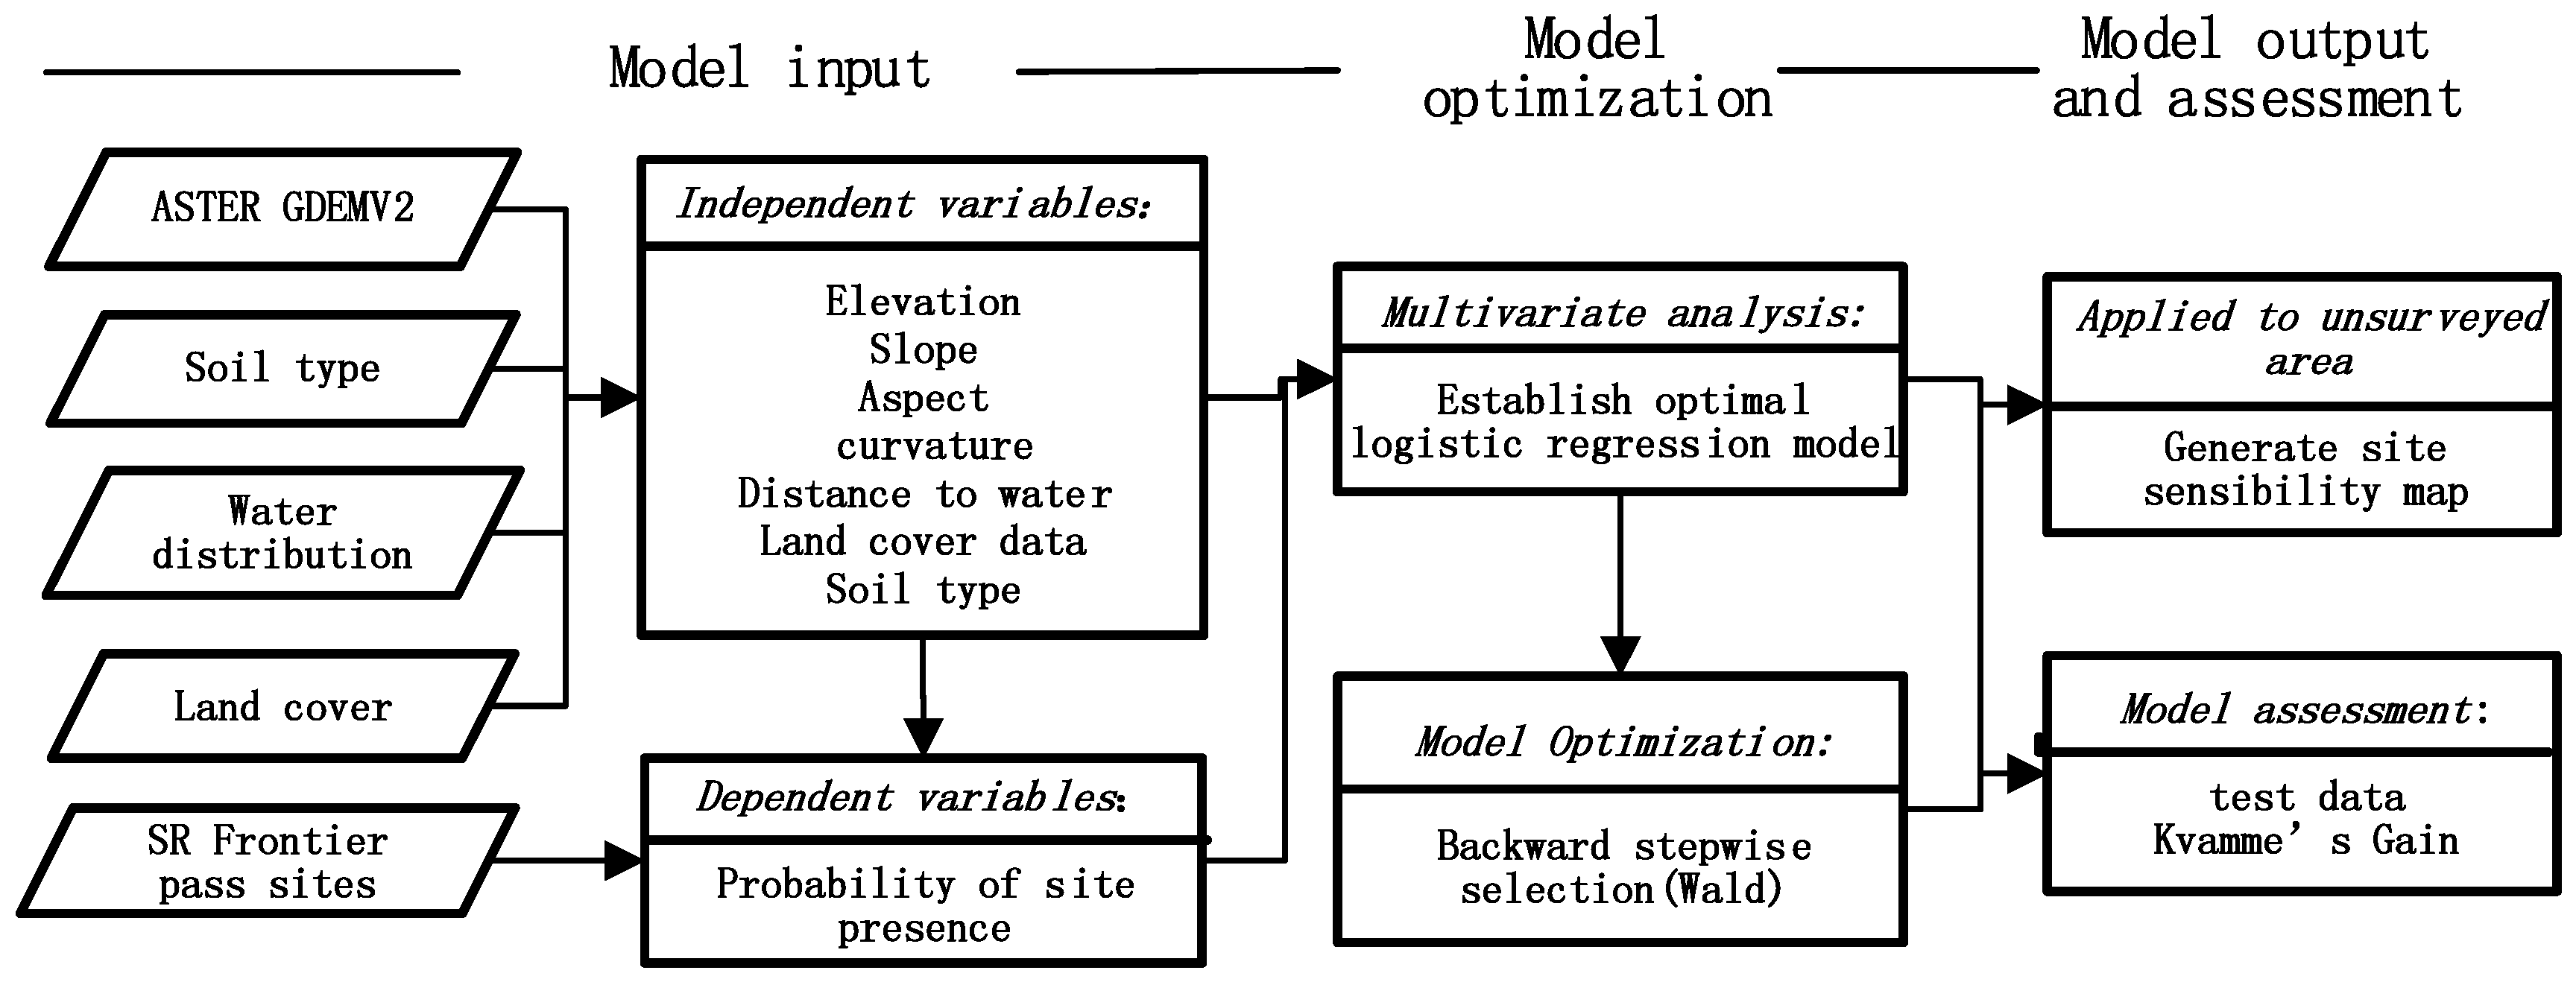
2.3.1. Binary Logistic Regression (BLR) Predictive Model
2.3.2. Model Variables
2.3.3. Model Optimization
2.3.4. Model Assessment
3. Results
3.1. Model Optimization Result
3.2. Site Sensibility Map
3.3. Model Assessment
4. Discussion
4.1. Spatial-Temporal Scale and Model Reliability Analysis
4.2. Contribution Factor Analysis
4.3. Pattern Analysis of CNSR Frontier Pass Distribution
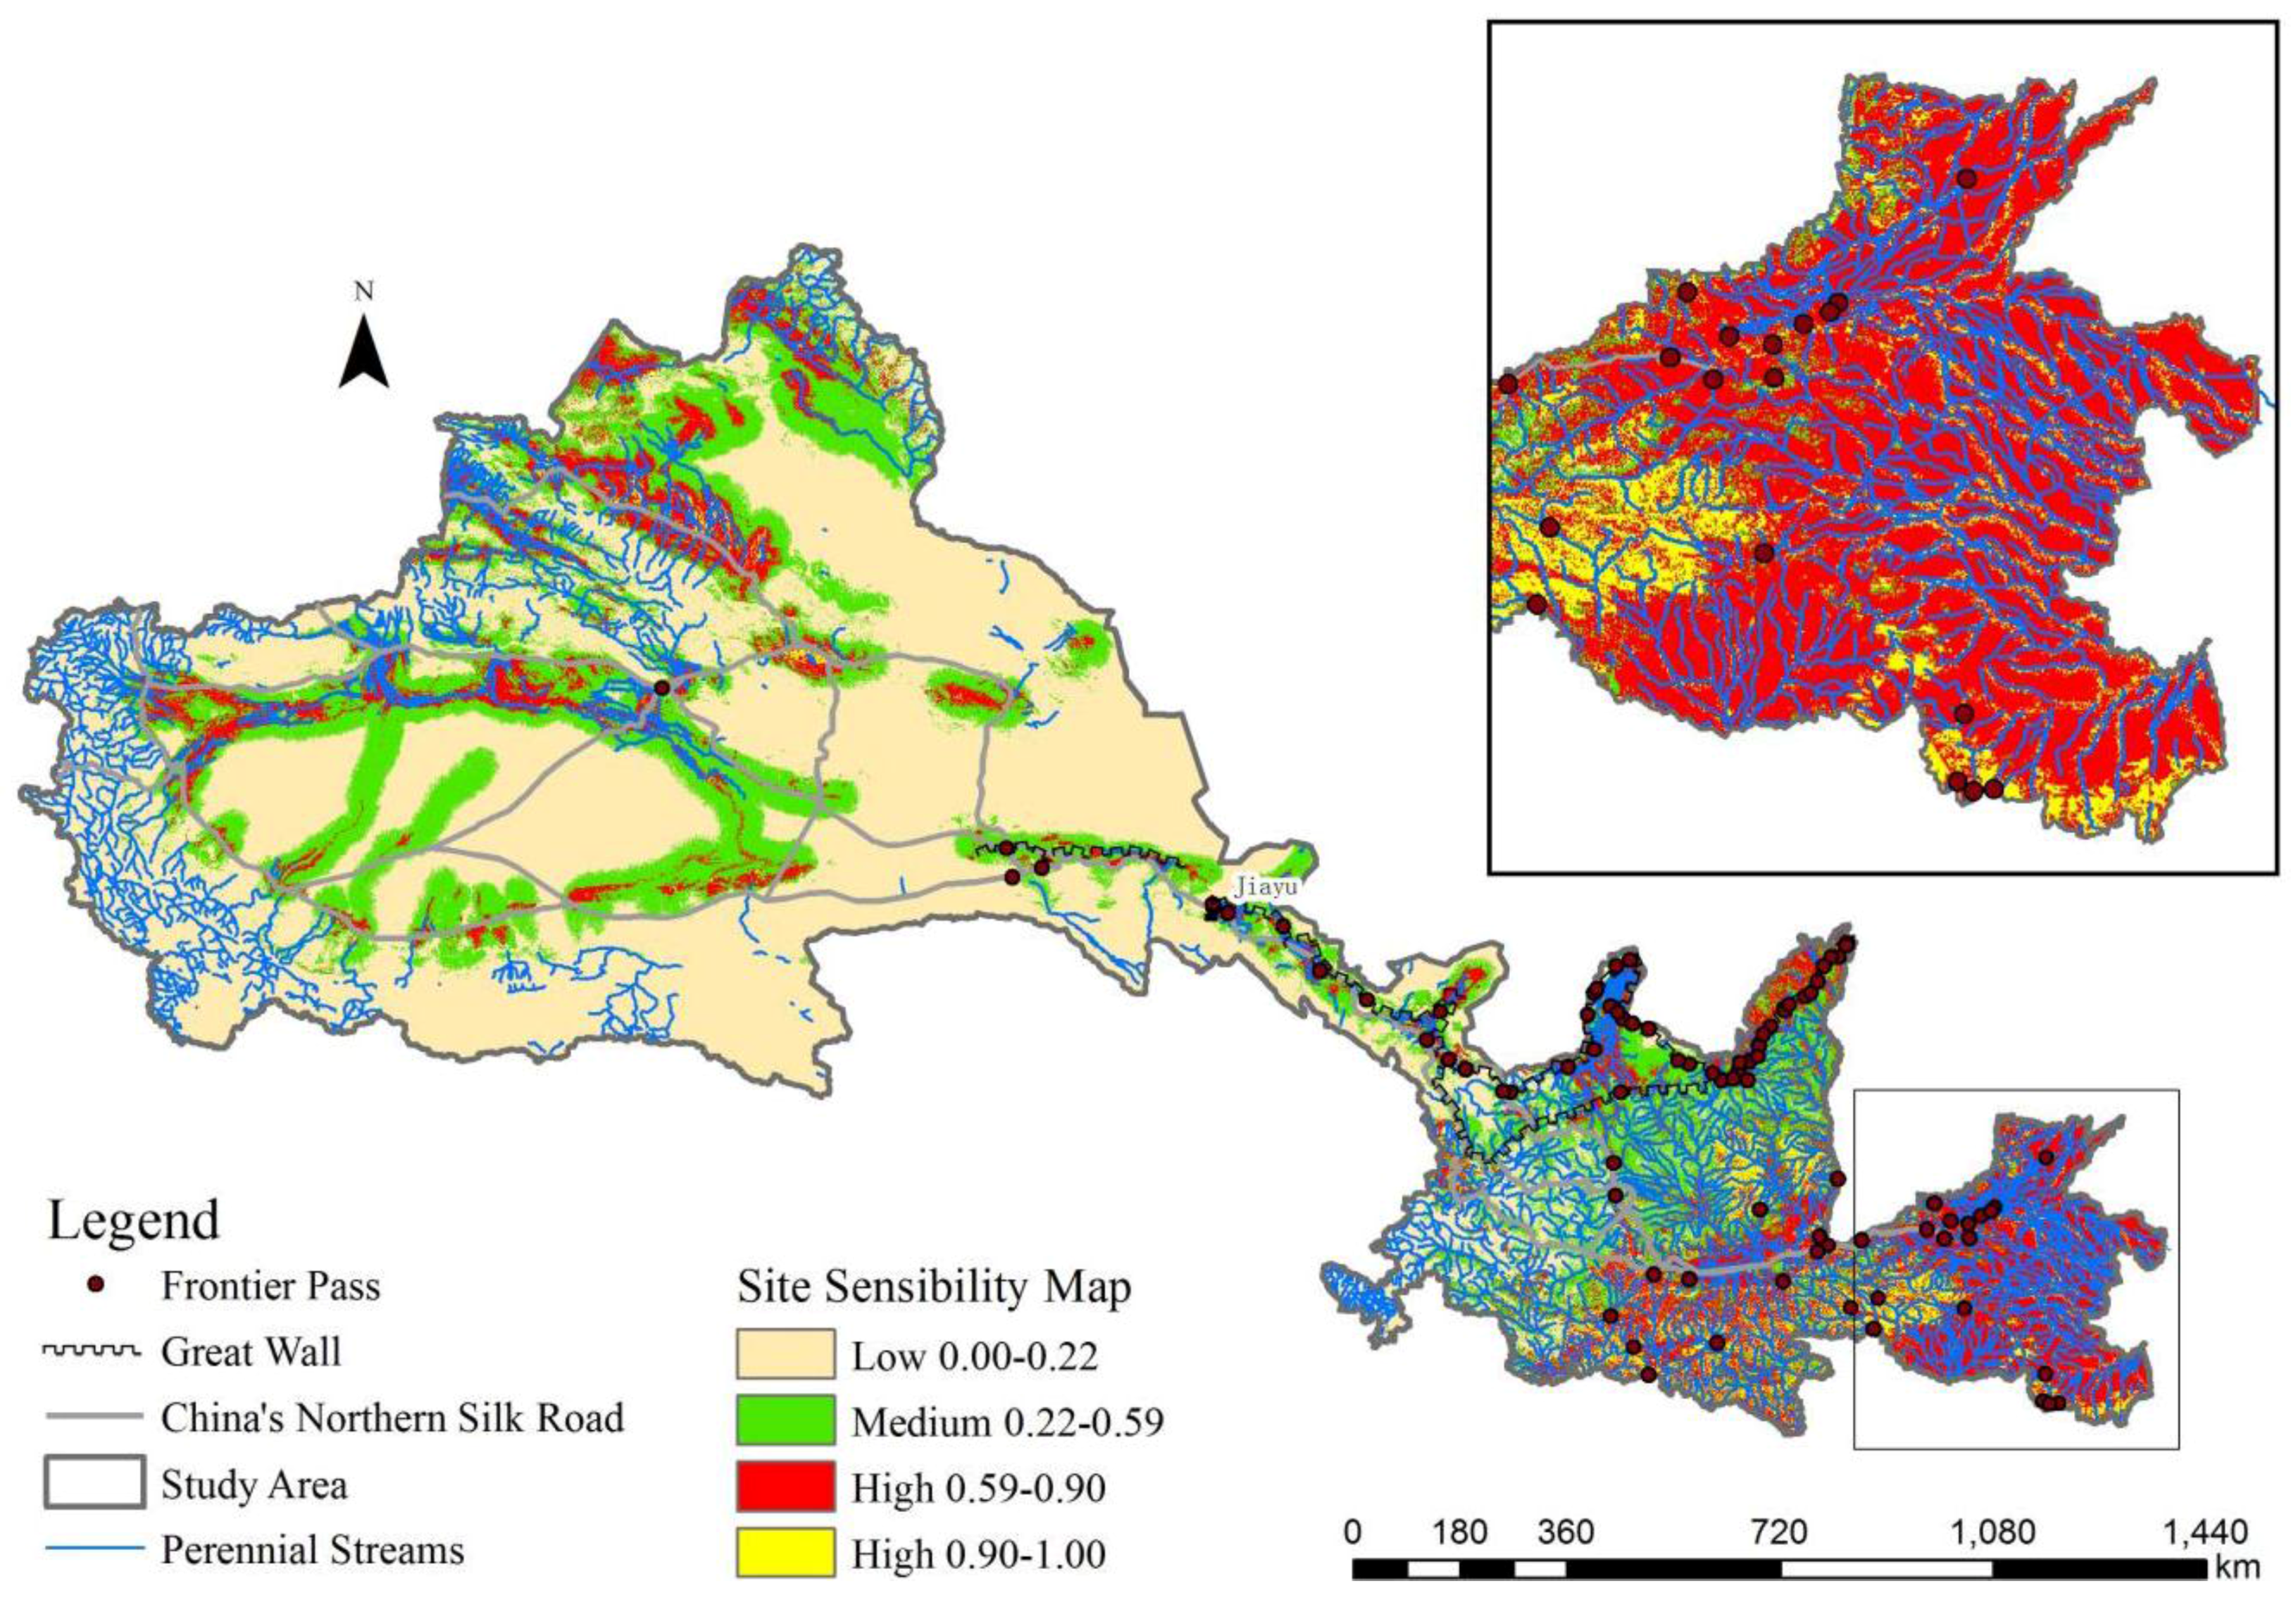
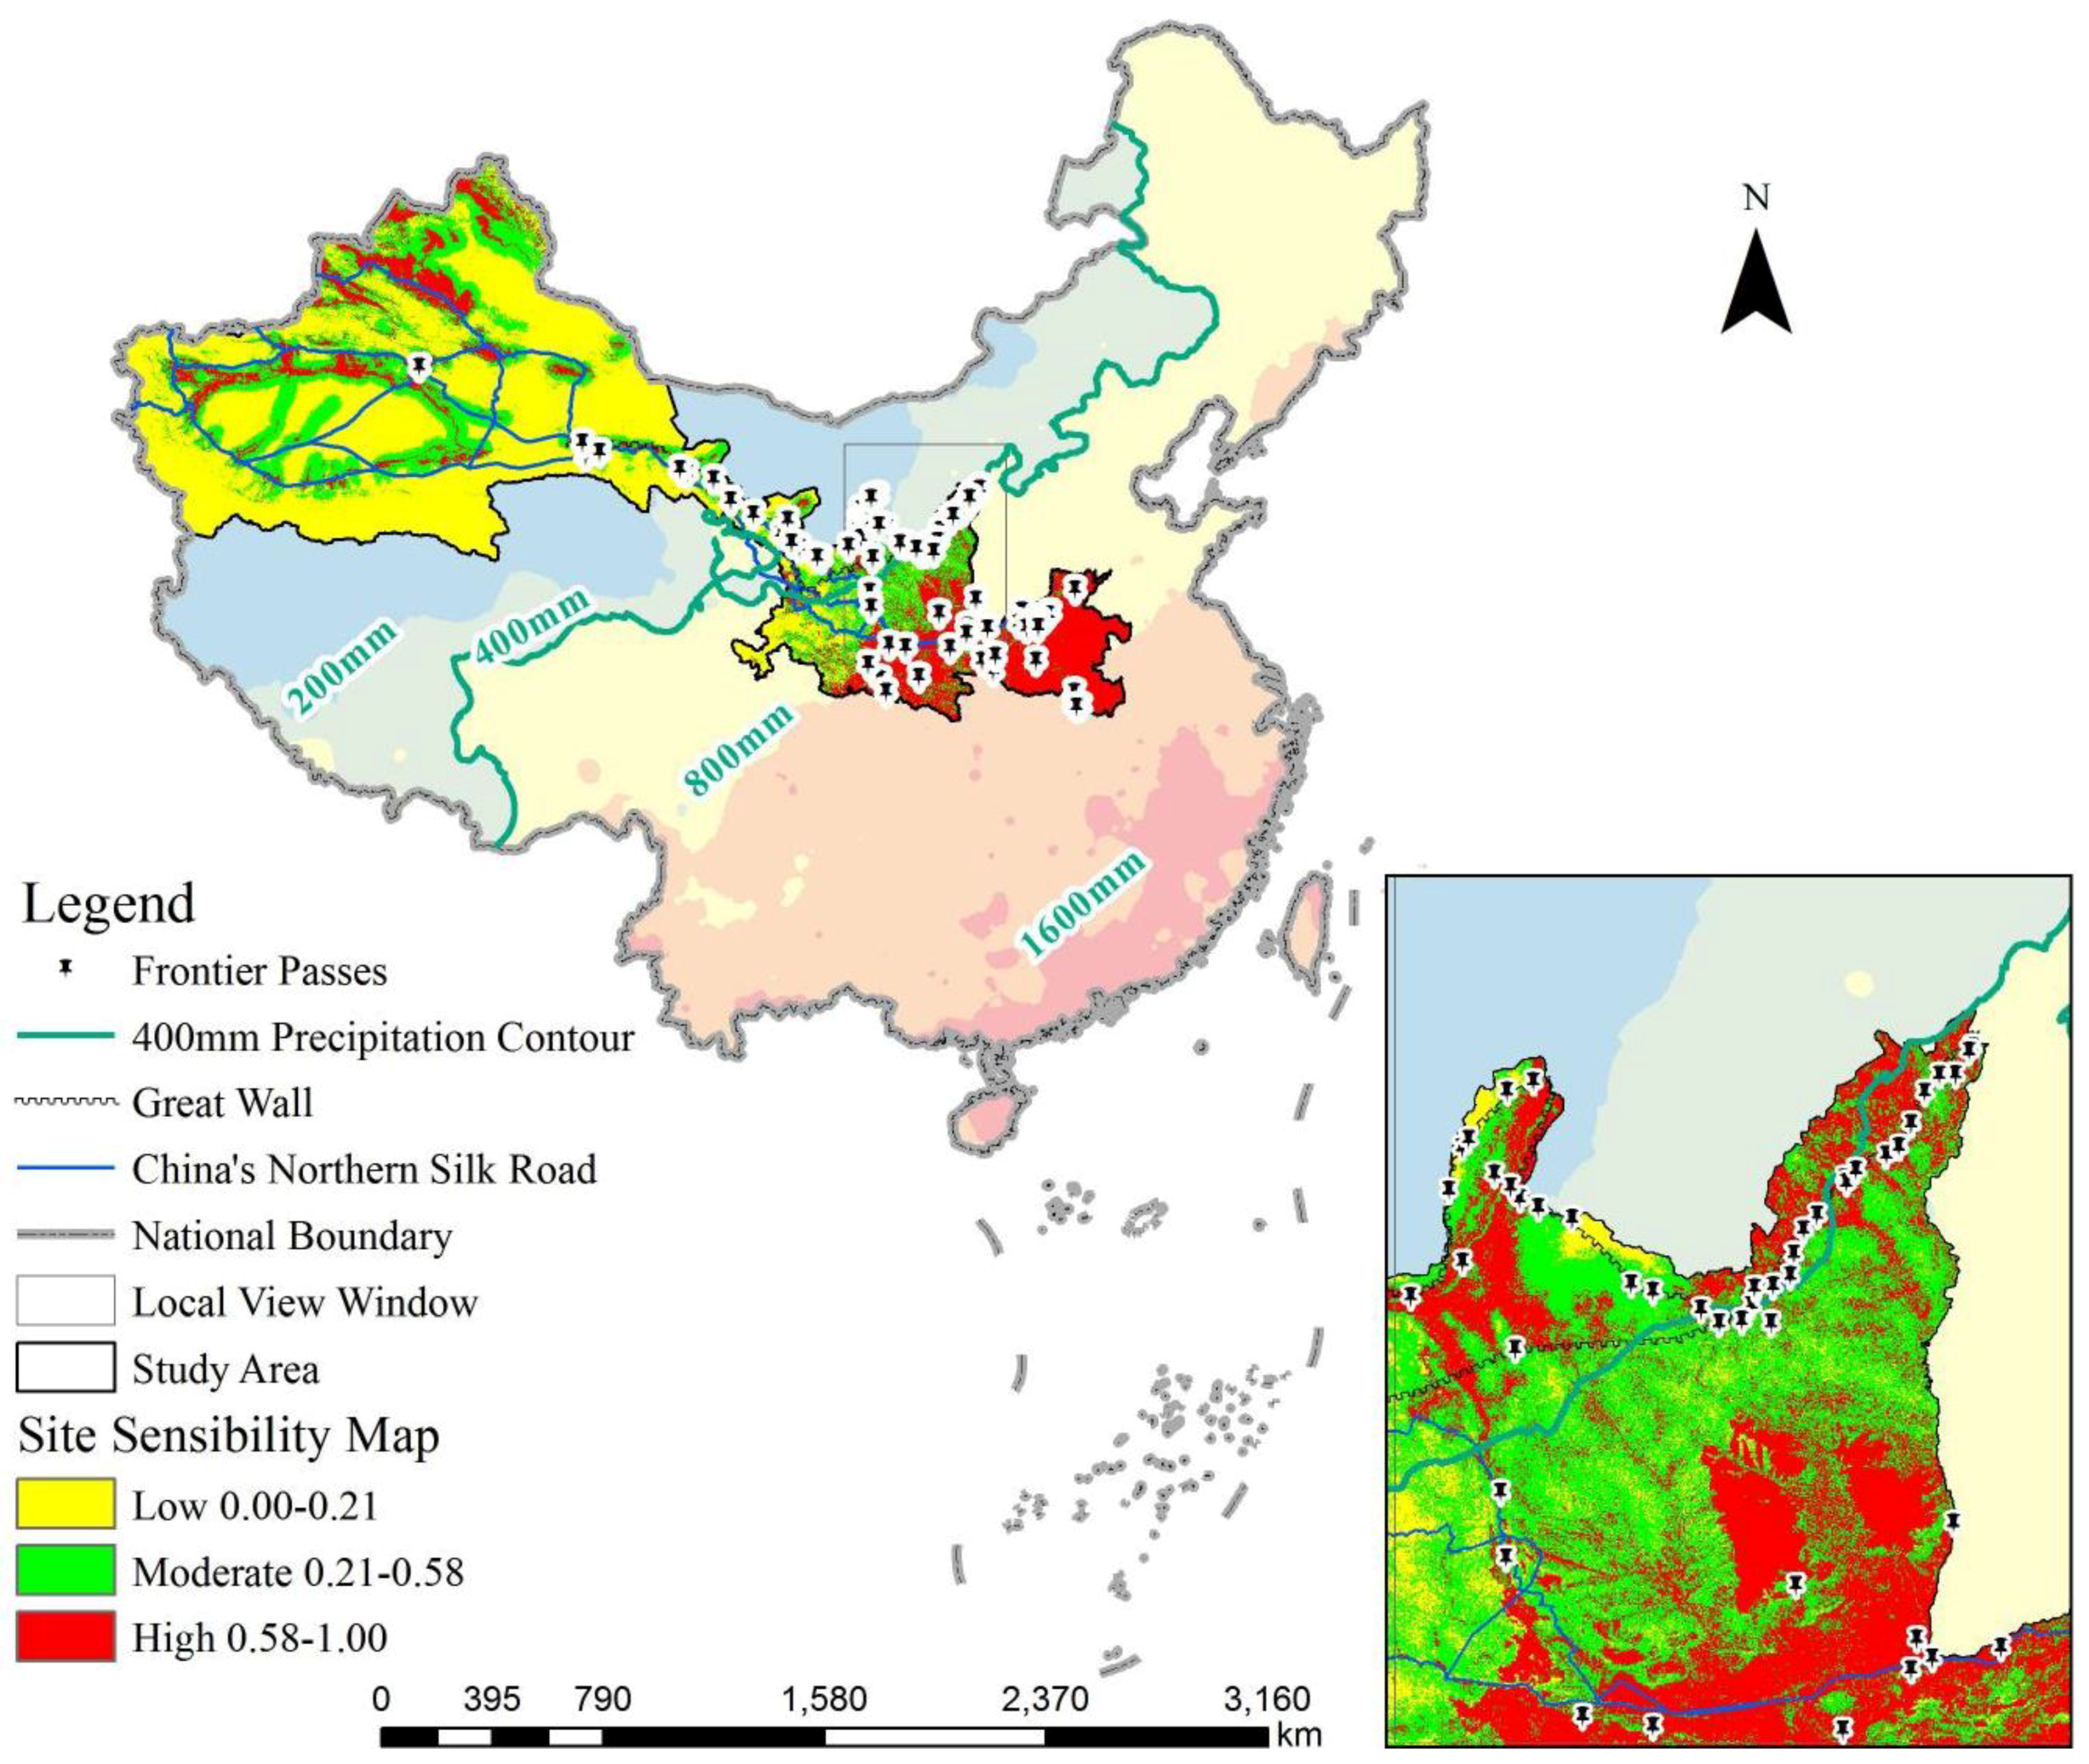
- According to the site sensibility map in Figure 4, the distribution of CNSR frontier passes has clustering characteristics: the high site probability region is mainly located in the east and north, and the low probability region is mainly in the west or south with the division overlapped with the average annual precipitation of 400 mm. These characteristics are consistent with the pass site distribution; eastern is dense and western is rare. The pass-dense region is also called “Guanzhong” or “Guannei” and belonged to the territory controlled by most ancient Chinese dynasties. Otherwise, it is interesting to note that the Great Wall frontier pass line nearly overlaps the division of precipitation of 400 mm in Shaanxi province as shown in the local view window of Figure 8. This may be because these Great Wall frontier passes were fortifications that protected the more livable central plains from the nomadic tribes, particularly from attacks by the Huns.
- Although passes are rare in the western part, only one site in Xinjiang Uyghur Autonomous Region and four sites west of Jiayu Pass, and in the vicinity of the Great Wall or the Silk Road, were not used as model inputs either. The areas with high and moderate probability in the sensibility map are spatially overlapped with the Han Great Wall section (from Yumen pass to Jiayu pass) and with three western parts of the CNSR routes, as shown in Figure 4. This result demonstrated that the improved BLR model was able to reveal the spatial correlation characteristics of frontier passes and the Great Wall, and could be used to reconstruct ancient trade routes.
5. Conclusions
- APMs can be used as a pattern tool for macro-scale site distribution and a temporal-spatial scale can be imported into the APMs [57,58]. An improved BLR model with spatial-scale optimization was successfully constructed and validated to analyze the spatial distribution of CNSR frontier passes in this study. The high probability areas identified through the study were helpful for further archaeological interpretation and archaeological validation.
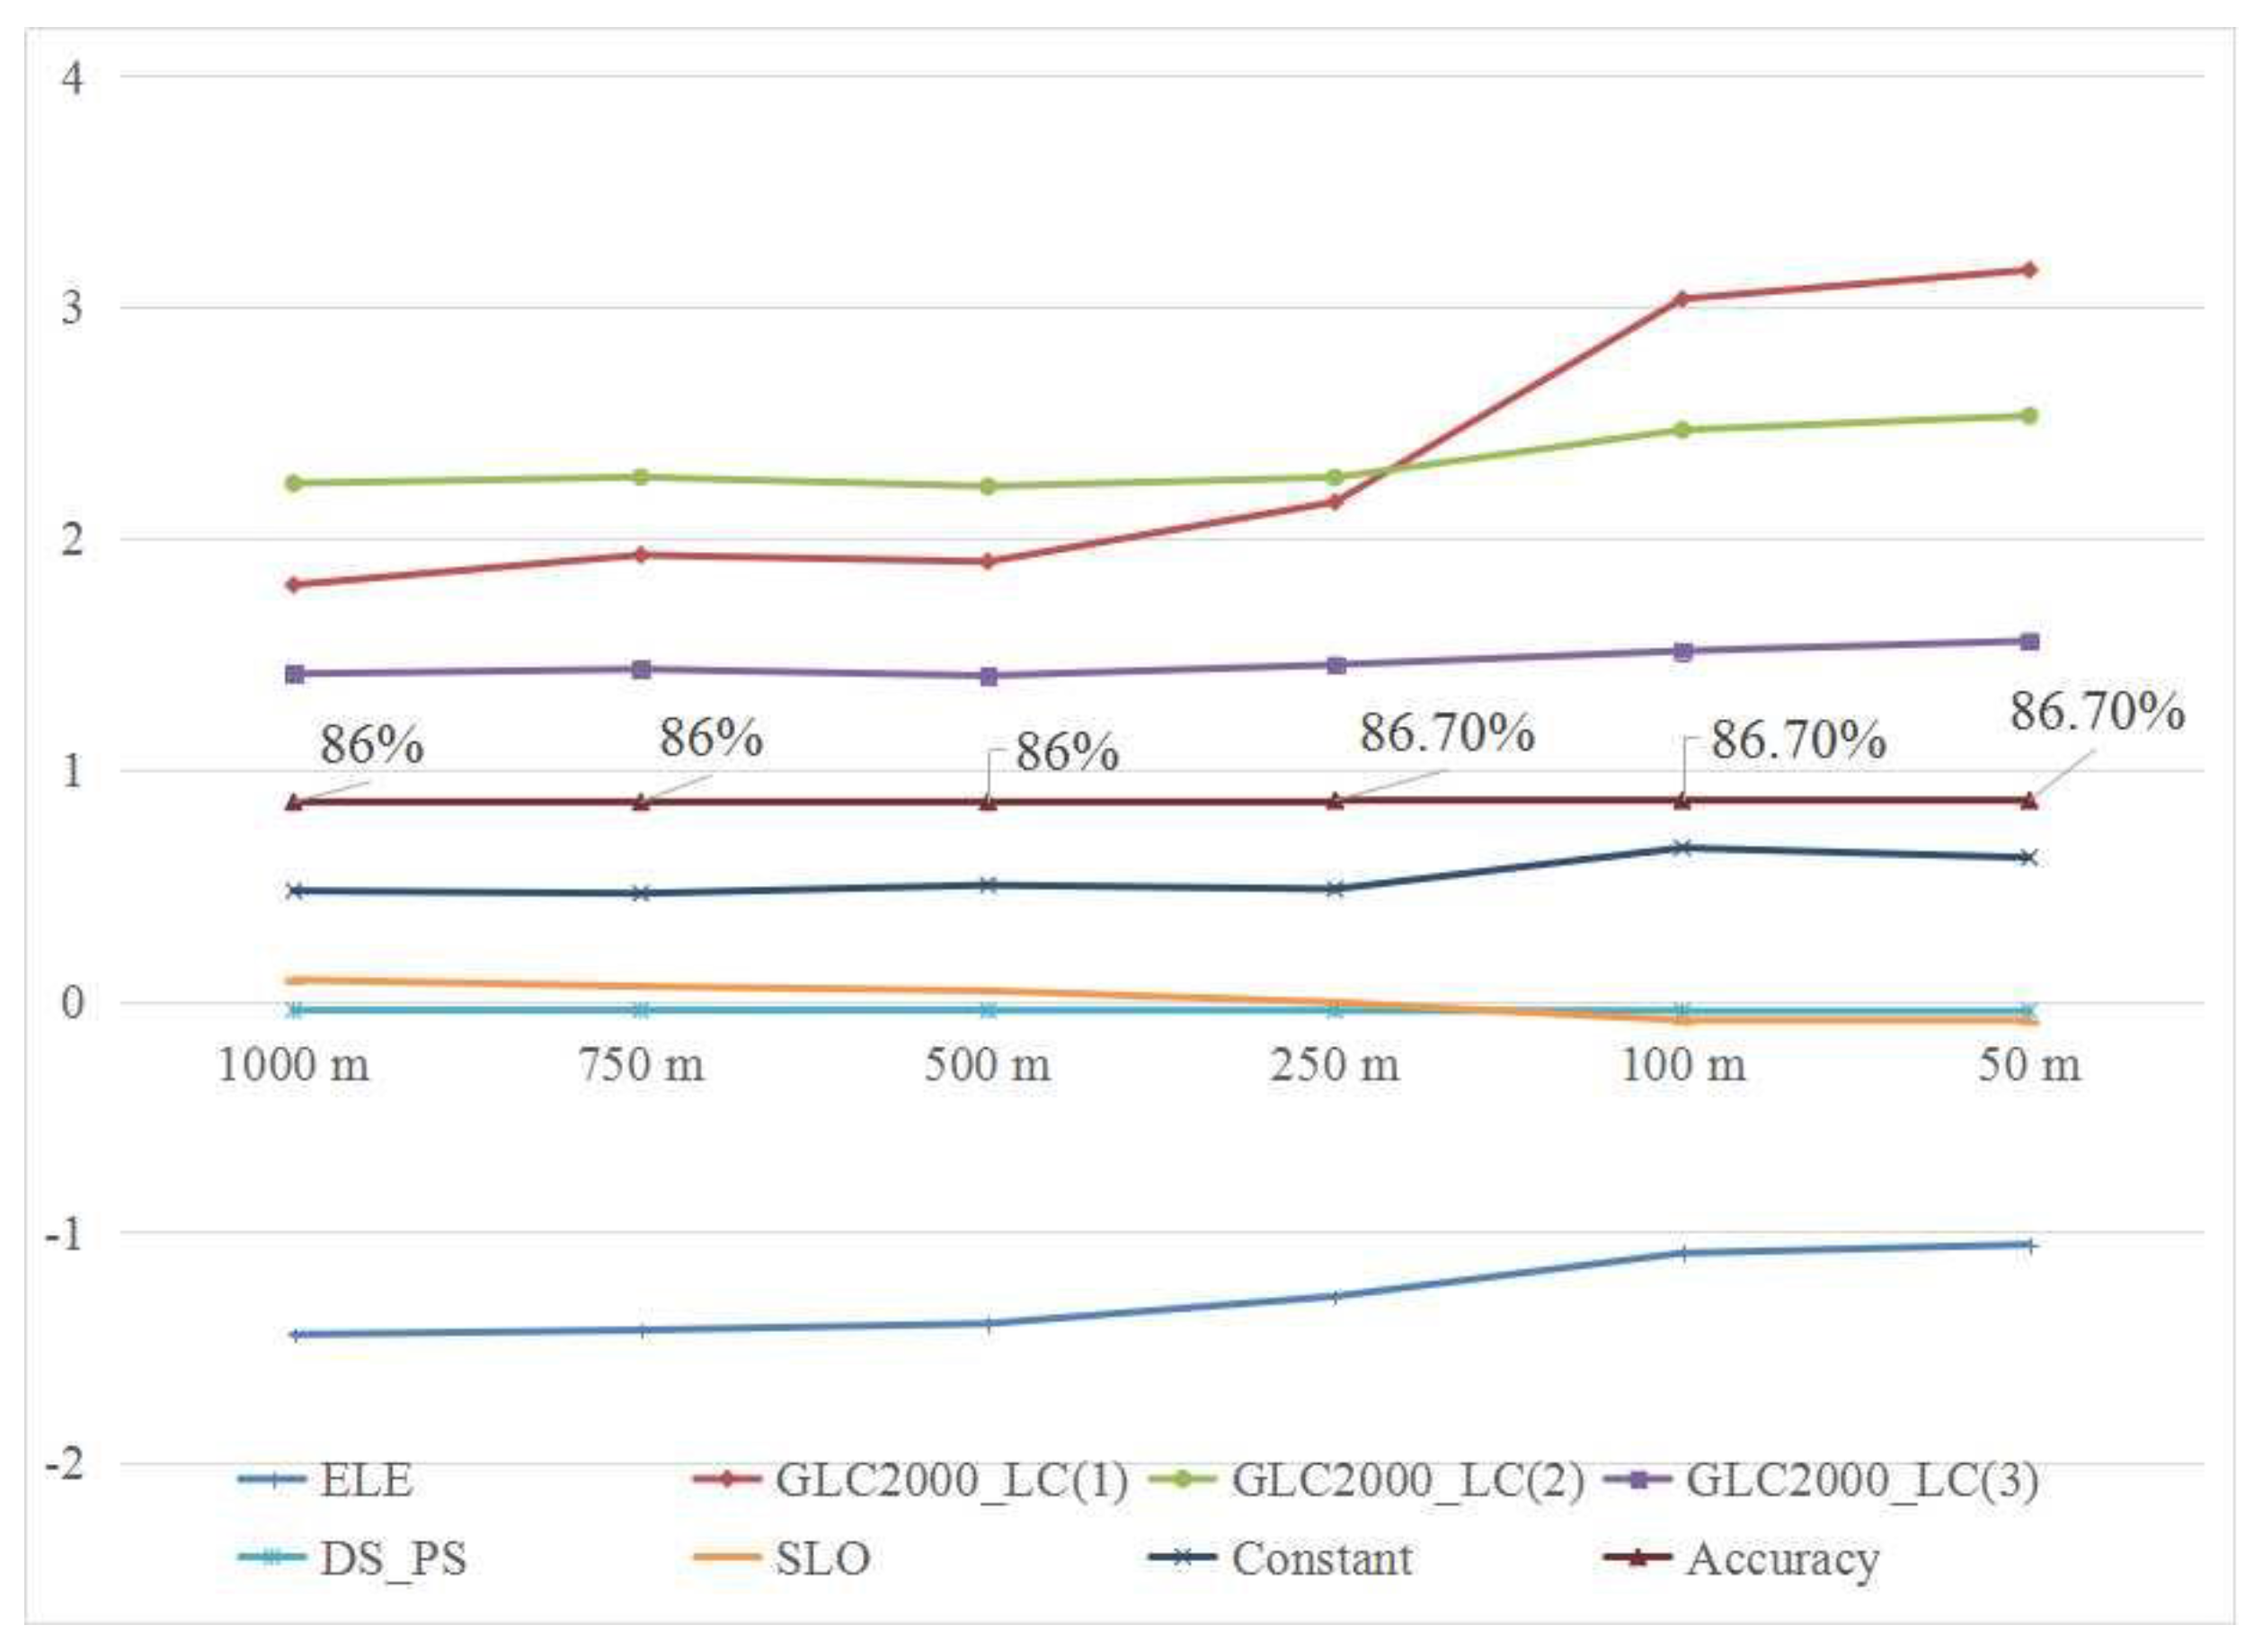
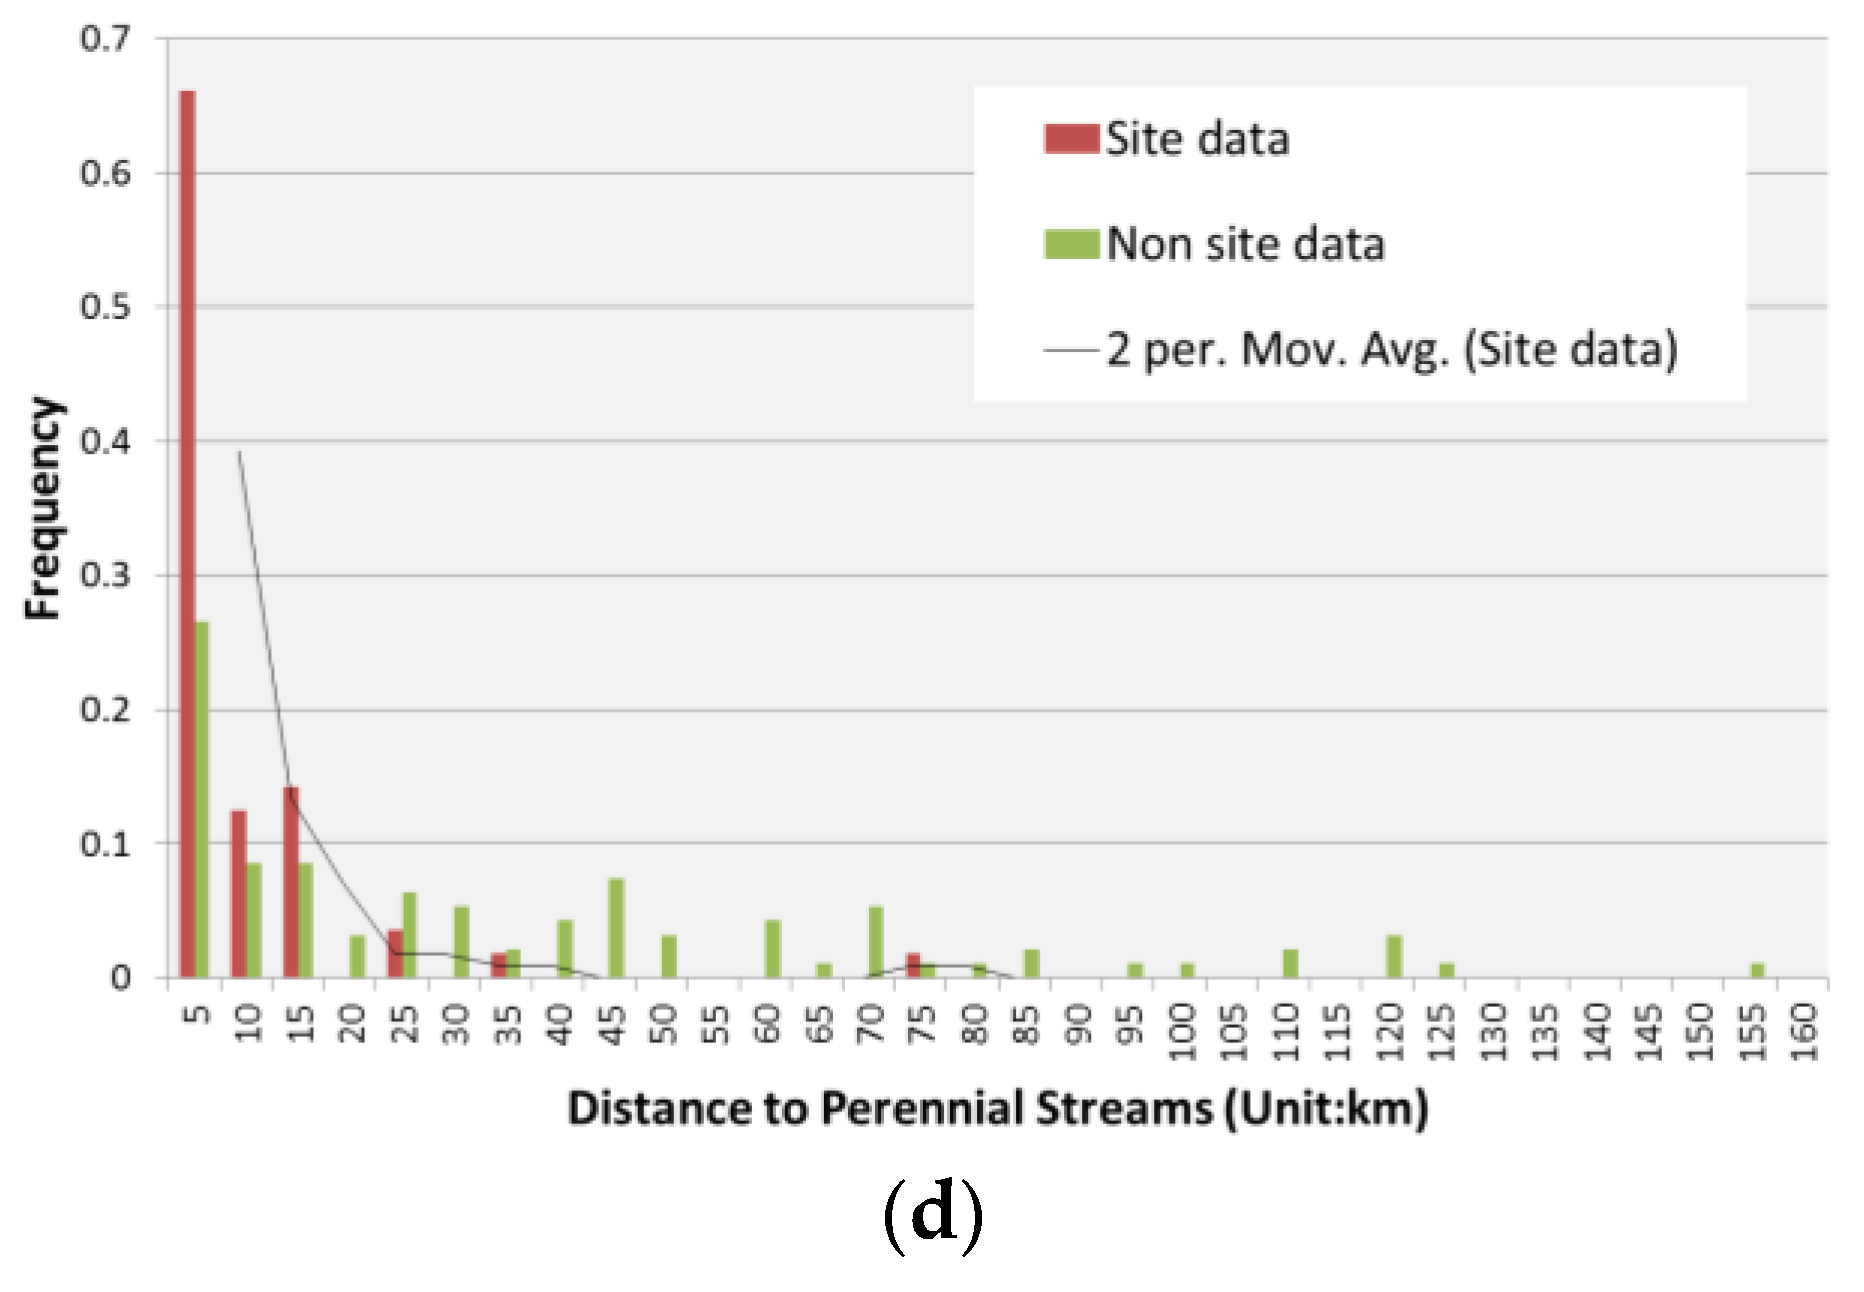
- Through spatial-temporal analysis, the best spatial scale should be considered and the best parcel size selection varies with the stability of the variables. Selecting resources that change slowly, such as perennial streams connected with site locations, is helpful in reconstructing ancient environments using modern data. The best scale spatial for the terrain variables and the non-terrain variables are 50 m and 1000 m, respectively.
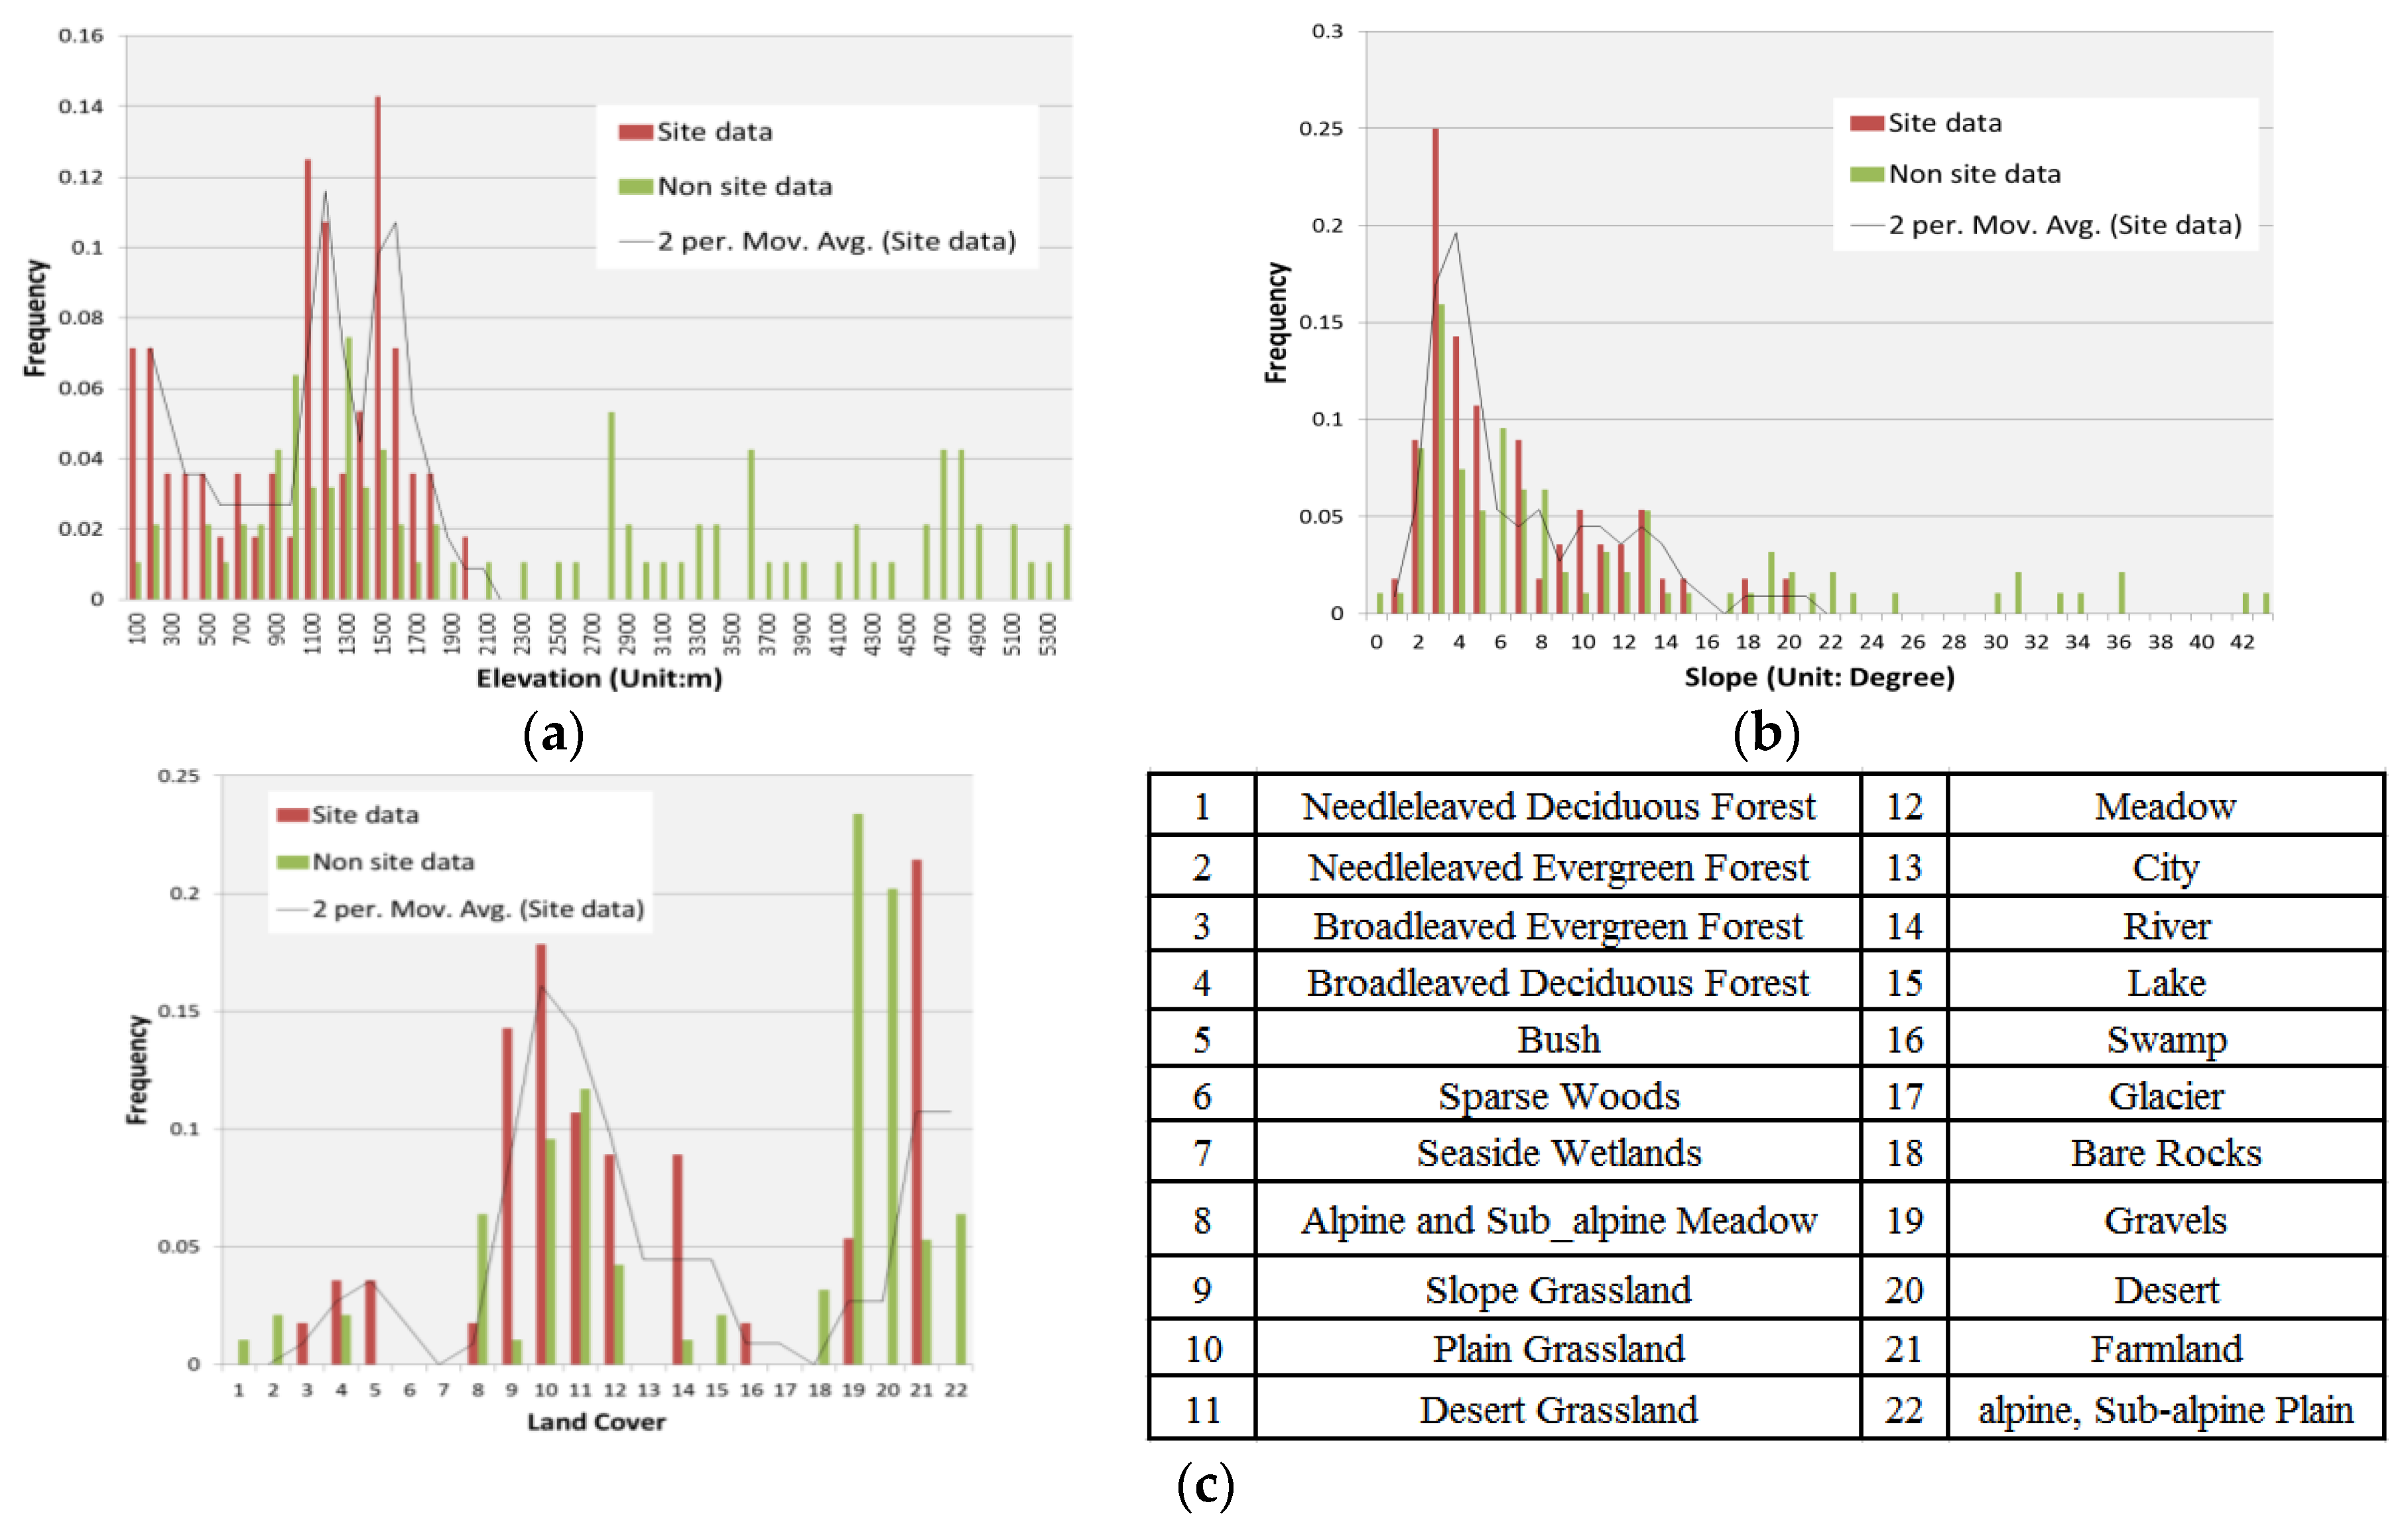
- Based on the variable selection, the elevation, slope, land cover, and distances to perennial streams were identified as the independent variables used to construct the model. An assessment of the model from the sample data and Kvamme’s gain statistics verified that the predictive model can effectively identify regions with a high probability of pass site occurrences, and it is able to reveal correlations between the pass sites and natural proxies.
- The distribution of CNSR frontier passes has clustering characteristics; the high probability area was mainly located in the east, and the division between the low and moderate-to-high areas coincides with the 400 mm precipitation contour. In the site sensibility map, the high and medium probability areas cover the Great Wall and the CNSR routes, especially the western parts. The predictive model for archaeological sites was shown to be helpful for analysing the spatial distribution pattern of CNSR pass sites used for both military defense systems and as trade control stations.
Acknowledgments
Author Contributions
Conflicts of Interest
References
- Zhao, C.; Zhang, C. Military Remains of the Silk Road from the Perspective of Archaeology. Cult. Relics 2016, 2, 73–80. (In Chinese) [Google Scholar] [CrossRef]
- Von Richthofen, F. China, Ergebnisse Eigner Reisen und Darauf Gegründeter Studien (China: The Results of My Travels and the Studies Based Thereon), 1st ed.; Dietrich Reimer: Berlin, German, 1877. [Google Scholar]
- Daniel, C.W. Richthofen’s “Silk Roads”: Toward the Archaeology of a Concept. Silk Road 2007, 5, 1–10. [Google Scholar]
- Elisseeff, V. The Silk Roads: Highways of Culture and Commerce; UNESCO Publishing/Berghahn Books: New York, NY, USA, 2001. [Google Scholar]
- Li, S.; Liang, R. The Great Wall-Shaanxi, Ningxia, Gansu; China Travel & Tourism Press: Beijing, China, 2008. (In Chinese) [Google Scholar]
- UNESCO World Heritage Sites. “The Great Wall”. Available online: http://whc.unesco.org/en/list/438/ (accessed on 20 December 2017).
- UNESCO World Heritage Sites. “Silk Roads: The Routes Network of Chang’an-Tianshan Corridor”. Available online: http://whc.unesco.org/en/list/1442/ (accessed on 20 December 2017).
- Zhang, M. On the Territory of the Ancient Silk Road Pingchuan District Ferry and the Ruins of the Ancient City. Silk Road 2015, 291, 27–29. [Google Scholar]
- Chen, F.; Masini, N.; Liu, J.; You, J.; Lasaponara, R. Multi-Frequency Satellite Radar Imaging of Cultural Heritage: The Case Studies of the Yumen Frontier Pass and Niya Ruins in the Western Regions of the Silk Road Corridor. Int. J. Digit. Earth 2016, 9, 1224–1241. [Google Scholar] [CrossRef]
- Chen, F.; Lasaponara, R.; Masini, N. An overview of Satellite Synthetic Aperture Radar Remote Sensing Inarchaeology: From Site Detection to Monitoring. J. Cult. Herit. 2015, 23, 5–11. [Google Scholar] [CrossRef]
- Luo, L.; Wang, X.; Liu, C.; Guo, H.; Du, X. Integrated RS, GIS and GPS Approaches To Archaeological Prospecting in the Hexi Corridor, NW China: A Case Study of the Royal Road to Ancient Dunhuang. J. Archaeol. Sci. 2014, 50, 178–190. [Google Scholar] [CrossRef]
- Verhagen, P.; Whitley, T.G. Integrating Archaeological Theory and Predictive Modeling: A Live Report From the Scene. J. Archaeol. Method Theory 2012, 19, 49–100. [Google Scholar] [CrossRef]
- Gao, L. Space-Time Explanation New Method-History, Present and Future of GIS Research in European and American Archaeology. Archaeology 1997, 89–95. [Google Scholar]
- Whitley, T.G. Archaeological Simulation and the Testing Paradigm. In Uncertainty and Sensitivity Analysis in Archaeological Computational Modeling; Springer: Berlin, Germany, 2016; pp. 131–156. [Google Scholar]
- Mei, Q.; Xiong, X. Application of GIS in Archaeology. J. Zhejiang Wanli Univ. 2005, 18, 32–35. (In Chinese) [Google Scholar]
- Mcewan, D.G. Qualitative Landscape Theories and Archaeological Predictive Modelling—A Journey Through no Man’s Land? J. Archaeol. Method Theory 2012, 19, 526–547. [Google Scholar] [CrossRef]
- Bevan, A.; Wilson, A. Models of Settlement Hierarchy Based on Partial Evidence. J. Archaeol. Sci. 2013, 40, 2415–2427. [Google Scholar] [CrossRef]
- Danese, M.; Masini, N.; Biscione, M.; Lasaponara, R. Predictive Modeling for Preventive Archaeology: Overview and Case Study. Open Geosci. 2014, 6, 42–55. [Google Scholar] [CrossRef]
- Willey, G.R. Prehistoric Settlement Patterns in the Virú Valley, Peru; Bureau of American Ethnology, Bulletin: Washington, DC, USA, 1953.
- Vaughn, S.; Crawford, T. A Predictive Model of Archaeological Potential: An Example from Northwestern Belize. Appl. Geogr. 2009, 29, 542–555. [Google Scholar] [CrossRef]
- Carrer, F. An Ethnoarchaeological Inductive Model for Predicting Archaeological Site Location:A Case-Study of Pastoral Settlement Patterns in the Val di Fiemmeand Val di Sole (Trentino, Italian Alps). J. Anthropol. Archaeol. 2013, 32, 54–62. [Google Scholar] [CrossRef]
- Balla, A.; Pavlogeorgatos, G.; Tsiafakis, D.; Pavlidis, G. Locating Macedonian Tombs Using Predictive Modelling. J. Cult. Herit. 2013, 14, 403–410. [Google Scholar] [CrossRef]
- Oonk, S.; Spijker, J. A Supervised Machine-Learning Approach towards Geochemical Predictive Modelling in Archaeology. J. Archaeol. Sci. 2015, 59, 1–9. [Google Scholar] [CrossRef]
- Sharafi, S.; Fouladvand, S.; Simpson, I.; Alvarez, J. Application of pattern recognition in detection of buried archaeological sites based on analysing environmental variables, Khorramabad Plain, West Iran. J. Archaeol. Sci. Rep. 2016, 8, 206–215. [Google Scholar] [CrossRef]
- Vogel, S.; Märker, M.; Esposito, D.; Seiler, F. The Ancient Rural Settlement Structure in the Hinterland of Pompeii Inferred From Spatial Analysis and Predictive Modeling of Villae Rusticae. Geoarchaeology 2016, 31, 121–139. [Google Scholar] [CrossRef]
- Negre, J.; Munoz, F.; Lancelotti, C. Geostatistical Modelling of Chemical Residues on Archaeological Floors in the Presence of Barriers. J. Archaeol. Sci. 2016, 70, 91–101. [Google Scholar] [CrossRef]
- Ni, J. Predictive Model of Archaeological Sites in the Upper Reaches of the Shuhe River in Shandong. Process Geogr. 2009, 28, 489–493. (In Chinese) [Google Scholar]
- Peng, S.; Zhang, W.; Chen, D. Model Predictability of Archaeological Sites of the Dawenkou Culture in the Wensi River Basin. J. Taishan Univ. 2010, 32, 34–39. (In Chinese) [Google Scholar]
- Qiao, W.; Bi, S.; Wang, Q.; Guo, Y. Predictive model of archaeological sites of Longshan culture in Zhengzhou-Luoyang area. Sci. Surv. Mappin 2013, 38, 172–174, 181. (In Chinese) [Google Scholar]
- Dong, Z.; Jin, S. Prediction Research on Bohai Kingdom Ruins in Yanbian Area Based on the Logic Regression Model. J. Yanbian Univ. (Nat. Sci.) 2015, 41, 179–184. (In Chinese) [Google Scholar] [CrossRef]
- Tianditu Website. Available online: http://en.tianditu.com/ (accessed on 20 January 2018).
- Loveland, T.R.; Reed, B.C.; Brown, J.F.; Ohlen, D.O.; Zhu, Z.; Yang, L.; Merchant, J.W. Development of a Global Land Cover Characteristics Database and IGBP DISCover From 1 km AVHRR Data. Int. J. Remote Sens. 2000, 21, 1303–1330. [Google Scholar] [CrossRef]
- Bartholomé, E.; Belward, A.S. GLC2000: A New Approach to Global Land Cover Mapping From Earth Observation Data. Int. J. Remote Sens. 2005, 26, 1959–1977. [Google Scholar] [CrossRef]
- Hansen, M.C.; Defries, R.S.; Townshend, J.R.G.; Sohlberg, R. Global Land Cover Classification at 1 km Spatial Resolution Using a Classification Tree Approach. Int. J. Remote Sens. 2000, 21, 1331–1364. [Google Scholar] [CrossRef]
- Friedl, M.A.; Mciver, D.K.; Hodges, J.C.F.; Zhang, X.Y.; Muchoney, D.; Strahler, A.H.; Woodcock, C.E.; Gopal, S.; Schneider, A.; Cooper, A.; et al. Global Land Cover Mapping From MODIS: Algorithms and Early Results. Remote Sens. Environ. 2002, 83, 287–302. [Google Scholar] [CrossRef]
- Usman, M.; Liedl, R.; Shahid, M.A.; Abbas, A. Land Use/Land Cover Classification and its Change Detection Using Multi-Temporal MODIS NDVI Data. J. Geogr. Sci. 2015, 25, 1479–1506. [Google Scholar] [CrossRef]
- Cold and Arid Regions Sciences Data Center Website. “Land Cover Products of China”. Available online: http://westdc.westgis.ac.cn (accessed on 20 December 2017).
- Tianditu Website. Available online: http://zhfw.tianditu.com/ (accessed on 20 December 2017).
- Free Spatial Data-DIVA GIS Website. Available online: www.diva-gis.org/Data/ (accessed on 20 December 2017).
- ASTER GDEMV2 Download Website. Available online: http://gdem.ersdac.jspacesystems.or.jp/ (accessed on 20 December 2015).
- Website of Data Center for Resources and Environmental Sciences, Chinese Academy of Sciences (RESDC). Available online: http://www.resdc.cn (accessed on 20 December 2017).
- Chen, J.; Jin, S.; Liao, A.; Zhao, Y.; Xu, L.; Rong, D.; Yang, Z. An Overview of Investigation and Measurement of Ming Great Wall Resources. Geomat. World 2011, 11–16. (In Chinese) [Google Scholar]
- Luo, L. Space Archaeology for Tunshu Sites along the South Route of the Ancient Silk Road. Ph.D. Thesis, the University of Chinese Academy of Sciences, Beijing, China, 2016. (In Chinese). [Google Scholar]
- Cao, Y. Chinese Famous Frontier Passes; The People’s Liberation Army Press: Beijing, China, 1988. (In Chinese) [Google Scholar]
- Shan, Q. On Lineal or Serial Cultural Heritages Protection Breakthrough and Pressure. Relics from South 2006. [Google Scholar] [CrossRef]
- Kvamme, K.L. The Fundamental Principles and Practice of Predictive Archaeological Model. Math. Inf. Sci. Archaeol. A Flex. Framew. 1990, 3, 257–295. [Google Scholar]
- Zhang, H. GIS and Archaeology Spatial Analysis; Beijing University Press: Beijing, China, 2014. [Google Scholar]
- Conolly, J.; Lake, M. Geographical Information Systems in Archaeology; Cambridge University Press: Cambridge, UK, 2006. [Google Scholar]
- Liang, Q.; Meng, W.; Lin, L.; Wan, Q. Potential Lightning Predictive Method Based on Logistic Regression Model. Guangdong Meteorol. 2011, 33, 44–51. (In Chinese) [Google Scholar] [CrossRef]
- Kvamme, K.L. Computer Processing Techniques for Regional Modeling of Archaeological Site Locations. Adv. Comp. Archaeol. 1983, 1, 26–52. [Google Scholar]
- Kvamme, K.L. There and Back Again: Revisiting Archaeological Locational Modelling. GIS and Archaeological Site Location Modelling; CRC Press Taylor & Francis Group: Boca, Raton, FL, USA, 2006. [Google Scholar] [CrossRef]
- Yang, Y.; Zhang, S.; Yang, J.; Chang, L.; Bu, K.; Xing, X. A Review of Historical Reconstruction Methods of land Use/Land Cover. J. Geogr. Sci. 2014, 24, 746–766. [Google Scholar] [CrossRef]
- Guo, Y.; Mo, D.; Mao, L.; Wang, S.; Li, S. Settlement Distribution and its Relationship with Environmental Changes from the Neolithic to Shang-Zhou Dynasties in Northern Shandong, China. J. Geogr. Sci. 2013, 23, 679–694. [Google Scholar] [CrossRef]
- Li, K.; Zhu, C.; Jiang, F.; Li, B.; Wang, X.; Cao, B.; Zhao, X. Archaeological Sites Distribution and its Physical Environmental Settings between ca 260–2.2 ka BP in Guizhou, Southwest China. J. Geogr. Sci. 2014, 24, 526–538. [Google Scholar] [CrossRef]
- Carlson, R.J.; Baichtal, J. A Predictive Model for Locating Early Holocene Archaeological Sites Based on Raised Shell-Bearing Strata in Southeast Alaska, USA. Geoarchaeology 2016, 30, 120–138. [Google Scholar] [CrossRef]
- Li, M. Review on the 100 years’ Studies of the Silk Road. N. W. Ethno-Natl. Stud. 2005, 45, 48–49. [Google Scholar] [CrossRef]
- Wang, J.; Deng, M.; Cheng, T.; Huang, J. Time-Spatial Data Analysis and Model; Sicence Press: Beijing, China, 2012. (In Chinese) [Google Scholar]
- Demján, P.; Dreslerová, D. Modelling Distribution of Archaeological Settlement Evidence Based on Heterogeneous Spatial and Temporal Data. J. Archaeol. Sci. 2016, 69, 100–109. [Google Scholar] [CrossRef]


| Provinces and Autonomous Regions | Frontier Passes | Total Number |
|---|---|---|
| Xinjiang | Tiemen Pass | 1 |
| Gansu | Yumen Pass, Yang Pass, Jiayu Pass, Dazhen Pass, Liangzhou Wei, Suzhou Wei, Handong Wei, Yanzhi Fort, Suoqiao Fort, Lutang Fort, Tumen Fort, Dajing Cheng, Heishan Fort, Xiakou Fort, Shi Pass, Zhangye Cheng | 16 |
| Ningxia | Xiama Pass, Zhenyuan Pass, Sanguan Kou, Hengcheng Fort, Hengshan Fort, Xingwuying Suo, Guangwuying Suo, Qingshuiying Fort, Shengjin Pass, Daweikou Pass, Baisikou, Helankou, Yinchuan Cheng, Guyuan Cheng | 14 |
| Shaanxi | Dasan Pass, Jinsuo Pass, Tong Pass, Raofeng Pass, Wu Pass, Yangping Pass, Xiegu Pass, Yao Pass, Micang Pass, Xianren Pass, Longmen Pass, Wuli Pass, Luzi Pass, Linjin Pass, Yulin Cheng, Zhenbei Tower, Huangfuchuan Fort, Qingshuiying Fort, Gushan Fort, Zhenqiang Fort, Dabai Fort, Yongxing Fort, Gaojia Fort, Jian’an Fort, Changle Fort, Boluo Fort, Wuwei Fort, Huaiyuan Fort, Qingping Fort, Longzhou Fort, Zhenjing Fort, Zhenluo Fort, Jingbianying, Ningsai Fort, Liushujian Fort, Zhuanjing Fort, Dingbian Cheng | 37 |
| Henan | Changtai Pass, Wusheng Pass, Pingjing Pass, Jiuli Pass, Dasheng Pass, Yique Pass, Mengjin Pass, Heishi Pass, Dagu Pass, Hulao Pass, Jindi Pass, Xuanyuan Pass, Jingzi Pass, Luyang Pass, Qin Hangu Pass, Han Hangu pass, Zhuyang Pass, Liyang Pass | 18 |
| Independent Variable Name | Data Source | Type of Variable | Description |
|---|---|---|---|
| ELE | ASTER GDEMV2 | Terrain (km) | Elevation |
| ASP | Aspect | ||
| SLO | Slope | ||
| CUR | Curvature | ||
| PLC | Plane curvature | ||
| PRC | Profile curvature | ||
| DS_IS | Diva GIS | Distance to intermittent streams | |
| DS_PS | Distance to perennial streams | ||
| DS_4S | 1:4,000,000 GIS data | Distance to Streams (4th orders and higher) | |
| DS_5S | 1:4,000,000 GIS data | Distance to Streams (5th orders and higher) | |
| GL30(4) | GL30 land cover database | GL30 land cover | |
| SOI_Typ(13) | Soil Classes HWSD v1.1 | Non-terrain | Soil Type (FAO90) |
| IGB_LC(4) | IGBP-DIS land cover data | IGBP land cover | |
| GLC2000_LC(4) | GLC2000 land cover data | GLC2000 | |
| UMD_LC(4) | UMd land cover data | UMd land cover | |
| MOD_LC(4) | MODIS land cover data | MODIS land cover | |
| WEST_LC(4) | WESTDC land cover data | WESTDC land cover |
| GLC2000_LC ID | New ID | GL30 ID | New ID | IGB_LC/MOD_LC ID | New ID | UMD_LC ID | New ID | WEST_LC ID | New ID |
|---|---|---|---|---|---|---|---|---|---|
| 1 | 1 | 10–19 | 2 | 1 | 1 | 0 | 3 | 11 | 3 |
| 2 | 1 | 20–29 | 1 | 2 | 1 | 1 | 1 | 12 | 2 |
| 3 | 1 | 30–39 | 2 | 3 | 1 | 2 | 1 | 21 | 1 |
| 4 | 1 | 40–49 | 1 | 4 | 1 | 3 | 1 | 22 | 1 |
| 5 | 1 | 50–59 | 3 | 5 | 1 | 4 | 1 | 23 | 1 |
| 6 | 1 | 60–69 | 3 | 6 | 1 | 5 | 1 | 24 | 1 |
| 7 | 2 | 70–79 | 4 | 7 | 1 | 6 | 1 | 31 | 2 |
| 8 | 2 | 80–89 | 5 | 8 | 2 | 7 | 1 | 32 | 2 |
| 9 | 2 | 90–99 | 4 | 9 | 2 | 8 | 1 | 33 | 2 |
| 10 | 2 | 100 | 4 | 10 | 2 | 9 | 1 | 41 | 3 |
| 11 | 2 | - | - | 11 | 2 | 10 | 2 | 42 | 3 |
| 12 | 2 | - | - | 12 | 2 | 11 | 2 | 43 | 3 |
| 13 | 5 | - | - | 13 | 5 | 12 | 4 | 44 | 4 |
| 14 | 3 | - | - | 14 | 2 | 13 | 5 | 45 | 3 |
| 15 | 3 | - | - | 15 | 4 | - | - | 46 | 4 |
| 16 | 3 | - | - | 16 | 4 | - | - | 51 | 5 |
| 17 | 4 | - | - | 17 | 3 | - | - | 52 | 5 |
| 18 | 4 | - | - | - | - | - | - | 53 | 5 |
| 19 | 4 | - | - | - | - | - | - | 61 | 4 |
| 20 | 4 | - | - | - | - | - | - | 62 | 4 |
| 21 | 2 | - | - | - | - | - | - | 63 | 4 |
| 22 | 2 | - | - | - | - | - | - | 64 | 3 |
| 23 | 2 | - | - | - | - | - | - | 65 | 4 |
| 24 | 1 | - | - | - | - | - | - | 66 | 4 |
| - | - | - | - | - | - | - | - | 67 | 5 |
| Independent Variables | B | Wald | Sig | Exp (B) |
|---|---|---|---|---|
| ELE | −1.055 | 12.574 | 0.001 | 0.348 |
| SLO | −0.093 | 4.077 | 0.043 | 0.911 |
| GLC2000_LC(1) | 3.161 | 6.955 | 0.008 | 23.585 |
| GLC2000_LC(2) | 2.530 | 11.48 | 0.001 | 12.559 |
| GLC2000_LC(3) | 1.556 | 2.01 | 0.156 | 4.74 |
| DS_PS | −0.045 | 6.989 | 0.008 | 0.956 |
| Constant | 5.4291 | 0.587 | 0.443 | 1.857 |
| Data Types | Prediction Result | Precision/% | Overall Accuracy/% | ||
|---|---|---|---|---|---|
| Non-Site | Site | ||||
| Input data | Non-site (0) | 254 | 40 | 86.4 | 86.7 |
| Site (1) | 6 | 50 | 89.3 | ||
| Test data | Non-site (0) | 108 | 12 | 90.0 | 89.3 |
| Site (1) | 4 | 26 | 86.7 | ||
| Probability Level | Area Percentage | Site Number | Number Percentage | Kgain |
|---|---|---|---|---|
| Low | 52.78% | 4 | 4.65% | −10.35 |
| Moderate | 25.20% | 18 | 20.93% | −0.20 |
| High | 22.02% | 64 | 74.42% | 0.70 |
| Variables | 1000 m | 750 m | 500 m | 250 m | 100 m | 50 m |
|---|---|---|---|---|---|---|
| ELE | −1.444 | −1.425 | −1.397 | −1.279 | −1.092 | −1.055 |
| GLC2000_LC(1) | 1.799 | 1.928 | 1.899 | 2.157 | 3.036 | 3.161 |
| GLC2000_LC(2) | 2.238 | 2.265 | 2.225 | 2.264 | 2.469 | 2.530 |
| GLC2000_LC(3) | 1.414 | 1.434 | 1.406 | 1.453 | 1.513 | 1.556 |
| DS_PS | −0.041 | −0.041 | −0.042 | −0.043 | −0.045 | −0.045 |
| SLO | 0.090 | 0.062 | 0.043 | −0.007 | −0.085 | −0.093 |
| Constant | 0.475 | 0.464 | 0.500 | 0.483 | 0.661 | 0.619 |
| Accuracy | 86% | 86% | 86% | 86.7% | 86.7% | 86.7% |
| Input Water Variables | 1000 m | 750 m | 500 m | 250 m | 100 m | 50 m | |
|---|---|---|---|---|---|---|---|
| accuracy | Distance to perennial streams, distance to intermittent streams, distance to streams (4th order and higher) and distance to streams (5th order and higher) | 86% | 86% | 86% | 86.7% | 86.7% | 86.7% |
| Distance to all the streams merging perennial streams and intermittent streams | 72.7% | 78.7% | 76.7% | 74.7% | 74.7% | 75.3% | |
| Distance to perennial streams, distance to intermittent streams | 82% | 82% | 82% | 81.3% | 81.3% | 81.3% | |
| Distance to streams (4th order and higher) and streams (5th order and higher) | 80.7% | 82% | 83.3% | 80% | 76% | 82% | |
| Distances to streams (5th order and higher) | 81.3% | 79.3% | 80% | 80% | 76% | 81.3% |
| Basic Types | Climate Landform Type | A Humid Monsoon Climate Landform | B Warm Humid and Semi-Humid Monsoon Climate Landform | C Inland Arid and Semi-Arid Climate Landform | D Alpine Cold–High Latitude Climate Landform |
|---|---|---|---|---|---|
| Plain | 1 River delta |  |  | - | - |
| 2 Marine plain |  deposition deposition |  deposition deposition | - | - | |
 abrasion abrasion |  abrasion abrasion | ||||
| 3 Alluvial-Lacustrine plain |  |  |  Salt lake plain, playa lake plain Salt lake plain, playa lake plain |  Freeze–thaw plain Freeze–thaw plain | |
| 4 Alluvia plain |  |  | |||
| 5 Alluvium-diluvium wave plain |  |  | |||
| 6 Alluvial sloping plain | - | - |  |  Earthflow platform Earthflow platform | |
| Platform and Highland | 7 Platform and Terrace |  |  |  | |
| 8 Piedmont plain and Highland |  Low Low |  Low Low |  Highland Highland |  Highland Highland | |
 High High |  High High | ||||
| Hill and Mountain | 9 Hill |  Erosion Erosion |  Erosion Erosion |  Arid denudation Arid denudation |  Frosting wind-erosion Frosting wind-erosion |
 Corrosion Corrosion |  Corrosion Corrosion |  Erosion and Denudation Erosion and Denudation |  Frosting erosion Frosting erosion | ||
| 10 Low mountain and Middle mountain |  Erosion Erosion |  Erosion Erosion |  Arid denudation Arid denudation |  Frosting Frosting | |
 Frosting wind-erosion Frosting wind-erosion | |||||
 Corrosion Corrosion |  Corrosion Corrosion |  Erosion and Denudation Erosion and Denudation |  Frosting erosion Frosting erosion | ||
| 11 High mountain and Extra-high mountain |  Erosion Erosion | - | - |  Frosting Frosting | |
 Frosting wind-erosion Frosting wind-erosion | |||||
 Valley Valley |  Frosting erosion Frosting erosion |
© 2018 by the authors. Licensee MDPI, Basel, Switzerland. This article is an open access article distributed under the terms and conditions of the Creative Commons Attribution (CC BY) license (http://creativecommons.org/licenses/by/4.0/).
Share and Cite
Zhu, X.; Chen, F.; Guo, H. A Spatial Pattern Analysis of Frontier Passes in China’s Northern Silk Road Region Using a Scale Optimization BLR Archaeological Predictive Model. Heritage 2018, 1, 15-32. https://doi.org/10.3390/heritage1010002
Zhu X, Chen F, Guo H. A Spatial Pattern Analysis of Frontier Passes in China’s Northern Silk Road Region Using a Scale Optimization BLR Archaeological Predictive Model. Heritage. 2018; 1(1):15-32. https://doi.org/10.3390/heritage1010002
Chicago/Turabian StyleZhu, Xiaokun, Fulong Chen, and Huadong Guo. 2018. "A Spatial Pattern Analysis of Frontier Passes in China’s Northern Silk Road Region Using a Scale Optimization BLR Archaeological Predictive Model" Heritage 1, no. 1: 15-32. https://doi.org/10.3390/heritage1010002