
Battery Sizing for Different Loads and RES Production Scenarios through Unsupervised Clustering Methods
by
 , , ,
, , ,
Alfredo Nespoli
1 ,
,
Andrea Matteri
1,*,
Silvia Pretto
2,
Luca De Ciechi
3 and
Emanuele Ogliari
1,* 1
Politecnico di Milano, Dipartimento di Energia, Via La Masa 34, 20156 Milan, Italy
2
Equienergia S.r.l., c.so Sempione 62, 20153 Milan, Italy
3
Helexia Energy Services S.r.l., Strada 8, Palazzo N, Rozzano, 20089 Milan, Italy
*
Authors to whom correspondence should be addressed.
Forecasting 2021, 3(4), 663-681; https://doi.org/10.3390/forecast3040041
Submission received: 6 August 2021
/
Revised: 14 September 2021
/
Accepted: 21 September 2021
/
Published: 24 September 2021
(This article belongs to the Special Issue Feature Papers of Forecasting 2021)
Abstract
:The increasing penetration of Renewable Energy Sources (RESs) in the energy mix is determining an energy scenario characterized by decentralized power production. Between RESs power generation technologies, solar PhotoVoltaic (PV) systems constitute a very promising option, but their production is not programmable due to the intermittent nature of solar energy. The coupling between a PV facility and a Battery Energy Storage System (BESS) allows to achieve a greater flexibility in power generation. However, the design phase of a PV+BESS hybrid plant is challenging due to the large number of possible configurations. The present paper proposes a preliminary procedure aimed at predicting a family of batteries which is suitable to be coupled with a given PV plant configuration. The proposed procedure is applied to new hypothetical plants built to fulfill the energy requirements of a commercial and an industrial load. The energy produced by the PV system is estimated on the basis of a performance analysis carried out on similar real plants. The battery operations are established through two decision-tree-like structures regulating charge and discharge respectively. Finally, an unsupervised clustering is applied to all the possible PV+BESS configurations in order to identify the family of feasible solutions.
1. Introduction
The rising penetration of Renewable Energy Sources (RESs), together with the progressive digitization of grids, is leading to an energy scenario where power production is increasingly decentralized [1] and those who were once only energy consumers become producers themselves and are called “prosumers” [2,3].
Nowadays, RESs are widely connected to distribution grids thanks to the advantages they offer: clean energy and additional generation to address the ever increasing electricity demand [4]. Between RESs power generation technologies, solar PhotoVoltaic (PV) systems are a promising option offering a significant potential for providing energy in a sustainable way [5], directly generating it onsite [6]. However, solar energy is, by nature, intermittent and not programmable [7]. For this reason, energy storage systems, endowed of a proper management software, are needed [8].
Among all possible storage systems, the electrochemical ones represent an attractive option [9]. Electrochemical technologies store energy through specific chemical components. Being available in modules, the desired voltages and currents can be achieved by connecting single modules in series and/or in parallel [10]. Currently, a growing fraction of installed utility-scale PV systems incorporates Battery Energy Storage Systems (BESS) [11,12]. This allows to achieve a flexibility improvement in power generation by shifting production from the peak of non-programmable solar energy towards hours of large consumption [13,14].
When coupling a BESS with a PV power production system, a key design consideration is constituted by the selection between DC- and AC-coupling. AC-coupled systems have largely independent PV and batteries, each using its own inverter, and the coupling is located on the AC side of the inverters. On the contrary, DC-coupled systems, where the PV field the and battery share a common inverter, have the advantage of potentially reducing costs from shared components [15,16].
In general, the design phase of PV + BESS hybrid systems requires a large number of decisions due to the large number of possible configurations in terms of overall system architecture as well as the sizing of various components [17]. Before constructing a new PV power production facility, feasibility studies are needed to assess its viability from both financial and technical perspectives [18]. In detail, simulations are carried out to assess the energy production permitted by a given plant configuration in a given geographical position [19] and to evaluate the expected investment costs [20].
The main objective of the present work is to provide a preliminary forecast that identifies a family of batteries which is suitable, from both a technical and a financial point of view, for a given scenario. Techno-economical simulations are carried out for new grid-connected PV+BESS hybrid power production plants. Several scenarios are considered in terms of PV plant configuration, load curves and battery technologies available on the market.
2. Case Study and Procedure
In this paper, a procedure is proposed to forecast a family of batteries which are suitable to be coupled with a given PV plant configuration.
The proposed procedure is applied to new hypothetical PV facilities installed on the rooftop of two different buildings: a single-brand point of sale and a ceramics factory. According the analyzed buildings, two different load types will be considered, namely a commercial and an industrial load curves. The energy production is simulated on the basis of an analysis carried out on real PV plants and thanks to irradiance databases available online. The battery operation is managed by means of a specific control logic defined in decision-tree-like diagrams considering all possible operating conditions for both charge and discharge. Several PV+BESS configurations are simulated and, for each one, a set of performance and economic indicators are computed. In the end, an unsupervised clustering algorithm is applied to all the analyzed PV+BESS configurations, aimed at detecting the family of battery solutions which are the most suitable according to the considered scenario.
In the following Sections, all aspects of the proposed procedure are thoroughly discussed: Section 2.1 analyzes the performance of several real PV plants in order to compute a proper value of Performance Ratio to be used during the following power production simulations; Section 2.2 describes the load curves corresponding to the industrial and the commercial buildings involved in the analysis; Section 2.3 explains how to simulate the PV power production; Section 2.4 provides a list of all the battery technologies considered in couple with the PV plant; Section 2.5 displays and discusses two decision-tree-like structures providing indications about the control logic of batteries during both charge and discharge; Section 2.6 describes a set of useful parameters used to evaluate the technical and economical viability of the considered PV+BESS configurations; Section 2.7 discusses how to apply a clustering method to all the possible PV+BESS configurations in order to find a group of batteries that are suitable for coupling with a given PV plant.
2.1. Plant Monitoring and Performance Ratio Calculation
The first part of the present study takes into account 22 monitored PV plants distributed all over the Italian territory with a total peak power installed of about 7 MW. These facilities can be divided based on four different types of installation:
- Fixed tilt: the solar field presents a fixed tilt angle. In general, the modules are installed either on concrete ballasts or metal structures placed on flat roofs and convection is allowed on their back surface.
- Flush mount: the modules are integrated on building roofs presenting a tilt larger than 4–5° and convection is not allowed on their back surface.
- East-West: the solar field is halved in two sections: one exposed toward East and the other towards West. The modules are generally installed on concrete ballasts.
- Carport: the modules are installed on parking structures and convection on their back is allowed.
A single plant can be composed of multiple sections with different tilt, azimuth or type of installation, that are considered independently.
Figure 1 reports the location of the considered PV facilities on the Italian territory considering five different regions: North-West, North-East, Center, South and Islands. Moreover, the chart highlights the fraction of plants corresponding to each installation type.
For each plant, the following characteristics are known: the nominal power, the peak power of all plant sections, the tilt and azimuth angles of the modules, the temperature coefficient of the module (accounting for temperature-related power losses) and the degradation factor. Monitoring campaigns carried out for each of the considered facilities allowed to collect hourly-basis data about the active energy produced at Alternating Current (AC) side, the solar irradiation on module’s plane, the cell’s temperature on the back side of the module and the ambient temperature. In case of plant sections with different exposure, the monitored parameters are recorded independently for each section.
Different plants started their operation in different years. However, the start of operation period does not always correspond with the starting date of monitoring: for instance, the oldest facility started to produce in August 2012, while its monitoring started in 2018.
Data from each PV facility are properly cleared out of inconsistent and unreliable samples determined by erroneous measurement, like negative values of produced energy, values of produced energy exceeding the corresponding value of irradiation, values of produced energy larger than the maximum feasible ones (computed on the basis of the plant nominal power increased by 5% to account for inverter overpower) and values of solar irradiation lower than lunar irradiation (4 W/m) or larger than 1200 W/m.
The data available allow to compute a performance index which is crucial for further analyses: the Performance Ratio (PR), which allows to compare the performance of PV facilities with different configurations and geographical location [21]. PR represents the overall effect of losses on the array’s rated output, due to array temperature, incomplete utilization of the irradiation (soiling and shading losses) and system component inefficiencies and failures [22]:
In the equation: represents the final PV system yield in the time interval t, hence the portion of net energy output of the entire PV plant which was supplied by the array per kW installed; corresponds to the reference yield in the time interval t, hence the ratio between total in-plane irradiation and module’s reference in-plane irradiance [23].
Starting from the historical data available, PRs are computed for each of the analyzed plants, first on a daily basis and then on a yearly basis (starting from the daily values). Then, the average value of both daily and yearly PR is computed for all the plants sharing the same type of installation. In the present work, the yearly PR values will be useful to provide some considerations about the performances of different types of plant, while the averaged daily PR values are crucial in estimating the power production of new plants.
2.2. Load Curves
In the present work, two different types of building are chosen to hypothetically install a new PV+BESS facility on their rooftop: one dedicated to commercial activities and the other devoted to industrial production. The power requirements of the two structures, given their different purposes, are described by distinct load curves.
The commercial load curve considered corresponds to a single-brand point of sale, whose building covers an area of about 6100 m. It is located in Italy, in the region of Piemonte, in climatic zone E, where the heating system start-up is allowed from 15 October to 15 April. The annual consumption of electric energy in 2019 (chosen as reference year) is equal to 828 MWh. The hourly consumption is visualized in Figure 2, in form of heat map covering all the hours and all the days of the reference year. Moreover, the seasonal loads during a typical week are plotted in Figure 3.
As shown in the chart, the building is closed on the first day of the Year, on Easter, on the 1st of May, in mid-August and on Christmas. During these periods, the photovoltaic energy self-consumed onsite is expected to be very low because only related to security equipment and perimeter lights. The maximum power absorbed is about 320 kW in summer due to chillers operation. In general, among the seasons, the PV production fits well the load: both the peaks in energy production and consumption are expected during summer, while the lowest values are registered in winter. The daily load curves present a peak in the late afternoon. During autumn and winter, another peak is observed also in early morning, due to HVAC machines start-up.
The industrial load curve considered corresponds to a ceramics factory, whose structure covers an area of about 17,300 m. It is located in Italy, in the region of Emilia-Romagna, in climatic zone F. The industrial process covers the entire day and the corresponding consumption is much larger the one related to conditioning and lighting systems. The annual consumption of electric energy in 2019 (chosen once again as reference year) is 7.5 GWh. The hourly consumption is visualized in Figure 4, in form of heat map covering all the hours and all the days of the reference year. Moreover, the seasonal loads during a typical week are plotted in Figure 5.
The power consumption ranges from 0 to 1280 kW. Saturdays and Sundays correspond to the yellow lines, representing a power absorption of about 650 kWp. The production is stopped during some periods in April, May, August and December. The load curve is constant among weeks and the electric consumption is generally constant among all the working days. The PV power production does not fit this type of load curve as good as the commercial one.
2.3. Pv Energy Production Simulation
A preliminary study on new PV plants is needed in order to estimate their potential energy production. In this analysis, the input variables are: the plant geographical coordinates, the peak power installable on a roof or on a specific area, the type of installation, the tilt and the azimuth of the roof. Notice that, in case of a PV facility where different sections present different exposures, the last four variables are considered independently for each exposure. Different sections may differ also in the type of installation and, consequently, in the mean daily PR. Finally, hourly irradiation data from the first to the last day of the considered reference year are acquired from SoDa Helioclim database for each section of the new plant, exploiting the information about the geographic coordinates, the tilt angle and the azimuth angle.
The energy production is calculated hour by hour using the solar irradiation data and the performance ratio:
In the equation: i stands for a generic plant section; is the hourly solar irradiation on the surface of the modules in a given section; is the daily Performance Ratio derived from the monitoring of real PV plants; is the total peak power installed for a given section. The total plant production in each hour is given by the sum of the energy produced by each section.
The simulations are performed under the assumption of ideal rooftop, where either fixed tilt, flush mount or East-West installations are possible. A total of six cases are considered, one for each combination between the three different PV plant configurations and the two possible load curves.
The tilt angle, the azimuth angle and the exposure are set for each configuration and thus they are independent from the load curve. In detail:
- Fixed tilt plant exposure is set toward South.
- Flush mount configuration is divided in two sections with different exposure: the first one is set toward South-West and the second one toward South-East.
- East-West type of plant is divided in two sections with opposite exposure.
The peak power of the plant is fixed: in case of commercial load, the peak power is 500 kWp, while in the case of industrial load the peak power is 2 MWp. The characteristics of each configuration are summarized in Table 1.
2.4. Battery Energy Storage System Models
A list of the battery models to be analyzed is obtained choosing between the products available on the market: different brands, sizes and technologies are adopted and compared in the simulations. All the batteries considered present the possibility to be recharged from the grid. All the batteries useful parameters are retrieved from catalogs. Two main technologies are considered: LiFePo and Li-ion NMC batteries.
The maximum volume of the technical room where batteries are installed is arbitrarily set at 50 m: this constitutes an upper limit to the maximum number of battery modules installable. The volume occupied from each battery pack accounts for the dimension of the battery and the minimum space necessary for heat dissipation, reported in the data sheets. The weight of the system is kept into account.
The batteries that are simulated in combination with the PV system are listed in Table 2.
A total of 14 different battery models are chosen, and their corresponding 242 feasible configurations are simulated in couple with each considered PV facility. Remembering that 3 type of PV installation and 2 type of load are considered, a total of 1452 PV+BESS systems are evaluated.
2.5. Battery Energy Storage System Control Logic
In the simulations, batteries are evaluated in terms of model and number, assuming that more packs of the same model can be considered in series or parallel connection. The battery simulation starts from a single pack of the first model of battery and ends at the maximum number of packs of the last type. A BESS configuration is simulated only if its volume is lower than the maximum volume of the technical room.
The batteries are connected to the grid, and therefore it is evaluated the convenience of recharging the battery when price of energy is lower. In order not to have the battery fully charged at the morning of a sunny day, the maximum state of charge achievable in F3 band is limited to the monthly difference between load and PV production divided by the number of days in that month. Moreover, the batteries are assumed to be AC-coupled with the PV system.
Real charge/discharge operations are always constrained by technical limits. However, in a preliminary battery assessment like the one proposed here, there is no need to account for these constraints. In real applications there is the necessity to identify as soon as possible a group of batteries suitable for a given application. Then and only then a specific battery model is chosen between the possible one (the choice is most of the times constrained by the availability of the different models) and further detailed analyses are carried out by means of specific software.
The battery operation is based on a precise control logic, capable of optimally managing the system. Decision-tree-like structure are constructed to visually represent the BESS control logic adopted. In Table 3, the terms adopted in the decision-tree-like structures are listed and explained.
The control logic of BESS charge is defined in the decision-tree-like structure reported in Figure 6.
In particular, the charge is permitted in three different modes:
- I charge: if the battery is not fully charged and the PV energy surplus is larger than the power of the battery, the state of charge in that hour increase of a quantity equal to the max power of charge; in case the capacity is exceeded, the state of charge is set at unity.
- II charge: if the battery is not fully charged and the PV energy surplus is positive and smaller than the power of charge, the battery is charged with the available PV energy in surplus; in case the capacity is exceeded, the state of charge is set at unity.
- III charge: if the battery is connected to the grid, the considered time window belongs the F3 band, it is not Sunday or holiday, the PV surplus is equal to zero and the SoC (State of Charge) is lower than the maximum SoC reachable in that month in F3 band, the battery is charged from the grid at maximum power.
The control logic of BESS discharge is defined in the decision-tree-like structure reported in Figure 7.
The battery discharge takes place in four different modes:
- I discharge: if the battery is grid-connected, the discharge is allowed only if the hour is in F1 band, in F2 band or if the SoC exceeds the maximum SoC reachable in the specific month in F3 band. Then, it is evaluated if the load, after the self-consumption, needs power greater than the maximum power removable from the battery and if the available SoC of the battery is enough to fulfill the demand. In the case the battery is not grid-connected, only these last two conditions are evaluated. If these requirements are verified, the battery is discharged at maximum power.
- II discharge: if the load requires more energy than the ones produced by the PV plant and it is greater than the power of the battery, while the available SoC is not enough, the battery is fully discharged and the load withdraws also energy from the grid. This discharge mode is always allowed if the battery is not grid-connected, while, if it is connected, it is also checked that the hour does not belong to F3 band.
- III discharge: this type of discharge is allowed at the same conditions of the first mode of discharge, but accounts for load lower than the battery maximum power. When the energy stored is enough, the load is balanced discharging the battery.
- IV discharge: if the load, after the self-consumption, is lower than the maximum discharge power of the battery and the energy stored is lower than the requirement, the battery is fully discharged and the remaining energy required for balancing the load is taken from the grid. This discharge mode is allowed evaluating if the battery is connected to the grid or not, as discussed in the first type of discharge.
2.6. Characteristic Features for Pv+Bess Configurations
The prediction of the feasible BESS configurations accounts for some key indicators: the PayBack Time (PBT) of the battery capital expenditure, to be minimized; the number of residual cycles at end of life, to be minimized; the self-consumption, the coverage and the on-site self-production, to be maximized.
The Self-Consumption (SC) is defined as [24]:
In the equation: is the PV energy consumed by the load; is the total annual PV production.
The coverage, sometimes also called self-sufficiency, is defined as [25]:
In the equation: is the PV energy consumed by the load; is the total annual energy consumption.
The Self-Production (SP) is defined as [24]:
In the equation: is the annual PV production; is the total annual energy consumption.
The PayBack Time (PBT) is computed as [26]:
The annual economic saving is the amount of money saved thanks to the presence of the BESS with respect to the same facility without any energy storage. In order to calculate it, a database with hundreds of electricity bills is exploited. The bills are divided according to zone, voltage (medium or low) and type of contract (peak-off peak, monorary, fixed multi-hourly and variable multi-hourly). Then, economic savings are calculated on the basis of the mean value of bills expenditures varying in function of energy.
Notice that the computed values of PBT refer only to the storage system and not to the entire power generation facility, including the PV plant. The OPEX (OPerating EXpense) related to the storage system consist of batteries O&M (Operation & Maintenance) costs (for instance related to maintenance interventions, remote monitoring etc.) and insurance costs. However, considering the purpose of the current preliminary analysis, all those factors can be neglected: they would be estimated equally for all the considered battery models and therefore they would not have any influence on the identification of the optimal capacity.
2.7. Battery Sizing Optimization by Means of Unsupervised Clustering
Finally, an unsupervised clustering based on k-means algorithm [27] is applied to all the analyzed BESS configurations. This final step aims at identifying a family containing all the feasible BESS solutions. K-means divides the dataset into a fixed number (k) of clusters according to some feature variables describing each sample. In this analysis, each sample corresponds to a possible BESS configuration. The feature variables chosen to fulfill the above-mentioned task are: the total photovoltaic energy stored in the battery within one year, the self-consumption, the number of residual cycles and the payback time.
In order to properly choose the number of clusters k, the Silhouette index [28] is exploited. This index provides a measure of how similar each sample is to samples in its own cluster, when compared to samples in other clusters and thus constitutes a tool to evaluate the quality several possible partitions of the available dataset. In practical terms, the Silhouette index is computed in function of the number of cluster k, and then the k corresponding to the highest Silhouette value is selected as number of clusters to be identified with k-means clustering.
The Silhouette plot for the BESS configurations coupled with the commercial load, representing the Silhouette value in function of the number of clusters k, is displayed in Figure 8. The number of clusters to be identified by k-means algorithm is equal to 2, coinciding with the largest Silhouette value.
The silhouette plot for the BESS configurations coupled with the industrial load, representing the Silhouette value in function of the number of clusters k, is displayed in Figure 9. The number of clusters to be identified by k-means algorithm is equal to 3, coinciding with the largest Silhouette value.
3. Results and Discussion
All the considered plants, their geographical position, their type of installation and their annual PR value are listed in Table 4. The observed annual PR ranges from 0.69 to 0.91. The two types of installation generally showing better performances are the fixed tilt and the East-West configurations, except for some outliers. The case of carport installation has little relevance in the current analysis: data are available only for one plant and the PR is calculated over a time period of only eight months.
As already described, the PR value for single plants is averaged over all the plants characterized by a specific type of installation. The result of this operation is reported in Figure 10. The box plot shows, for both fixed tilt and East-West configurations, an average annual PR higher than 0.80. However, the variability of the performances observed with fixed tilt PV facilities is much larger than that of East-West PV plants.
Finally, Figure 11 displays an heat map representing the daily average values of PR in the reference year in function of the plant configuration, computed averaging the daily PR values of single plants.
The new PV+BESS hybrid plants simulations return the forecast of the total amount of energy self-consumed, sold to the grid, stored in the battery or acquired from the grid in order to balance the demand. It is then possible to discuss the results in terms of PBT of the battery. As expected, increasing the number of battery packs in series, thus the capacity of the storage system, the energy self-consumed by the load grows but also the PBT increases significantly.
The results reported in Table 5 identify the BESS configuration that minimizes the PBT for each PV system configuration.
Most of the configurations identified result in a PBT approximately equivalent to the lifetime of the battery, equal to 15 years. In the last two cases, the PBT that is even larger than the battery lifetime. The cost of energy storage technologies is still too high to conclude that nowadays it is convenient to install a BESS system for large buildings. However, if the investment cost per kWh of capacity decreases, it will be possible to install a large capacities and to achieve a significant advantage also in terms of additional self-consumption. Changing the PV installation type for the commercial load, the choice of battery models remains unchanged, as well as the PBT. In case of industrial load, the same battery model with the same number of modules shows a decrease in PBT for the fixed tilt configuration thanks to higher annual economic savings.
The results reported in Table 6 identify the BESS configuration that minimizes the number of residual cycles for each PV system configuration.
Most of battery models optimized in terms of number of residual cycles are different from the ones optimized in terms of PBT. Focusing on the industrial load case, the fixed tilt configuration with the battery storage could be an interesting solution in case of decreasing in investment cost for batteries, because it has the minimum PBT between batteries with the optimal value of residual cycles. The last configuration has a PBT which is way too high for the feasibility of the investment.
The results obtained from k-means clustering application are reported in the following. As already discussed, the clustering procedure exploits the total photovoltaic energy stored in the battery within one year, the self-consumption, the number of residual cycles and the payback time as relevant features to characterize each possible BESS configuration.
Figure 12 represents all the 242 possible BESS configurations for the case of commercial load with a fixed tilt PV installation divided in two clusters. The clustering results does not show significant differences for other types of installation. As discussed before, the number of clusters is chosen on the basis of the Silhouette index and is equal to 2. The feature space is represented by three different points of view: on the PBT/residual cycles plan, on the self-consumption/residual cycles plan and on the self-consumption/PBT plan. The last diagram represents the overlap between clusters in terms of PBT. All values on the axes are standardized in the range between −1 and 1.
The purple cluster represents the family of BESS that are best suited to be coupled with the analyzed PV facility configuration. The trend of self-consumption over the PBT confirms what stated before: increasing the capacity of the battery, the self-consumption increases but, as a drawback, the PBT increases as well.
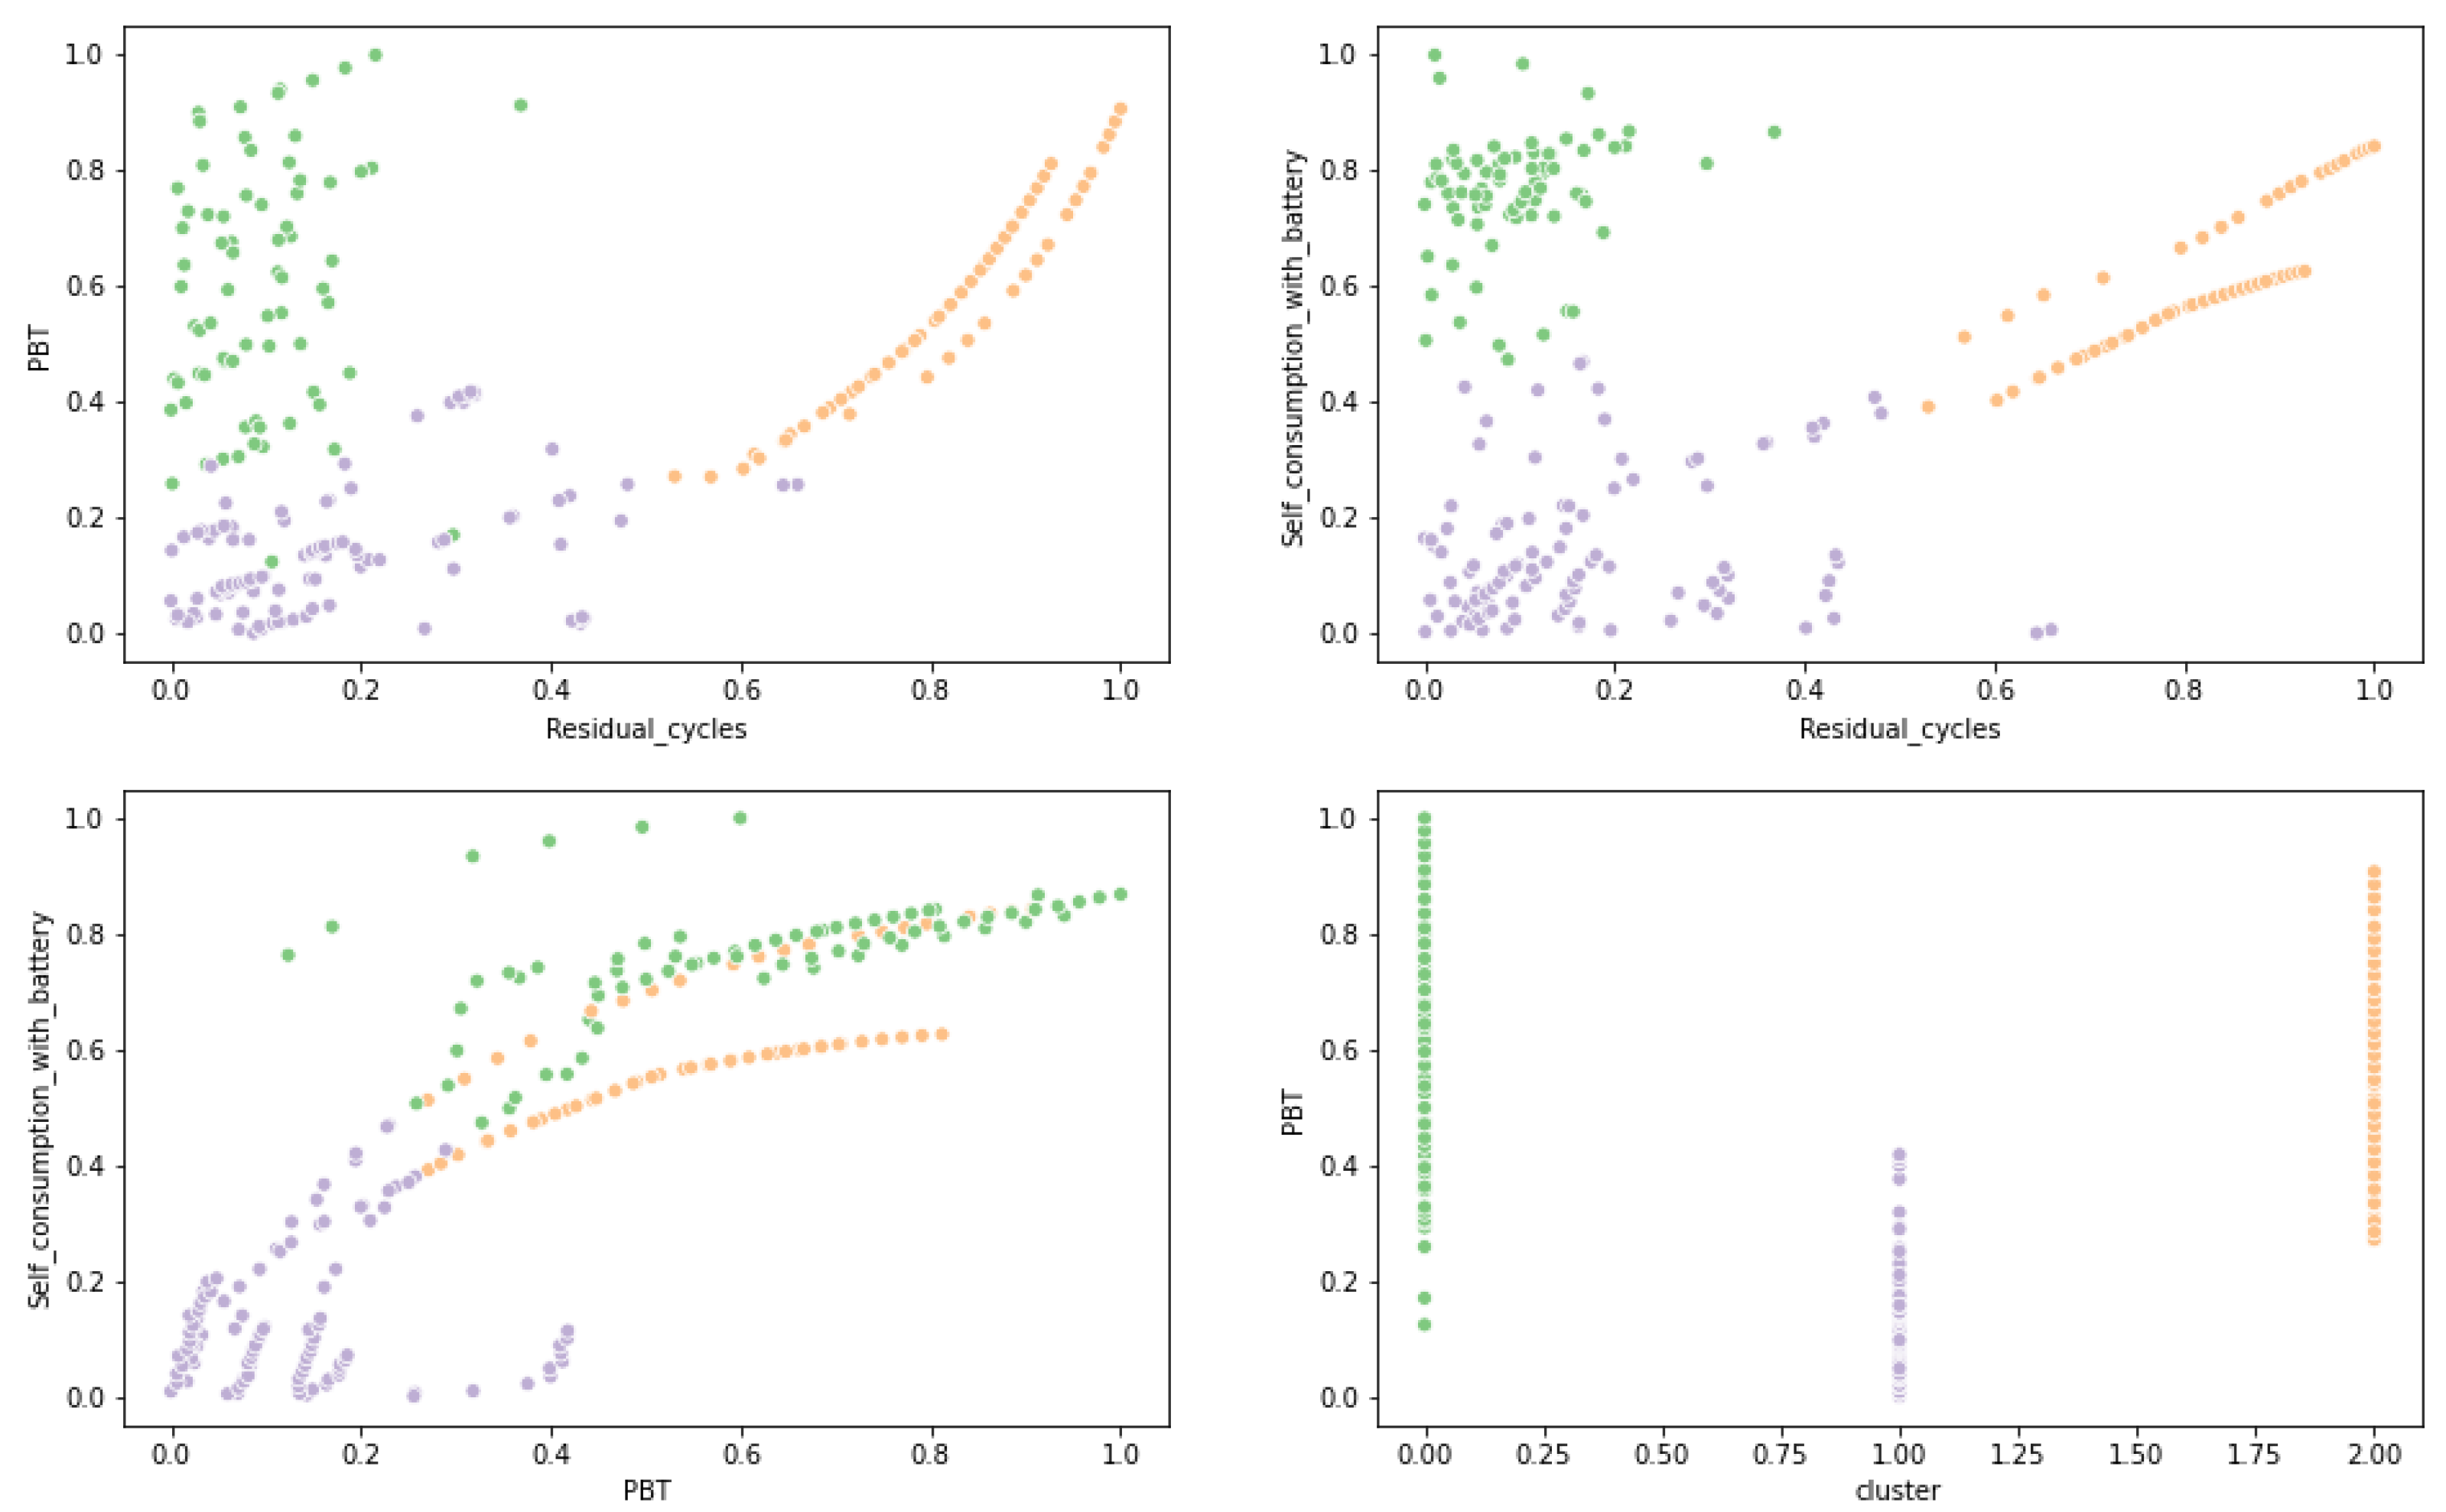
Figure 13 represents all the 242 possible BESS configurations for the case of industrial load with a fixed tilt PV installation divided in two clusters. Even when k-means is applied to the industrial scenario, the results are similar among different PV installation types, as observed for the commercial case. The number of clusters is chosen on the basis of the Silhouette index and is equal to 3. The feature space is represented in the same way as the commercial case and all values on the axes are standardized in the range between −1 and 1.
The large number of batteries with high capacity (and consequently high PBT) and low number of residual cycles, in the top left region of the upper diagrams, is related to the high electric consumption typical of an industrial load. Once again, the purple cluster represents the family of BESS that are best suited to be coupled with the analyzed PV facility configuration. The green cluster correspond to BESS configurations with low number of residual cycles and high PBT, while the orange cluster represents high-capacity batteries that are strongly oversized and thus not suited for the considered PV facility.
4. Conclusions
In recent years, the technological development and the increasing market competitiveness of RESs-based power production systems determined favorable conditions to switch from electricity generation in large centralized facilities to small decentralized energy systems.
In this scenario, PV facilities find profitable conditions for the grid connected users when the produced energy is self-consumed. Due to the intermittent and stochastic nature of the solar source, PV plants require the addition of an energy storage system to compensate fluctuations and to meet the energy demand even during night hours.
In this paper, a procedure is developed to forecast a family of batteries which is suitable to be coupled with a given PV plant configuration and is applied to some new PV facilities.
The PV+BESS hybrid plant energy production simulation is possible by:
- Knowing the geographical coordinates of the installation site and tilt and azimuth of the roof.
- Assuming the peak power installable on a roof and an installation type.
- Estimating a proper PR value, computed through data from real operating plants with similar installation characteristics and size.
Two different types of load curve are considered in the current work, namely:
- A commercial load curve, corresponding to a single-brand point of sale.
- An industrial load curve, corresponding to a ceramics factory.
The battery operations are managed by means of a control logic defined in decision-tree-like diagrams. The two diagrams, provided in the current work, consider all possible operating conditions during both charge and discharge. The main strategies behind the defined control logic are:
- Optimizing PV self-consumption, beneficial in markets whose value of electricity (€/kWh) is high.
- Charging the battery in the time bands with lower price of electric energy.
For each possible PV+BESS configuration, performance features, like the number of residual cycles at the end of lifetime and the self-consumption, and economic features, as the payback time, are computed. The self-consumption is defined as the ratio between PV energy consumed by the load and total annual PV production. On the other hand, PBT is based on the annual economic savings allowed by the presence of an energy storage system compared to the case of PV plant without battery.
The following observations are derived from the analysis performed:
- The knowledge of the annual distribution of electrical loads is crucial to determine which season or time window with high power demand justifies the existence of the storage, reducing the energy purchased from the grid. Energy-intensive applications, characterized by high loads even during night, enhance the profitability of the PV+BESS configuration.
- At present, the billing savings in themselves might not be enough to encourage the use of PV+BESS hybrid systems. Besides, their profitability strongly depends on the electricity tariff structure and energy policy of a country, in addition to PV and storage systems costs.
Finally, a clustering algorithm based on k-means algorithm is applied to all the considered PV+BESS configurations, aimed at detecting the family of battery solutions which is the most suitable according to the scenario considered. The number of clusters to be identified is established by means of the Silhouette index. As expected, the cluster of the best solutions contains all those configurations characterized by low PBT and number of residual cycles.
Possible future developments of the present work consist in adopting different clustering criteria and different features to possibly improve the identification of the family of batteries that are suitable for a given application.
Author Contributions
Data curation, S.P. and L.D.C.; Formal analysis, A.N., A.M., S.P., L.D.C. and E.O.; Investigation, A.N., A.M., S.P., L.D.C. and E.O.; Methodology, A.N., A.M., S.P., L.D.C. and E.O.; Software, L.D.C.; Writing—original draft, A.M. and L.D.C.; Writing—review & editing, A.N., S.P. and E.O. All authors have read and agreed to the published version of the manuscript.
Funding
This research received no external funding.
Conflicts of Interest
The authors declare no conflict of interest.
Abbreviations
The following abbreviations are used in this manuscript:
| AC | Alternating Current |
| BESS | Battery Energy Storage System |
| DC | Direct Current |
| DoD | Depth of Discharge |
| HVAC | Heating, Ventilation and Air Conditioning |
| NMC | Nickel Manganese Cobalt |
| O&M | Operation & Maintenance |
| OPEX | OPerating EXpense |
| PBT | PayBack Time |
| PR | Performance Ratio |
| PV | PhotoVoltaic |
| RES | Renewable Energy Source |
| SC | Self-Consumption |
| SoC | State of Charge |
| SP | Self-Production |
References
- Roffel, B.; de Boer, W. Analysis of power and frequency control requirements in view of increased decentralized production and market liberalization. Control. Eng. Pract. 2003, 11, 367–375. [Google Scholar] [CrossRef] [Green Version]
- Wu, C.; Zhou, D.; Lin, X.; Wei, F.; Chen, C.; Ma, Y.; Huang, Y.; Li, Z.; Dawoud, S.M. A novel energy cooperation framework for community energy storage systems and prosumers. International J. Electr. Power Energy Syst. 2022, 134, 107428. [Google Scholar] [CrossRef]
- Botelho, D.F.; Dias, B.H.; de Oliveira, L.W.; Soares, T.A.; Rezende, I.; Sousa, T. Innovative business models as drivers for prosumers integration - Enablers and barriers. Renew. Sustain. Energy Rev. 2021, 144, 111057. [Google Scholar] [CrossRef]
- Boonluk, P.; Siritaratiwat, A.; Fuangfoo, P.; Khunkitti, S. Optimal Siting and Sizing of Battery Energy Storage Systems for Distribution Network of Distribution System Operators. Batteries 2020, 6, 56. [Google Scholar] [CrossRef]
- Al-Aboosi, F.Y.; Al-Aboosi, A.F. Preliminary Evaluation of a Rooftop Grid-Connected Photovoltaic System Installation under the Climatic Conditions of Texas (USA). Energies 2021, 14, 586. [Google Scholar] [CrossRef]
- Alghamdi, A.S. Performance Enhancement of Roof-Mounted Photovoltaic System: Artificial Neural Network Optimization of Ground Coverage Ratio. Energies 2021, 14, 1537. [Google Scholar] [CrossRef]
- Mellit, A.; Massi Pavan, A.; Ogliari, E.; Leva, S.; Lughi, V. Advanced Methods for Photovoltaic Output Power Forecasting: A Review. Appl. Sci. 2020, 10, 487. [Google Scholar] [CrossRef] [Green Version]
- Kosmadakis, I.E.; Elmasides, C. A Sizing Method for PV–Battery–Generator Systems for Off-Grid Applications Based on the LCOE. Energies 2021, 14, 1988. [Google Scholar] [CrossRef]
- Rashid, K. Design, Economics, and Real-Time Optimization of a Solar/Natural Gas Hybrid Power Plant. Ph.D. Thesis, The University of Utah, Salt Lake City, UT, USA, 2019. [Google Scholar]
- Tabares, A.; Martinez, N.; Ginez, L.; Resende, J.F.; Brito, N.; Franco, J.F. Optimal Capacity Sizing for the Integration of a Battery and Photovoltaic Microgrid to Supply Auxiliary Services in Substations under a Contingency. Energies 2020, 13, 6037. [Google Scholar] [CrossRef]
- Attya, A.B.; Vickers, A. Operation and Control of a Hybrid Power Plant with the Capability of Grid Services Provision. Energies 2021, 14, 3928. [Google Scholar] [CrossRef]
- Javeed, I.; Khezri, R.; Mahmoudi, A.; Yazdani, A.; Shafiullah, G.M. Optimal Sizing of Rooftop PV and Battery Storage for Grid-Connected Houses Considering Flat and Time-of-Use Electricity Rates. Energies 2021, 14, 3520. [Google Scholar] [CrossRef]
- Mair, J.; Suomalainen, K.; Eyers, D.M.; Jack, M.W. Sizing domestic batteries for load smoothing and peak shaving based on real-world demand data. Energy Build. 2021, 247, 111109. [Google Scholar] [CrossRef]
- Pena-Bello, A.; Burer, M.; Patel, M.K.; Parra, D. Optimizing PV and grid charging in combined applications to improve the profitability of residential batteries. J. Energy Storage 2017, 13, 58–72. [Google Scholar] [CrossRef]
- He, J.; Yang, Y.; Vinnikov, D. Energy Storage for 1500 V Photovoltaic Systems: A Comparative Reliability Analysis of DC- and AC-Coupling. Energies 2020, 13, 3355. [Google Scholar] [CrossRef]
- Sandelic, M.; Sangwongwanich, A.; Blaabjerg, F. Reliability Evaluation of PV Systems with Integrated Battery Energy Storage Systems: DC-Coupled and AC-Coupled Configurations. Electronics 2019, 8, 1059. [Google Scholar] [CrossRef] [Green Version]
- Jufri, F.H.; Aryani, D.R.; Garniwa, I.; Sudiarto, B. Optimal Battery Energy Storage Dispatch Strategy for Small-Scale Isolated Hybrid Renewable Energy System with Different Load Profile Patterns. Energies 2021, 14, 3139. [Google Scholar] [CrossRef]
- Rashid, K.; Safdarnejad, S.M.; Ellingwood, K.; Powell, K.M. Techno-Economic Evaluation of Different Hybridization Schemes for a Solar Thermal/Gas Power Plant. Energy 2019, 181, 91–106. [Google Scholar] [CrossRef]
- Ma, D.; Pan, G.; Xu, F.; Sun, H. Quantitative Analysis of the Impact of Meteorological Environment on Photovoltaic System Feasibility. Energies 2021, 14, 2893. [Google Scholar] [CrossRef]
- Aguilar-Jiménez, J.A.; Hernández-Callejo, L.; Alonso-Gómez, V.; Velázquez, N.; López-Zavala, R.; Acuña, A.; Mariano-Hernández, D. Mariano-Hernández, Techno-economic analysis of hybrid PV/T systems under different climate scenarios and energy tariffs. Sol. Energy 2020, 212, 191–202. [Google Scholar] [CrossRef]
- Khalid, A.M.; Mitra, I.; Warmuth, W.; Schacht, V. Performance ratio – Crucial parameter for grid connected PV plants. Renew. Sustain. Energy Rev. 2016, 65, 1139–1158. [Google Scholar] [CrossRef]
- Lee, C.-S.; Lee, H.-M.; Choi, M.-J.; Yoon, J.-H. Performance Evaluation and Prediction of BIPV Systems under Partial Shading Conditions Using Normalized Efficiency. Energies 2019, 12, 3777. [Google Scholar] [CrossRef] [Green Version]
- Reich, N.; Müller, B.; Armbruster, A.; van Sark, W.; Kiefer, K.; Reise, C. Performance ratio revisited: Is PR > 90% realistic? Prog. Photovoltaics Res. Appl. 2012, 20, 717–726. [Google Scholar] [CrossRef]
- Pena-Bello, A.; Barbour, E.; Gonzalez, M.C.; Yilmaz, S.; Patel, M.K.; Parra, D. How Does the Electricity Demand Profile Impact the Attractiveness of PV-Coupled Battery Systems Combining Applications? Energies 2020, 13, 4038. [Google Scholar] [CrossRef]
- Fachrizal, R.; Munkhammar, J. Improved Photovoltaic Self-Consumption in Residential Buildings with Distributed and Centralized Smart Charging of Electric Vehicles. Energies 2020, 13, 1153. [Google Scholar] [CrossRef] [Green Version]
- Kharseh, M.; Wallbaum, H. How Adding a Battery to a Grid-Connected Photovoltaic System Can Increase its Economic Performance: A Comparison of Different Scenarios. Energies 2019, 12, 30. [Google Scholar] [CrossRef] [Green Version]
- Xu, R.; Wunsch, D. Survey of clustering algorithms. IEEE Trans. Neural Networks 2005, 16, 645–678. [Google Scholar] [CrossRef] [Green Version]
- Shutaywi, M.; Kachouie, N.N. Silhouette Analysis for Performance Evaluation in Machine Learning with Applications to Clustering. Entropy 2021, 23, 759. [Google Scholar] [CrossRef]
Figure 1.
Fraction of plants located in a certain region (a) and with a given configuration (b).
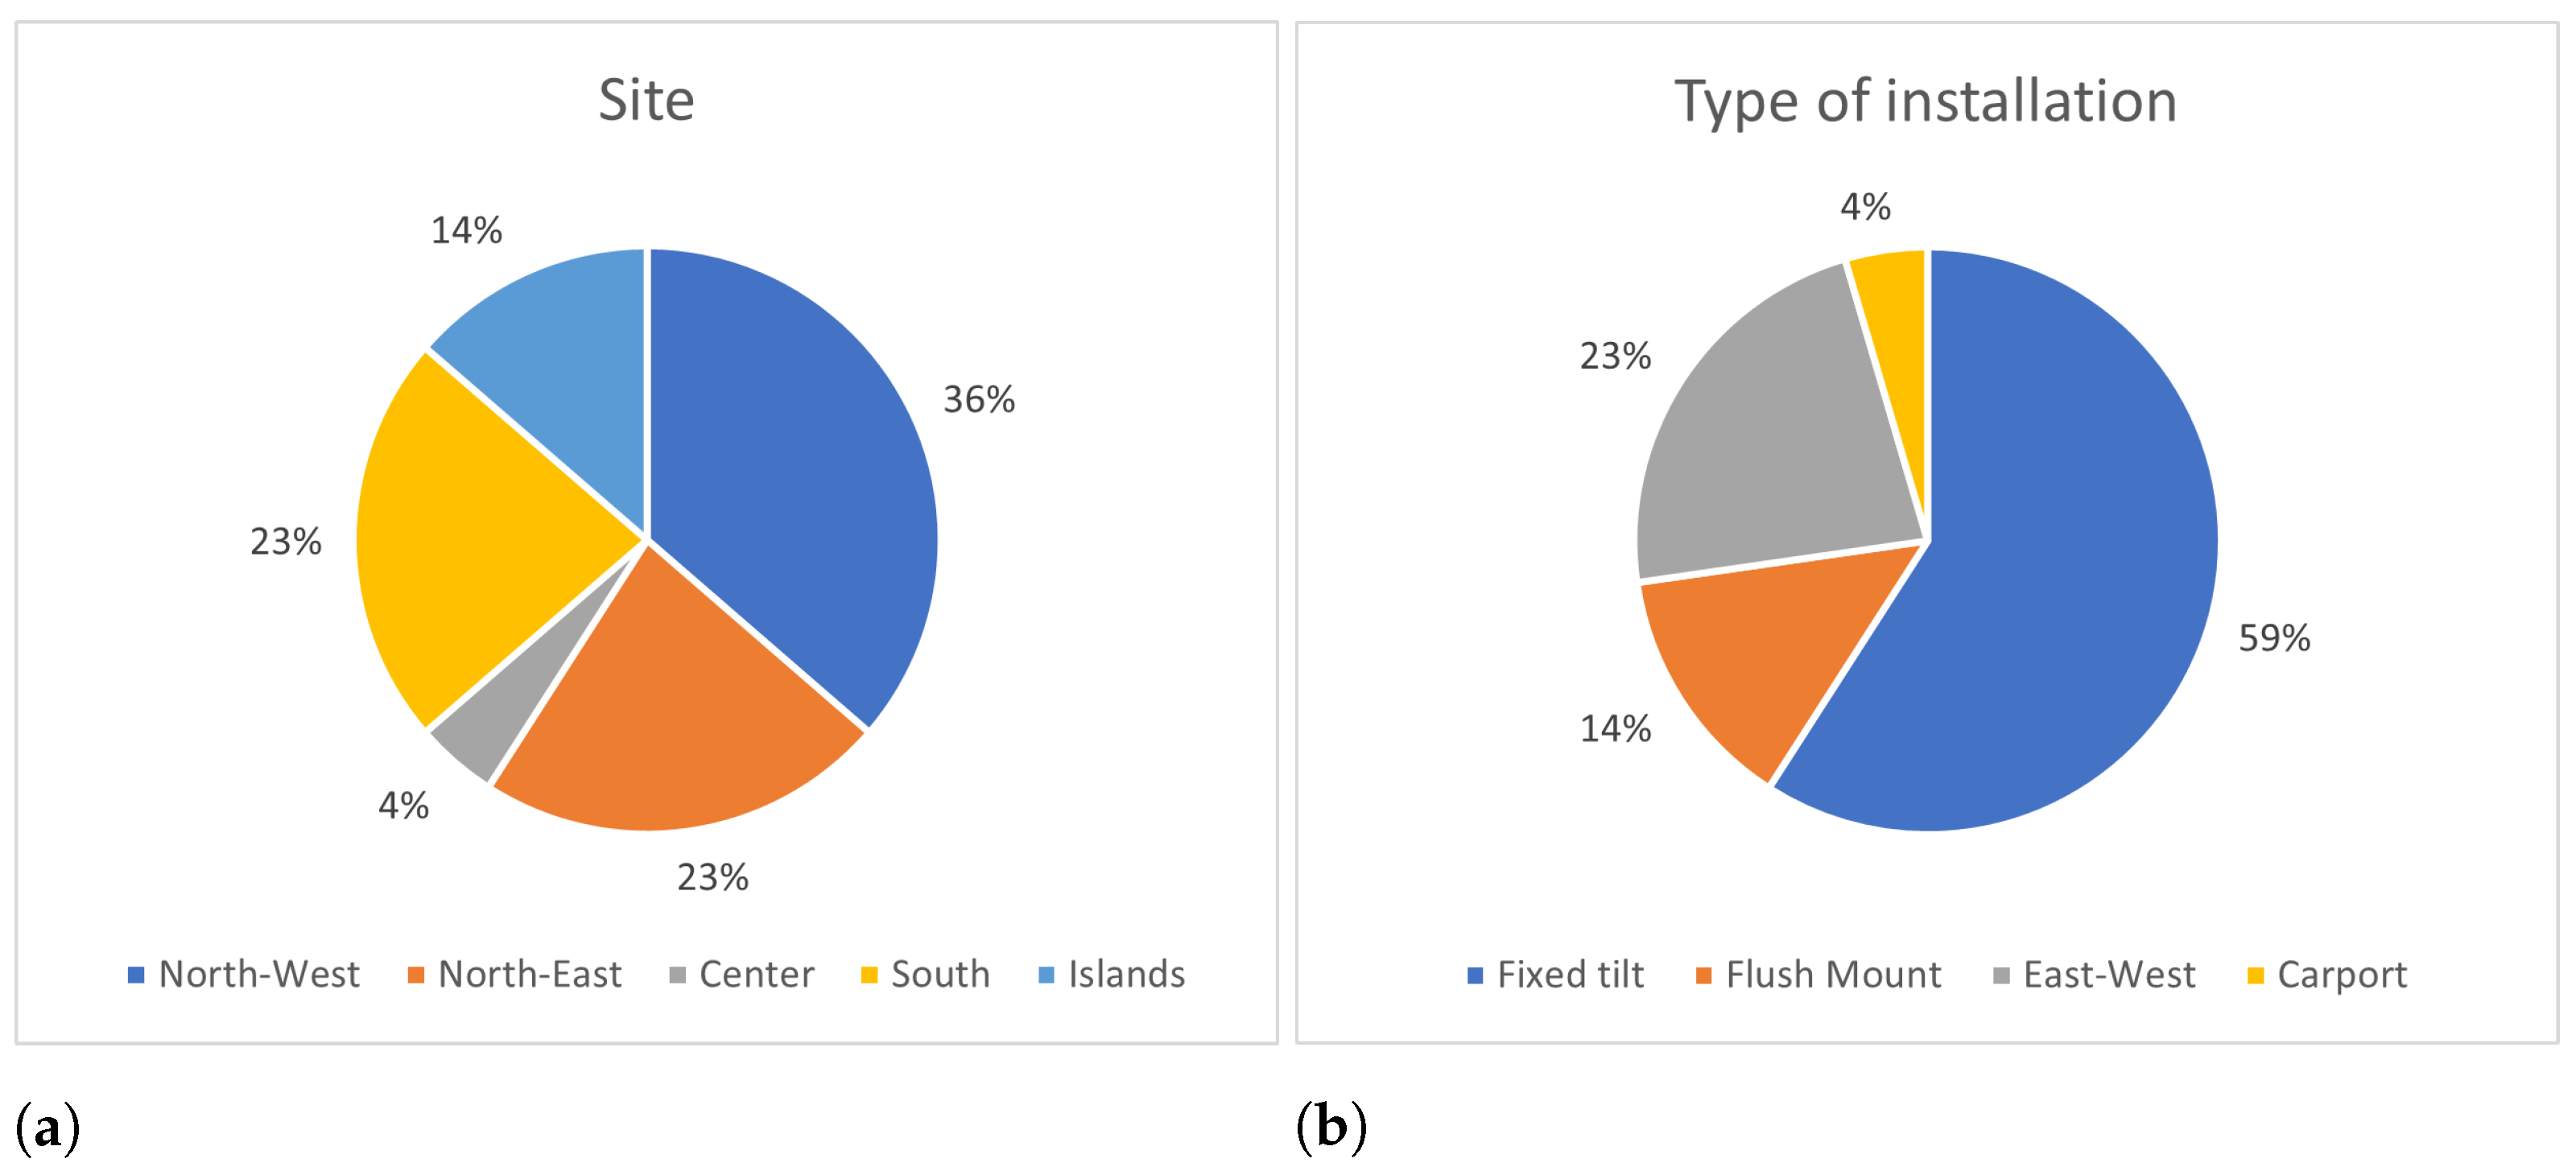
Figure 2.
Heat map corresponding to commercial loads.
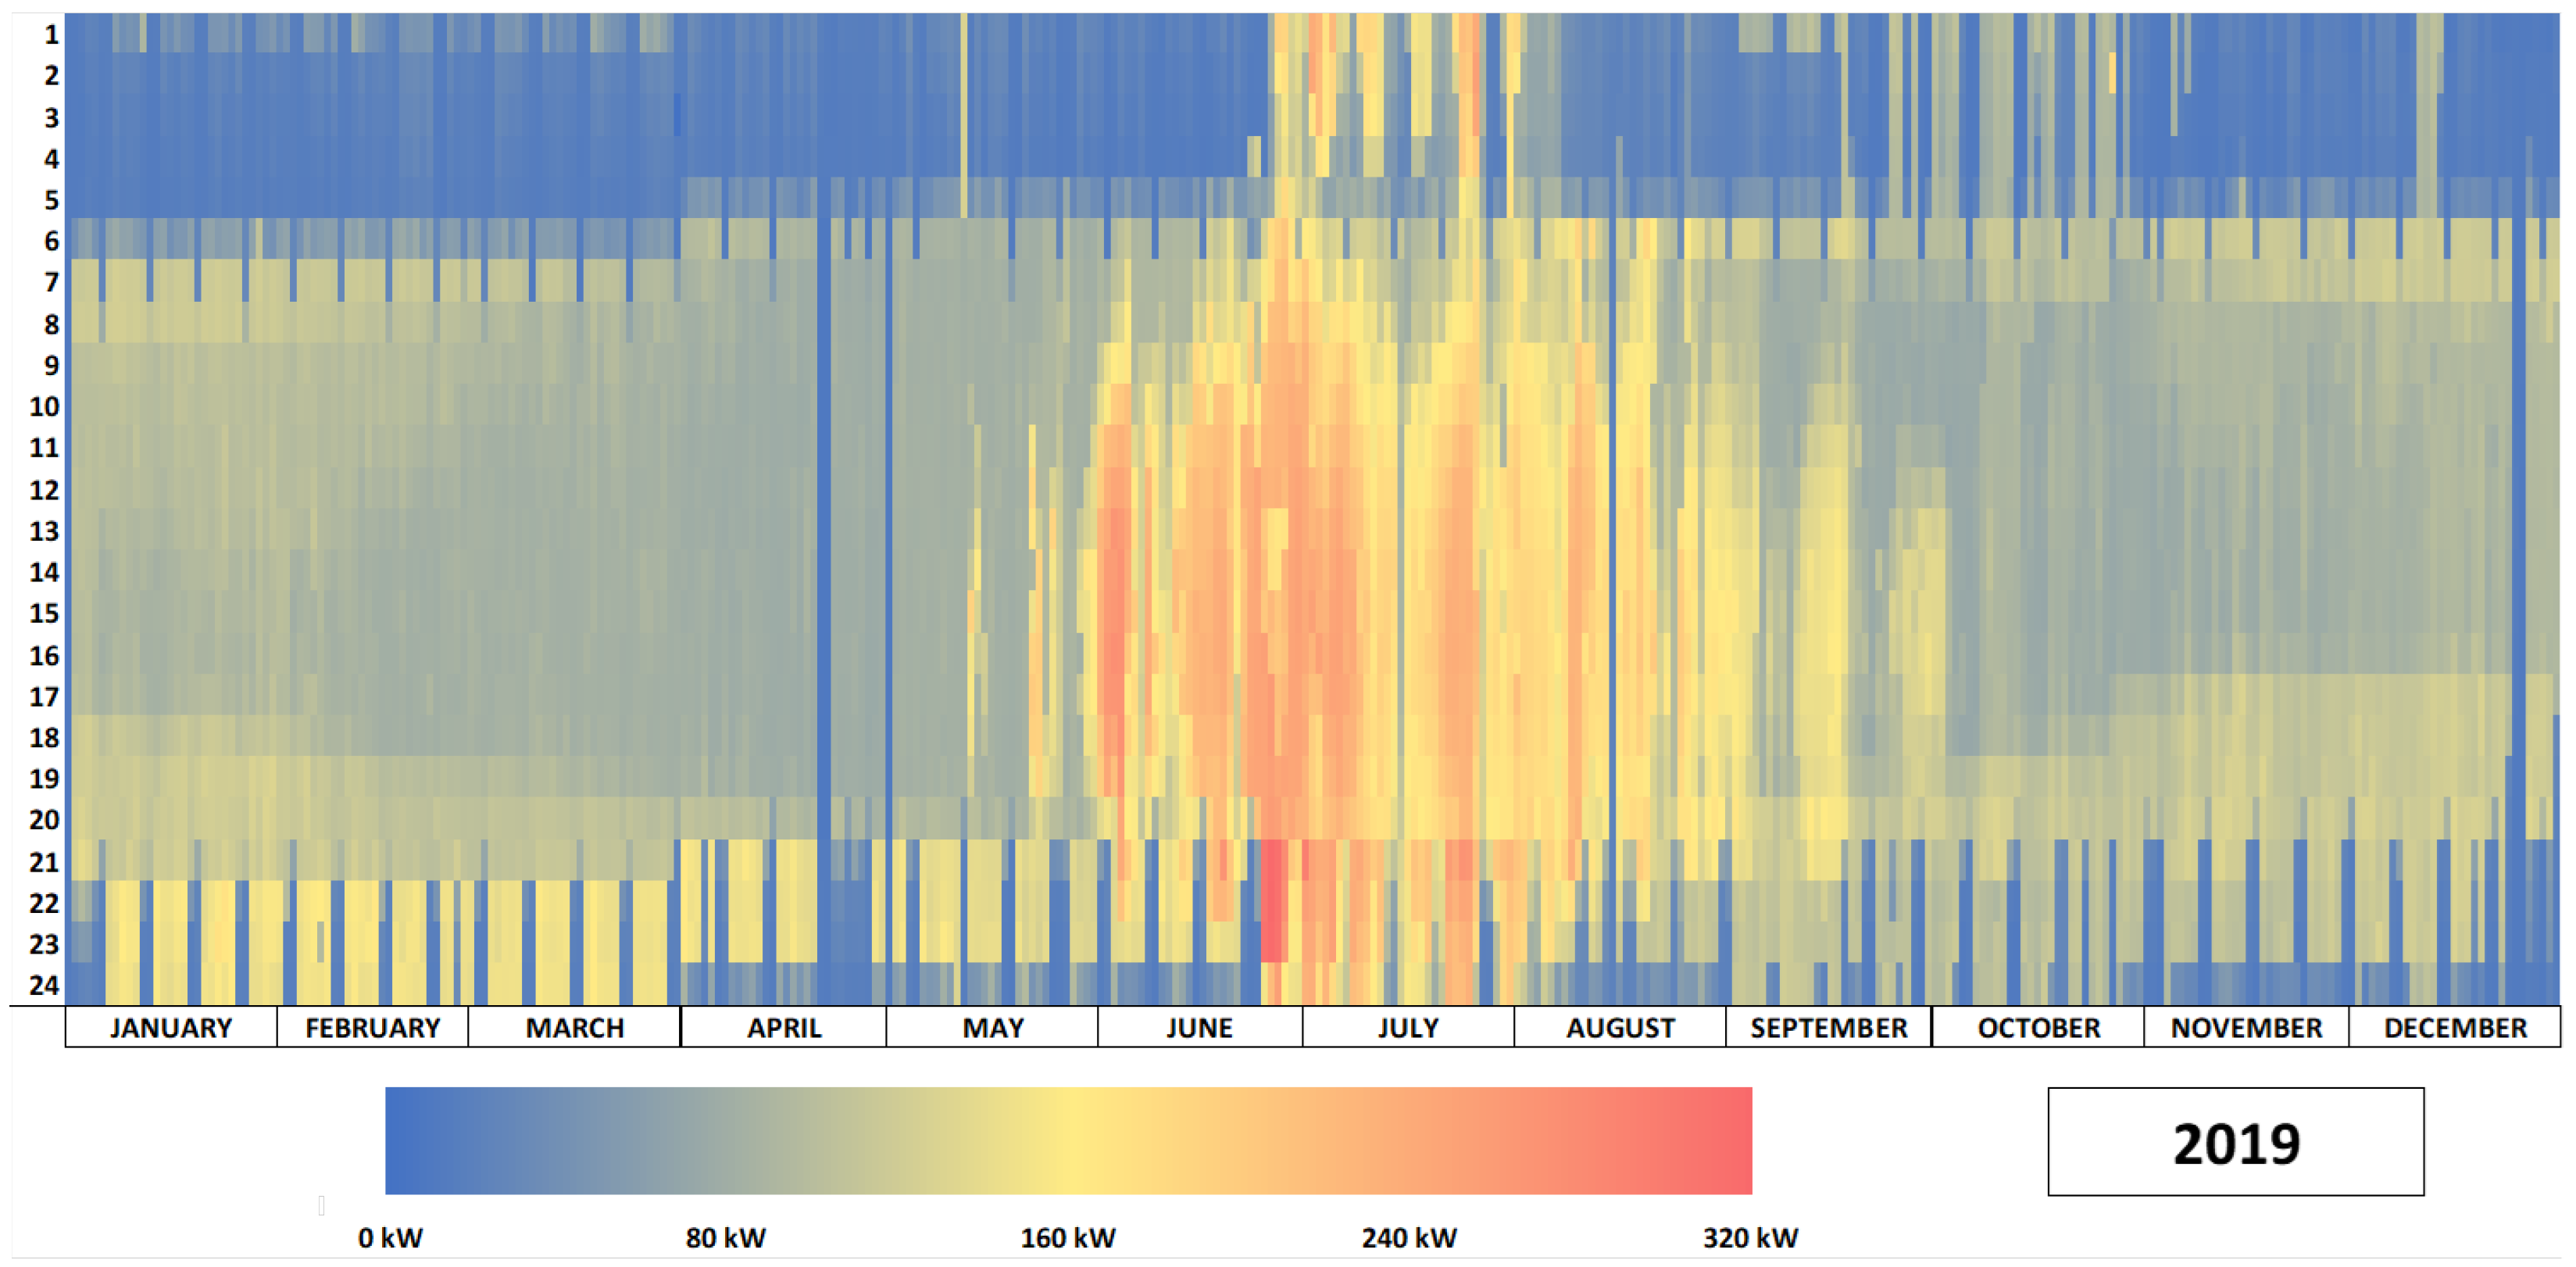
Figure 3.
Seasonal commercial loads during a typical week.
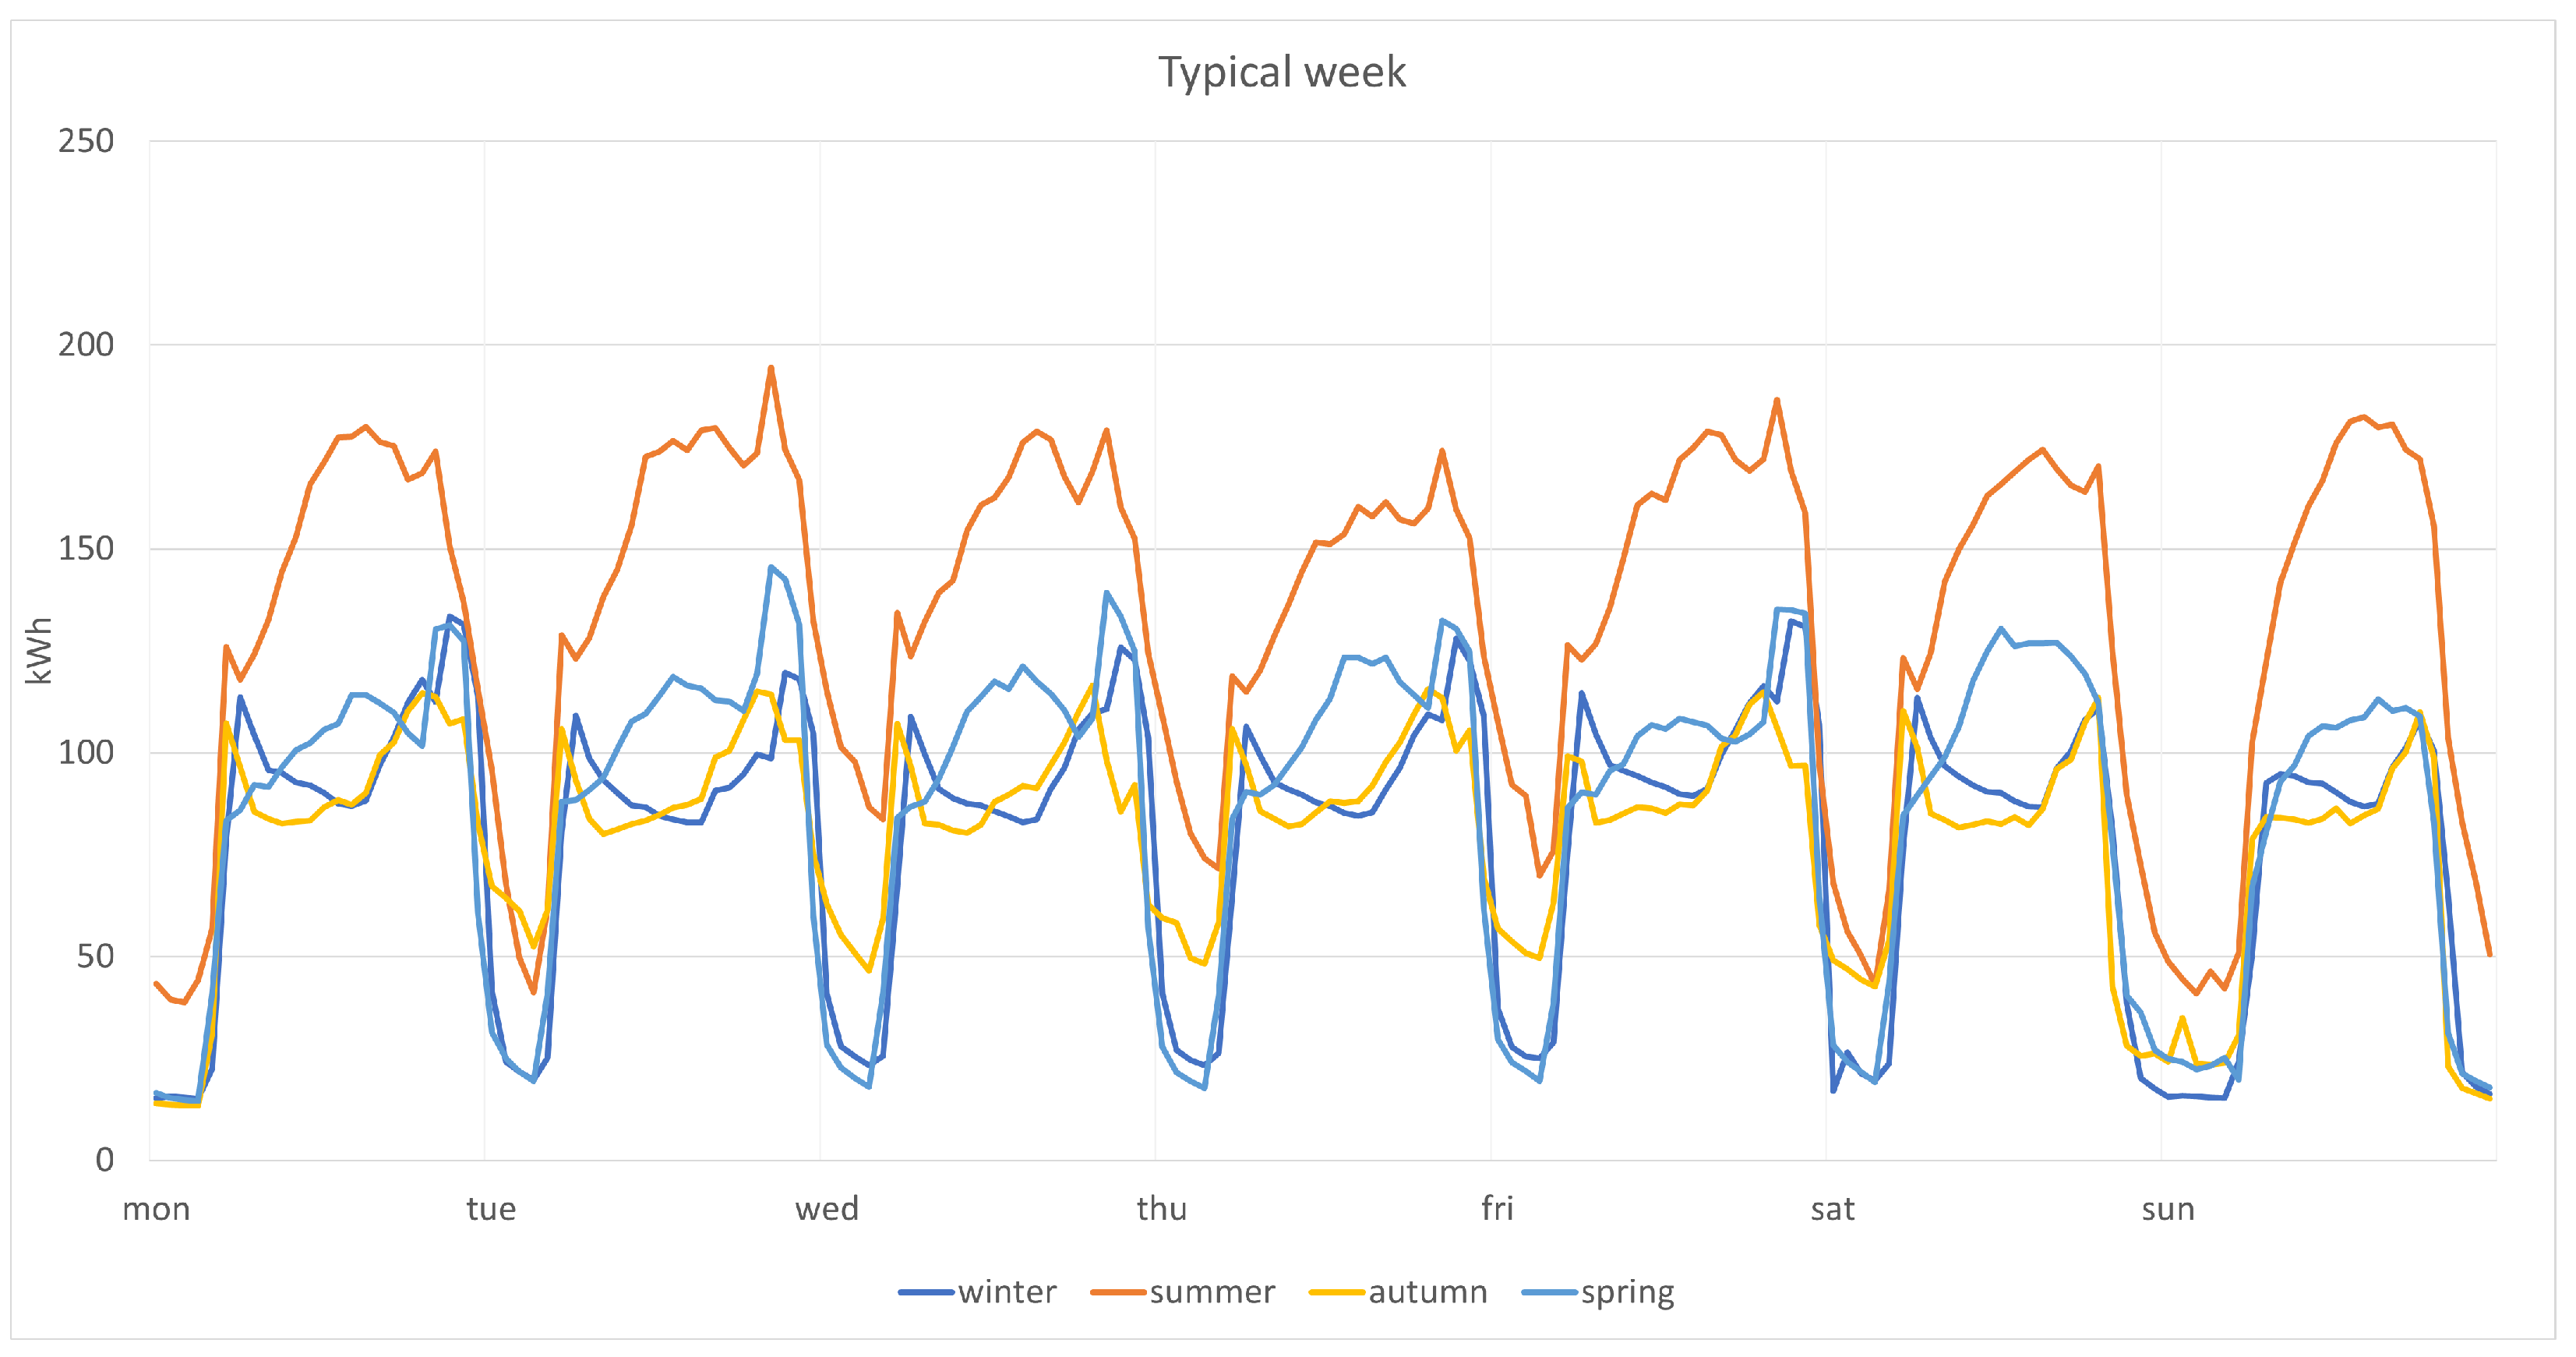
Figure 4.
Heat map corresponding to industrial loads.

Figure 5.
Seasonal industrial loads during a typical week.
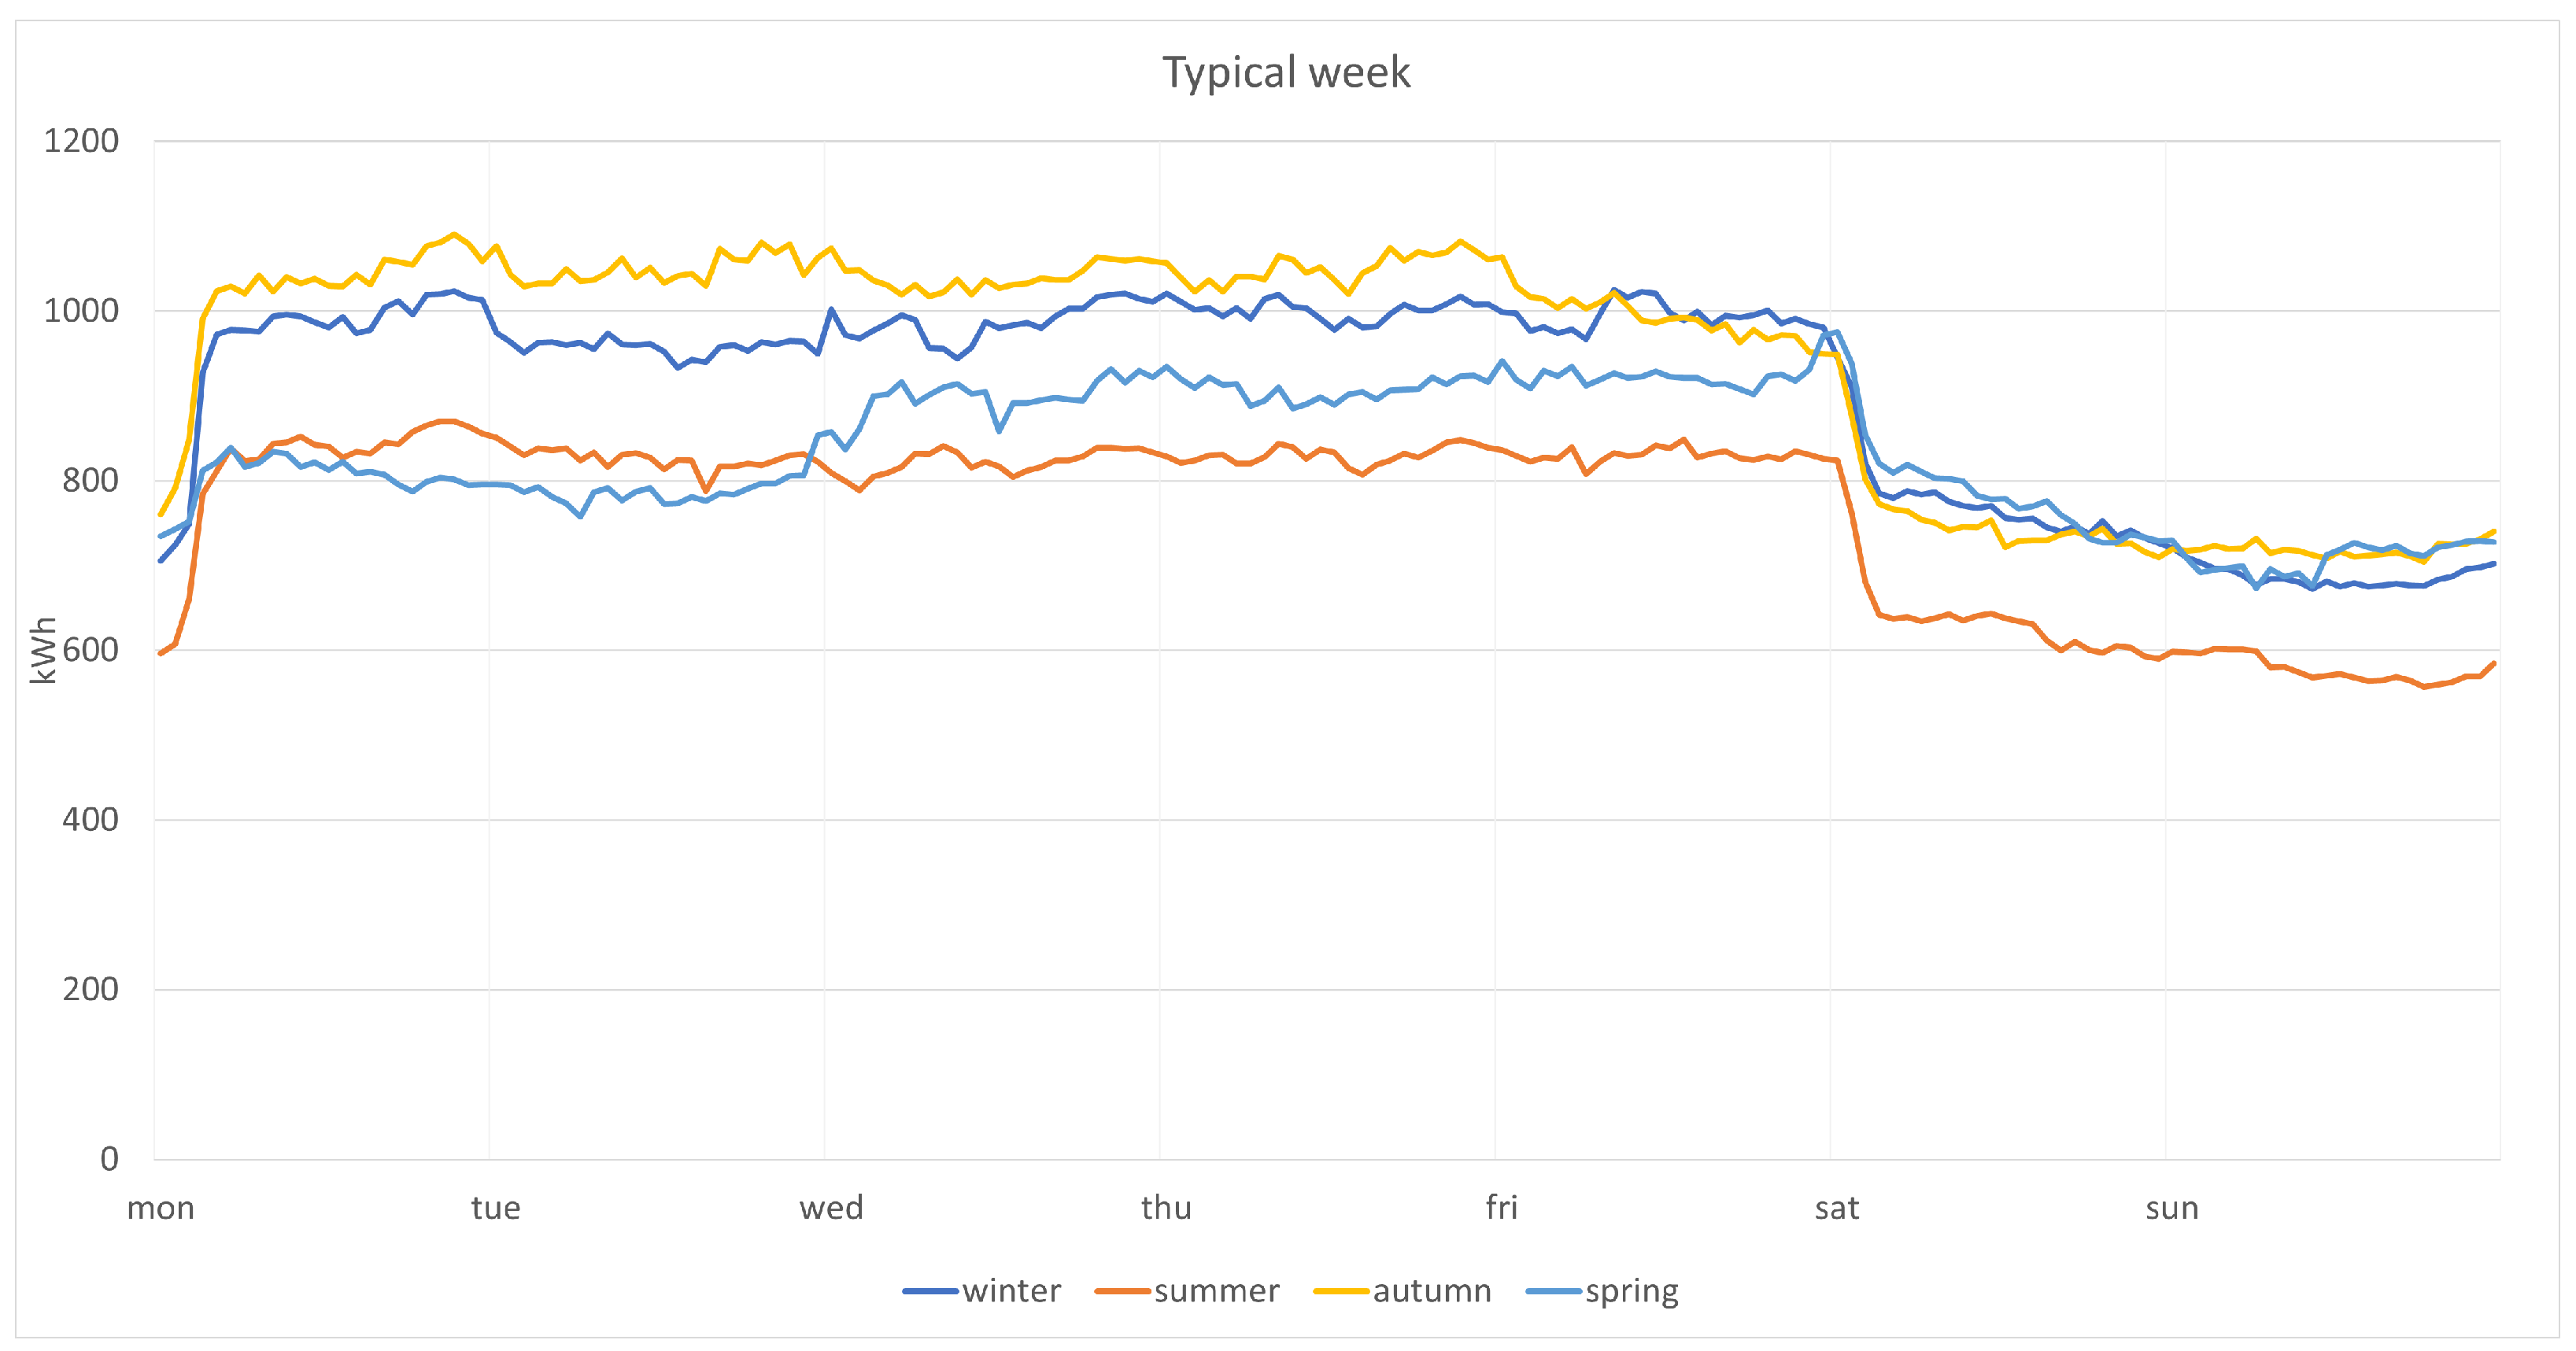
Figure 6.
BESS charge control logic.

Figure 7.
BESS discharge control logic.
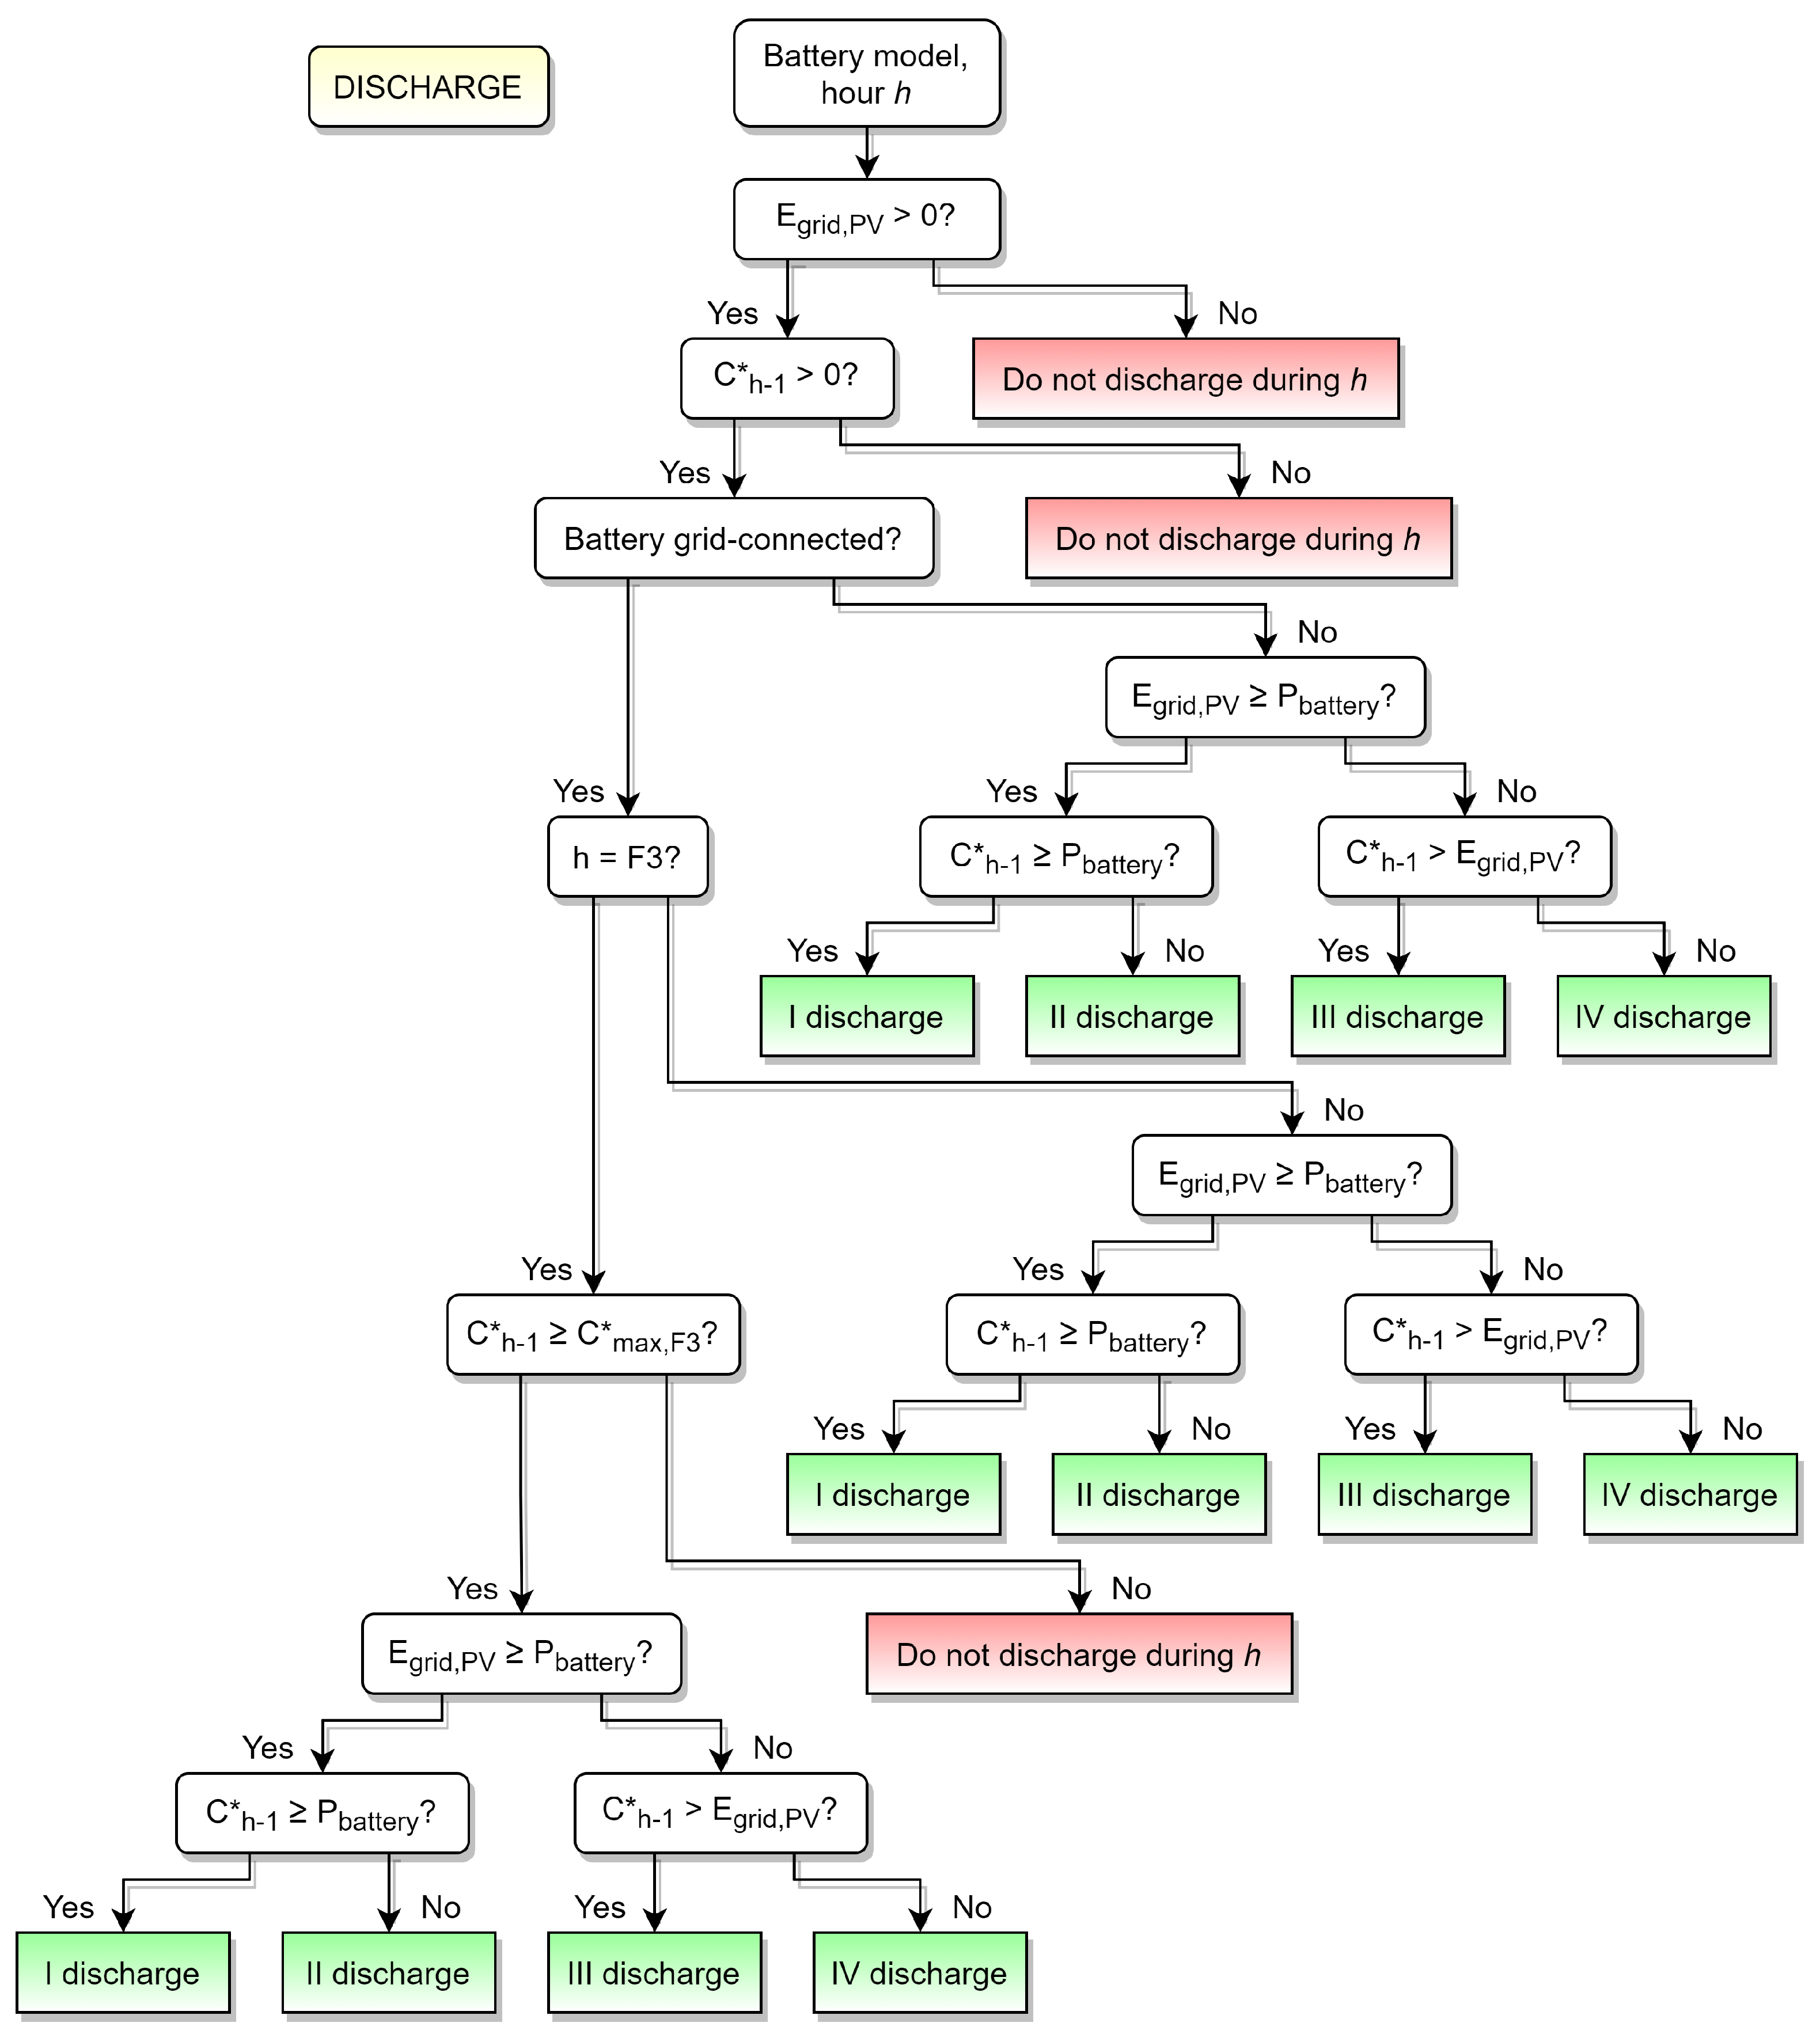
Figure 8.
Silhouette plot for the commercial load scenario.

Figure 9.
Silhouette plot for the industrial load scenario.
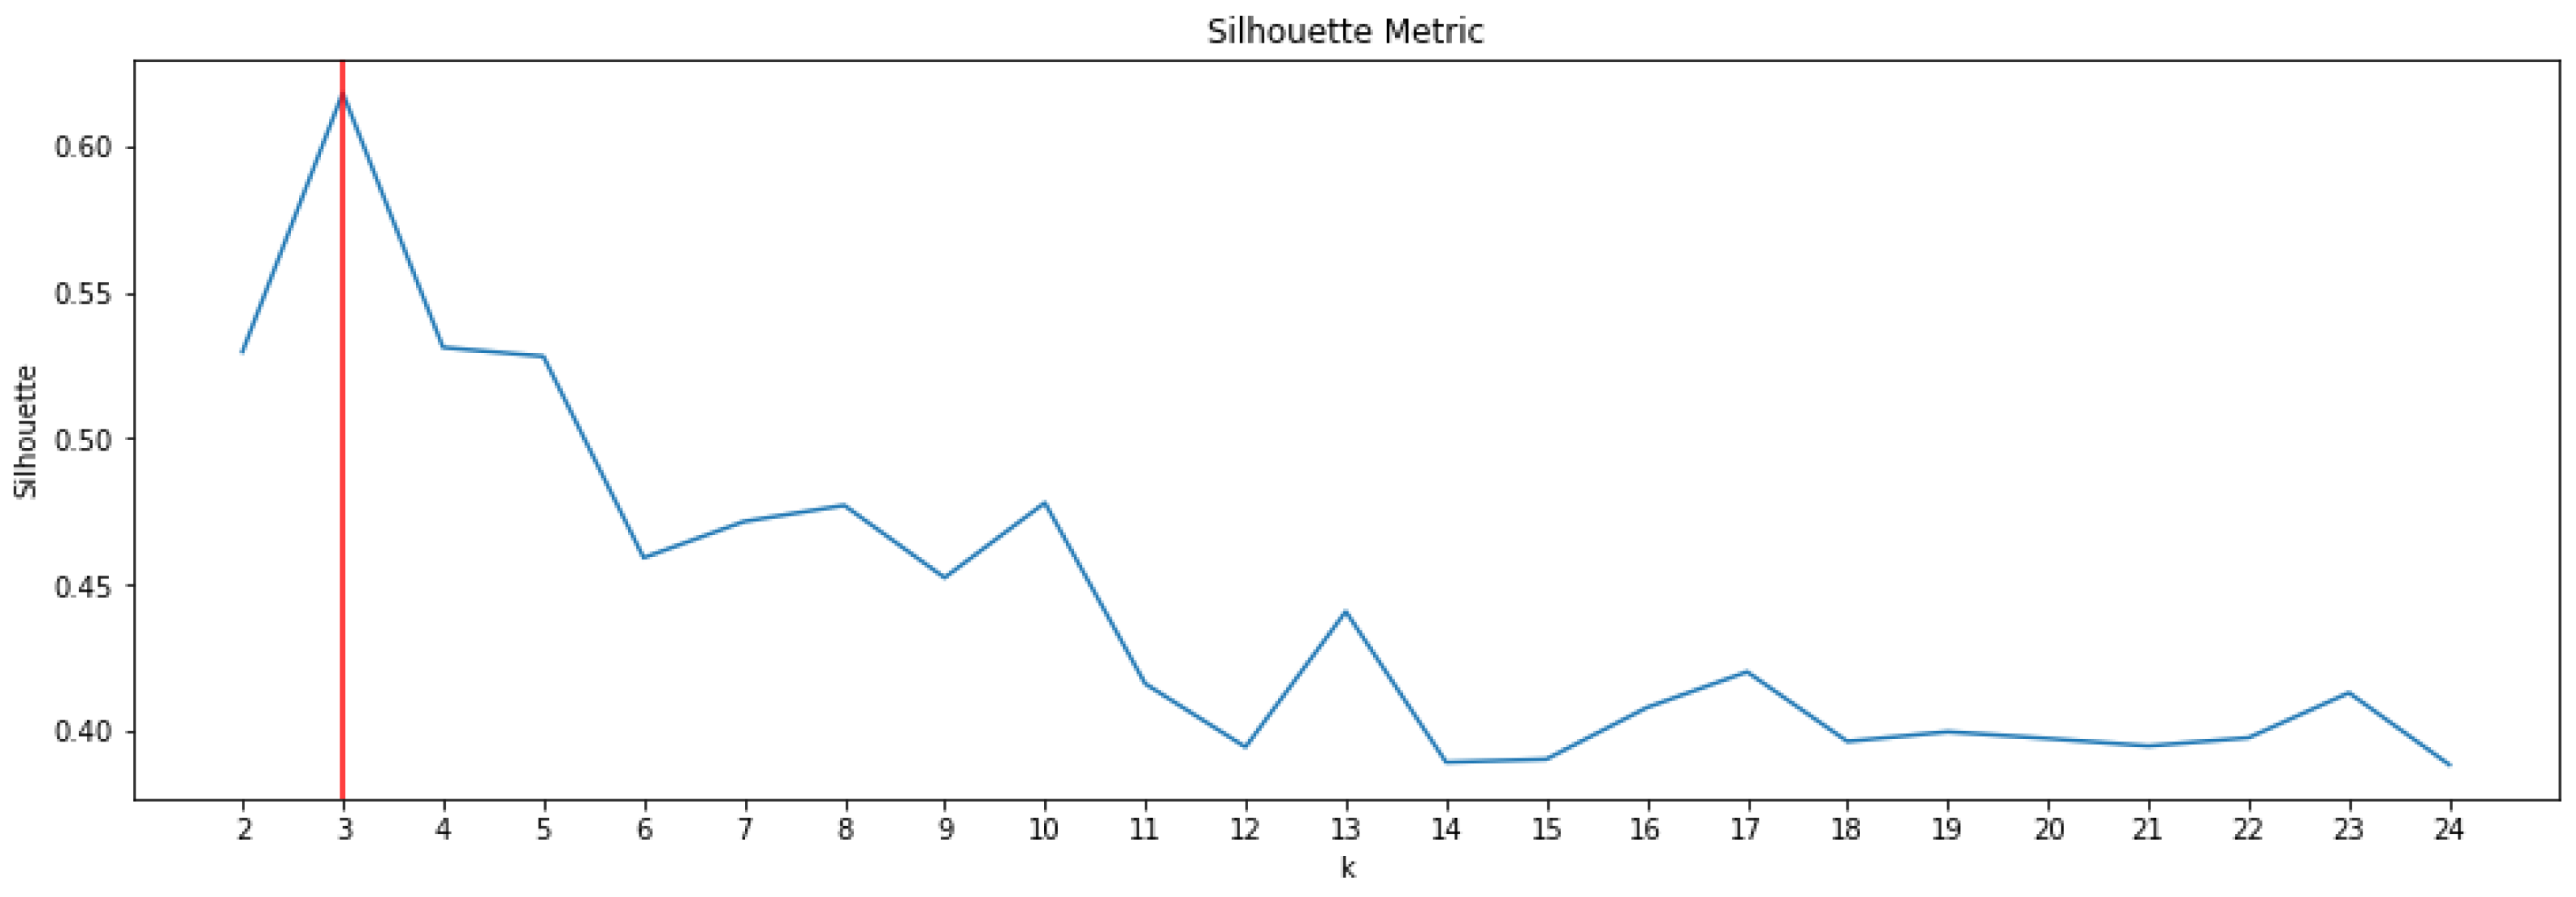
Figure 10.
Annual PR averaged in function of the PV plant configuration.
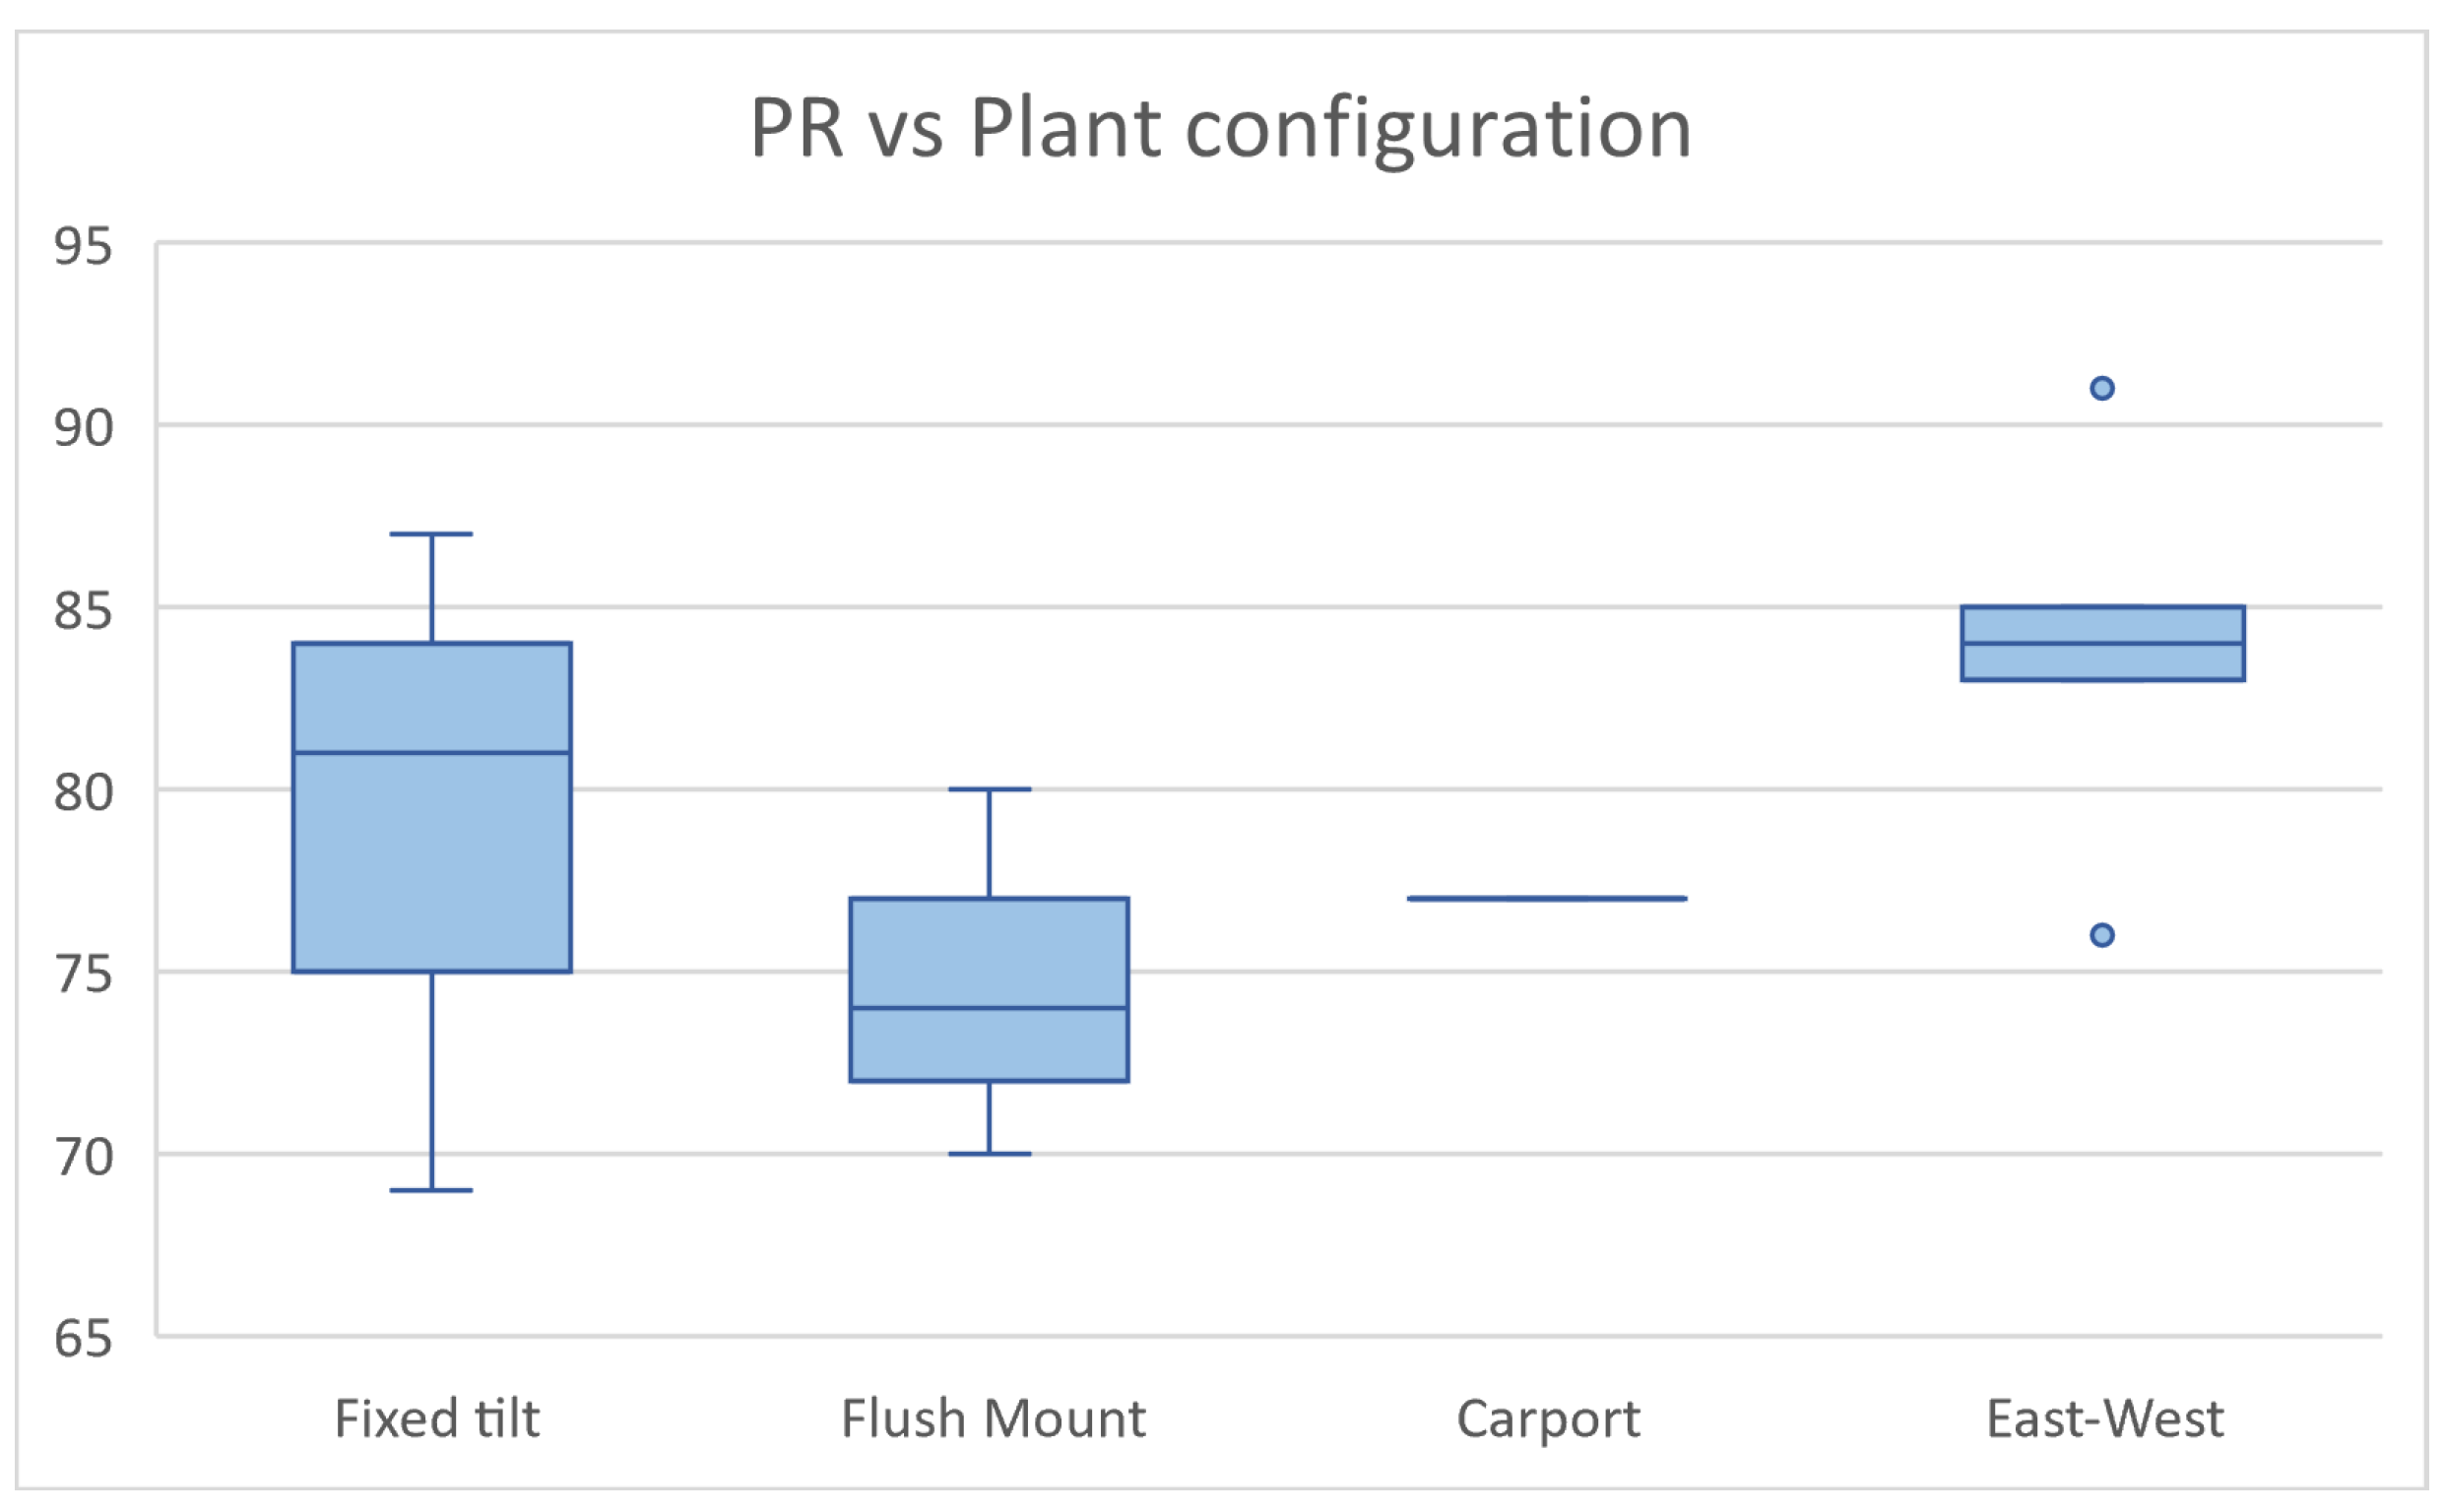
Figure 11.
Daily PR (computed on the chosen reference year) averaged over all the plants characterized by a given configuration.
Figure 11.
Daily PR (computed on the chosen reference year) averaged over all the plants characterized by a given configuration.
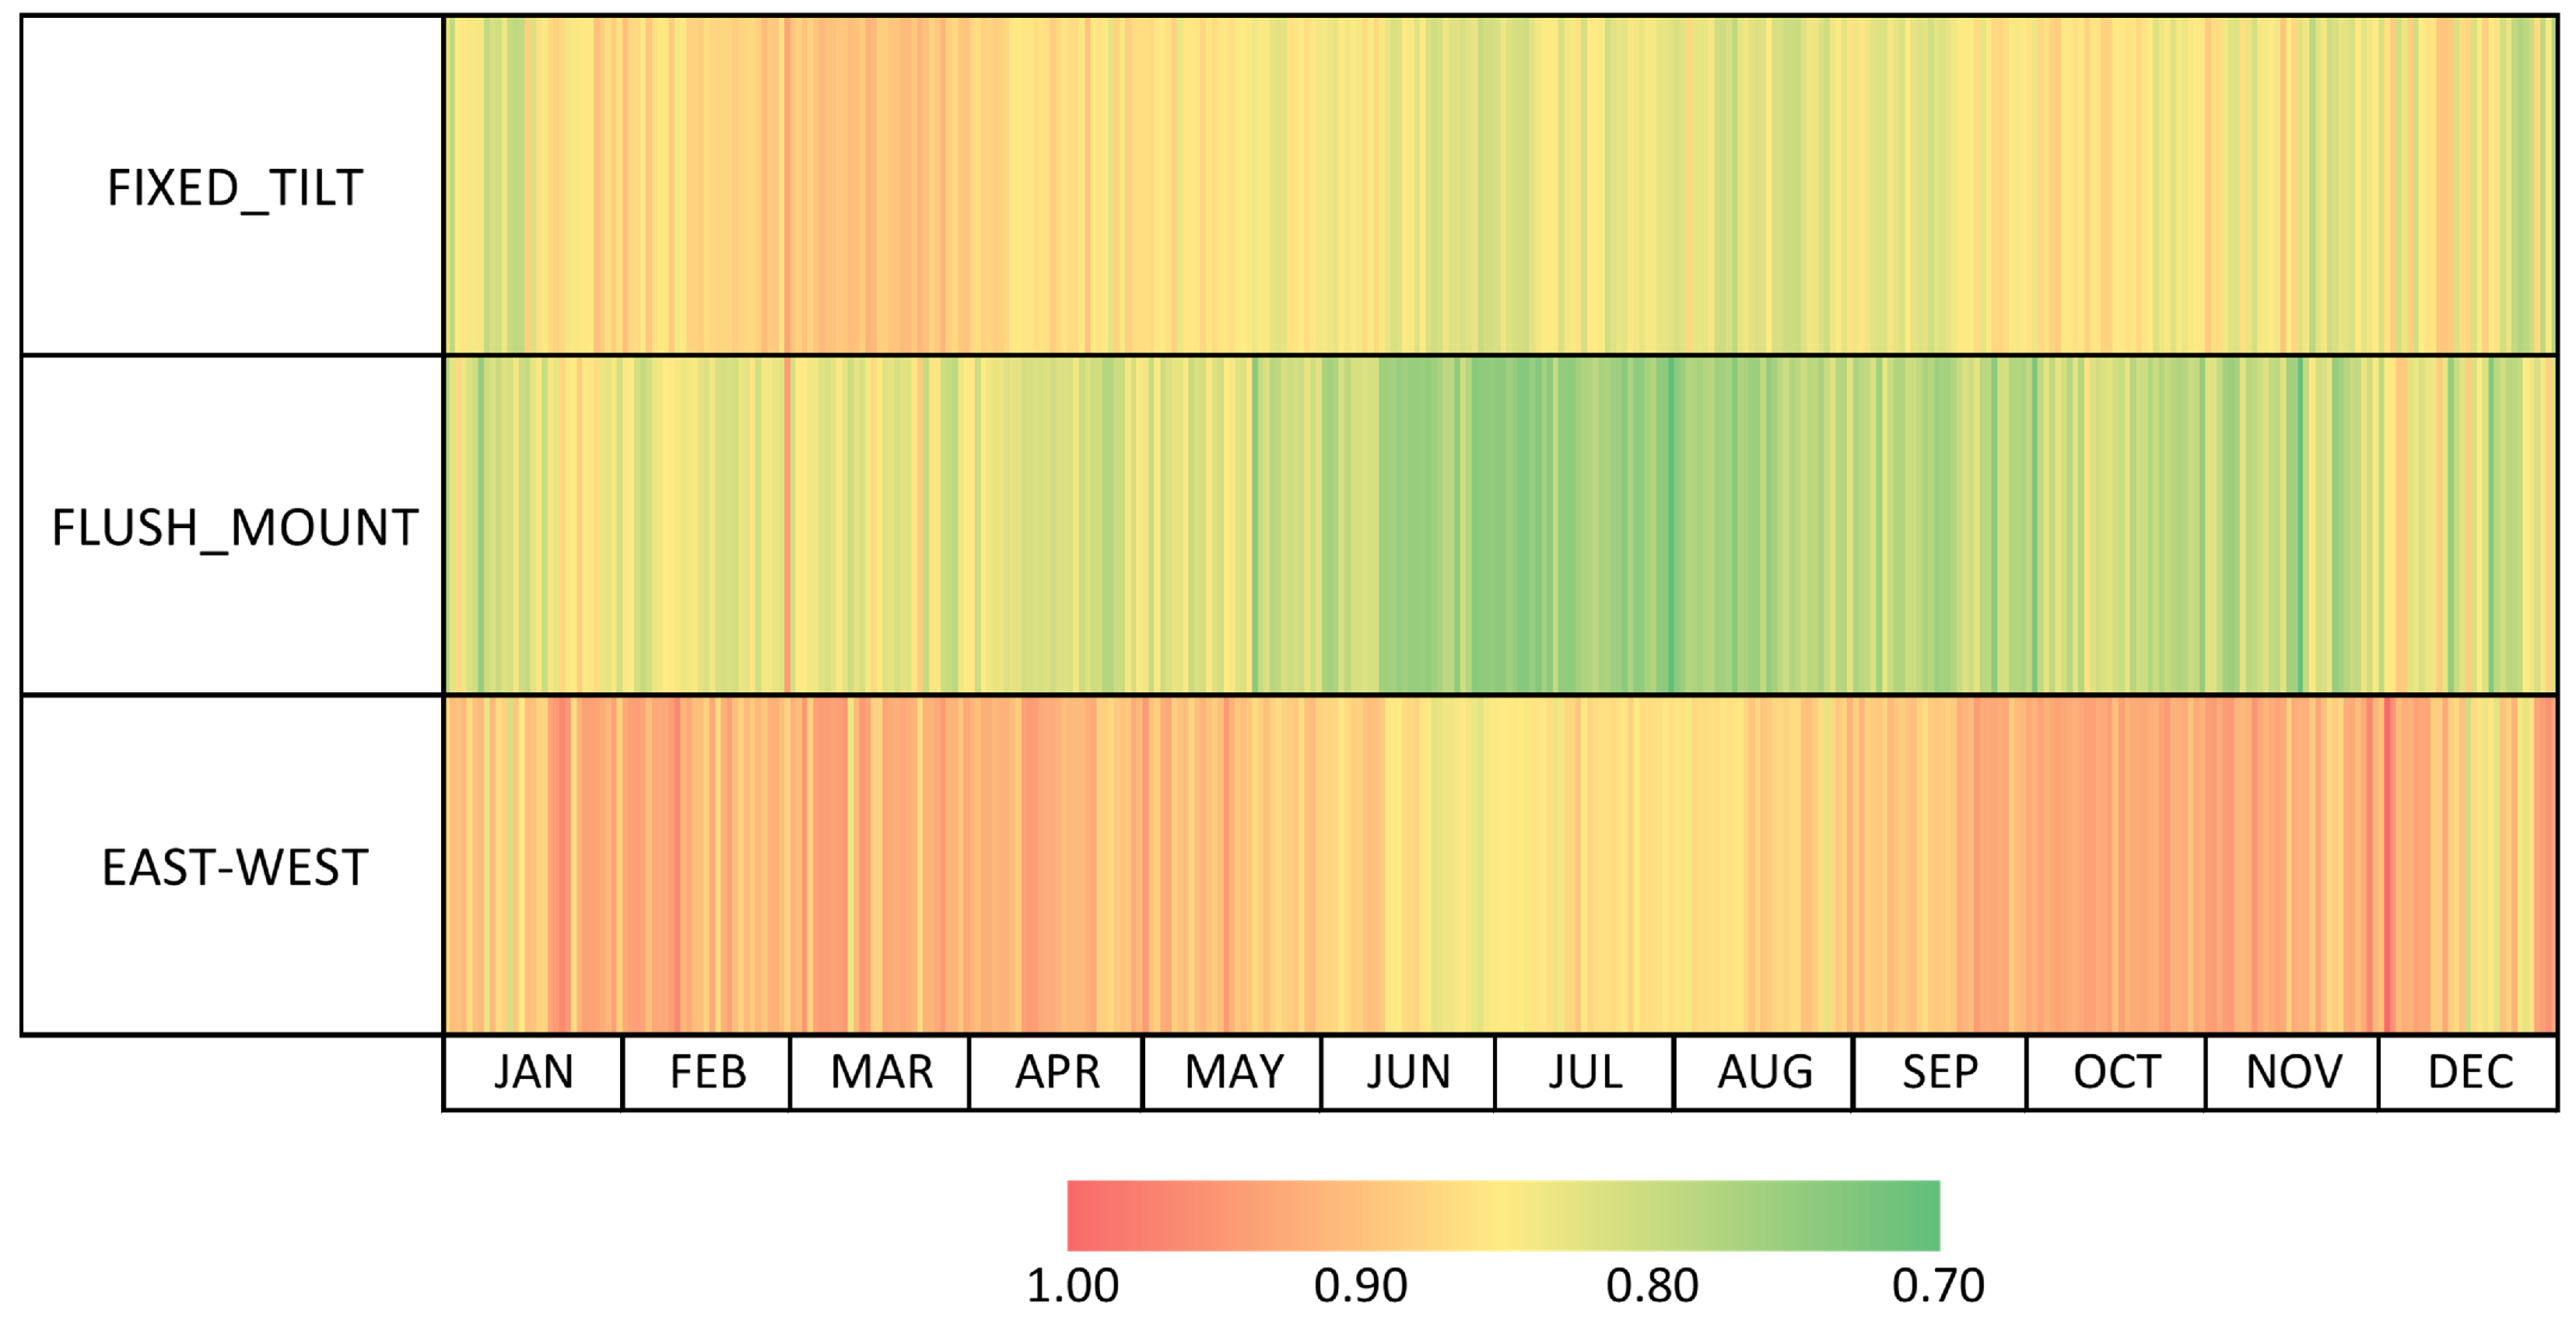
Figure 12.
Possible BESS configurations divided in clusters (commercial load).
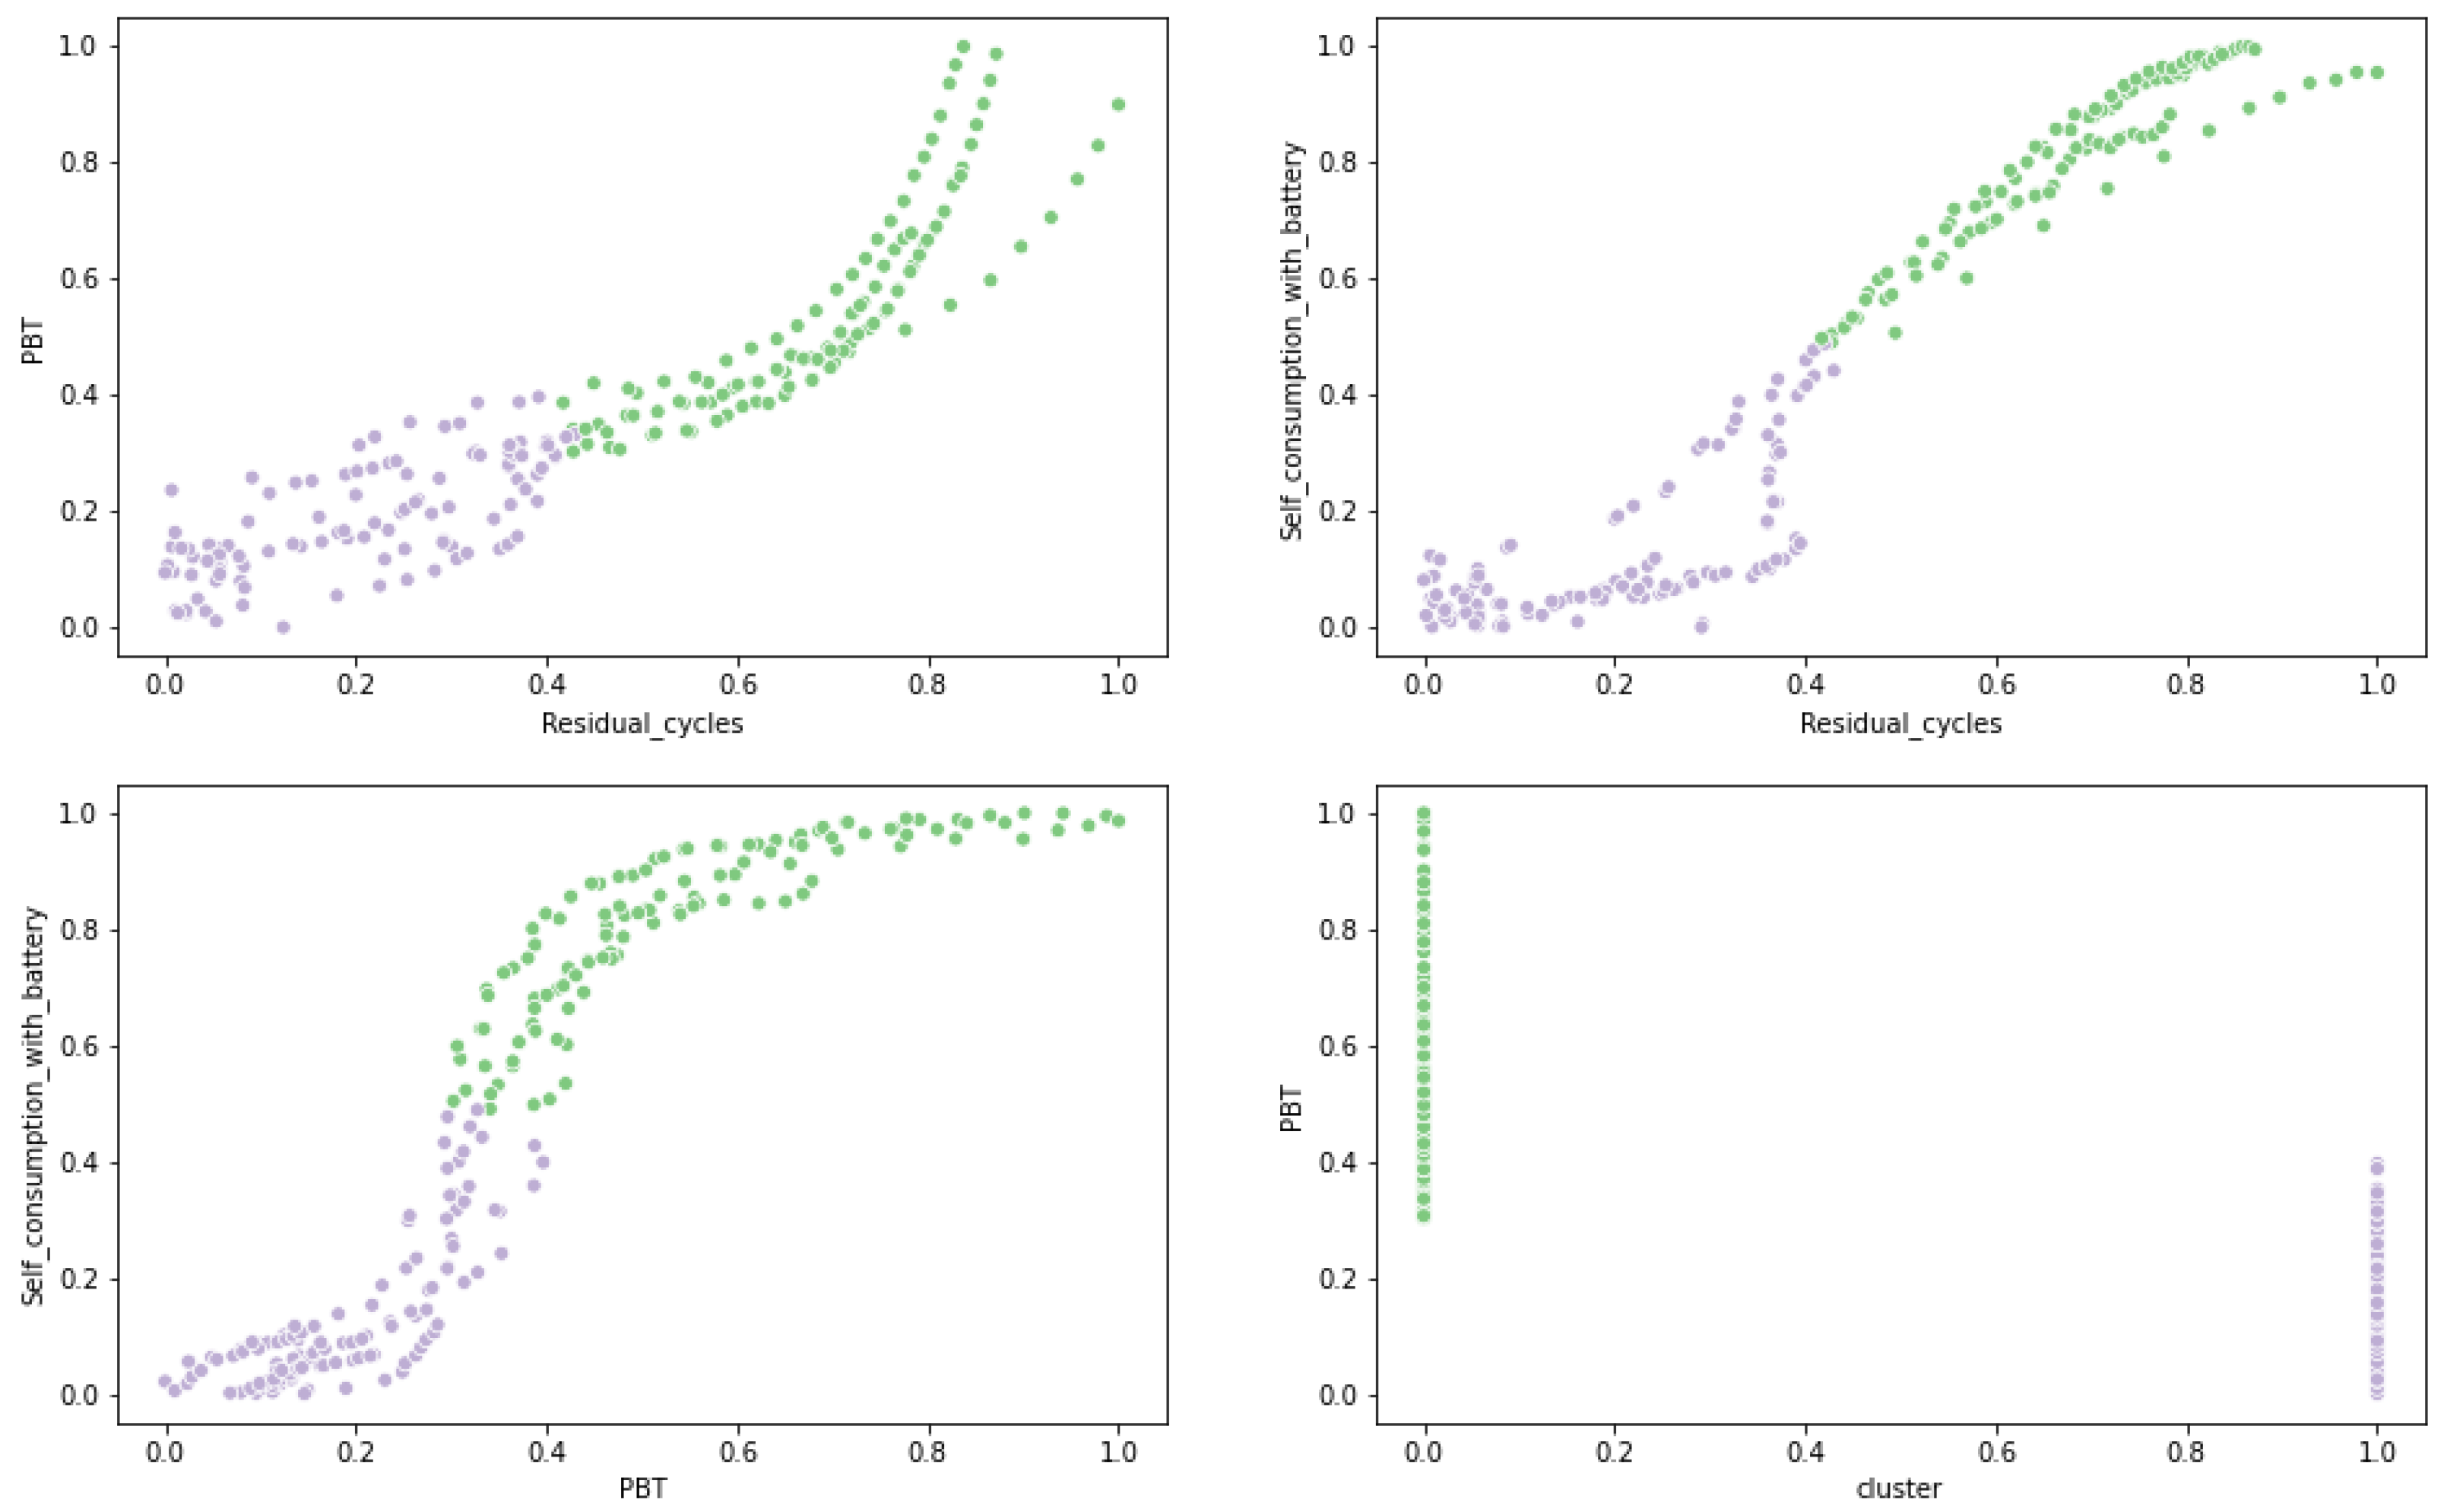
Figure 13.
Possible BESS configurations divided in clusters (industrial load).

Table 1.
New PV plants characteristics: (a) fixed tilt; (b) flush-mount; (c) East-West.
| (a) | ||||
| Exposure | Fixed Tilt | |||
| P | Tilt | Azimuth | ||
| [kWp] | [deg] | [deg] | ||
| Commercial | 1 | 500 | 30 | 0 |
| 2 | - | - | - | |
| Industrial | 1 | 2000 | 30 | 0 |
| 2 | - | - | - | |
| (b) | ||||
| Exposure | Flush Mount | |||
| P | Tilt | Azimuth | ||
| [kWp] | [deg] | [deg] | ||
| Commercial | 1 | 250 | 10 | 45 |
| 2 | 250 | 10 | −45 | |
| Industrial | 1 | 1000 | 10 | 45 |
| 2 | 1000 | 10 | −45 | |
| (c) | ||||
| Exposure | East-West | |||
| P | Tilt | Azimuth | ||
| [kWp] | [deg] | [deg] | ||
| Commercial | 1 | 250 | 10 | 90 |
| 2 | 250 | 10 | −90 | |
| Industrial | 1 | 1000 | 10 | 90 |
| 2 | 1000 | 10 | −90 | |
Table 2.
List of battery models considered and corresponding characteristics (extracted from data sheets).
Table 2.
List of battery models considered and corresponding characteristics (extracted from data sheets).
| Battery | Capacity [kWh] | P [kW] | Efficiency [%] | Technology | Max Series | Price [€/kWh] |
|---|---|---|---|---|---|---|
| SonnenBatterie 10/11 | 10 | 4.6 | 0.98 | LiFePo | 9 | 650 |
| SonnenBatterie10/27.5 | 25 | 4.6 | 0.98 | LiFePo | 9 | 650 |
| Tesla PowerPack | 232 | 130 | 0.89 | N.A. | 20 | 600 |
| LG Chem R1000 M48189P3B | 166.4 | 102 | 0.96 | Li-ion NMC | 30 | 500 |
| LG Chem R1000 M48126P3B | 110.9 | 135 | 0.96 | Li-ion NMC | 30 | 500 |
| LG Chem R800 M48189P3B | 137 | 84 | 0.96 | Li-ion NMC | 30 | 500 |
| LG Chem R800 M48126P3B | 91.3 | 112 | 0.96 | Li-ion NMC | 30 | 500 |
| Pylontech Force H1 | 24.9 | 5 | 0.96 | LiFePo | 1 | 500 |
| Pylontech Force H2 | 14.2 | 2.8 | 0.96 | LiFePo | 1 | 500 |
| Kokam high energy rack | 139 | 75 | 0.95 | Li-ion | 30 | 600 |
| Kokam high energy 2P20S | 13.9 | 7.5 | 0.95 | Li-ion | 12 | 600 |
| Kokam high power 2P20S | 11.5 | 12.5 | 0.95 | Li-ion | 12 | 600 |
| Kokam ultra-high power 2P20S | 10.2 | 11.1 | 0.95 | Li-ion | 12 | 600 |
| BYD B-Box LVS | 15.4 | 12 | 0.95 | LiFePo | 16 | 450 |
Table 3.
Notation adopted in decision-tree-like structures defining BESS charge and discharge control logic.
Table 3.
Notation adopted in decision-tree-like structures defining BESS charge and discharge control logic.
| Symbol | Unit | Description |
|---|---|---|
| h | h | Analyzed hour |
| h-1 | h | Previous hour |
| C | kWh | Nominal capacity of the battery |
| P | kW | Nominal power of charge and discharge |
| P | % | Power losses during charge and discharge |
| C* | kWh | Battery capacity at the analyzed hour |
| C* | kWh | Battery capacity at the previous hour |
| C* | kWh | Maximum capacity allowed with grid charging |
| E | kWh | PV energy that remains available for storage at the |
| analyzed hour | ||
| E | kWh | PV energy injected to the grid at the |
| analyzed hour | ||
| E | kWh | Load demand after instantaneous self-consumption |
| that is requested from the battery at the analyzed hour | ||
| E | kWh | Load demand after self-consumption that is requested |
| from the grid at the analyzed hour |
Table 4.
Location, type of installation and annual Performance Ratio for each of the considered PV facilities.
Table 4.
Location, type of installation and annual Performance Ratio for each of the considered PV facilities.
| Plant Name | Location | Installation Type | Annual PR [%] |
|---|---|---|---|
| 01_TARANTO | South | Fixed tilt | 74 |
| 02_PALERMO | Islands | Fixed tilt | 84 |
| 03_CUNEO | North-West | Flush Mount | 80 |
| 04_CAGLIARI | Islands | Carport | 77 |
| 05_CASAMASSIMA | South | Fixed tilt | 81 |
| 06_SAN ROCCO AL PORTO | North-West | Fixed tilt | 74 |
| 07_SERIATE | North-West | Fixed tilt | 79 |
| 08_LISSONE | North-West | Fixed tilt | 76 |
| 09_VICENZA_01 | North-East | Flush Mount | 70 |
| 10_VICENZA_02 | North-East | Fixed tilt | 86 |
| 11_CASALECCHIO DI RENO | North-East | Fixed tilt | 75 |
| 12_PALERMO FORUM | Islands | Flush Mount | 74 |
| 13_MESAGNE | South | East-West | 91 |
| 14_CURNO | North-West | East-West | 85 |
| 15_ROZZANO | North-West | East-West | 83 |
| 16_VERONA | North-East | East-West | 84 |
| 17_SAVIGNANO SUL RUBICONE | North-East | Fixed tilt | 87 |
| 18_ROMA | Center | East-West | 76 |
| 19_SANTA CATERINA | South | Fixed tilt | 84 |
| 20_S. GIOVANNI TEATINO | South | Fixed tilt | 81 |
| 21_CARUGATE | North-West | Fixed tilt | 69 |
| 22_SOLBIATE ARNO | North-West | Fixed tilt | 84 |
Table 5.
BESS configurations with minimum PBT.
| Commercial | Industrial | |||||
|---|---|---|---|---|---|---|
| Fixed Tilt | Flush Mount | East-West | Fixed Tilt | Flush Mount | East-West | |
| Model | Kokam ultra-high | Sonnen | Kokam ultra-high | LG Chem R800 | Kokam ultra-high | Kokam high |
| power 2P20S | Batterie10/11 | power 2P20S | M48126P3B | power 2P20S | energy rack | |
| N modules | 2 | 2 | 2 | 5 | 5 | 5 |
| Residual cycles | 960 | 945 | 991 | 980 | 408 | 443 |
| Self-consumption [%] | 55 | 58 | 59 | 74 | 80 | 79 |
| Coverage [%] | 44 | 43 | 44 | 28 | 26 | 26 |
| PBT [y] | 14.5 | 14.5 | 14.6 | 14.3 | 18.7 | 18.3 |
Table 6.
BESS configurations with minimum number of residual cycles.
| Commercial | Industrial | |||||
|---|---|---|---|---|---|---|
| Fixed Tilt | Flush Mount | East-West | Fixed Tilt | Flush Mount | East-West | |
| Model | Kokam high | Kokam high | Kokam high | BYD B-Box | BYD B-Box | BYD B-Box |
| power 2P20S | power 2P20S | power 2P20S | LVS | LVS | LVS | |
| N modules | 10 | 7 | 3 | 2 | 9 | 12 |
| Residual cycles | 22 | 33 | 45 | 2 | 16 | 1 |
| Self-consumption [%] | 58 | 60 | 59 | 74 | 80 | 83 |
| Coverage [%] | 45 | 44 | 44 | 28 | 26 | 27 |
| PBT [y] | 20.5 | 23.7 | 21.4 | 16.8 | 25.9 | 51.6 |
Publisher’s Note: MDPI stays neutral with regard to jurisdictional claims in published maps and institutional affiliations. |
© 2021 by the authors. Licensee MDPI, Basel, Switzerland. This article is an open access article distributed under the terms and conditions of the Creative Commons Attribution (CC BY) license (https://creativecommons.org/licenses/by/4.0/).
Share and Cite
MDPI and ACS Style
Nespoli, A.; Matteri, A.; Pretto, S.; De Ciechi, L.; Ogliari, E. Battery Sizing for Different Loads and RES Production Scenarios through Unsupervised Clustering Methods. Forecasting 2021, 3, 663-681. https://doi.org/10.3390/forecast3040041
AMA Style
Nespoli A, Matteri A, Pretto S, De Ciechi L, Ogliari E. Battery Sizing for Different Loads and RES Production Scenarios through Unsupervised Clustering Methods. Forecasting. 2021; 3(4):663-681. https://doi.org/10.3390/forecast3040041
Chicago/Turabian StyleNespoli, Alfredo, Andrea Matteri, Silvia Pretto, Luca De Ciechi, and Emanuele Ogliari. 2021. "Battery Sizing for Different Loads and RES Production Scenarios through Unsupervised Clustering Methods" Forecasting 3, no. 4: 663-681. https://doi.org/10.3390/forecast3040041