On Generalized Slash Distributions: Representation by Hypergeometric Functions

Department of Statistics, Institute of Exact Sciences, University of Brasília, 70910-900 Brasília, Brazil
Stats 2019, 2(3), 371-387; https://doi.org/10.3390/stats2030026
Submission received: 31 May 2019
/
Revised: 25 June 2019
/
Accepted: 9 July 2019
/
Published: 19 July 2019
Abstract
:The popular concept of slash distribution is generalized by considering the quotient Z = X/Y of independent random variables X and Y, where X is any continuous random variable and Y has a general beta distribution. The density of Z can usually be expressed by means of generalized hypergeometric functions. We study the distribution of Z for various parent distributions of X and indicate a possible application in finance.
1. Introduction
A random variable Z follows a slash distribution if it can be generated as Z = X/U1/q, where X and U are independent random variables and U is uniformly distributed over (0,1). This term leads back to [1], where the authors considered the case in which the distribution of X, the so-called parent distribution, was normal. The slash distribution is particularly useful when models with heavy tails are necessary to fit a real data set. This simple concept has launched a remarkable creativity among researchers. In the last decade, slash distributions for many other parent distributions have been studied, for example, for the epsilon half-normal [2], for the skew-normal distribution [3], for the logistic distribution [4,5], and for the Birnbaum–Saunders distribution [6]. In [7,8] are considered modifications of the slash distribution, dividing the variable X by a variable with exponential or specific gamma distribution. A strong generalization of the concept was presented in [9], where a variable with elliptical distribution is divided by one with a beta distribution.
In the present article, we examine the distribution of X/Y, where X may be any continuous random variable and Y is a beta distributed variable, independent from X.
This distribution will be called a beta divided slash distribution (BDSL distribution). We will represent densities, distribution functions, and moments by hypergeometric or other special functions. Thereby, the general theory of hypergeometric functions becomes available for the study of a wide class of slash distributions. Several slash distributions known in the literature arise as special cases of BDSL distributions, and can thus be presented in a compact form.
In the next section, we define the generalized slash distribution and study in detail the case with the normal parent distribution. In Section 3, the generalized slash distribution for some other parent distributions is studied. In Section 4, we apply some of the newly introduced models to fit financial data of current importance. In Section 5, some stochastic simulations are performed. Finally, Section 6 indicates some possible generalizations and concluding remarks.
2. The Beta Divided Slash Distribution
Let X, Y be independent continuous random variables with densities f and g. Assume that Y has a beta distribution, that is, the density is given by for 0 ≤ y ≤ 1 where is the beta function and α,β > 0. We define the beta divided slash distribution (generated by the distribution of X) as the distribution of the quotient Z = X/Y. We will use the short notation BDSL distribution. The case β = 1 will be called the standard slash.
Theorem 1.
The density of the r.v. Z is
Proof.
Defining the variables Z = X/Y and W = Y, yields X = ZW, Y = W, the joint probability distribution of (Z,W) is h(zw) = f(zw) g(w) , where
denotes the Jacobian of the transformation. The marginal distribution of Z is thus
For β = 1, we get the density of the standard slash distribution, see, for example, [4] (p. 112, Equation (2)). For the limiting case β = 0, the density h(z) in Theorem 1 reduces to that of X. Note that for a random variable Y with beta distribution, we have for any α and c with α > 0, 0 < c < 1. Thus, Y converges in probability to the degenerate r.v. Y = 1 if β tends to zero. Thus, the density of Z = X/Y converges to that of X.
In order to generate a BDSL distribution, we make use of the generalized hypergeometric functions defined for a complex number z by
where denotes the Pochhammer symbol, satisfying n(k) = n(n+1)· ··(n+k−1) when k is a positive integer. The specific case of (1) with p = 2 and q = 1 is known as the ordinary or Gauss hypergeometric function. Many elementary functions can be expressed as hypergeometric functions, see, for example, [10]; the most trivial case arises in the absence of parameters, then (1) yields 0F0(-; -; z) = ez. The function (1) converges for all complex z with p < q + 1. In the case of p = q + 1, it converges for |z| < 1, but analytic continuation to the complex plane is possible. For p > q + 1, the series (1) diverges, see, for example, [11]. In the present article, only the cases with p ≤ q + 1 will arise. By representing a probability density via a hypergeometric function, one accesses the powerful theory of these functions, which has applications in diverse scientific areas. Considering the steadily growing number of published probability models, it will no longer be sufficient to confine the modeling to the use of elementary functions. Hypergeometric functions can be easily calculated using adequate software like MAPLE, Matlab, or Mathematica. The increasing popularity of hypergeometric functions is also demonstrated by the development of diverse software packages to handle these functions. In the Internet, one can easily find packages for MAPLE developed by Tom H. Koornwinder and Bruno Gauthier. In the present paper, we occasionally use support of MAPLE, however, a proof is given for all essential results. An interesting feature of hypergeometric functions is that many of them can be represented by integrals. We will make use of the following general theorem due to Rainville, see [12] (p. 116). Further integral representations can be found in [13,14].
Theorem 2.
(Rainville): For any positive integer k and Re(α), Re(β) > 0, the following holds:
In order to make the theorem applicable to integrals of the type in Theorem 1, we consider the following result.
Corollary 1.
For any positive integer k and Re(α), Re(β) > 0, the following holds:
Proof.
In Theorem 2, we set t = 1, substitute α by α + 1, and multiply the resulting equation by .∎
Theorem 3.
The beta divided slash distribution generated by N(0,1) has the density
Proof.
The first equation follows from Theorem 1. Setting in the corollary p = q = 1, k = 2, c = −z2/2 and a1 = b1 = 1, we get
because the hypergeometric function simplifies by shortening equal terms in the quotient of (1), that is, it holds that p+1Fq+1(c,a1,…ap; c,a1,…bq;x) = pFq(a1, … ap; a1, … bq;x). The last equation yields the statement (after multiplying by 1/).∎
In particular, the expression in Theorem 3 serves as a more compact form for the density (10) in [9] (p. 221). The beta divided slash distribution generated by N(0,1) will be denoted by BDSL(α, β)(N(0,1)). Later, we will use analogous notations for other parent distributions. For the special cases β = 0 and β = 1, we obtain the standard normal distribution and the standard slash distribution. The latter is obtained from Theorem 3 as
This is the density of the standard slash distribution, which can be rewritten in various manners (usually the parameter is denoted by q in this context, see, for example, [2] (p. 233), [4] (p. 111) and [15] (p. 1). In particular, Equation (1) implies
Using this, we can express the density (2) as
It can also be written by means of the Whittaker M function [16] or by means of the lower incomplete gamma function yielding
where the latter equals the first formula in [17] (p. 4). Note that the Pareto scale mixture in this paper is identical with the standard slash distribution, because, in both cases, one divides by an r.v. with distribution Beta(α,1).
Specializing further by setting α = 1, and using the elementary transformation
Equation (2) yields the well-known canonical slash distribution, see [4] (p. 112, Equation (1))
where φ denotes the standardized normal density. An interesting property of a hypergeometric function is the relation
which allows one to determine derivatives and antiderivatives, see, for example, [18]. By using Equation (7), we obtain the cumulative distribution function corresponding to the density in Theorem 3 as
The case β = 0 yields an interesting representation of the standard normal distribution function Φ:
For β = 1, Equation (8) yields the distribution function of the standard slash distribution as
Finally, setting α = 1 gives the canonical slash distribution function as an explicit representation of Equation (5) in [4] (p. 112):
Direct integration of (6) yields the alternative representation
where φ denotes the density of the standard normal distribution. It might be interesting to observe that comparing the last two equations provides a representation for the hypergeometric function in (11).
The moments of the random variable Z in Theorem 1 can be calculated by means of the following statement.
Theorem 4.
The non-central moments of a beta divided slash distribution are given by
where the are the moments of the parent distribution.
Proof.
From the stochastic representation Z = X/Y, it follows that Z = XW, where W = 1/Y. Thus, because of the independence of X and Y, we get E(Zk) = E(Xk) E(Wk). The density of W can be easily obtained as , where f is the beta density. Thus,
It follows that for α > k. ∎
We will now determine the moments of the distribution BDSL(α,β)(N(0,1)). Because of the symmetry of the density in Theorem 3, the odd non-central moments are zero; in particular, E(Z) = 0. Thus, the central moments are identical to the non-central ones: . We obtain
In particular,
Hence, the skewness is zero and the kurtosis is
The formulas (14) and (15) yield the system
which can be used to determine moment estimators, when the moments are substituted by the corresponding sample moments. The resulting system can be easily solved for α and β.
An important shape characteristic of a beta slash distribution is given by its maximum value. From Theorem 2, one obtains this value easily as
Figure 1 shows some specific densities of the distribution BDSL(α,β)(N(0,1)). The graphics illustrate that this family of distributions offers a great flexibility when designing variations of the normal distribution is required. In particular, the normal distribution goes smoothly over into the standard slash distribution when α increases from 0 to 1. In both parts of the figure, the β values are 0, 0.5, 1, 2, and 3, where an increasing β corresponds to a decreasing maximum value. As a result of (17), two densities with parameter pairs () and () have the same maximum value if .
We now consider the limiting behavior of the BDSL distribution under parameter changes. It turns out that the densities converge to a normal distribution under different circumstances. It applies in detail:
where the limit is to be understood in the sense of a pointwise convergence of the densities.
We want to mention at this point that MAPLE can also determine the characteristic function of the BDSL(α,β)(N(0,1)), however, the formula is extremely complicated and will not be considered here.
Finally, in practical applications, it is useful to introduce location and scaling parameters into the density of Theorem 3, that is, one considers the density
having in mind that the reduced random variable has the density in Theorem 3 if and only if Z has the density (18), see, for example, [8] (eq. (4), p. 930), [19] (eq. (1.1), p. 272 and [20] (eq. (1), p. 32) and. We will apply this density in Section 4.
3. BDSL Distributions Generated by Other Parent Distributions
In the following section, we study the distribution of Z = X/Y, where X is a real or positive random variable and Y is a beta distributed variable independent of X.
3.1. BDSL Generated by Student’s t-Distribution
Student´s t-distribution has the density
where the parameter v may assume any positive value and the normalizing constant satisfies
Theorem 5.
The density of the BDSL generated by (19) and (20) is given by
Proof.
Using MAPLE, we find the following representation of the density (19) and (20) as a hypergeometric function:
(see also [18] (p. 9 below)). By setting k = 2, p = 1, q = 0, and in Corollary 1, it follows that
is equal to the expression in the statement. Theorem 1 implies that this is the required density. ∎
It might be interesting that the density in Theorem 5 can be directly determined by MAPLE, calculating the integral in Theorem 1, where the function f is given by (19) and (20). However, the result is much more complicated than the density in Theorem 5. The same holds for some other results developed in the following.
Among others, Theorem 5 yields an alternative representation of the density (11) in [9] (p. 221). For β = 1, we obtain the standard slash t-distribution as
Some specific densities of (21) are illustrated in Figure 2. By means of Theorem 4, the moments are obtained as
for any even positive integer k < .
3.2. BDSL Distribution Generated by the Laplace Distribution
The standard version of the Laplace, also known as double exponential distribution, has the simple density
Theorem 6.
The BDSL density generated by Equation (23) can be expressed by the confluent hypergeometric function
Proof.
By setting p = q = 0, k = 1, and in Corollary 1, the left side corresponds to the expression in the statement and the right side becomes which is the required density due to Theorem 1. ∎
Some specific members of this family are shown in Figure 3.
For = 1, we obtain the corresponding standard slash density of the Laplace distribution (23) as
For = 1 and = 2, one can compare (24) with the densities obtained in [21] (p. 34), yielding
and
where the right sides in (25) and (26) correspond to the (corrected) special cases in the article [21] (p. 34). The last two formulas are possibly new elementary representations of the Kummer confluent hypergeometric functions. For the moments, we obtain
for any even positive integer k < .
3.3. BDSL Distribution Generated by the Generalized Gamma Distribution
The generalized gamma distribution may be parameterized as
and will be denoted as Gamma (, c, r), see, for example, [22]. We confine ourselves to the case in which the parameter r is an integer. The distribution (27) has several known distributions as special cases. The ordinary gamma distribution arises for r = 1, the exponential for c = r = 1, the Weibull for c = 1, and the generalized half-normal distribution is obtained for r = 2. The latter contains as subfamilies the distributions half-normal (for c = 1/2, = 2σ2), Rayleigh (for c = 1, = 2σ2), Maxwell–Boltzmann (for c = 3/2), and Chi (for c = k/2, = 2). Moreover, the lognormal distribution arises as a limiting case of (27) when c→∞.
Theorem 7.
The BDSL density generated by (27) has the density
Proof.
Setting p = q = 0 in Corollary 1, and substituting k by r and c by d, yields
Setting now d = − in (28) and substituting by yields
If Equation (29) is multiplied by , the left side becomes the statement and the right side can be written as , where f is the density in (27). The proof is completed by using Theorem 1. ∎
Without explicit proof, we present the corresponding cumulative distribution function:
The density in Theorem 7 represents a very large family of distributions with five parameters, including all distributions mentioned above, their standard slash distributions, and their general BDSL distributions. In particular, the BDSL density of the generalized half-normal distribution is
and setting therein, for example, for c = 1, = 2, and = 1, after some simplifications, we get the standard slash density of the Rayleigh distribution as
Setting r = 1 in the density of Theorem 7 and in Equation (30), we obtain the BDSL density of the ordinary gamma distribution as
with corresponding distribution function
The slash density (2.2) in [23] corresponds to the special case of Equation (33) with c = 2 and = 1 when and are substituted for q and β.
For the non-central moments, we obtain
Figure 4 shows some BDSL densities generated by Equation (27) with α = 1.5 and .
3.4. BDSL Distribution Generated by the Epsilon Half-Normal Distribution
We finally choose the epsilon half-normal as the parent distribution:
which we will denote by EHN. The half-normal distribution arises as a special case for = 0, see [2]. Similar to the previously used proof techniques, one can show that the BDSL density corresponding to (36) is
where
(see Theorem 3). Some specific densities are illustrated in Figure 5.
The distribution function corresponding to the four-parameter density (37) is
where
(see Equation (8)), and the non-central moments are
In particular, we obtain a closed-form representation for the standard slash density, setting in (37):
This distribution has been studied in [2] (Section 2), where closed-form representations for h and H could not be provided. Moreover, setting then yields
which is a closed-form representation for the density (4) in [24] (p. 3).
The non-central moments of the standard slash of (36) are
yielding in particular
4. Fitting Financial Data
It has long been known that heavy-tailed distributions frequently occur in the financial area, specifically in the modelling of changes in exchange rates, see e.g., [25]. As an example of a possible practical application, we fit some BDSL distributions to the Bitcoin values in Brazilian Real. We consider the sequence (x1,...,xn) of daily closing values over the period of the last eight years with 2125 values, obtained from the cite “Yahoo Finace”. The histogram in Figure 6 contains the relative frequencies of the logarithmic changes ln(xi+1/xi). We fitted three BDSL distributions generated by the normal and Student distribution to the data (compare [21] (Section 2.8) for a similar study). The dashdotted line represents the best possible fit of the standard normal slash distribution, that is, when fitting (18) with and to the data. The estimation was performed, maximizing the loglikelihood function l by means of a search algorithm for optimization. The optimal parameter values are and with corresponding loglikelihood value l = 1677.2. The solid line represents the best BDSL fit for a normal parent distribution, that is, when fitting (18) with to the data, obtaining , and with l = 3308.8.
Finally, the dotted line represents the best fit of a BDSL based on a Student distribution, yielding the optimal parameter values , , v = 1.5, and with l = 2930.3. In order to quantify the goodness of fit, we calculate the usual Akaike information criterion (AIC) and Bayesian information criterion (BIC) (see [26,27]). The results are presented in Table 1, where k denotes the number of parameters and n = 2124 is the sample size.
As both criteria AIC and BIC should be as small as possible, the general BDSL distribution based on the normal proves to be the best suitable model for the given financial data. For similar studies, compare with [2,15]. Further applications of the BDSL with a normal parent distribution, as well as estimation issues, can be found in [9].
5. Simulations
By definition, a BDSL variable can be generated as a quotient Z = X/Y, where X is a continuous random variable and Y is a random variable with beta distribution, independent from X. It is thus interesting to conduct the following simulations. For any of the five BDSL distributions introduced in Section 2 and Section 3, we generate two random samples {x1, x2, …, xn} and {y1, y2, …, yn} of X and Y, where n = 1,000,000. The quotients zi = xi/yi (outcomes of Z) are presented by a histogram, which is compared with the corresponding probability density of Z (see Figure 7). It turns out that the densities expressed by hypergeometric functions correspond well to the stochastic representation of Z.
In Table 2, we compare the sample moments of a sample {z1, …, zn} of Z with the corresponding population moments .
Considerable deviations between sample and population moments occur for higher moments only. This indicates that moment estimators may not be consistent when more than two parameters are to be estimated.
6. Generalizations and Concluding Remarks
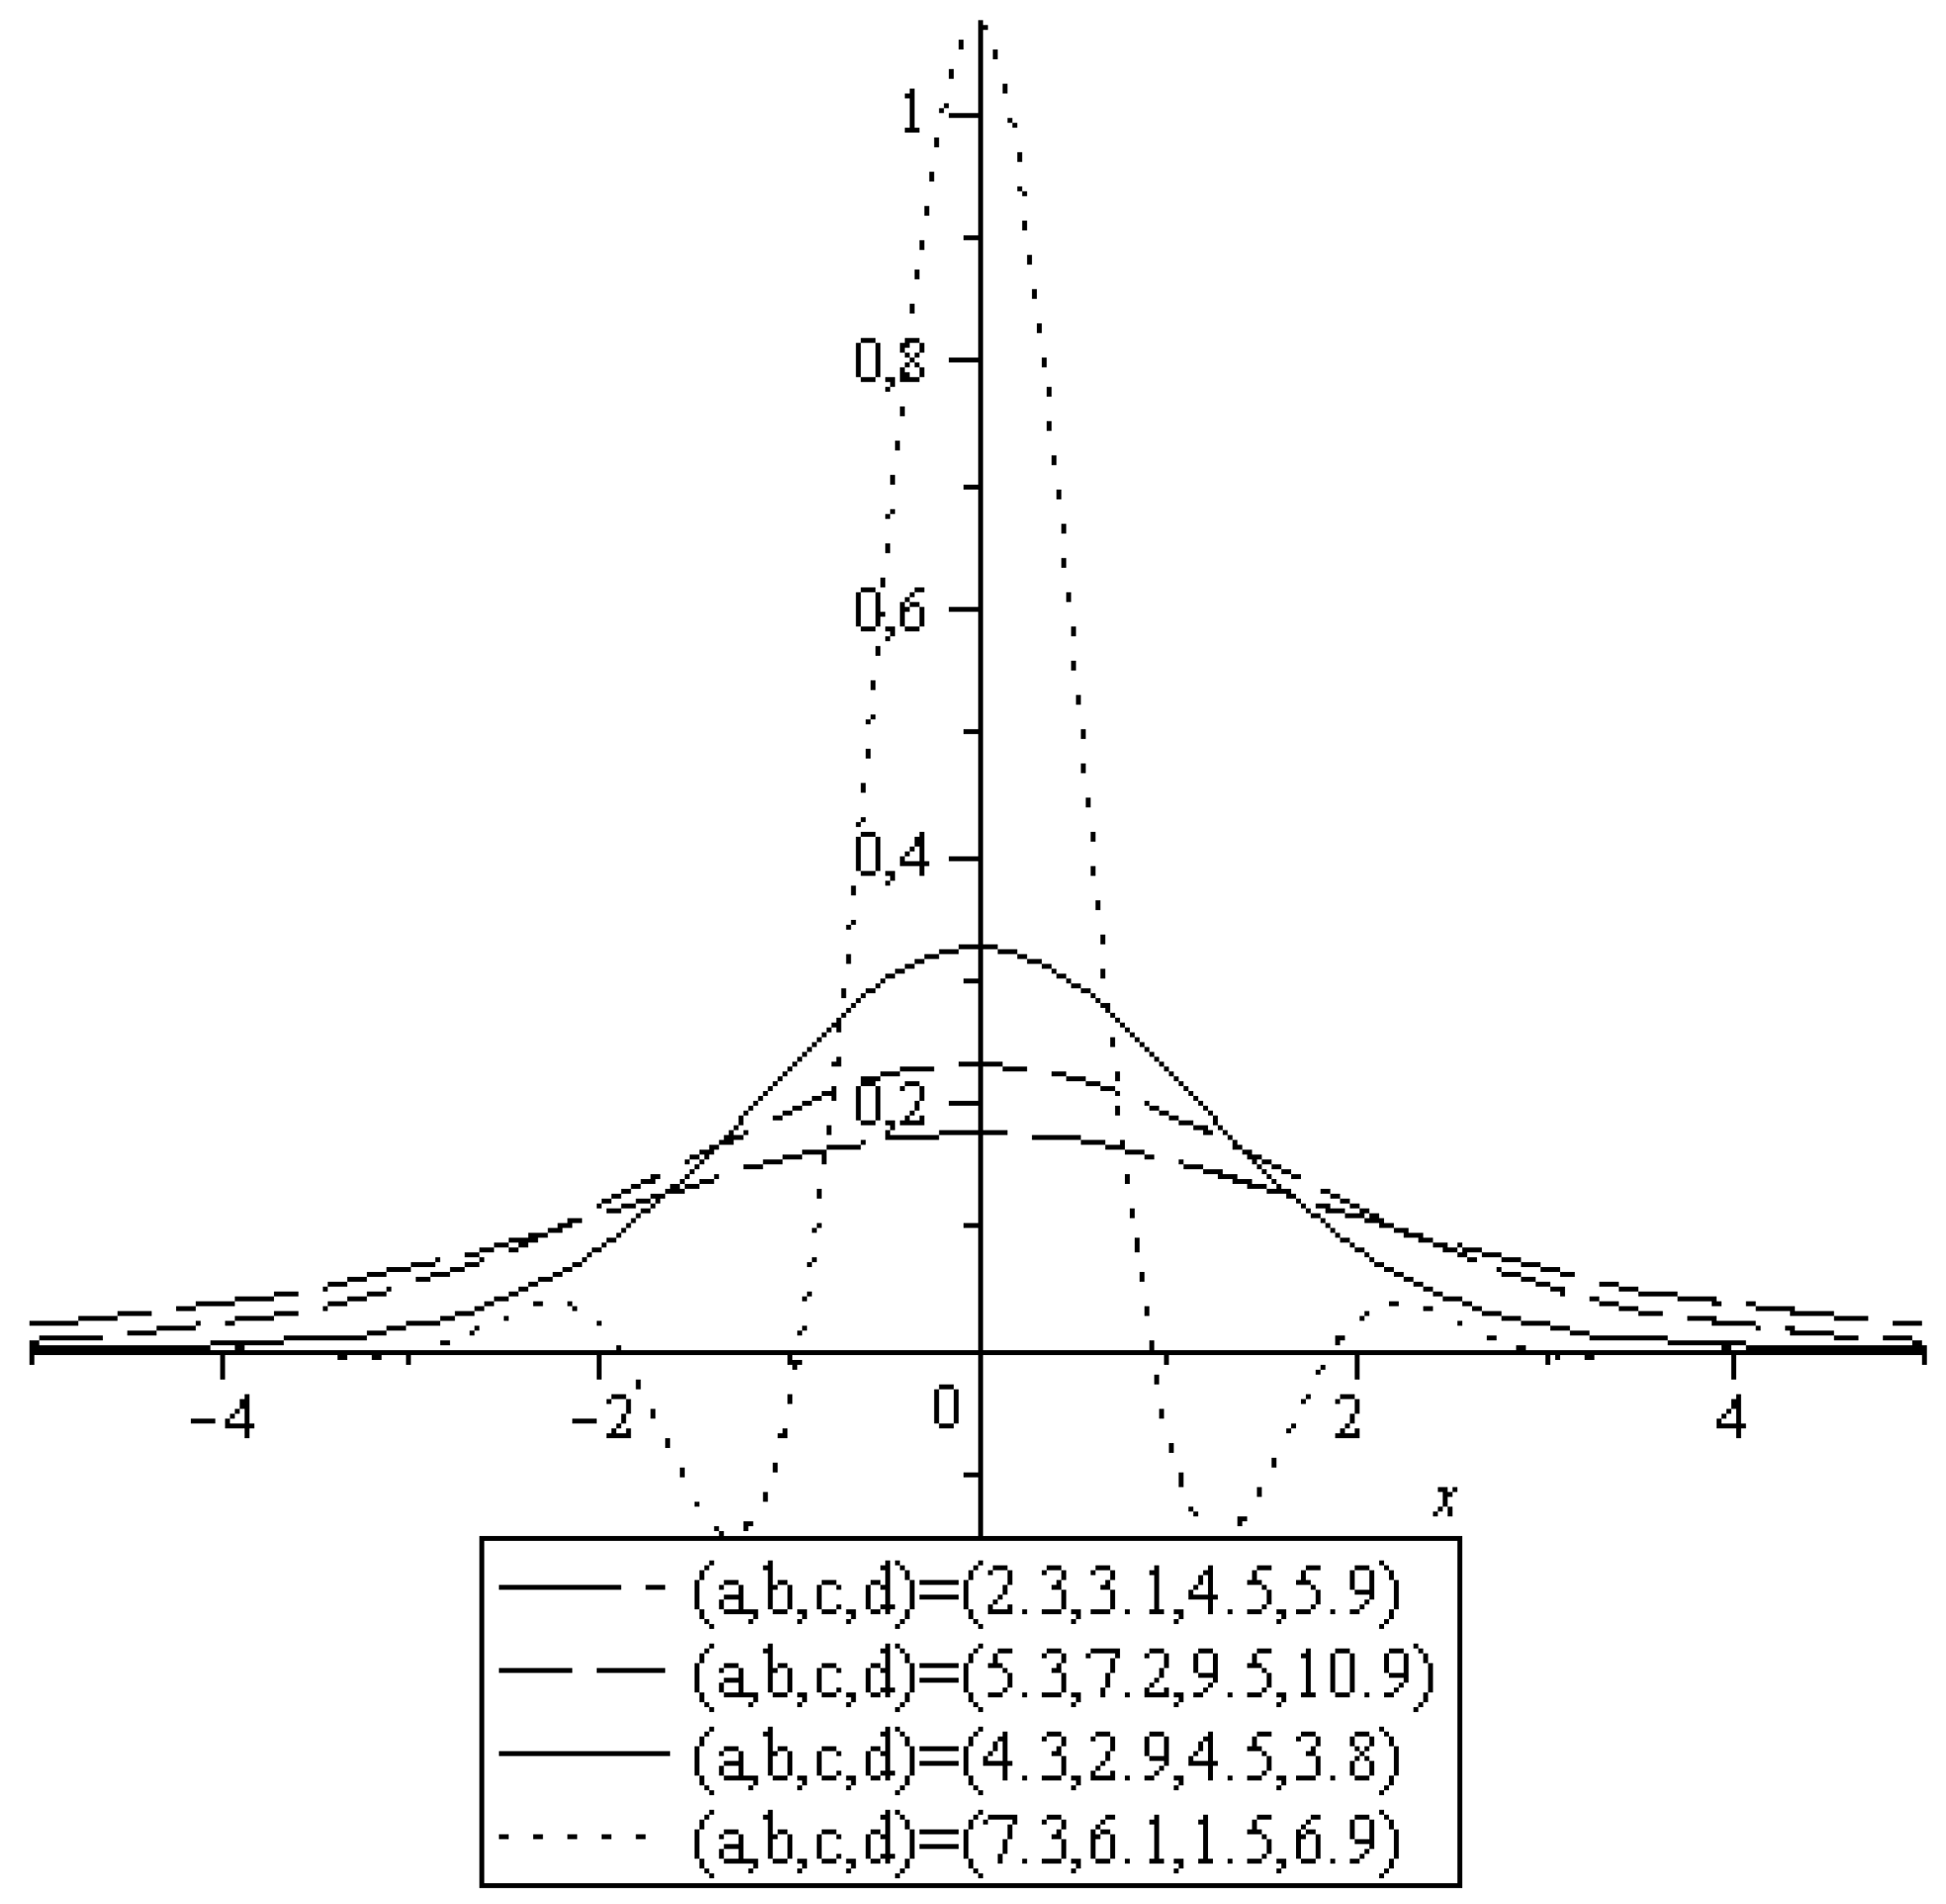
It is to be hoped that BDSL distributions will be studied for other parent distributions. This research may enable further practical applications and support the introduction of more hypergeometric functions in probability theory. One can study generalizations or modifications of the densities described in the form of hypergeometric functions. For example, one could consider a density proportional to 2F2(a,b;c,d;−x2/2) as a natural generalization of the density in Theorem 3. The procedure is straightforward. It is not difficult to determine the normalizing constant C for which C 2F2(a,b;c,d;−x2/2) is a density over ℝ. For a, b, c, d > 1/2, the following integral converges such that
Thus, C = 1/C0 and whenever the parameters a, b, c, d are chosen, such that 2F2(a,b;c,d;−x2/2) is positive over the entire real line, the function
is a probability density. Figure 8 shows some specific cases of the family (45) of functions. Except the dotted line, all curves represent a density. For the non-central moments, one obtains
for any even integer k, such that .
The theory of hypergeometric functions might benefit from the previously introduced concepts, as elementary representations for the values of hypergeometric functions may be revealed, see, for example, Equations (25) and (26) and the following remark.
Funding
This research received no external funding.
Acknowledgments
I thank the anonymous referees for their useful comments.
Conflicts of Interest
The author declares no conflict of interest.
References
- Rogers, W.H.; Tukey, J.W. Understanding some long-tailed symmetrical distributions. Stat. Neerl. 1972, 26, 221–226. [Google Scholar] [CrossRef]
- Gui, W.; Chen, P.-H.; Wu, H. An epsilon half normal slash distribution and its applications to nonnegative measurements. Open J. Optim. 2013, 2, 1–8. [Google Scholar] [CrossRef]
- Punathumparambath, B. A new family of skewed slash distributions generated by the normal kernel. Statistics 2011, 71, 345–353. [Google Scholar]
- Del Castillo, J.M. Slash distributions of the sum of independent logistic random variables. Stat. Probab. Lett. 2016, 110, 111–118. [Google Scholar] [CrossRef]
- Punathumparambath, B.; George, S. A new family of skew slash logistic distributions. J. Appl. Stat. Sci. 2011, 19, 253–260. [Google Scholar]
- Gómez, H.W.; Olivares-Pacheco, J.F.; Bolfarine, H. An extension of the generalized Birnbaum–Saunders distribution. Stat. Probab. Lett. 2009, 79, 331–338. [Google Scholar] [CrossRef]
- Reyes, J.; Barranco-Chamorro, I.; Gómez, H.W. Generalized modified slash distribution with applications. Commun. Stat. Theory Meth. 2019. [Google Scholar] [CrossRef]
- Reyes, J.; Gómez, H.W.; Bolfarine, H. Modified slash distribution. Statistics 2013, 47, 929–941. [Google Scholar] [CrossRef]
- Rojas, M.A.; Bolfarine, H.; Gomáz, H.W. An extension of the slash-elliptical distribution. Stat. Oper. Res. Trans. (SORT) 2014, 38, 215–230. [Google Scholar]
- Roach, K. Hypergeometric Function Representation. 1996. Available online: cybertester.com/data/issac96.pdf (accessed on 15 May 2019).
- Abadir, K.M. An introduction to hypergeometric functions for economists. Econom. Rev. 1999, 18, 287–330. [Google Scholar] [CrossRef]
- Driver, K.A.; Johnston, S.J. An integral representation of some hypergeometric functions. Electron. Trans. Numer. Anal. 2006, 25, 115–120. [Google Scholar]
- Gradshteyn, I.S.; Ryzhik, I.M. Table of Integrals, Series and Products; Elsevier: Amsterdam, The Netherlands; Academic Press: New York, NY, USA, 2007. [Google Scholar]
- Nagar, D.K.; Morán-Vasquez, R.A.; Gupta, A.K. Properties and applications of extended hypergeometric functions. Ingenieria y Ciencia 2014, 10, 11–31. [Google Scholar] [CrossRef]
- Gui, W.; Chen, P.-H.; Wu, H. A Folded normal slash distribution and its applications to non-negative measurements. J. Data Sci. 2013, 11, 231–247. [Google Scholar]
- Luke, Y. The Special Functions and Their Approximations; Academic Press: Amsterdam, The Netherlands; New York, NY, USA, 1969. [Google Scholar]
- Felgueiras. Scale Mistures and Slash Distributions. Instituto Politécnico de Leiria. 2013. Available online: www.ceaul.fc.ul.pt (accessed on 15 May 2019).
- Blaschke, P. Hypergeometric form of fundamental theorem of calculus. arXiv 2018, arXiv:1808.04837. [Google Scholar]
- Farnoosh, R.; Nematollahi, N.; Rahnamaei, Z.; Hajrajabi, A. A family of skew–slash distributions and estimation of its parameters via an EM Algorithm. J. Iran. Stat. Soc. JIRSS 2013, 12, 271–291. [Google Scholar]
- Iriarte, Y.A.; Gómez, H.W.; Varela, H.; Bolfarine, H. Slashed rayleigh distribution. Revista Columbiana de Estadística 2015, 38, 31–44. [Google Scholar] [CrossRef]
- Shodhganga. Slash Distributions and Applications. Available online: http://shodhganga.inflibnet.ac.in (accessed on 15 May 2019).
- Khodabina, M.; Ahmadabadib, A. Some properties of generalized gamma distribution. Math. Sci. 2010, 4, 9–28. [Google Scholar]
- Iriarte, Y.A.; Astorga, J.M.; Venegas, O.; Gómez, H.W. Slashed moment exponential distribution. J. Stat. Theory Appl. 2017, 16, 354–365. [Google Scholar] [CrossRef]
- Olmos, N.M.; Varela, H.; Gómez, H.W.; Bolfarine, H. An Extension of the Half–Normal Distribution; Statistical Papers; Springer: Berlin, Germany; New York, NY, USA, 2012; Volume 55. [Google Scholar]
- Boothe, P.; Glassman, D. The statistical distribution of exchange rates: Empirical evidence and economic implications. J. Int. Econ. 1987, 22, 297–319. [Google Scholar] [CrossRef]
- Akaike, H. Information theory and an extension of the maximum likelihood principle. In Second International Symposium of Information Theory; Petrov, B.N., Csaki, F., Eds.; Akademiai Kiado: Budapest, Hungary, 1973; pp. 267–281. [Google Scholar]
- Schwarz, G. Estimating the dimension of a model. Ann. Stat. 1978, 6, 461–464. [Google Scholar] [CrossRef]
Figure 1.
Beta divided slash densities generated by N(0,1).
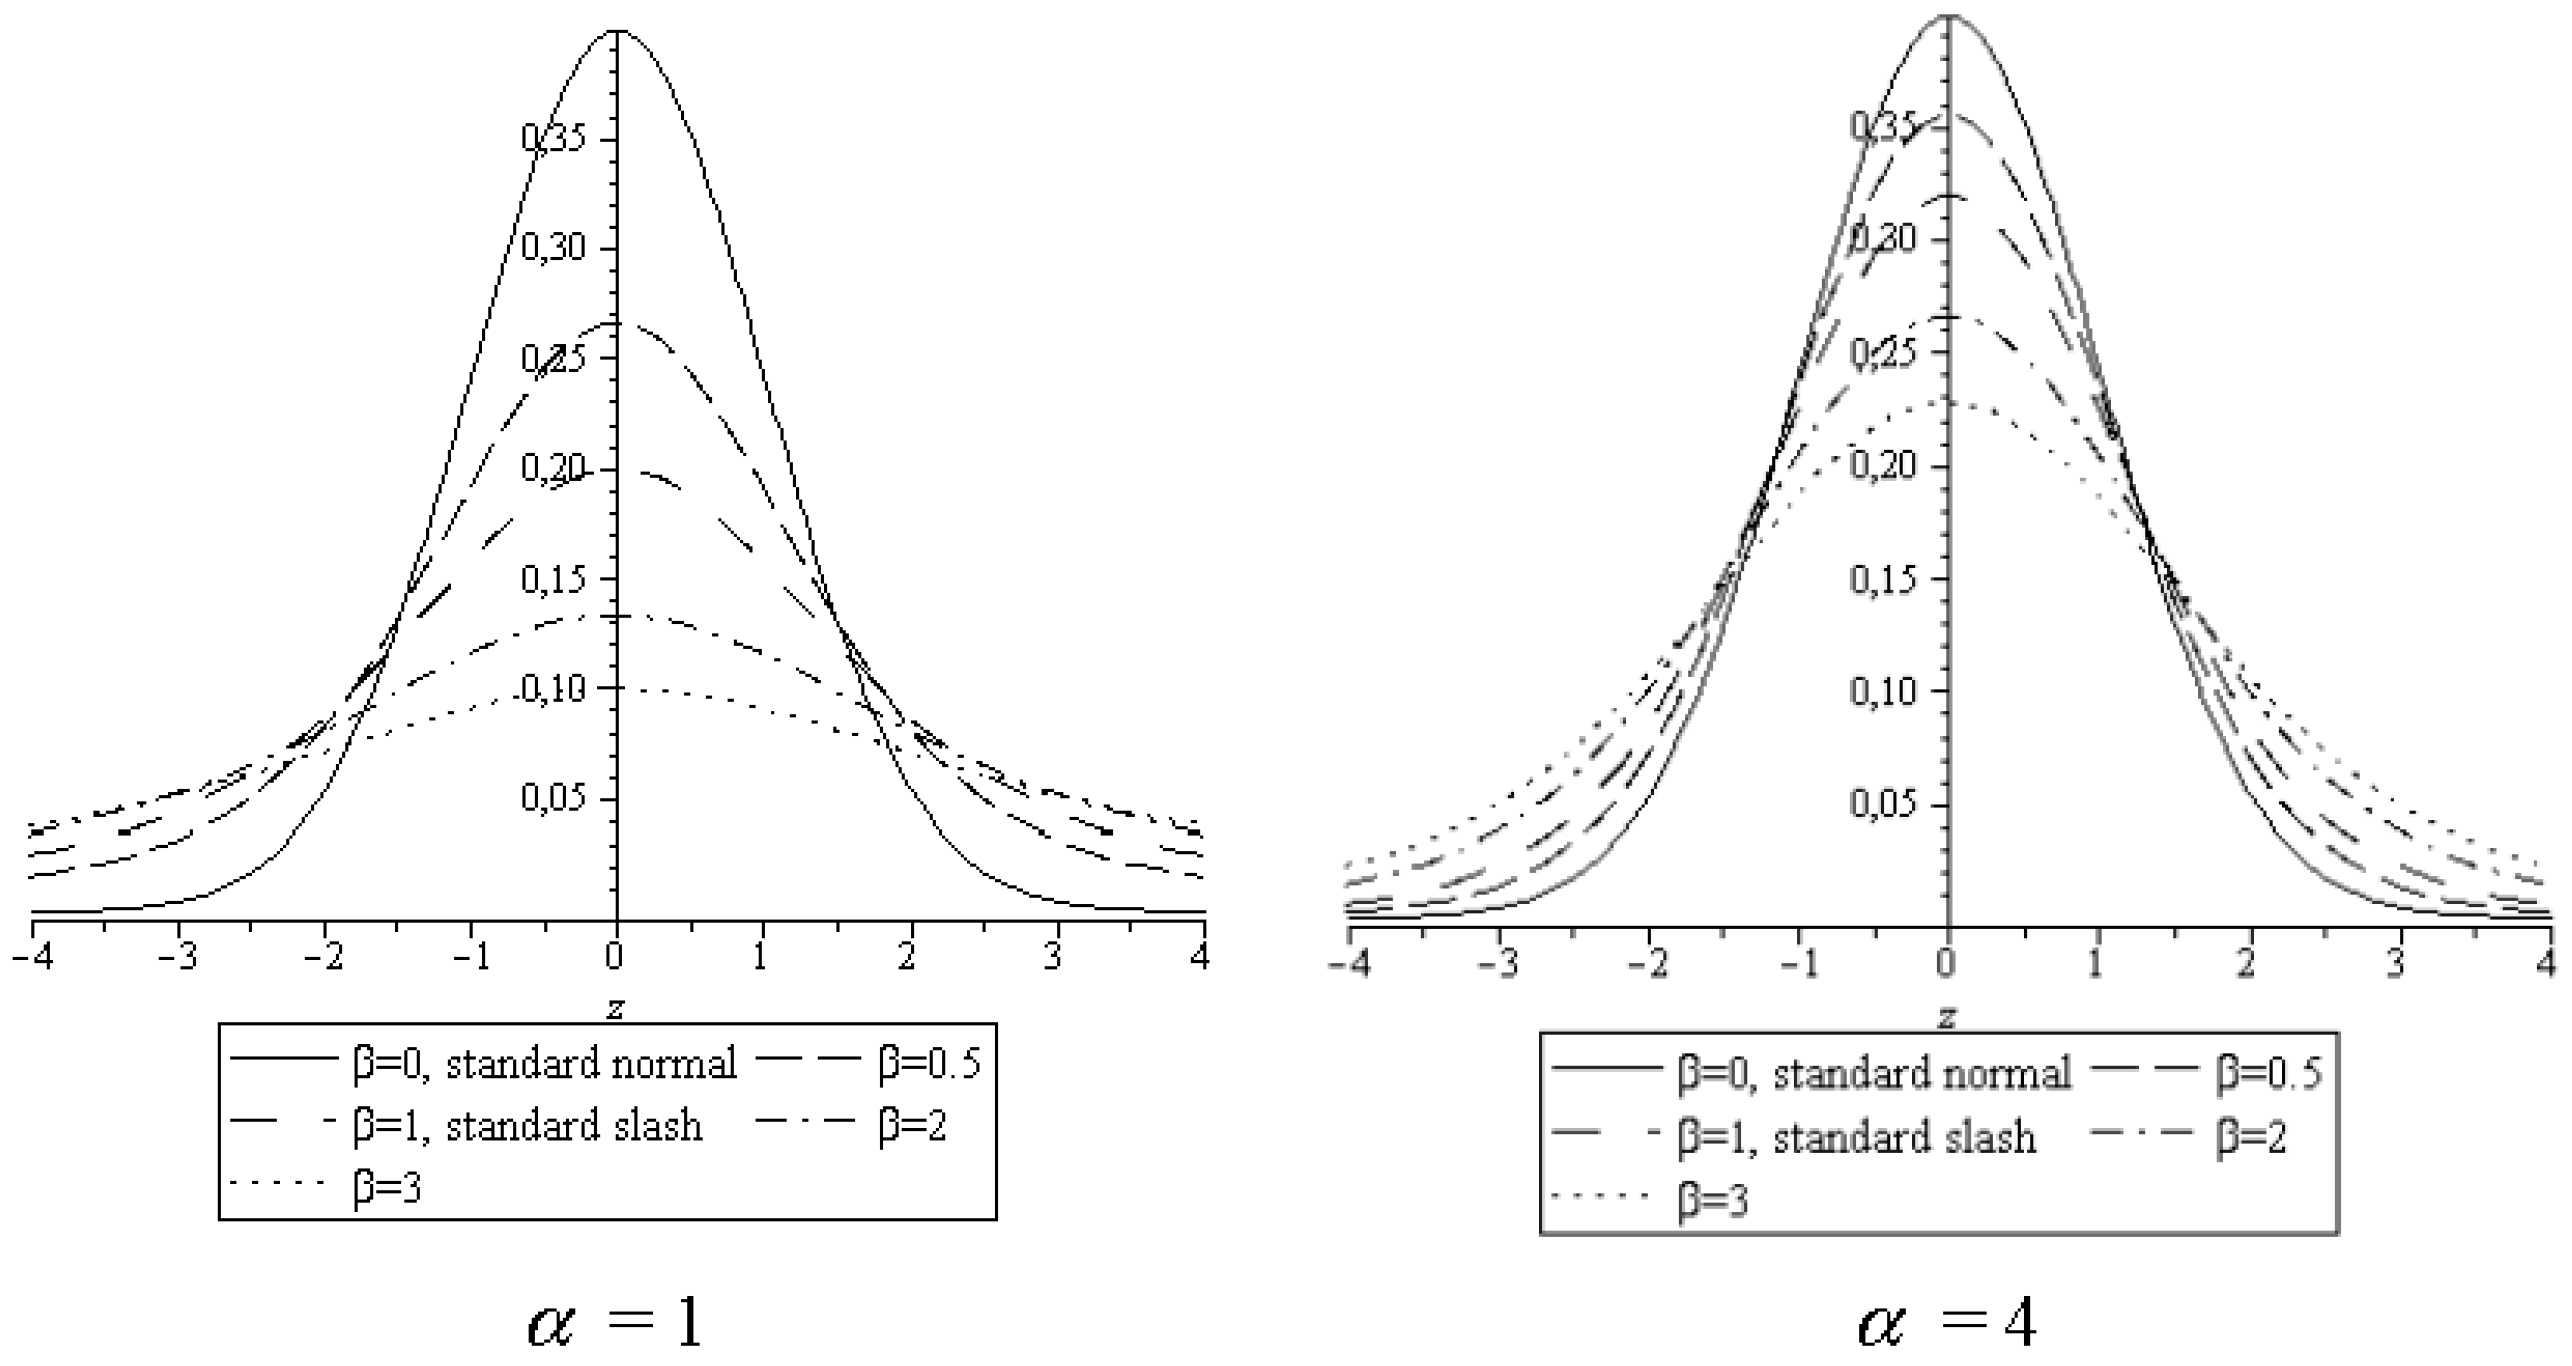
Figure 2.
Members of the distribution family beta divided slash (BDSL)((Student(v)).
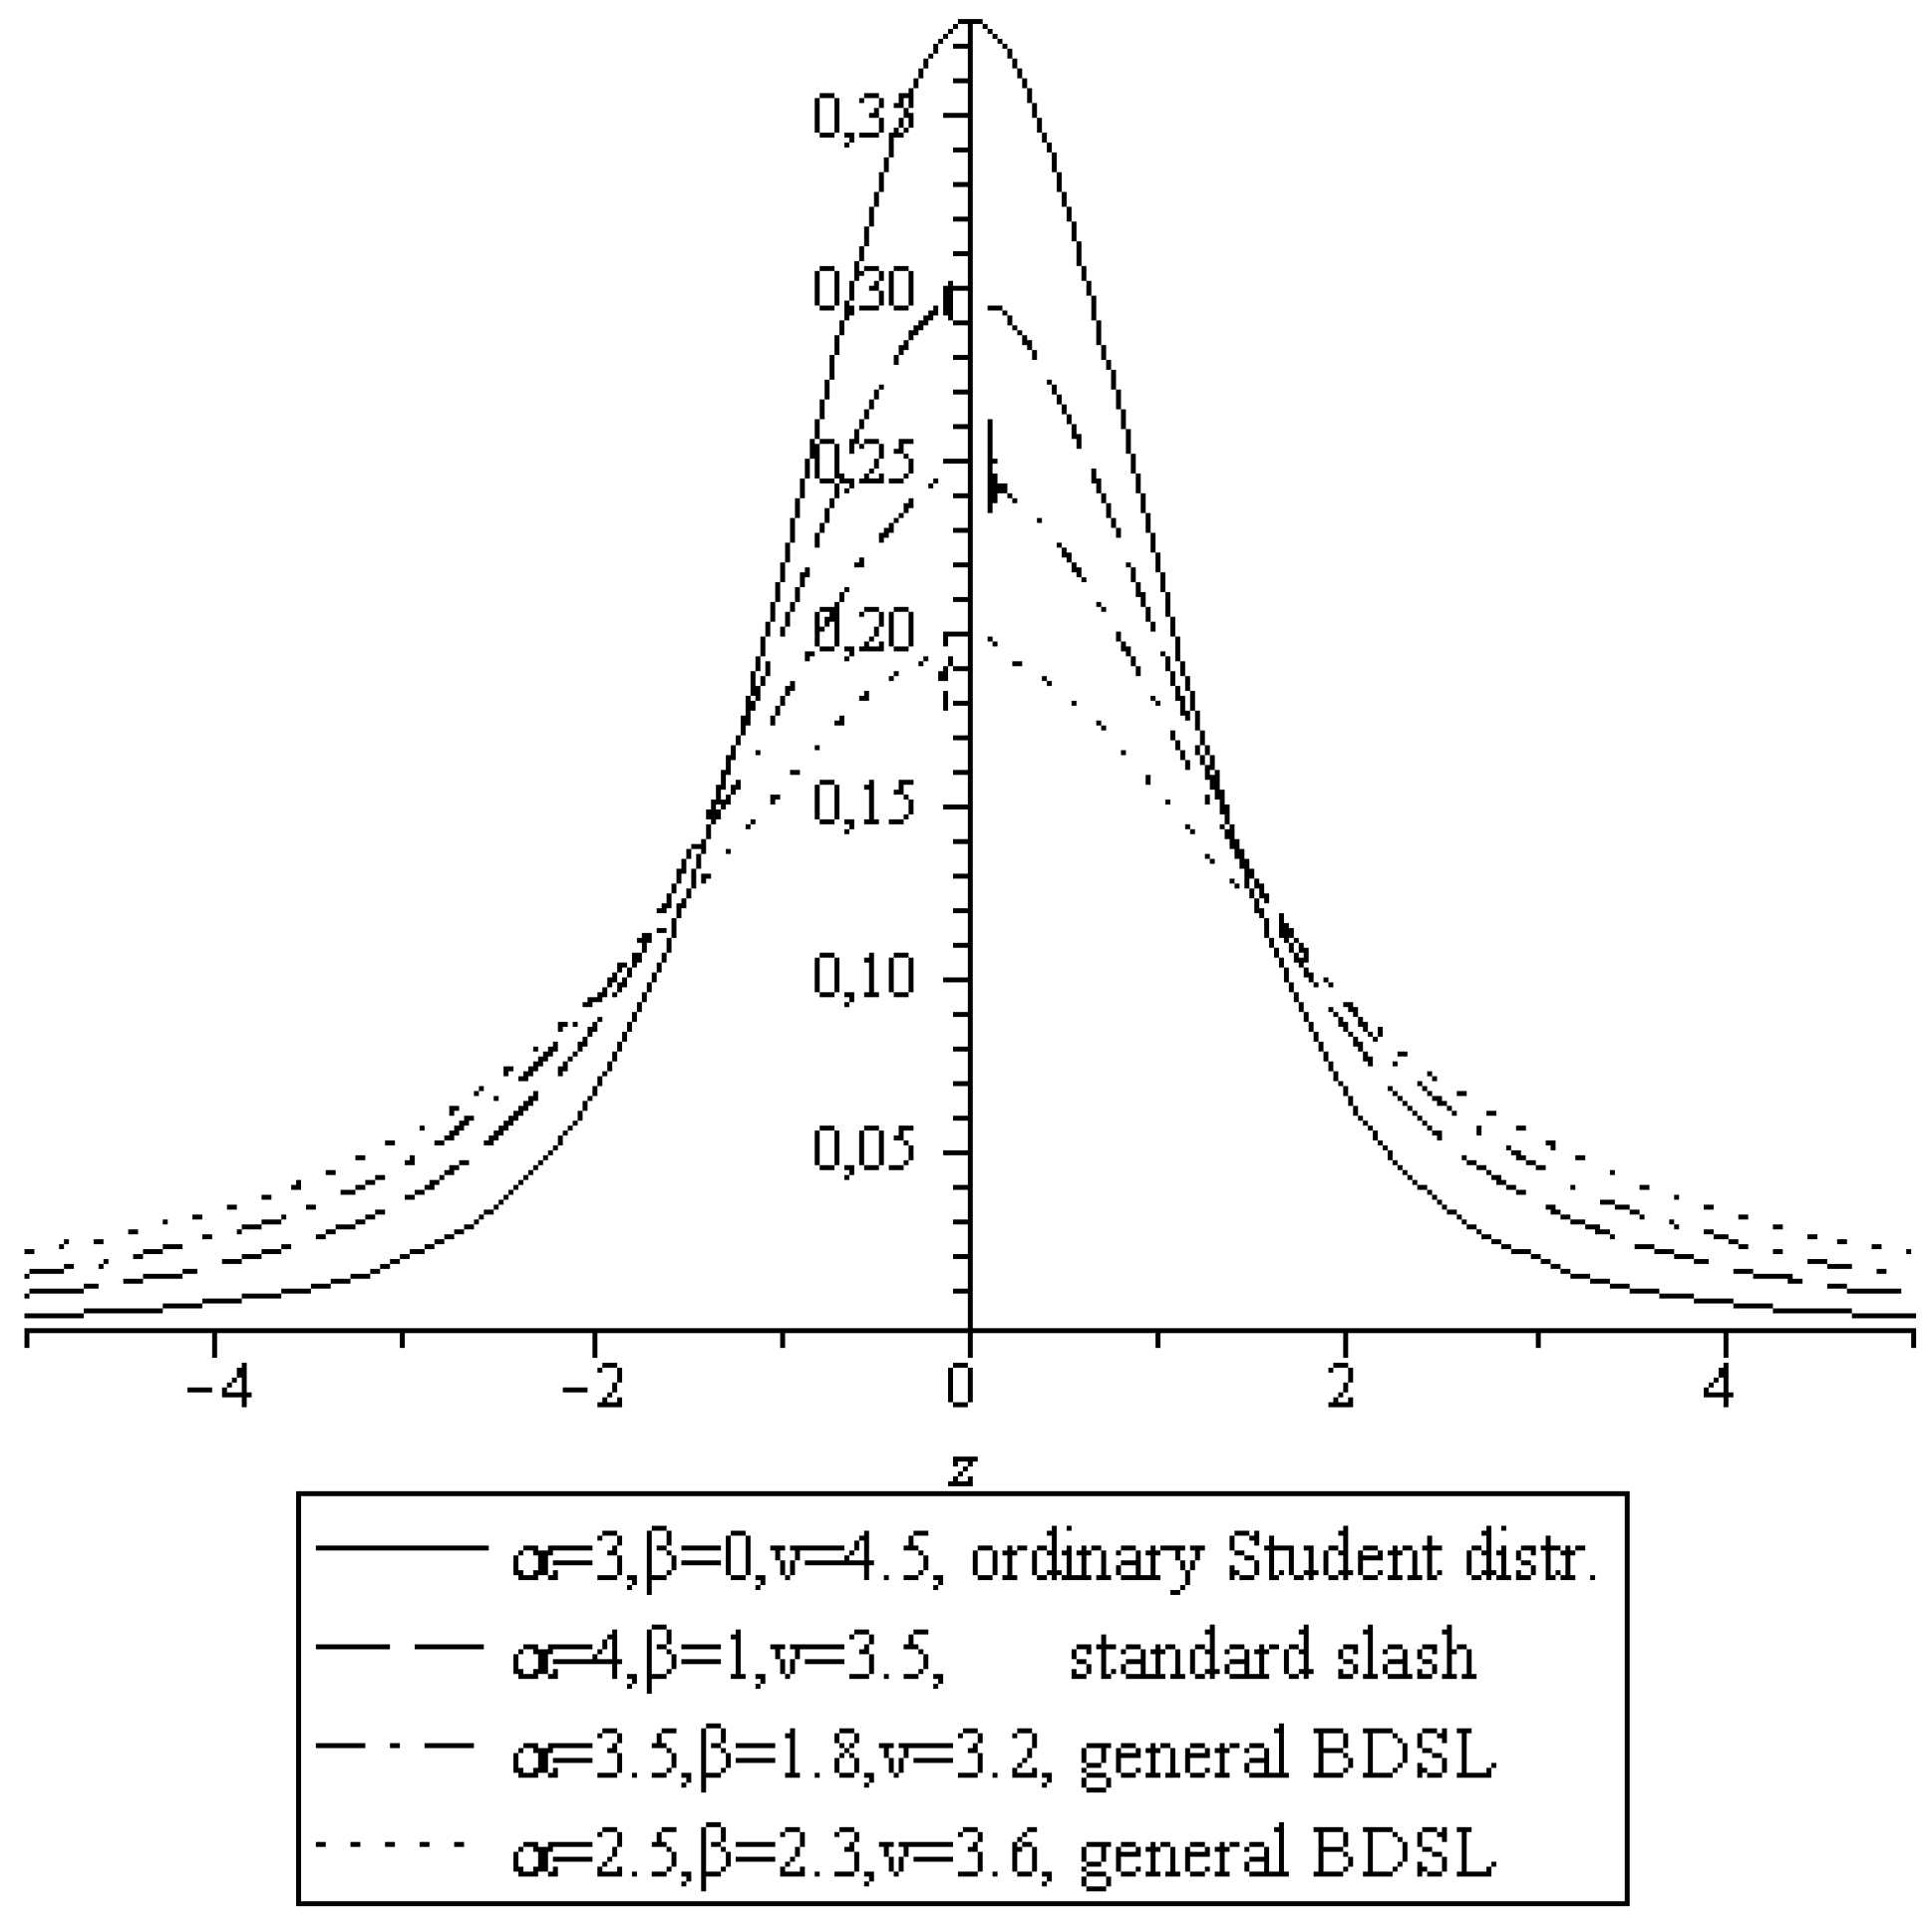
Figure 3.
Members of BDSL (Laplace).
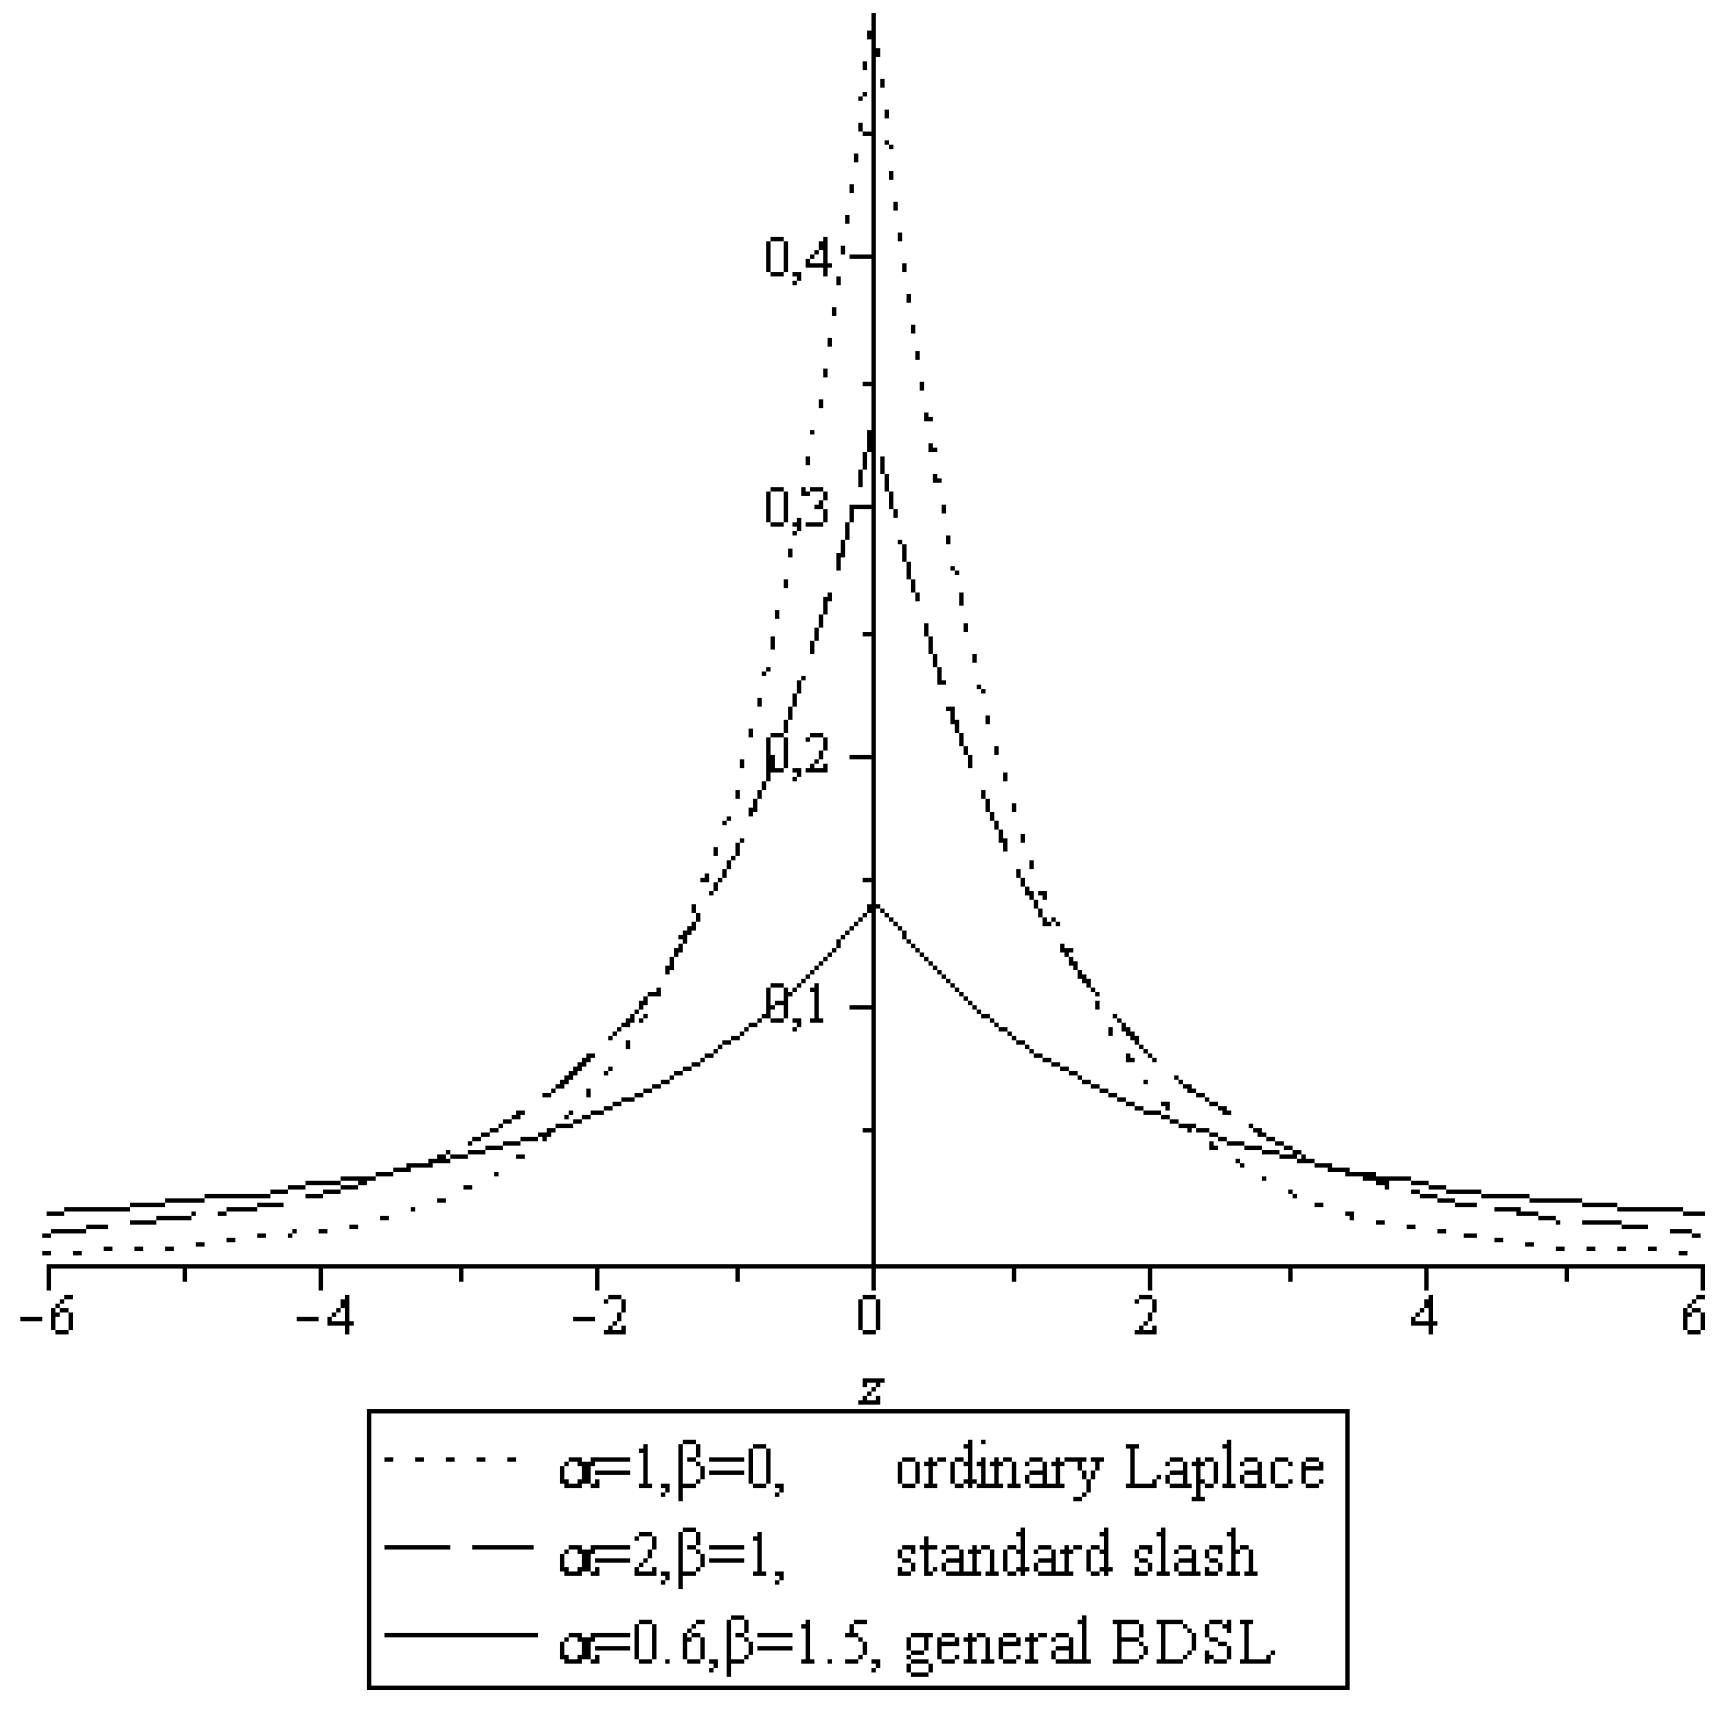
Figure 4.
Members of BDSL(Gamma (,c,r)).
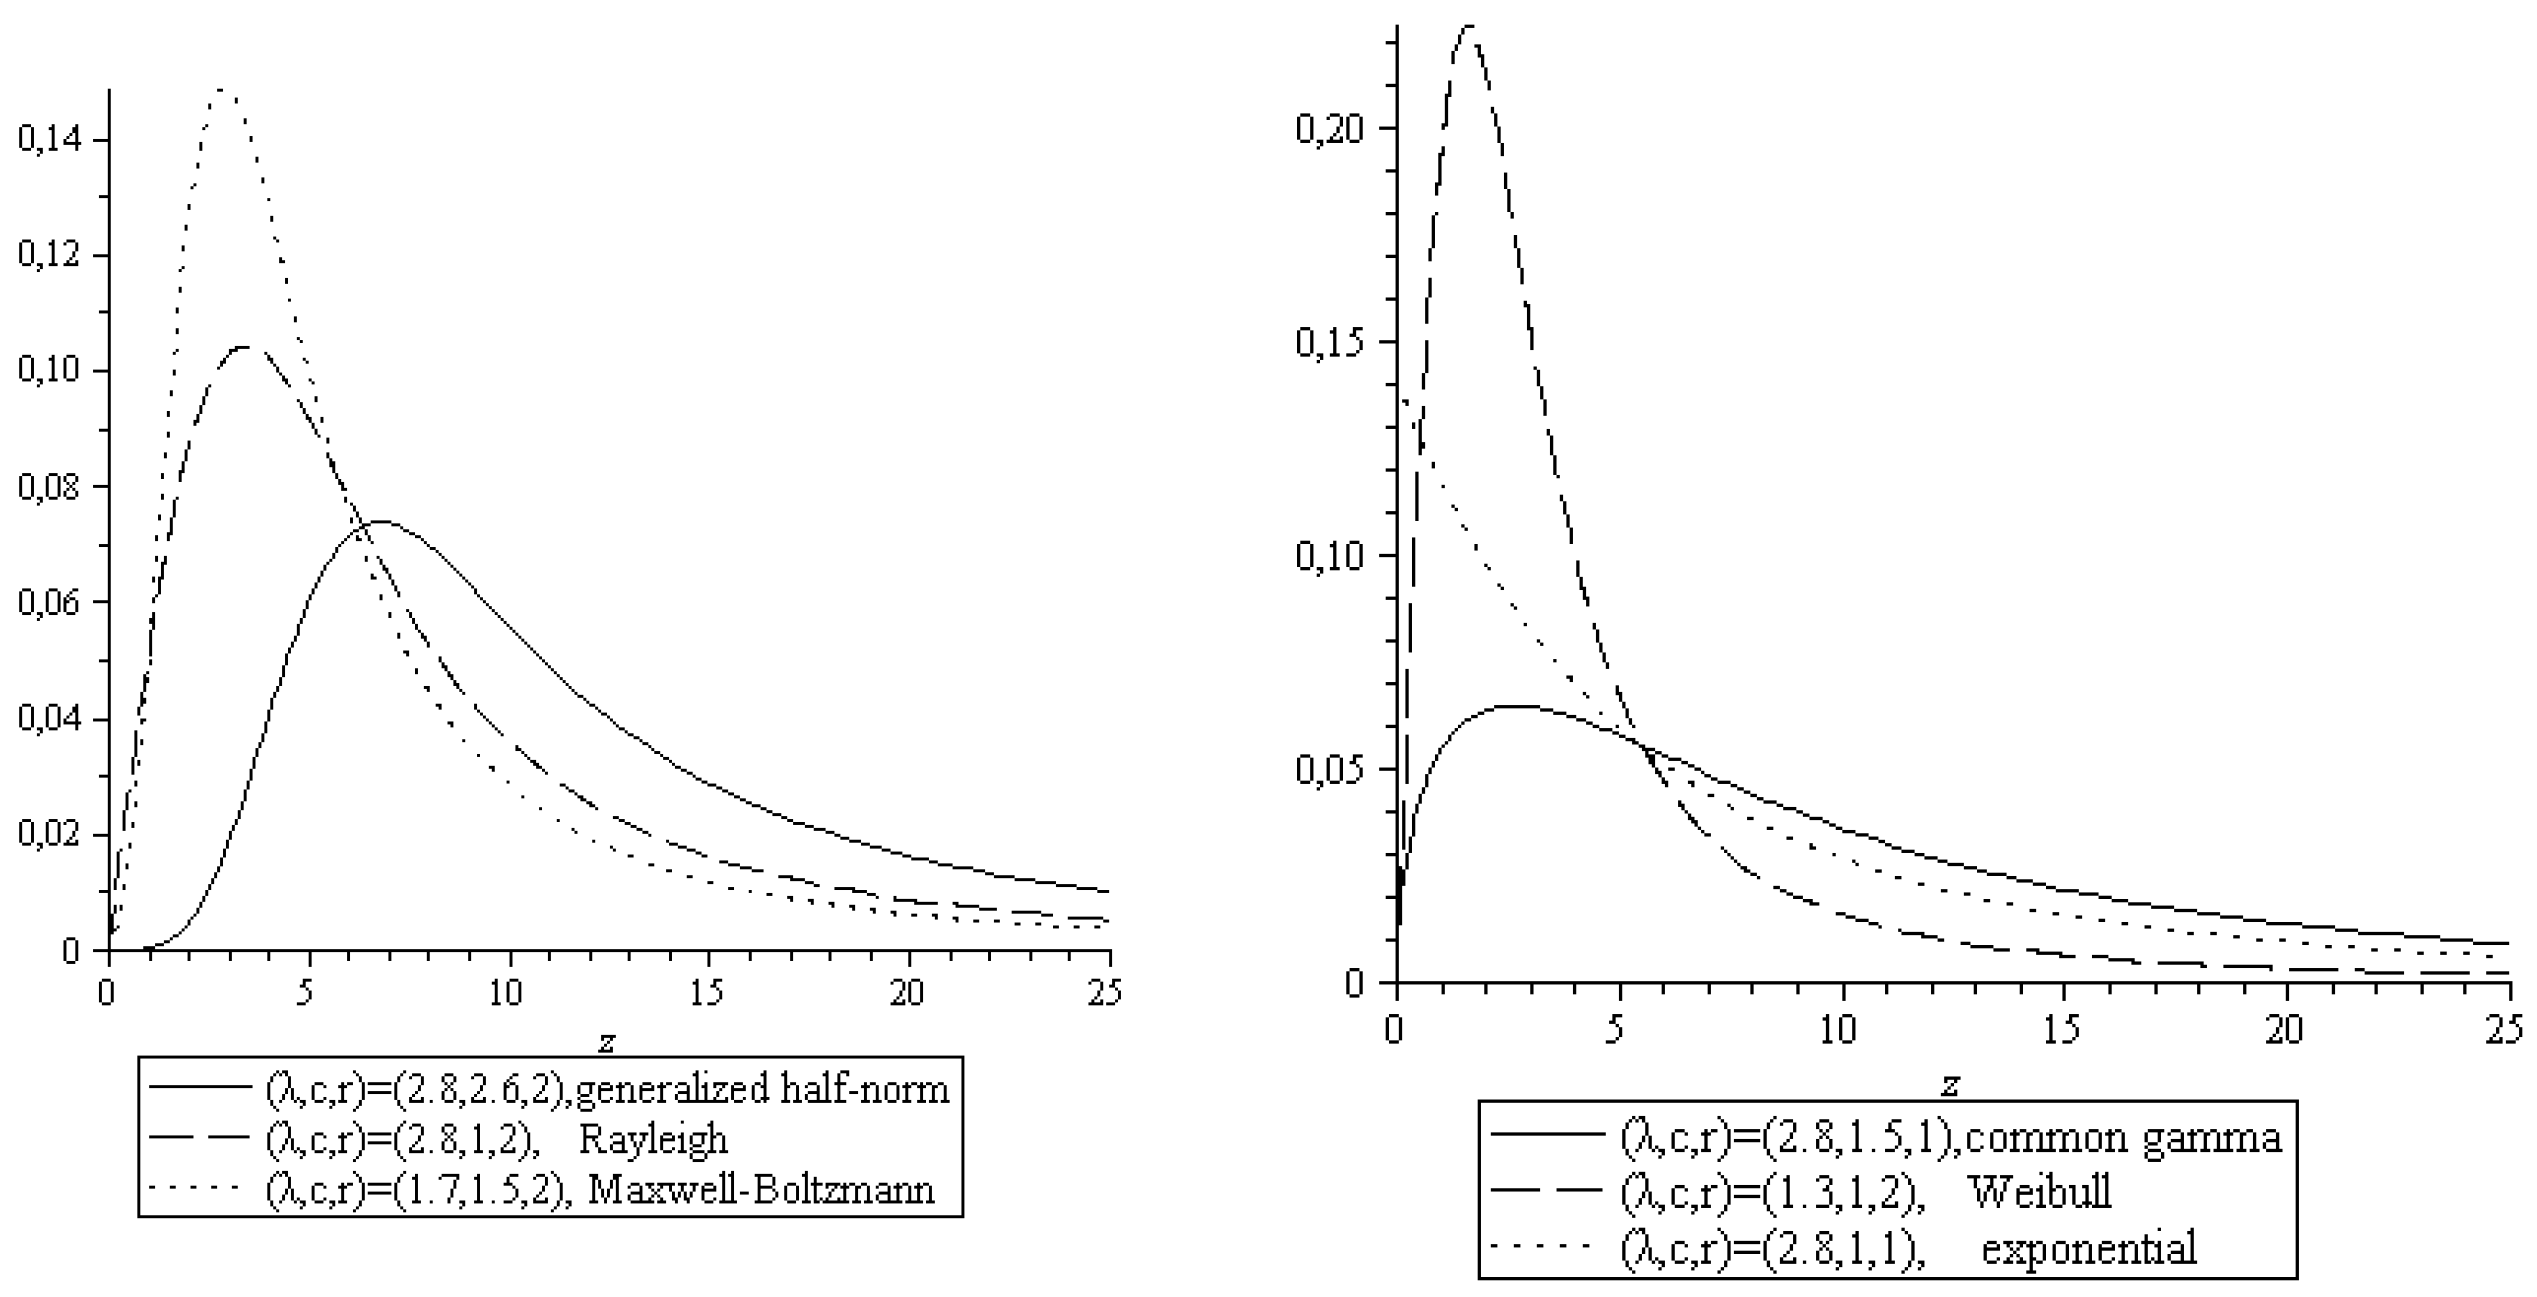
Figure 5.
Members of BDSL (EHN

Figure 6.
Logarithmic changes of Bitcoin values in Brazilian Real (July 18 of 2010 until Sept. 6 of 2018).
Figure 6.
Logarithmic changes of Bitcoin values in Brazilian Real (July 18 of 2010 until Sept. 6 of 2018).
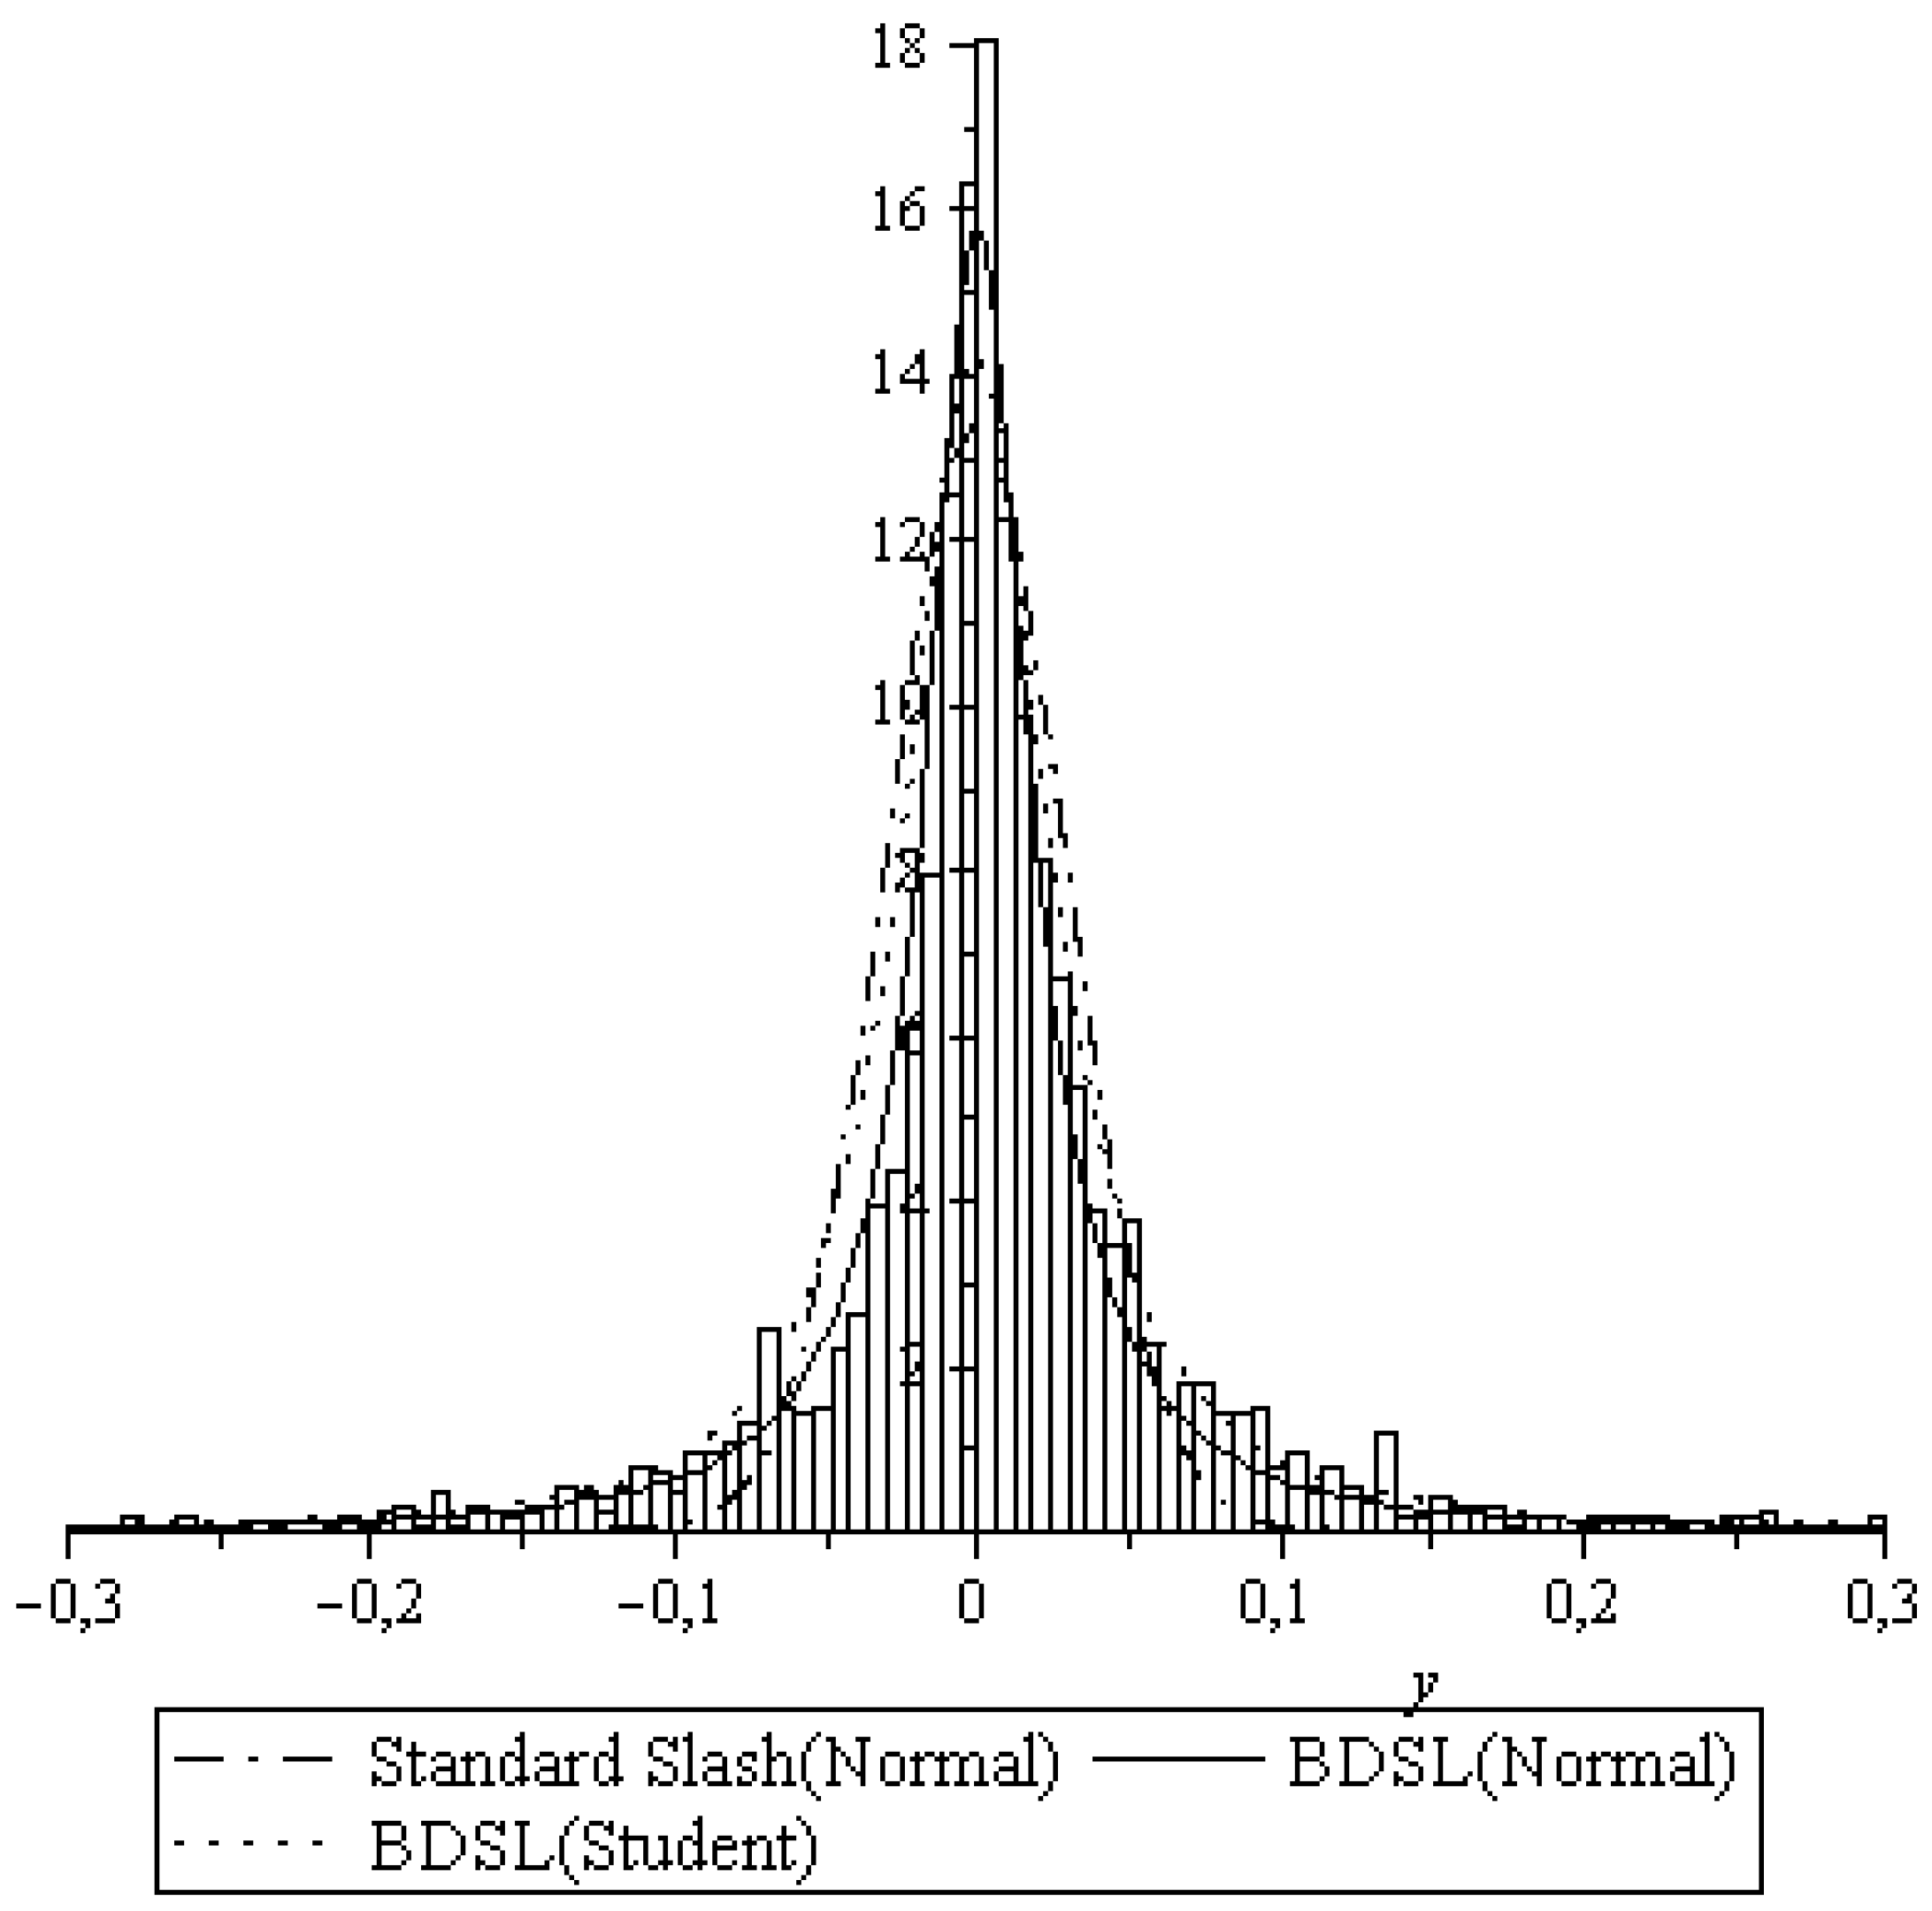
Figure 7.
(a–e) Stochastic representations of BDSL distributions.
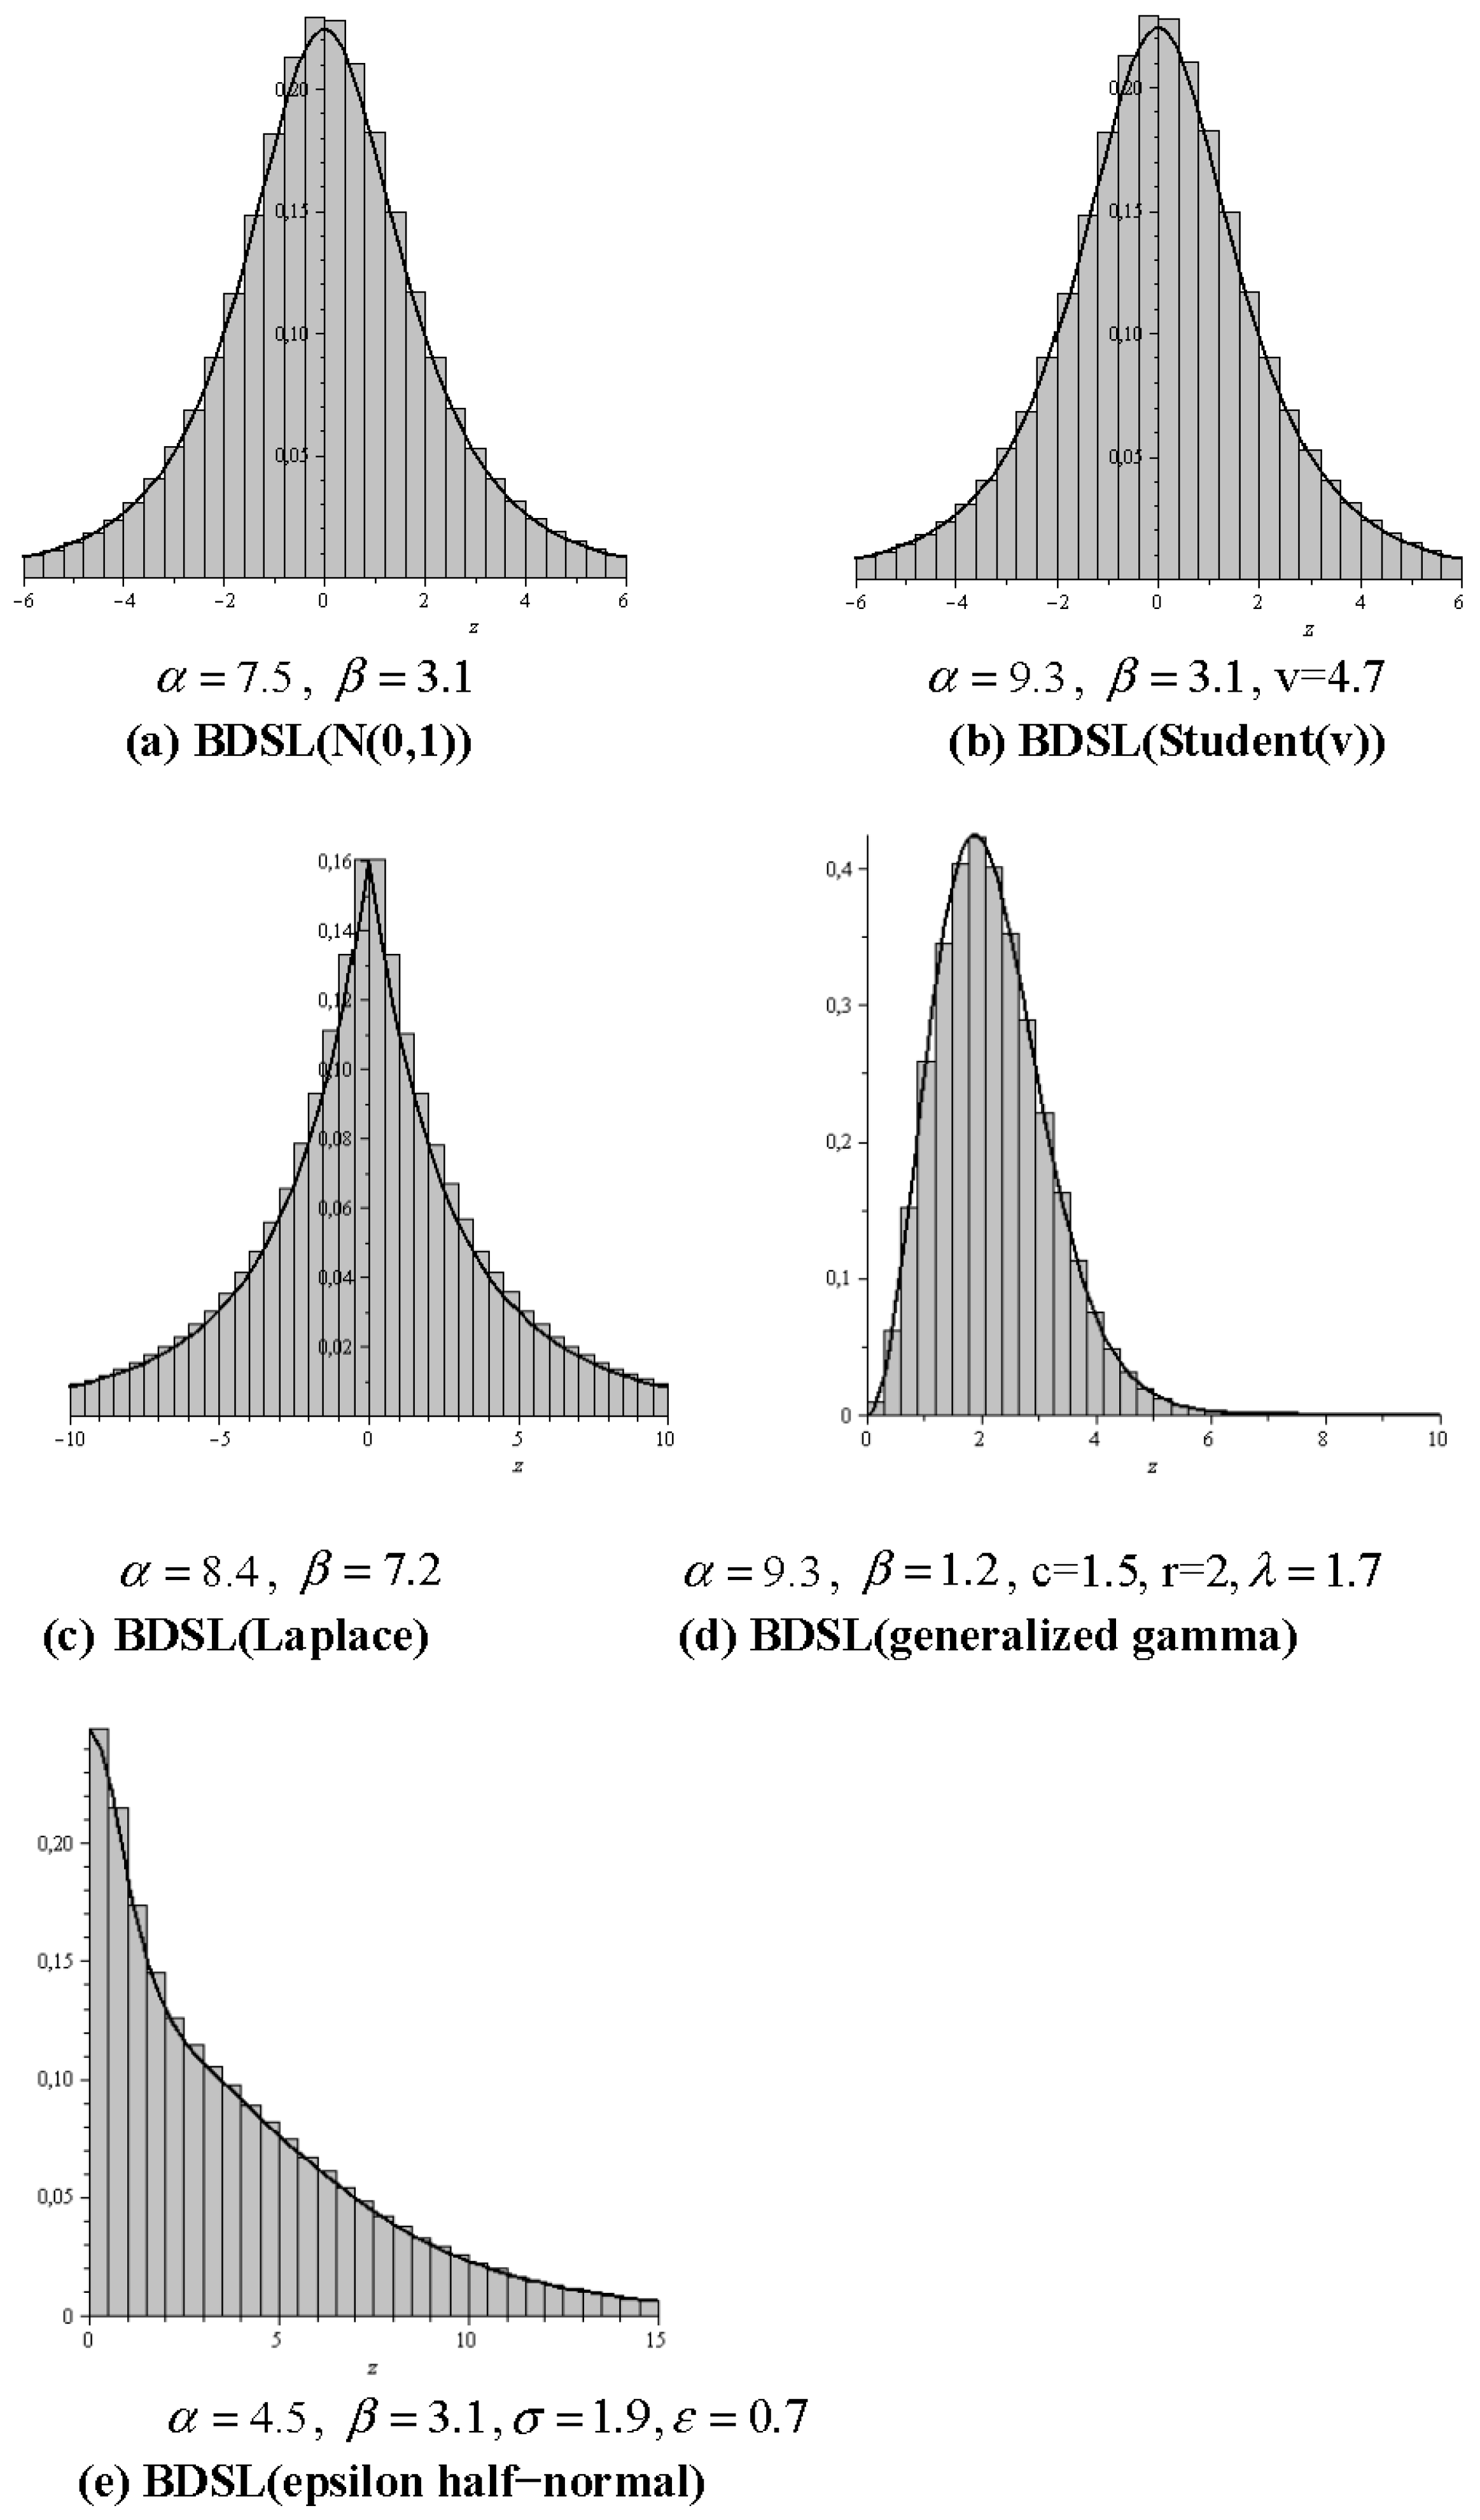
Figure 8.
Illustration of the functions in (45).

Table 1.
Information criteria for beta divided slash (BDSL) fits.
| Distribution | k | Loglikelihood l | AIC = 2k − 2l | BIC = k ln(n) − 2l |
|---|---|---|---|---|
| Standard slash(normal) | 2 | 1677.2 | −3350.4 | −3339.1 |
| BDSL(Normal) | 3 | 3308.8 | −6611.6 | −6594.6 |
| BDSL(Student) | 4 | 2930.3 | −5852.6 | −5830.0 |
Table 2.
Moments of BDSL distributions in Figure 7.
Table 2.
Moments of BDSL distributions in Figure 7.
| Normal | Student | Laplace | Gen. Gamma | Eps. Half-Norm | |
|---|---|---|---|---|---|
| m1 | 0.0006 | 0.0002 | −0.0013 | 2.196 | 4.264 |
| μ1’ | 0 | 0 | 0 | 2.196 | 4.259 |
| m2 | 2.314 | 3.421 | 8.385 | 5.779 | 37.67 |
| μ2’ | 2.309 | 3.406 | 8.372 | 5.773 | 37.66 |
| m3 | 0.0262 | −1.138 | 0.6723 | 17.59 | 572.6 |
| μ3’ | 0 | 0 | 0 | 17.59 | 592.7 |
| m4 | 22.31 | 263.4 | 635.3 | 60.89 | 16064 |
| μ4’ | 22.06 | 162.2 | 619.0 | 60.94 | 25891 |
© 2019 by the author. Licensee MDPI, Basel, Switzerland. This article is an open access article distributed under the terms and conditions of the Creative Commons Attribution (CC BY) license (http://creativecommons.org/licenses/by/4.0/).
Share and Cite
MDPI and ACS Style
Zörnig, P. On Generalized Slash Distributions: Representation by Hypergeometric Functions. Stats 2019, 2, 371-387. https://doi.org/10.3390/stats2030026
AMA Style
Zörnig P. On Generalized Slash Distributions: Representation by Hypergeometric Functions. Stats. 2019; 2(3):371-387. https://doi.org/10.3390/stats2030026
Chicago/Turabian StyleZörnig, Peter. 2019. "On Generalized Slash Distributions: Representation by Hypergeometric Functions" Stats 2, no. 3: 371-387. https://doi.org/10.3390/stats2030026