Article

Lomefloxacin—Occurrence in the German River Erft, Its Photo-Induced Elimination, and Assessment of Ecotoxicity

Department of Chemistry and ILOC, Niederrhein University of Applied Sciences, D-47798 Krefeld, Germany
*
Author to whom correspondence should be addressed.
Clean Technol. 2020, 2(1), 74-90; https://doi.org/10.3390/cleantechnol2010006
Submission received: 19 December 2019 / Revised: 29 January 2020 / Accepted: 5 February 2020 / Published: 11 February 2020
(This article belongs to the Special Issue Water and Wastewater Treatment)

Abstract

:
Pharmaceuticals in waters represent a worldwide problem of today. Advanced oxidation processes (AOPs) are being researched for elimination of the ecological hazard. Among the substances, the fluoroquinolone antibiotic lomefloxacin was selected for investigation in this study. Lomefloxacin (LOM) was found in the German river Erft. Near and far ultraviolet (UVA, UVC) radiation were used as AOPs and compared for efficiency depending on pH, water matrix, and catalysts. Chemical kinetics description revealed that UVC at pH 8–9 led to the fastest degradation of LOM. The catalysts hydrogen peroxide and titanium dioxide had only limited influence on the degradation rate. Seven novel transformation products were structurally identified by high-resolution higher-order mass spectrometry. Ecotoxicity of the novel and known compounds was assessed by quantitative structure-activity relationship (QSAR) analysis. In addition, irradiation time dependent minimal, and half-maximal inhibitory concentrations (MIC, IC50) of LOM solutions were determined and suggested as ecotoxicological hazard indicators. From MIC and kinetic rate constants, the irradiation time required for compound and activity removal could be predicted.

1. Introduction

Numerous recent studies have confirmed the presence of various anthropogenic micropollutants in water bodies [1,2,3]. These micropollutants include pharmaceuticals, personal care products, steroid hormones, and pesticides. The main entry route focuses on wastewater treatment plants (WWTPs), which often fail to completely eliminate these substances through the conventional purification processes. Hence, they enter the aqueous environment where they become ecotoxicologically hazardous. The regular observation of micropollutants during environmental monitoring is often associated with an increasing bacterial resistance formation [1,2,3,4]. Observed concentrations range from a few ng L−1 to several µg L−1. Among the pharmaceuticals, fluoroquinolones are the third largest group of antibiotics in worldwide sales administered to humans and animals and are excreted without metabolization [4,5]. Nakata et al. (2005) reported fluoroquinolone concentrations up to 49 ng L−1 both in wastewater treatment effluents and in surface waters and 19 ng L−1 in river water [6].
Advanced purification stages for the elimination of these anthropogenic micropollutants are currently being tested worldwide, including chemical catalysts and UV irradiation. Some of these methods, such as UV irradiation, produce OH radicals, which act as strong oxidants with an oxidation potential of 2.8 V [7]. Several fluoroquinolones follow a degradation process according to pseudo-first order kinetics due to OH radical formation [8]. As a disadvantage, these types of advanced oxidation processes (AOPs) may produce degradation or transformation products (TPs) of potentially higher toxicity than the educt. Thus, recent research on the elimination of pharmaceuticals by AOPs extends to toxicity assessment. As suitable measures, quantitative structure-activity relation (QSAR) analysis as well as minimum inhibitory concentration (MIC) and half maximum inhibitory concentration (IC50) have been discussed [9,10,11]. Both methods were compared in this study.
The fluoroquinolone lomefloxacin served as a model compound since this substance was found in various waters in previous studies and also in the nearby River Erft in the course of this study [12,13]. Its irradiation-induced transformation has been described earlier [14,15]. Yet, systematic comparative investigation of near and far ultraviolet (UVA and UVC) irradiation in the presence and absence of hydrogen peroxide and titanium dioxide has not been undertaken. Both reagents were chosen due to their accelerating effect on degradation [16,17]. Time-dependent degradation and/or transformation of educt and known and novel transformation products were monitored using high-performance liquid chromatography and high-resolution mass spectrometry. In parallel, total organic carbon (TOC) was monitored for chemical effectiveness. To consider various aquatic conditions, model water at different pH values, river water, and effluent were used as matrices. As transformation products have often been assumed more ecotoxic than their initial drug substance, irradiation-time dependent MIC and/ or IC50 and QSAR analyses were performed to assess the ecotoxicological hazard [18,19,20]. Mostly, these tools were used to determine the toxicity of new pharmaceuticals, among them fluoroquinolones [21,22]. Only one study could be found concerning photodegradation of fluoroquinolones in combination with QSAR [23]. Based on MIC and chemical kinetics, irradiation times depending on aquatic conditions could be predicted.

2. Experiments

2.1. Chemicals and Reagents

Lomefloxacin (LOM) was acquired from Molekula (Munich, Germany) and used for all photodegradation experiments. As high performance liquid chromatography (HPLC) eluents, methanol (Merck KGaA, Darmstadt, Germany, LiChrosolv for liquid chromatography) and MilliQ-Water (Millipore System Simplicity 185) were used.
Surface water samples were taken from the German river Erft (Neuss) in summer 2018 downstream of a WWTP and from the river Rhein near Krefeld Uerdingen, see Figure 1. Both samples were checked for the presence of LOM using solid-phase extraction and analyzed with HPLC-ESI-Q-TOF-MS.

2.2. Solid-Phase Extraction of River Water Samples

Using solid-phase extraction (SPE), 1 L of a filtered water sample was concentrated to 1 mL. Oasis HLB (Waters, Milford, CT, USA) SPE cartridges were first conditioned with 3 mL of methanol (Merck, Darmstadt, Germany), quenched with 3 mL of MilliQ water, loaded with 1 L of river water, washed with 3 mL of MillliQ water, and then eluted with 3 mL methanol. The substances dissolved in methanol were concentrated to dryness using the rotary evaporator and then taken up again with 1 mL MilliQ water. The sample was cleaned with a syringe filter and then transferred to the HPLC-MS system.

2.3. Photodegradation Experiments

Photoinduced degradation experiments were carried out in a 1 L batch reactor (Peschl Ultraviolet GmbH, Mainz, Germany). For irradiation, a UVA light emitting medium pressure mercury lamp (Heraeus, TQ 150, 150 W, Hanau, Germany) was operated with cooling to prevent power associated temperature increase. For UVC irradiation a low-pressure mercury lamp (Heraeus TNN 15/32, 15 W, Hanau, Germany) was operated without need for cooling. The reaction temperature throughout the reactor was 22 ± 2 °C, checked during degradation by means of a thermometer. The lamps were arranged centrically in the reactor. The reactor was filled with 750 and 800 mL aqueous solution with the UVA and UVC lamp inserted. The concentration of LOM was 20 mg L−1. The pH was adjusted by adding hydrochloric acid (HCl, 30% Suprapur, Merck KGaA, Darmstadt, Germany) or ammoniacal solution (NH3, approximately 25% Riedel-de Haen, Seelze, Germany). A magnetic stirrer (500 rpm) was used. Irradiation times were 30 min and 10 min for UVA and UVC irradiation, respectively. In previous studies, this exposure time has proven to ensure sufficient degradation [11,24,25,26].
The warm-up time of the UVA lamp was 2 min vs. 0 min for the UVC lamp. Both lamps emitted polychromatic light with maximum intensities at 313, 365, 405, 437, 547, 578, and 580 nm. The UVC lamp additionally emitted at 185 and 254 nm. The total photon flux in the range between 200 and 500 nm was determined to 3.50 mmol·min−1·L−1 for the UVA lamp and 2.03 mmol·min−1·L−1 for the UVC lamp by means of ferrioxalate actinometry according to IUPAC [27,28].
The occurrence of OH radicals on irradiation of water was proven by Electron Spin Resonance (ESR) spectroscopy using spin traps (data not shown) following Sun et al. (1996) and Kochany et al. (1991, 1992) [29,30,31]. The photocatalytic degradation of LOM was also carried out in the presence of hydrogen peroxide (30% stabilized, Carl Roth, Karlsruhe, Germany) and titanium dioxide (P25 Aeroxide®, Arcos Organics, Geel, Belgium). Hydrogen peroxide was added to the solutions leading to final concentrations of 10 mg L−1 and 30 mg L−1 in the mixture. Concentrations were determined with Merckoquant test strips before and after irradiation. Further, titanium dioxide was used as a photocatalyst. Addition prior to irradiation led to concentrations of 50 and 100 mg L−1 titanium dioxide. The resulting milky solutions were irradiated with UV light.
In addition, degradation experiments were carried out with the effluent of a local WWTP (Krefeld) and from the river Erft (Neuss). The color of the wastewater was yellowish in both cases, the pH values of the two samples were determined to 8. Each sample was spiked with 20 mg L−1 LOM. This concentration was chosen to obtain results comparable with those of LOM in MilliQ water.

2.4. HPLC-ESI-Q-TOF-MS and HPLC-ESI-IT-MS

For the identification of transformation products at high sensitivity and high reliability, mass spectrometry was used as a detection system after chromatographic separation. Here, time-of-flight (TOF) MS was used for highly accurate m/z determination. Multiple fragmentation for structure elucidation and verification was achieved through ion-trap MS. Samples were analyzed using a high-performance liquid chromatography system (HPLC, Agilent 1100) combined with an ion-trap mass spectrometer (IT-MS, Thermo Finnigan LXQ, Waltham, MA, USA) to yield MSn. A reversed-phase column 3-Amides C-18, 150 mm × 2.00 mm, 3 µm (Polaris Agilent) was used for chromatographic separation. Temperature was kept at 40 °C and chromatography was performed isocratically within 15 min using MilliQ water (90%) and methanol (10%) with 0.1% formic acid each (Merck KGaA, EMSURE® ACS, Darmstadt, Germany, 98–100%) as eluents. The flow rate was set to 0.3 mL/min for all measurements. An electrospray ionization (ESI) source was attached to the IT-MS. For all experiments, the positive mode was used. The gas flow was adjusted to 15 L min−1, the capillary temperature was set to 300 °C and the capillary voltage amounted to 47 V. The mass range was scanned from 100 to 1000 m/z. Tandem or higher MS experiments were initiated using the software’s auto MSn mode using a threshold trigger. Mass spectrometer and HPLC system were controlled via XCalibur 2.0 running on a personal computer under Windows XP. Chromatograms and mass spectra were processed using the same software. Accurate masses were obtained using an ESI-Q-TOF mass spectrometer (Agilent 6530). A dual jet stream (ESI) source was used in positive mode. The collision gas flow was set to 8 L min−1, the gas temperature was 300 °C and the fragmentor voltage 175 V. The instruments were controlled via MassHunter Workstation B.06.00 running on a personal computer under Windows 7 Professional. Data were processed using the same software.

2.5. TOC

The total organic carbon (TOC) was determined using a TOC analyzer (TOC-V CSN Series Shimadzu, Kyoto, Japan). Calibration was performed between 2 and 20 mg L−1 carbon using solutions of sucrose. The pH of all samples was adjusted to 1–3 using concentrated sulfuric acid. Subsequently, potentially resulting gases in the samples were removed by ultrasonification for 15 min. Samples were taken before irradiation and during irradiation after 15, 30, 45, and 60 min and every hour for a total of 7 h. Injection volume was 150 μL for each sample. The device was controlled and results evaluated using TOC-Control software (Shimadzu, Kyoto, Japan). Each sample was measured in triplicates. Mean values yielded the concentrations. Prior to measurements, the TOC analyzer was equilibrated with the new sample to remove residual carbon. In addition, between each LOM sample acidified and degassed MilliQ water was measured.

2.6. Kinetic Analysis and Determination of Quantum Efficiency of the Photodegradation

Kinetic analysis of degradation profiles followed first-order or pseudo first-order kinetic models, consecutive and subsequent follow-up reaction models, cf. Equation (1), according to previous studies and theory [26,32,33,34,35,36,37]. The complete kinetic description is represented in the Supplementary Information.
A k 1 B +
Substance A reacts with the reaction rate constant k1 yielding an unknown number of products. The product can continue to react. The sequence can be understood as a consecutive or subsequent follow-up reaction. Rigorous mathematical treatment returns the time-dependent concentration c of educt A, with c A the actual and c A 0 the initial concentration of A, and the time t, cf. Equation (2).
c A = c A 0 · e k 1 t
From mass area-under-the-curve versus irradiation time graphs, degradation curves were obtained. The software MatLab R2017a (MathWorks, Natick, MA, USA) containing the curve fitting toolbox was used to compute the kinetic profiles of the degradation intermediates and products according to Equations (2)–(4) (see also Supplementary Information).

2.7. Determination of Quantum Efficiency

The quantum efficiency may be defined as the degradation rate divided by the number of photons absorbed [29]. The quantum efficiency Φ 254 at 254 nm was calculated using Equation (3) [38].
Φ 254 = k 2.303 l ε 254 I 0 , 254
where k (min−1) is the reaction rate constant of the degradation A→B, l is the reactor width of 3 cm, ε254 is the molar extinction coefficient in L mol−1 cm−1 and I0,254 the photon fluence rate in mmol min−1 L−1.

2.8. Assessment of Ecotoxicology

The assay method for the determination of MIC values of LOM followed the protocol by Wiegand, Hilpert, and Hancock [39]. The assay protocol is also given in ISO 20776-1:2007. As ubiquitous bacteria, Pseudomonas fluorescens (DSM-No. 50090) and Bacillus subtilis (DSM-No. 10) were selected. Bacterial growth was monitored before and after UV irradiation [40]. For more details see Supplemental Information. The calculation of IC50 was performed on the basis of the plot of bacterial growth versus compound concentration.
The time tact according to Equation (4) represents the decline in activity an antibiotic possesses against bacteria. It can be calculated from kinetic parameters obtained from degradation experiments, i.e., the and the rate constants k and the initial compound concentration cA0, and the MIC values (see above) [36].
t a c t = ln ( MIC c A 0 ) k 1
The software distributions T.E.S.T. and OECD QSAR Toolbox were applied for QSAR analyses [41,42]. Within T.E.S.T, the module QSAR was selected. Compound structures were drawn using ACD/ChemSketch 2016.1.1 (ACDLabs, Inc., Toronto, ON, Canada) and imported into the software T.E.S.T and QSAR toolbox. As relevant target organisms, Daphnia magna LC50 (48 h) in mg L−1, fathead minnow LC50 (96 h), ‘Photoinduced Toxicity on D. magna’, and ‘Mortality LC50 (48 h) of branchiopoda’ for non-specified test organisms were chosen due to their presence in the aquatic environment.

3. Results and Discussion

Selected physico-, photo-chemical, and mass spectrometric properties of LOM are collected in Table 1.
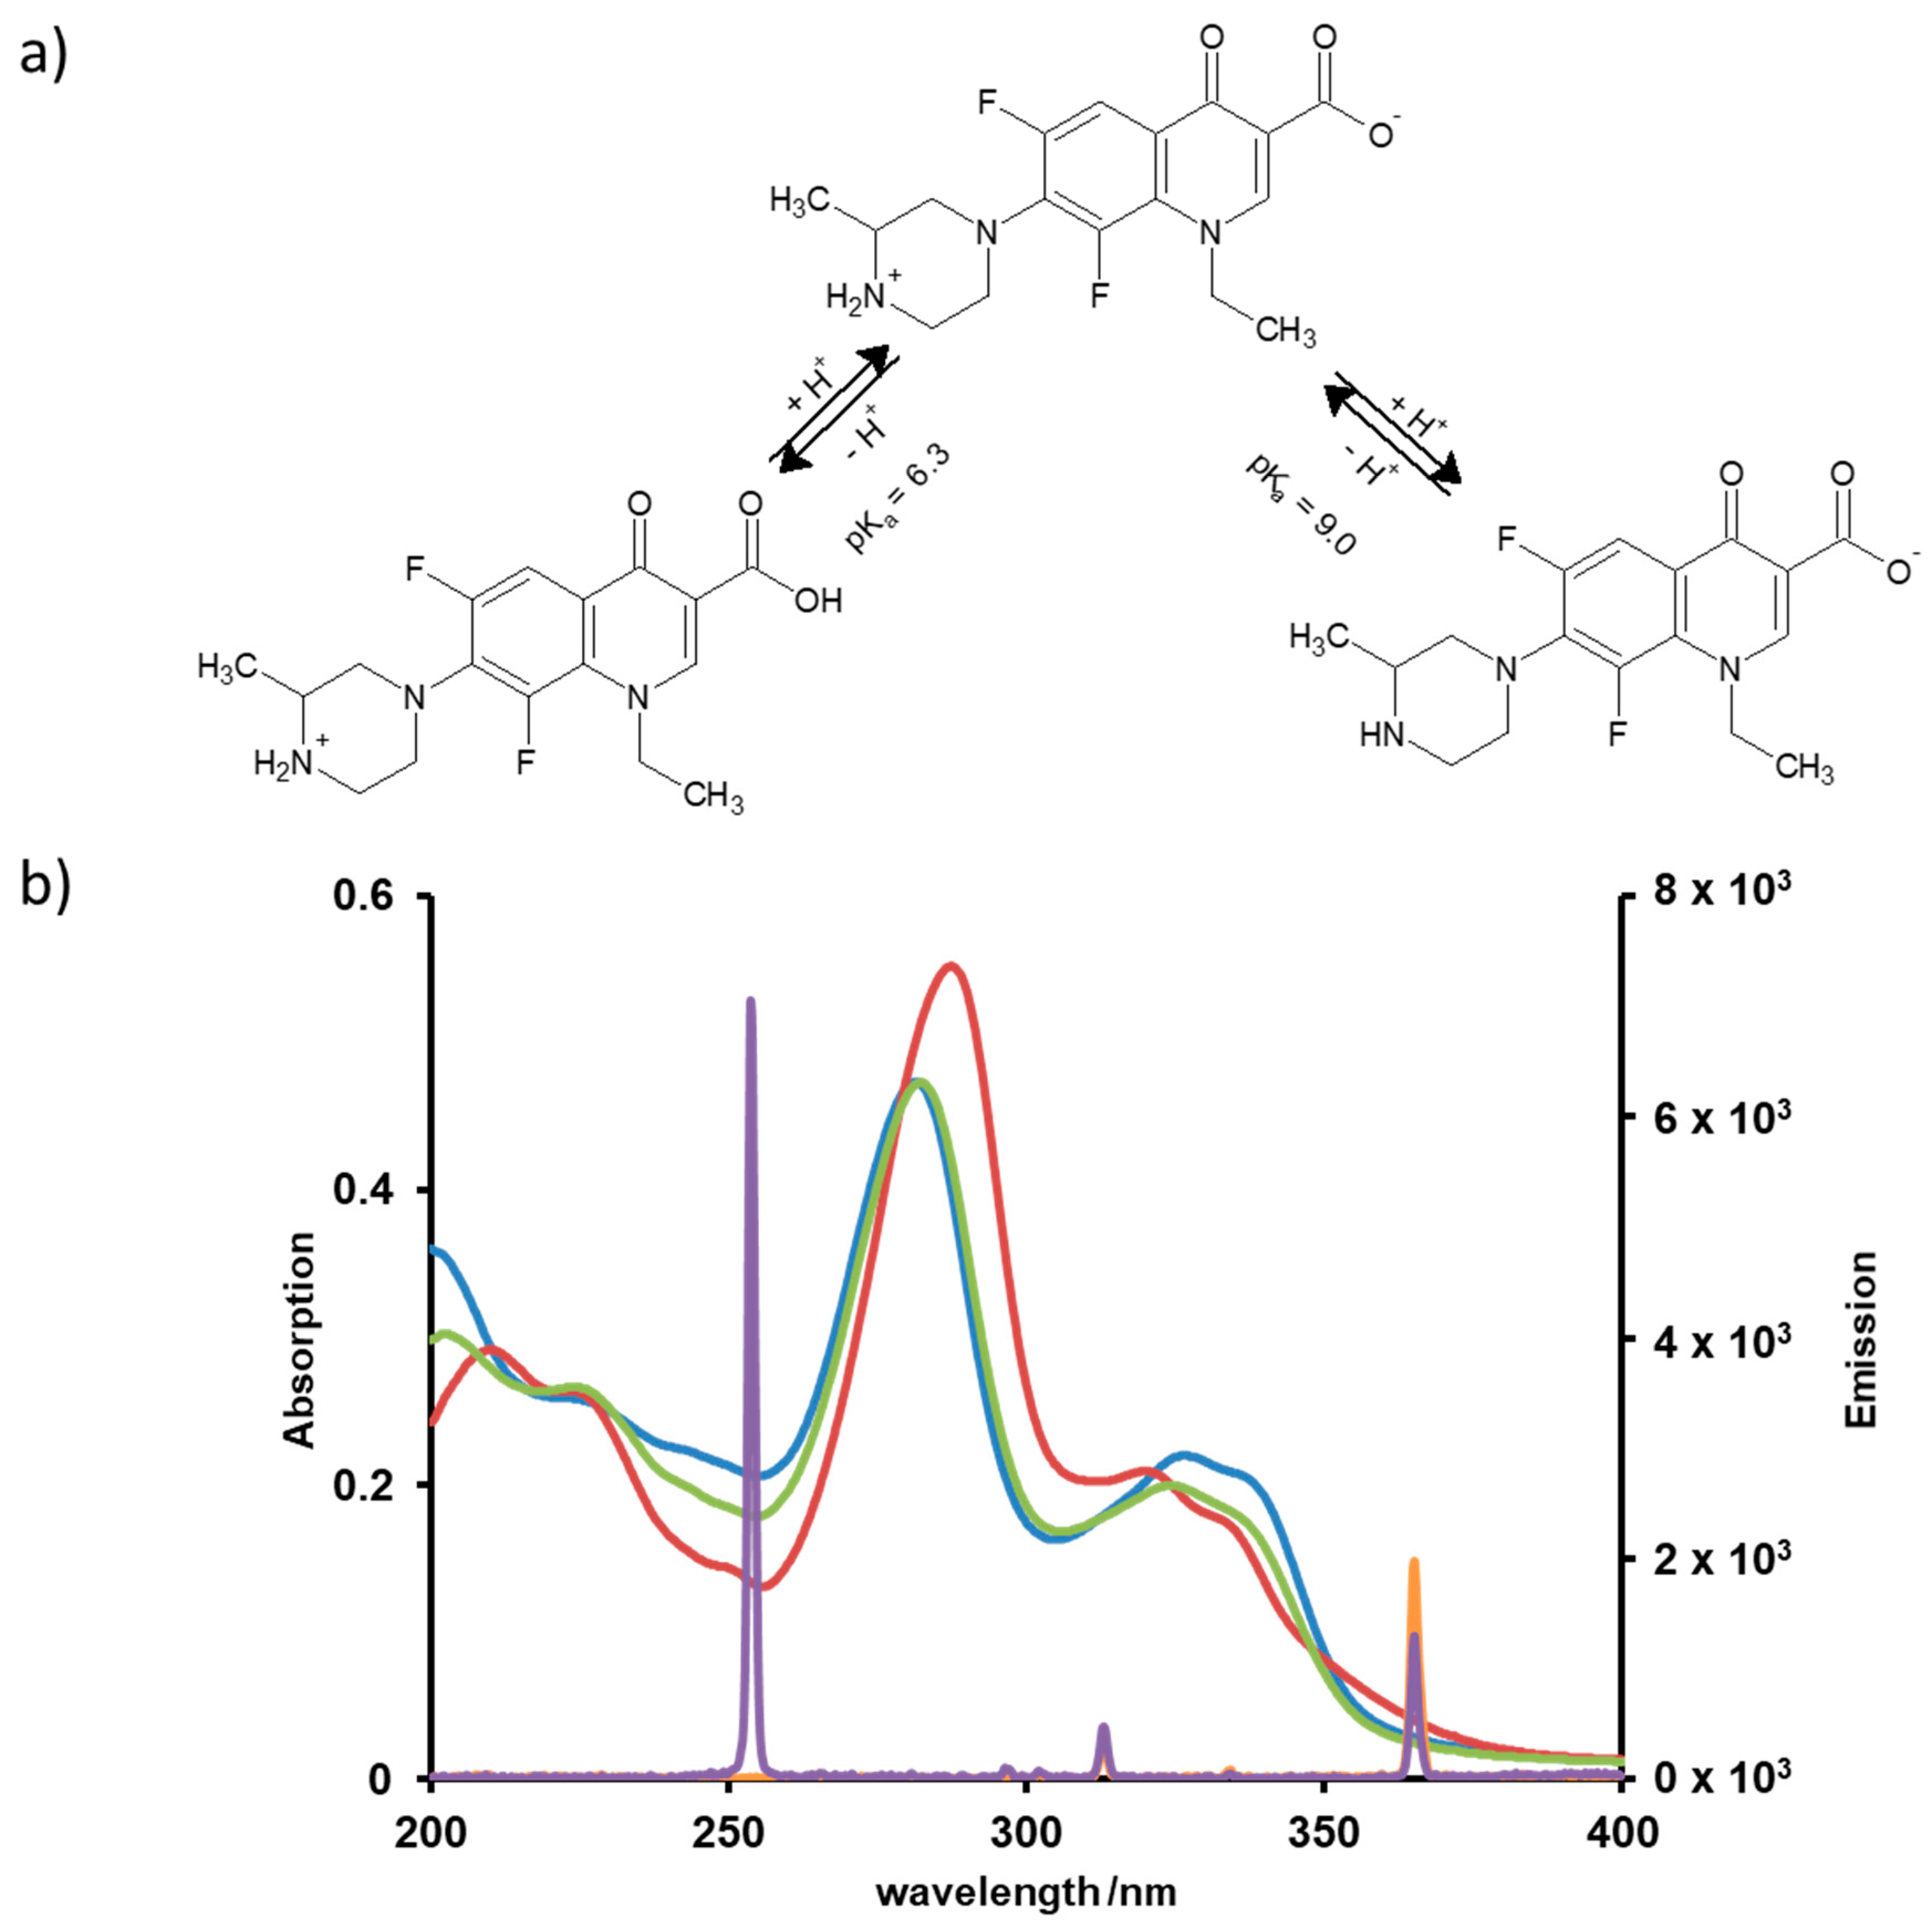
In neutral solutions, fluoroquinolones occur as zwitterions, as can be recognized from their pKa values. This property exercises influence on the photoinduced degradation through directing the chemical transformation and through the UV absorption efficiency, which depends on the pH as well, see Figure 2a. The spectral range of the irradiation also affects the quantum efficiencies. Hence, UVC or UVA lamps used in this study may lead to different transformation pathways and products. In order to predict conditions for efficient degradation of LOM, absorption spectra were recorded at different pH values and compared with the emission spectra of the lamps, see Figure 2b.

3.1. Occurrence of Lomefloxacin in Surface Water

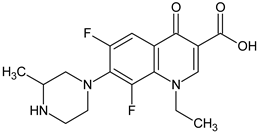
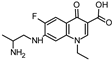
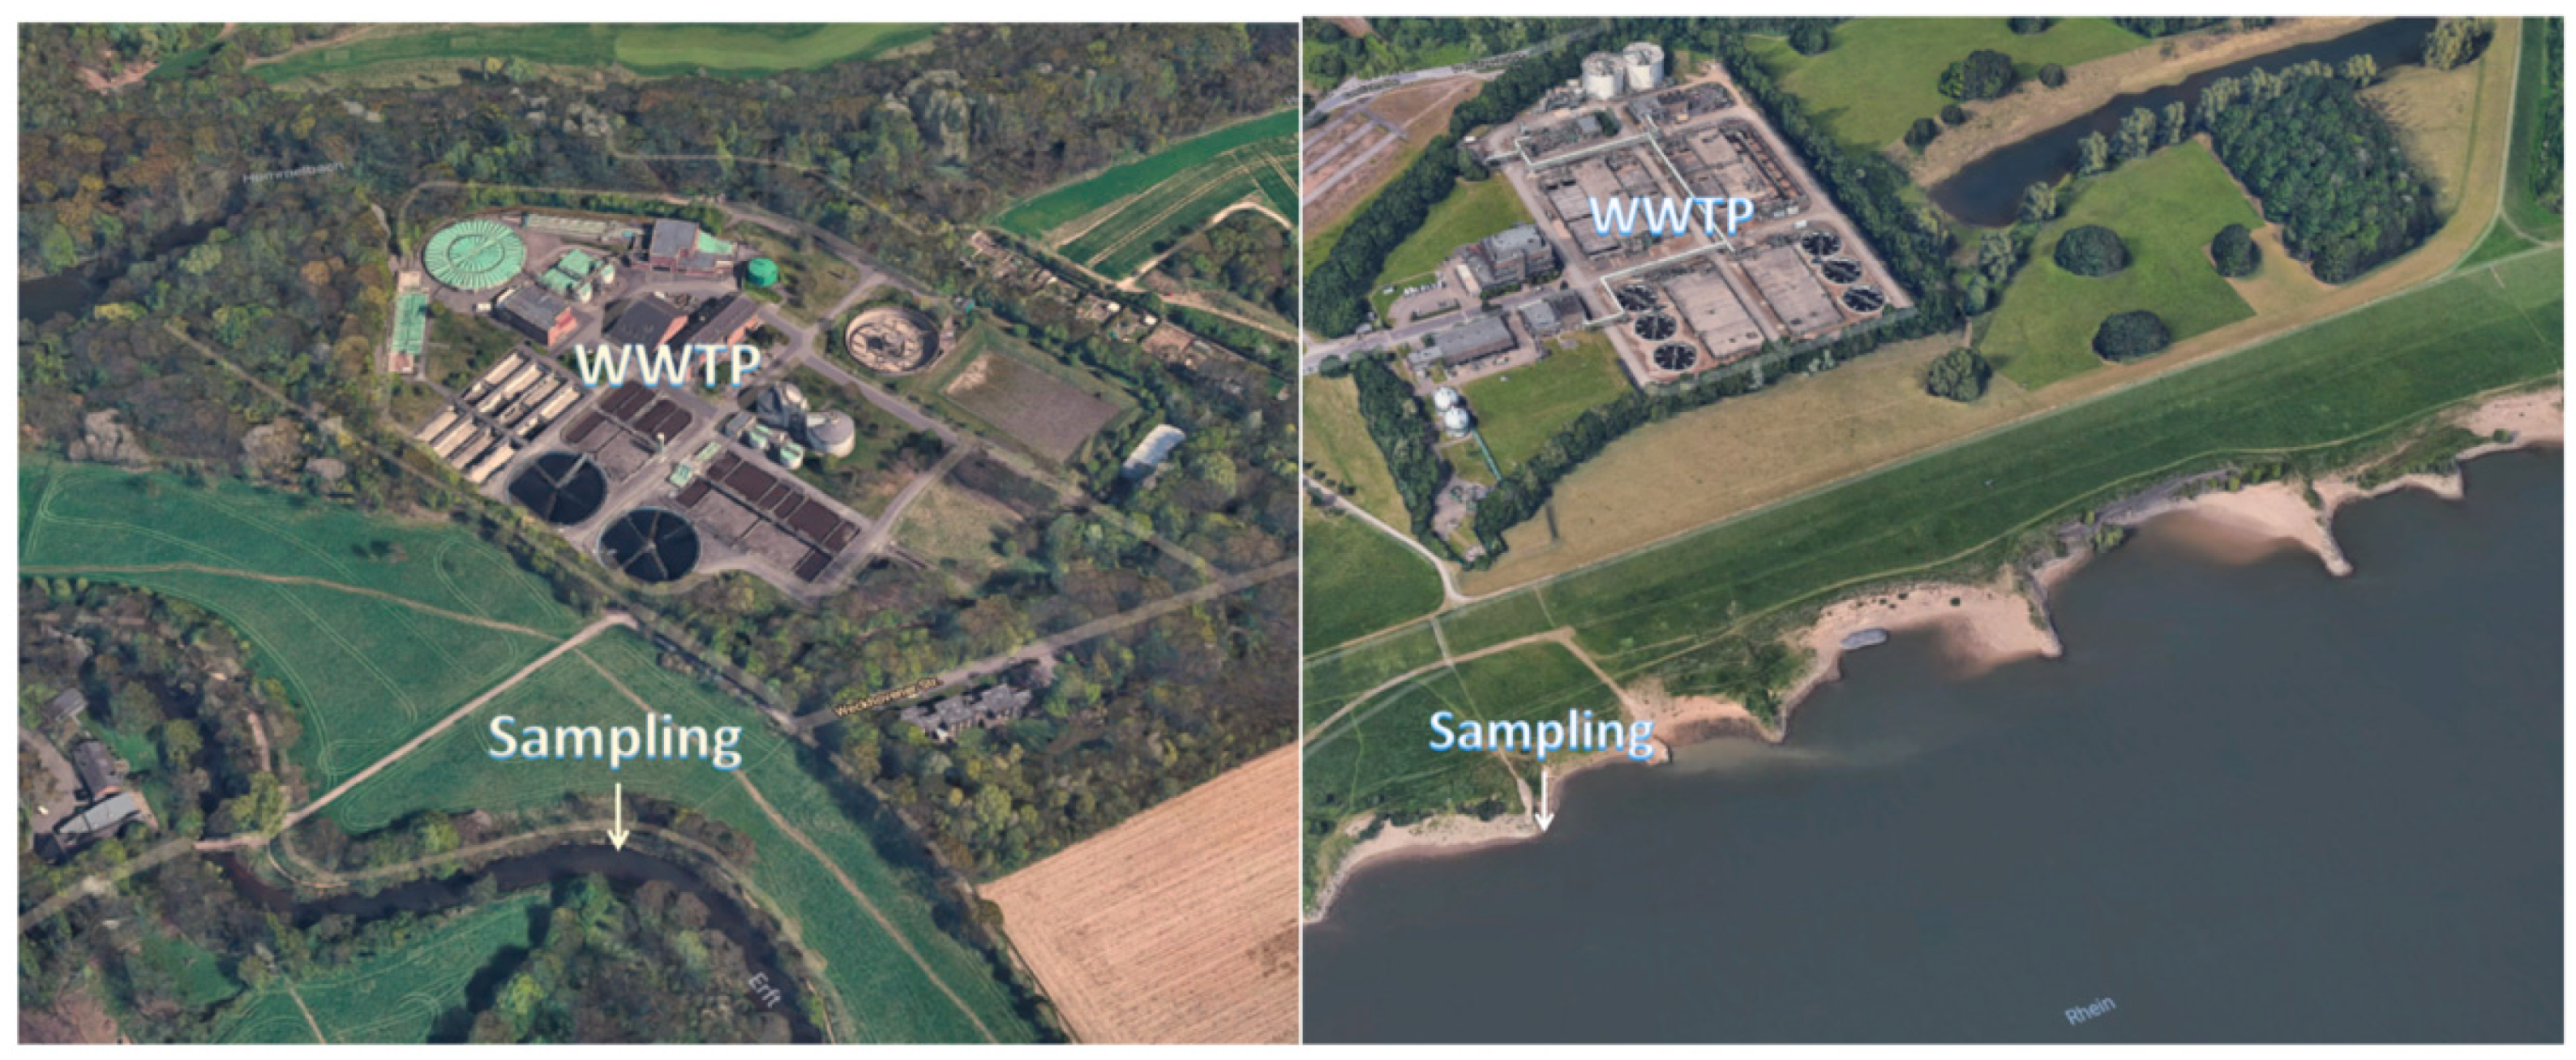
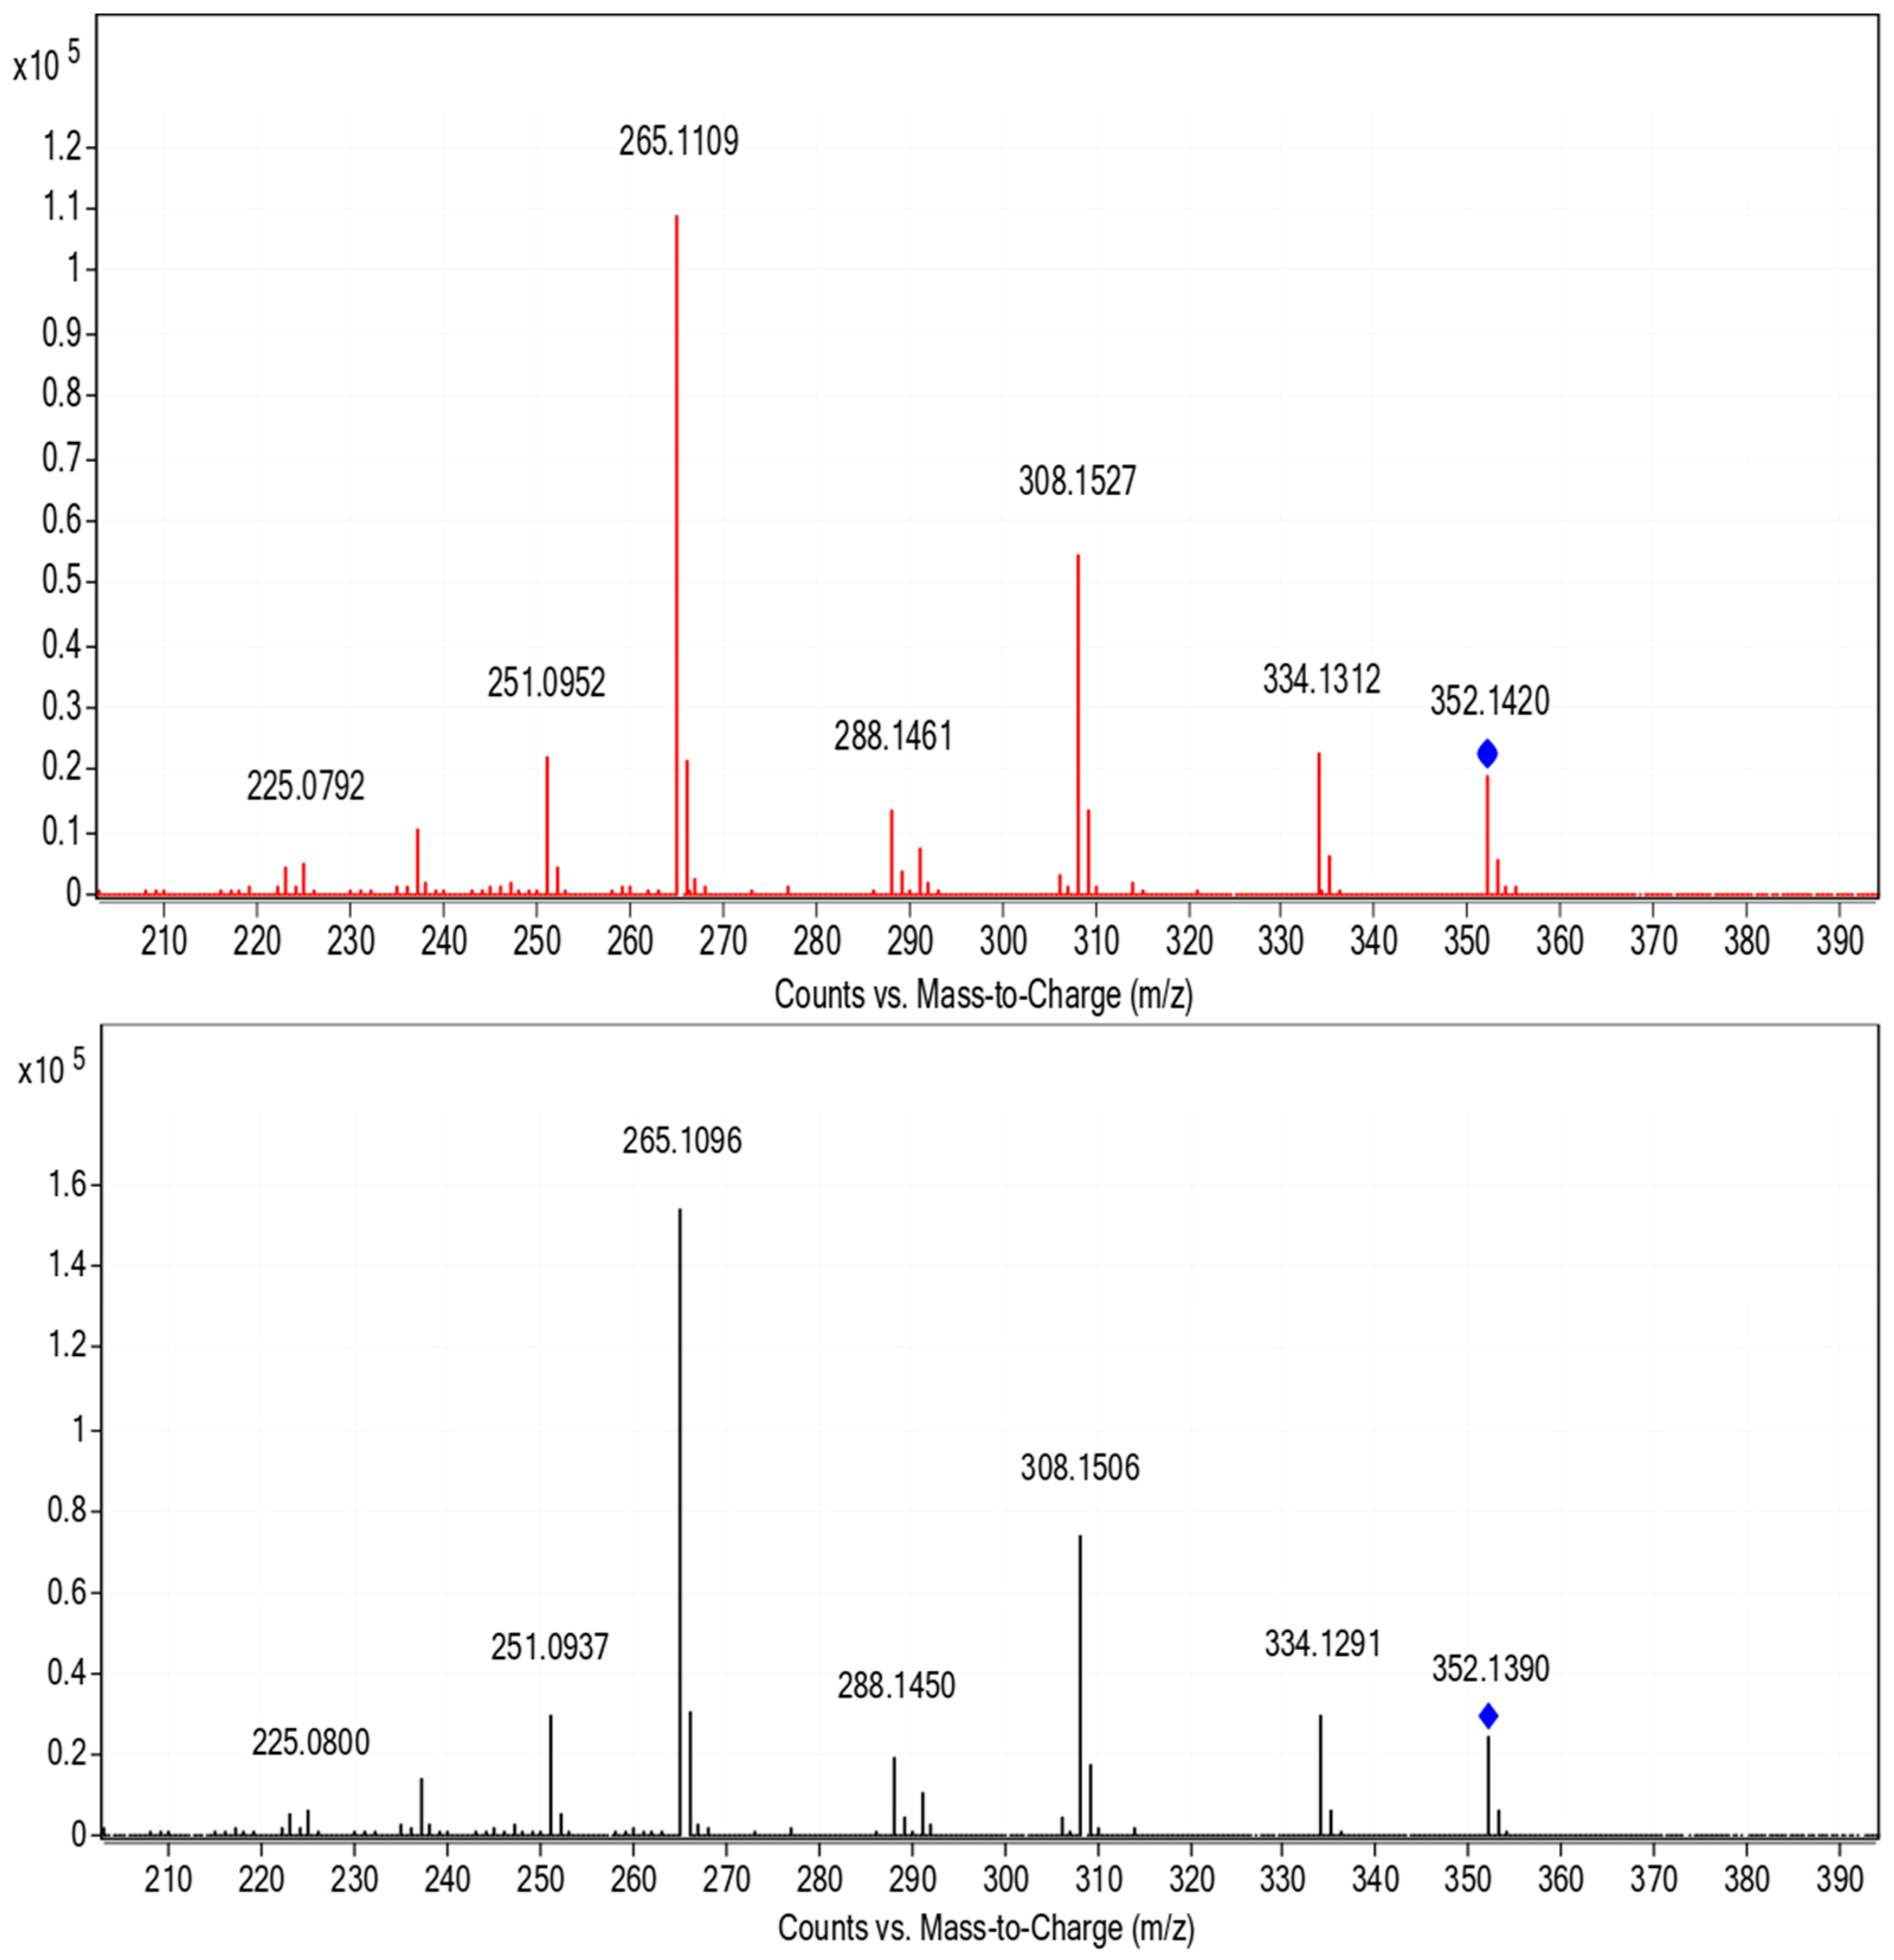
The presence of LOM is a worldwide problem, and thus, also in Germany. A sample from the River Erft showed the occurrence of LOM, whereby no LOM was observed in the sample from the River Rhine in summer 2018. The findings were confirmed through comparison of chromatographic retention times and the MS/MS fragmentation pattern with a LOM reference sample, see Figure 3. The accurate mass observed agreed also perfectly with the theoretical monoisotopic mass, cf. Table 1. Further substances were found in the river, such as the b1 receptor blocker metoprolol. The remaining substances found in both river water samples were not considered in this study.
Samples containing LOM were taken from the River Erft immediately after a sewage treatment plant, while in samples collected upstream of the plant showed no presence of LOM. In agreement with previous studies, WWTPs seem to concentrate LOM and act as entry path into the aquatic environment [43,44]. Findings as this underline the need for a fourth purification stage based on AOPs or at least advanced filtering systems. In this respect, the photo-induced degradation of LOM is investigated.

3.2. Photoinduced Degradation of Lomefloxacin—Kinetic of Degradation

The influence of UVA and UVC radiation, pH values, and model and surface water matrices on the photoinduced degradation were analyzed. Examples are given in Figure 4. Photoinduced transformation and degradation were monitored using HPLC-MS techniques and plotted as concentration or area-under-the-curve mass signals versus time (c-t).
The c-t curves obtained could be best described by first or pseudo-first order kinetics in agreement with previous studies [25,26,36]. The results are presented in Table 2 as kinetic rate constants and quantum efficiencies.
Radiation range, pH, and matrix were found to influence the degradation rate. While the degradation of LOM in acidic milieu was slowest, it could be quadrupled by increasing the pH. The water matrix also affects the degradation rate. In MilliQ water, the degradation is faster compared to effluent and river water. In environmental water matrices, a large variety of compounds are present and decrease the amount of light reaching LOM which induces its transformation or degradation. The effect of pH on the rate constants may be twofold. Firstly, LOM itself may be degraded faster in its zwitterionic or anionic state, like in neutral and alkaline milieu. Secondly, the photoinduced formation of hydroxyl radicals contributes to the degradation and is pH dependent. The presence of hydroxide hampers hydroxyl radical induced degradation, hence would decrease the part of the rate constant originating from this mechanism. Yet, hydroxide can act as a reagent itself and would lead to an increase of the rate constant. As can be seen from Table 2, quantum efficiencies exceeding 1 suggest more than one mechanism in action. In conclusion, the obviously best conditions for the removal of LOM were UVC irradiation and a pH between neutral and slightly alkaline.
Among AOPs, photocatalysts, such as titanium dioxide in combination with UVA irradiation or hydrogen peroxide in combination with UVC irradiation, were often used to accelerate the degradation of many anthropogenic micropollutants [7,45,46,47]. Yet, no significant differences were observed between presence and absence of these photocatalysts in this study, see Table 3. The sole exception occurred when the degradation was accelerated in the presence of hydrogen peroxide under UVC irradiation at pH 3–4. The lack of efficiency of hydrogen peroxide was traced back to saturation effects [7,48], while the presence of titanium dioxide was assumed to cause light scattering hence reducing the amount of light for direct degradation [49]. Since effluents most often show pH values in the neutral or weak alkaline range, no need for the application of hydrogen peroxide or titanium dioxide was indicated.
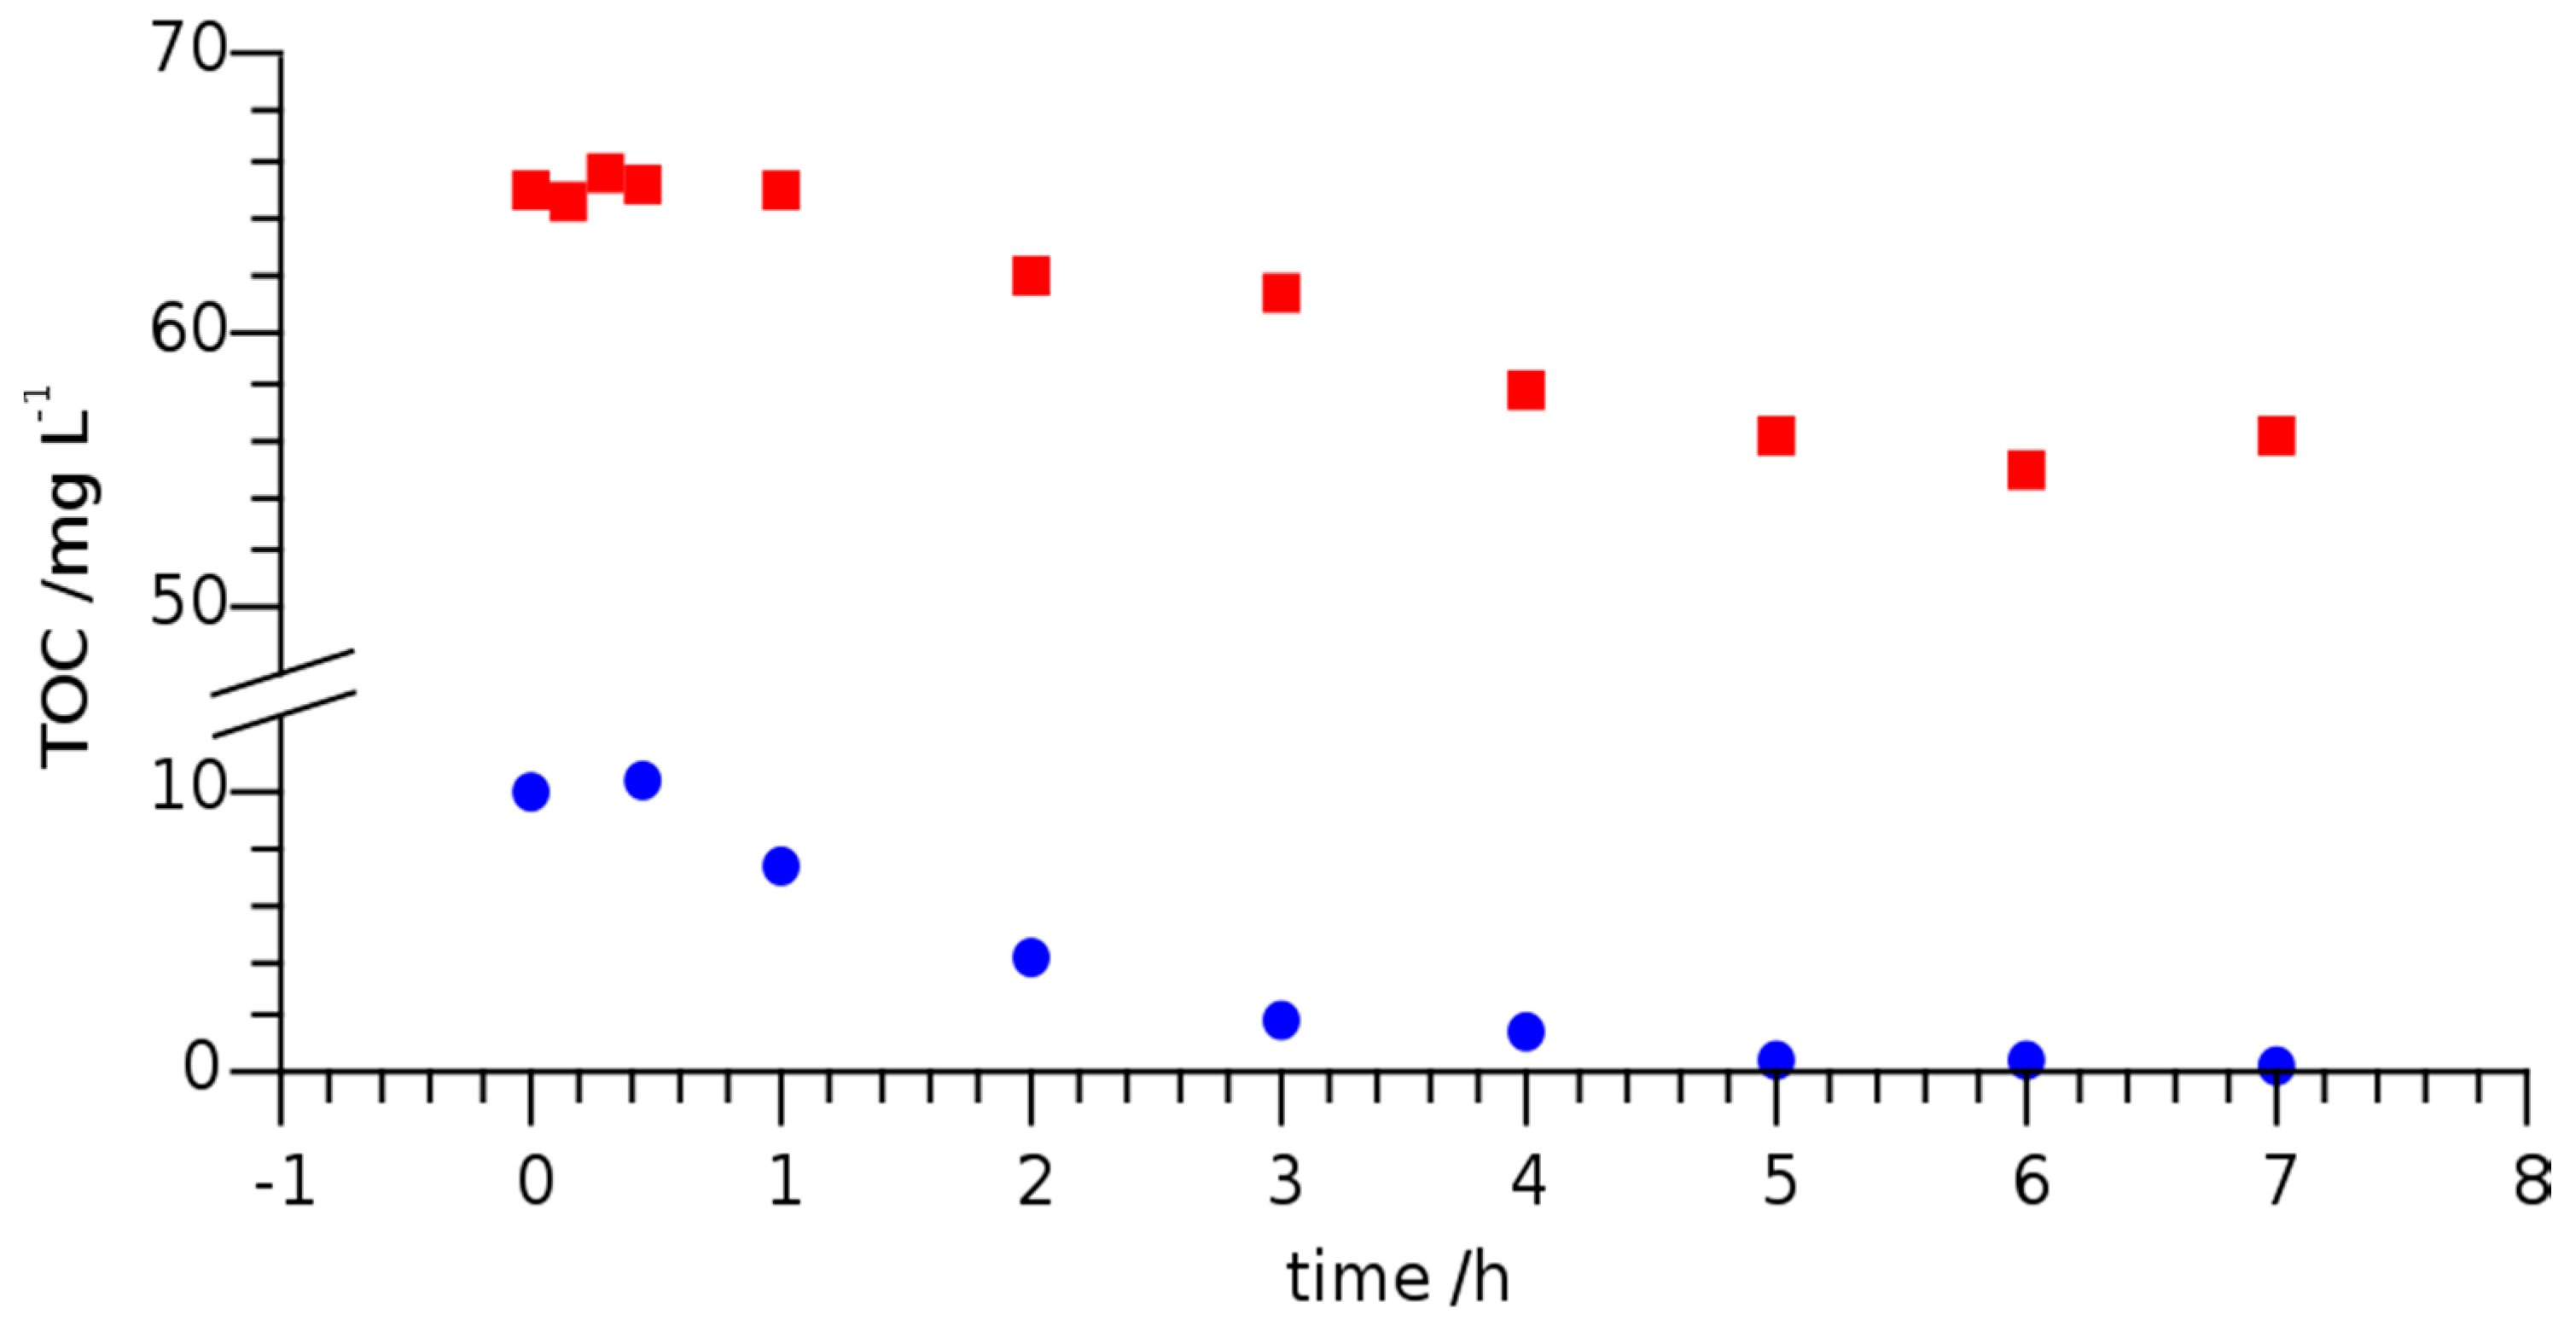
To this point, only the induced degradation of LOM was considered. Since organic decomposition products were formed, it was also interesting to monitor TOC with irradiation time. Figure 5 shows the irradiation time dependent TOC of LOM in river Erft water and MilliQ water at an initial concentration of 20 mg L−1 and under UVC irradiation.
The initial TOC in river water was about 6.5 times higher than that of MilliQ water containing 20 mg L−1 of LOM, since the river water contained a variety of organic substances. After 7 h of UVC irradiation, the TOC in both samples was reduced by 10 mg L−1. As the initial TOC of the MilliQ water sample amounted to 10 mg L−1, complete mineralization was achieved. In contrast, the irradiation time of the river Erft water sample would have had to be significantly extended for complete mineralization. It is obvious that TOC is no suitable measure for the removal of LOM or other pharmaceuticals as surface waters or effluents carry innumerable organic compounds that react differently to UV exposure. Nevertheless, it is reasonable to assume that LOM degradation proceeded via transformation products that were analyzed and identified using HPLC-ESI-Q-TOF-MS and HPLC- ESI-IT-MS as described in the following section.

3.3. Photoinduced Degradation Products of Lomefloxacin

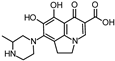
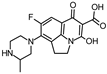
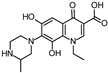
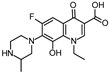
During the degradation experiments, both known and unknown compounds were identified by HPLC-ESI-IT-MS and/or HPLC-ESI-Q-TOF-MS. An overview of the observed substances is shown in Table 4.
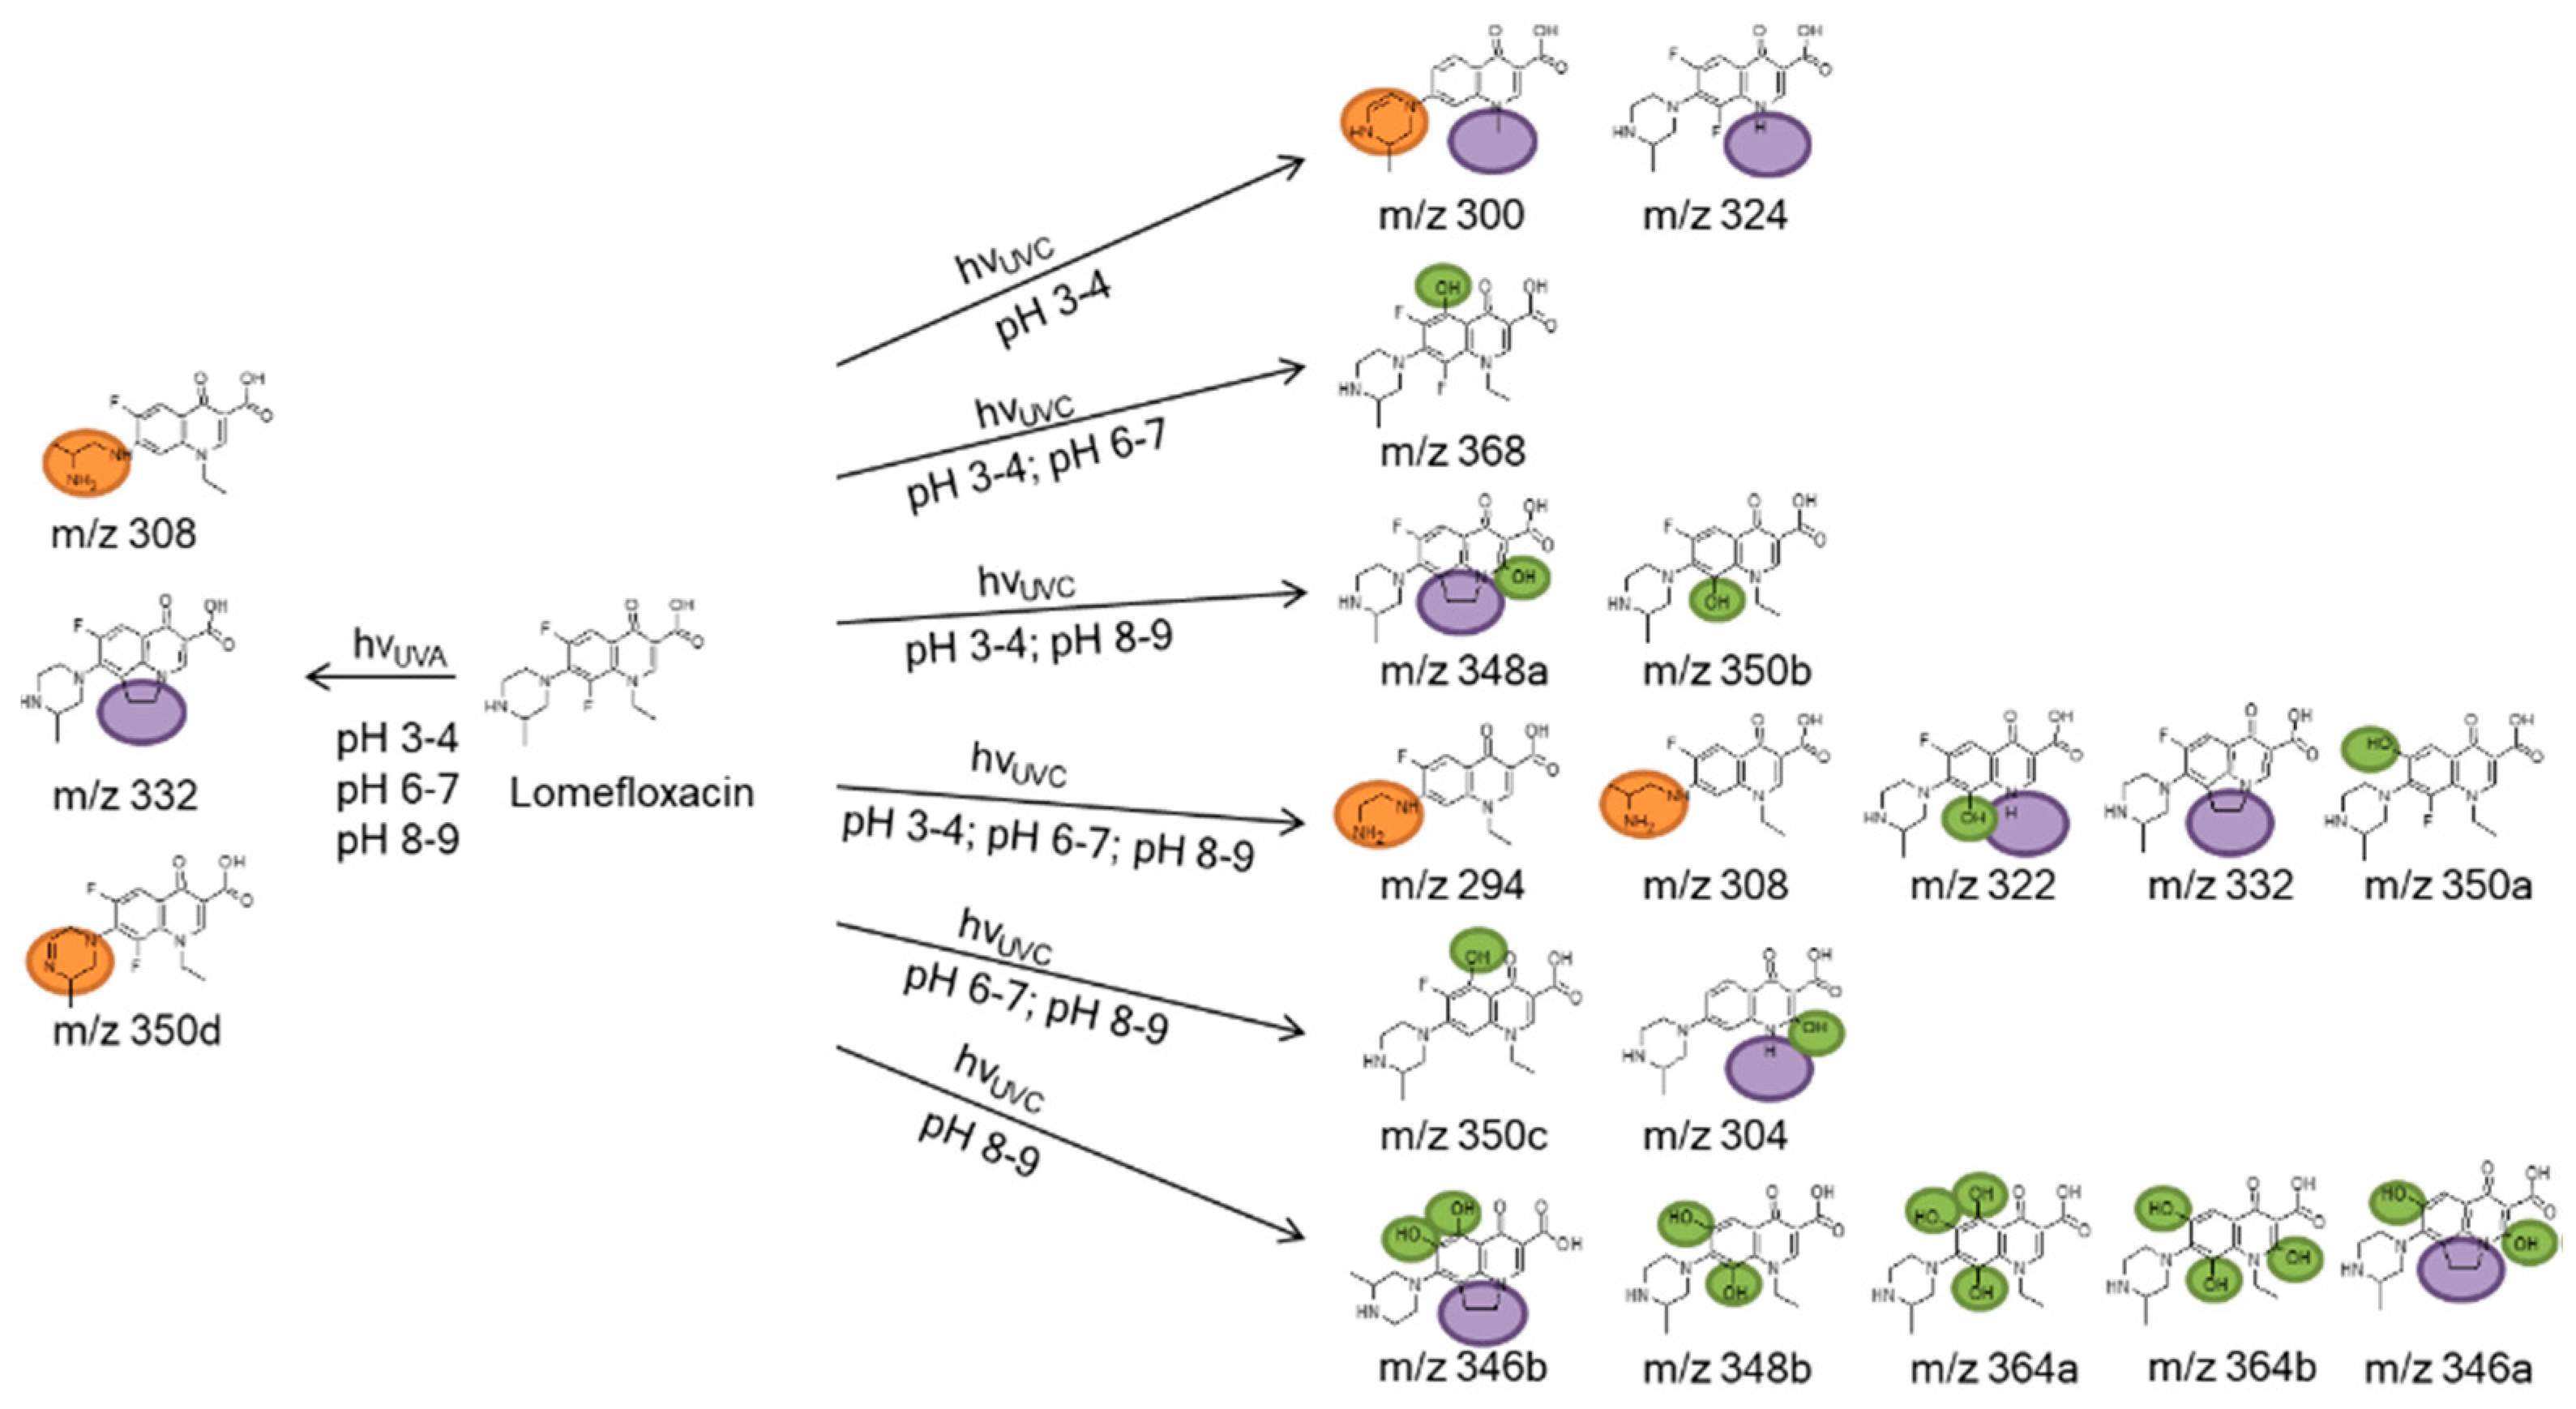
Some of the photodegradates shown in 
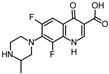
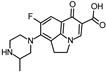
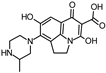
Table 4 were preferably formed on UVA irradiation, others exclusively on UVC irradiation. The latter gave rise to many more transformation products. In particular, the effect of hydroxyl group substitution was recognized when using different radiation sources. Alkaline pH and UVC irradiation yielded relatively many photodegradates with hydroxyl substituents, whereas these products could not be identified on UVA irradiation, see green marks in Figure 6. Photoinduced deconstruction of the piperazine moiety seemed independent of pH, see orange marks in Figure 6. The same observation was made for reactions of the ethyl substituent on the quinolone nitrogen, cf. purple marks in Figure 6. Although it cannot be ruled out that different mechanisms might lead to identical transformation products, it could be concluded that pH independent UVA and UVC photoinduced chemistry led to the fragmentation of the piperazine ring. The ethyl substituent reactions might stem from hydroxyl radical and hydroxide chemistry depending on pH, as hydroxide acts as radical scavenger for hydroxyl radicals. At last, fluorine substitution by and addition of hydroxyl groups might also be due to both mechanisms, depending on pH. An overview of the observed transformation products is given in Figure 6. As indicated in Table 4, seven not previously reported products were proposed based on MS2 and MS3 experiments.
Following kinetic analysis of the c-t diagrams, see Figure 4, most of the transformation products could be described as intermediate products. While only the intermediate with m/z = 332 due to UVA irradiation possessed a life-time well above 30 min, all photoproducts due to UVC irradiation were eliminated within 15 min, cf. Figure 4. Under suitable neutral and slightly alkaline conditions, UVC irradiation led to faster elimination of LOM and its photoproducts than UVA irradiation.

3.4. Assessment of Ecotoxicity

To assess the ecotoxicity of the resulting products and intermediates of the photoinduced elimination of LOM, IC50, and MIC values were determined. The MIC value of LOM against B. subtilis was found 0.17 µg·mL−1, and 0.92 µg·mL−1 against P. fluorescens. The IC50 value of LOM against B. subtilis was 0.09 µg·mL−1 and 0.22 µg·mL−1 against P. fluorescens. As discussed in previous studies, IC50 values can be determined more accurately than MIC values due to their graphical representation [9]. Yet, an error of a factor of 2 is negligible due to the dilution assay format. A factor of 4 between IC50 and MIC in the case of 
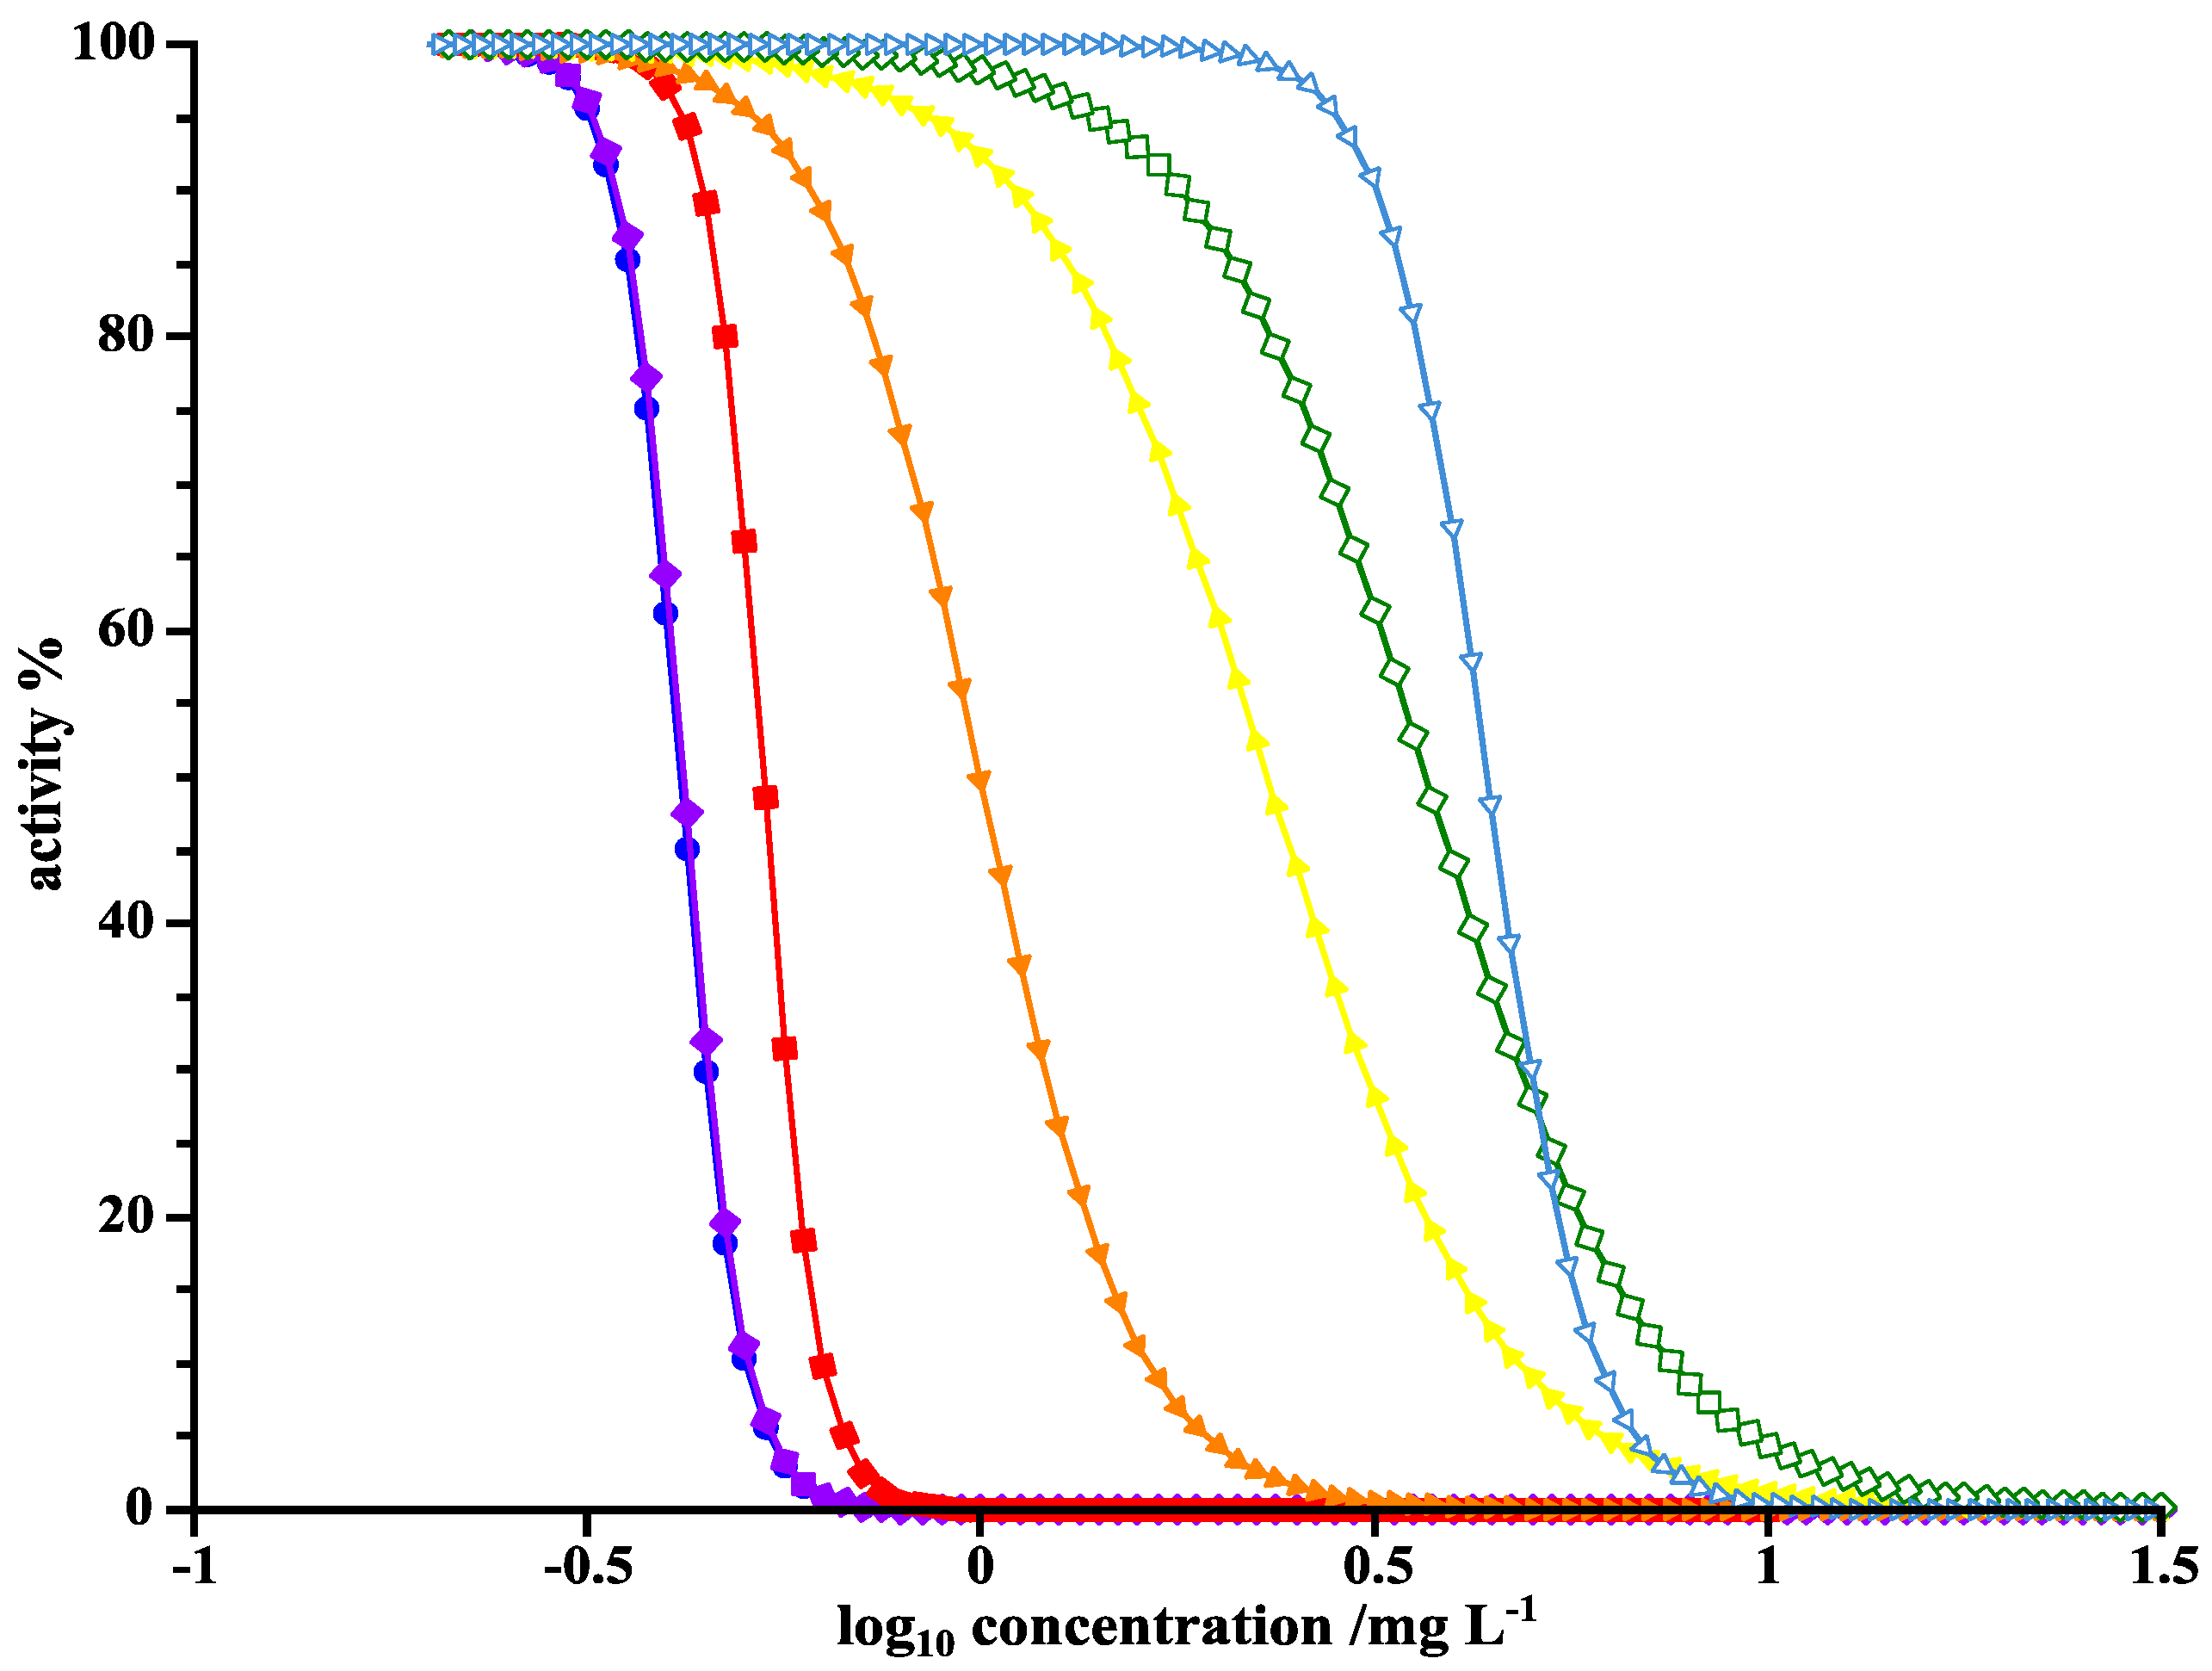
P. fluorescens is rather large. Example curves for IC50 determination are given in Figure 7.
As expected, the longer the LOM solution was irradiated with UVA light, the higher the IC50 grew and the least activity remained. The comparison between MIC and IC50 values depending on time of irradiation by UVA and UVC is shown in Table 5.
In general, activity decreased with irradiation times where UVC irradiation appeared more effective than UVA, as can be seen from the higher MIC values at equal irradiation times. Since both bacteria represent Gram-positive and Gram-negative species ubiquitous in the aquatic environment, the lack of activity of a compound or compound mixture has been proposed as means to assess the ecotoxicity [11]. The advantage of the assay is its ease of use. While QSAR analyses often rely on the knowledge of the exact structures of the transformation products after AOP application, MIC or IC50 values represent sum parameters and therefore reflect the activity in total, hence answering indirectly to an assumption that transformation products might be more ecotoxic than the initial drug itself.
To address the issue whether transformation products are less or more toxic than their parent drug, QSAR analyses represent a common approach, since the synthesis of the suggested products is usually expensive, and no corresponding standards were available in this case. QSAR analysis was carried out on the basis of the chemical structures of the known and newly identified products of LOM, see Table 4. The results for selected species are presented in Table 6.
Most of the photoproducts observed in this work were predicted less toxic by the QSAR methods. The result was expected since the groups known to be responsible for the efficacy of fluoroquinolones were altered or deconstructed through irradiation or photoinduced chemistry. Differences in predictions against the same organisms were due to different programs or databases contained therein. Values for Daphnia magna were not obtained from the QSAR toolbox. A direct comparison could be achieved for fathead minnow. Here, the values differed by several orders of magnitude, and the toxicity was predicted differently for several product structures, cf. Table 6. This can be traced back to different databases and calibration models contained in the two programs. The prediction and computation of t.e.s.t. software is based on the database of EUCAST, while the QSAR toolbox calculation is based on the data of the European Chemicals Bureau. A literature search for reference data remained unsuccessful. Despite the different absolute values, both predictions were consistent with reference to the parent drug. Photoproducts were mostly predicted potentially less toxic. An exception was the product with m/z = 324, which strongly resembled the educt after elimination of the ethyl substituent. Yet, QSAR analyses do not take concentrations into account, hence do not reflect the ecotoxicological activity of a mixture. In this respect, MIC and IC50 values provide total activity information, although the extent of relevance of the model bacteria to the aquatic environment has not been proven yet.
When irradiation is considered for removal of pharmaceuticals before entering the environment, degradation rate constants in combination with MIC- or IC50- values allow to determine the irradiation time according to Equation (4). The equation relates activity against bacteria with compound transformation or degradation. Hence, the time to remove potential ecotoxicological hazard from a sample containing LOM could be estimated. The values obtained for LOM samples in MilliQ water and effluent exposed to UVC irradiation are shown in Table 7.
An irradiation of 10 min was calculated sufficient to remove efficacy against the investigated microorganisms P. fluorescens and B. subtilis regardless of pH and water matrix. In acid milieu, tact is highest. The comparison between different water matrices showed that a longer irradiation time was necessary to compensate for the presence of other compounds and light absorbing substances and to remove the risk of ecotoxicity in effluent water having pH 8.
The use of UV radiation for large-scale compound removal in WWTPs would lead to rather high energy consumption. Cost of goods for sufficiently large UVA and UVC lamps may also significantly increase treatment costs. Nonetheless, UV treatment is applied for microbiological treatment of drinking water. As UV irradiation proved a rather efficient measure for pharmaceutics elimination, UV treatment could be performed on demand. This might be achieved through effluent monitoring and switching on irradiation at need.

4. Conclusions

The investigation of water samples from the German river Erft showed the presence of the fluoroquinolone LOM. Photoinduced removal of LOM was investigated in model water and effluent at acidic, neutral, and basic milieu und UVA and UVC irradiation using HPLC-MSn techniques. As AOP catalysts, hydrogen peroxide and titanium dioxide were used. First order kinetic models applied to concentration–time plots of LOM and its phototransformation products showed that LOM degraded fastest at pH 8 in the absence of hydrogen peroxide and titanium dioxide. Products were eliminated within 10 min of UVX irradiation. Known and novel transformation products of LOM were identified using MSn. Both MIC/IC50 determination against P. fluorescens and B. subtilis and QSAR analyses suggested the removal of ecotoxicological hazard after sufficiently long irradiation. Matrix effects of effluent or surface water required prolonged irradiation in comparison to model water. With the help of degradation rate constants and activity parameters such as MIC and irradiation time until absence of activity, the potential ecotoxicity might be predicted using Equation (4). This investigation of LOM as an example might support the search for suitable AOPs as fourth purification steps in WWTPs and the prediction of treatment time.

Supplementary Materials

The following are available online at https://www.mdpi.com/2571-8797/2/1/6/s1, Document 1: Supplemental Information.

Author Contributions

M.V., investigation; formal analysis; writing—original draft preparation; M.V., B.H., N.T., C.S. and I.B., performed the experiments; A.N.-H., supervision of biological testing; M.J., supervision, writing—original draft preparation, writing—review, and editing. All authors have read and agreed to the published version of the manuscript.

Funding

This research received no external funding.

Acknowledgments

The authors thank their institution for further financial support.

Conflicts of Interest

The authors declare no conflicts of interest.

References

  1. Zhang, P.; Zhou, H.; Li, K.; Zhao, X.; Liu, Q.; Li, D.; Zhao, G. Occurrence of pharmaceuticals and personal care products, and their associated environmental risks in a large shallow lake in north China. Environ. Geochem. Health 2018, 40, 1525–1539. [Google Scholar] [CrossRef]
  2. Sousa, J.C.G.; Ribeiro, A.R.; Barbosa, M.O.; Pereira, M.F.R.; Silva, A.M.T. A review on environmental monitoring of water organic pollutants identified by EU guidelines. J. Hazard. Mater. 2018, 344, 146–162. [Google Scholar] [CrossRef]
  3. Gogoi, A.; Mazumder, P.; Kumar, V.; Chaminda, G.G.T.; Kyoungjin, A.; Kumar, M. Groundwater for Sustainable Development Occurrence and fate of emerging contaminants in water environment: A review. Groundw. Sustain. Dev. 2018, 6, 169–180. [Google Scholar] [CrossRef]
  4. Hamad, B. The antibiotics market. Nat. Rev. Drug Discov. 2010, 9, 675–676. [Google Scholar] [CrossRef] [PubMed]
  5. Kümmerer, K. Antibiotics in the aquatic environment—A review—Part I. Chemosphere 2009, 75, 417–434. [Google Scholar] [CrossRef] [PubMed]
  6. Nakata, H.; Kannan, K.; Jones, P.D.; Giesy, J.P. Determination of fluoroquinolone antibiotics in wastewater effluents by liquid chromatography-mass spectrometry and fluorescence detection. Chemosphere 2005, 58, 759–766. [Google Scholar] [CrossRef] [PubMed]
  7. Parsons, S. Advanced Oxidation Processes for Water and Wastewater Treatment; IWA Publishing: London, UK, 2004. [Google Scholar]
  8. Yuan, F.; Hu, C.; Hu, X.; Qu, J.; Yang, M. Degradation of selected pharmaceuticals in aqueous solution with UV and UV/H2O2. Water Res. 2009, 43, 1766–1774. [Google Scholar] [CrossRef] [PubMed]
  9. Hain, E.; Wammer, K.H.; Blaney, L. Comment on Photodegradation of sulfathiazole under simulated sunlight: Kinetics, photo-induced structural rearrangement, and antimicrobial activities of photoproducts by Niu et al. Water Research 124 2017 576 e 583. Water Res. 2018, 131, 205–207. [Google Scholar] [CrossRef] [PubMed]
  10. Niu, X.; Glady-croué, J.; Croué, J. Photodegradation of sulfathiazole under simulated sunlight: Kinetics, photo-induced structural rearrangement, and antimicrobial activities of photoproducts. Water Res. 2017, 124, 576–583. [Google Scholar] [CrossRef]
  11. Voigt, M.; Bartels, I.; Nickisch-Hartfiel, A.; Jaeger, M. Determination of minimum inhibitory concentration and half maximal inhibitory concentration of antibiotics and their degradation products to assess the eco-toxicological potential. Toxicol. Environ. Chem. 2019, 101, 315–338. [Google Scholar] [CrossRef]
  12. Dan, A.; Zhang, X.; Dai, Y.; Chen, C.; Yang, Y. Occurrence and removal of quinolone, tetracycline, and macrolide antibiotics from urban wastewater in constructed wetlands. J. Clean. Prod. 2020, 252, 119677. [Google Scholar] [CrossRef]
  13. Gothwal, R. Shashidhar Occurrence of high levels of fluoroquinolones in aquatic environment due to effluent discharges from bulk drug manufacturers. J. Hazard. Toxic Radioact. Waste 2017, 21, 05016003. [Google Scholar] [CrossRef]
  14. Zhang, Z.; Xie, X.; Yu, Z.; Cheng, H. Influence of chemical speciation on photochemical transformation of three fluoroquinolones (FQs) in water: Kinetics, mechanism, and toxicity of photolysis products. Water Res. 2019, 148, 19–29. [Google Scholar] [CrossRef]
  15. Tammam, M.H. Photostability studies on gemifloxacin and lomefloxacin in bulk powder and dosage forms. Eur. J. Chem. 2014, 5, 73–80. [Google Scholar] [CrossRef] [Green Version]
  16. Miranda, A.C.; Lepretti, M.; Rizzo, L.; Caputo, I.; Vaiano, V.; Sacco, O.; Lopes, W.S.; Sannino, D. Surface water disinfection by chlorination and advanced oxidation processes: Inactivation of an antibiotic resistant E. coli strain and cytotoxicity evaluation. Sci. Total Environ. 2016, 554–555, 1–6. [Google Scholar] [CrossRef]
  17. Guo, C.; Wang, K.; Hou, S.; Wan, L.; Lv, J.; Zhang, Y.; Qu, X.; Chen, S.; Xu, J. H2O2and/or TiO2photocatalysis under UV irradiation for the removal of antibiotic resistant bacteria and their antibiotic resistance genes. J. Hazard. Mater. 2017, 323, 710–718. [Google Scholar] [CrossRef] [Green Version]
  18. Vracko, M. Mathematical (Structural) Descriptors in QSAR: Applications in Drug Design and Environmental Toxicology; Elsevier: Amsterdam, The Netherlands, 2016; Volume 1, ISBN 9781681081977. [Google Scholar]
  19. Zhu, H.; Shen, Z.; Tang, Q.; Ji, W.; Jia, L. Degradation mechanism study of organic pollutants in ozonation process by QSAR analysis. Chem. Eng. J. 2014, 255, 431–436. [Google Scholar] [CrossRef]
  20. Kruhlak, N.L.; Contrera, J.F.; Benz, R.D.; Matthews, E.J. Progress in QSAR toxicity screening of pharmaceutical impurities and other FDA regulated products. Adv. Drug Deliv. Rev. 2007, 59, 43–55. [Google Scholar] [CrossRef]
  21. Abdel-Aziz, A.A.M.; Asiri, Y.A.; Al-Agamy, M.H.M. Design, synthesis and antibacterial activity of fluoroquinolones containing bulky arenesulfonyl fragment: 2D-QSAR and docking study. Eur. J. Med. Chem. 2011, 46, 5487–5497. [Google Scholar] [CrossRef]
  22. Anquetin, G.; Greiner, J.; Mahmoudi, N.; Santillana-Hayat, M.; Gozalbes, R.; Farhati, K.; Derouin, F.; Aubry, A.; Cambau, E.; Vierling, P. Design, synthesis and activity against Toxoplasma gondii, Plasmodium spp., and Mycobacterium tuberculosis of new 6-fluoroquinolones. Eur. J. Med. Chem. 2006, 41, 1478–1493. [Google Scholar] [CrossRef]
  23. Toolaram, A.P.; Haddad, T.; Leder, C.; Kümmerer, K. Initial hazard screening for genotoxicity of photo-transformation products of ciprofloxacin by applying a combination of experimental and in-silico testing. Environ. Pollut. 2016, 211, 148–156. [Google Scholar] [CrossRef]
  24. Voigt, M.; Bartels, I.; Nickisch-Hartfiel, A.; Jaeger, M. Elimination of macrolides in water bodies using photochemical oxidation. AIMS Environ. Sci. 2018, 5, 372–388. [Google Scholar] [CrossRef]
  25. Voigt, M.; Bartels, I.; Nickisch-Hartfiel, A.; Jaeger, M. Photoinduced degradation of sulfonamides, kinetic, and structural characterization of transformation products and assessment of environmental toxicity. Toxicol. Environ. Chem. 2017, 99, 1304–1327. [Google Scholar] [CrossRef]
  26. Voigt, M.; Jaeger, M. On the photodegradation of azithromycin, erythromycin and tylosin and their transformation products—A kinetic study. Sustain. Chem. Pharm. 2017, 5, 131–140. [Google Scholar] [CrossRef]
  27. Kuhn, H.; Braslavsky, S.E.; Schmidt, R. Chemical Actinometry. IUPAC Tech. Rep. 2004, 76, 2105–2146. [Google Scholar] [CrossRef]
  28. Hatchard, C.G.; Parker, C. A New Sensitive Chemical Actinometer. II. Potassium Ferrioxalate as a Standard Chemical Actinometer. Proc. R. Soc. A Math. Phys. Eng. Sci. 1956, 235, 518–536. [Google Scholar]
  29. Sun, L.; Bolton, J.R. Determination of the Quantum Yield for the Photochemical Generation of Hydroxyl Radicals in TiO2 Suspensions. J. Phys. Chem. 1996, 100, 4127–4134. [Google Scholar] [CrossRef]
  30. Kochany, J.; Bolton, J.R. Mechanism of photodegradation of aqueous organic pollutants. 2. Measurement of the primary rate constants for reaction of hydroxyl radicals with benzene and some halobenzenes using an EPR spin-trapping method following the photolysis of hydrogen peroxide. Environ. Sci. Technol. 1992, 26, 262–265. [Google Scholar] [CrossRef]
  31. Kochany, J.; Bolton, J.R. Of aqueous organic pollutants. 1. EPR spin-trapping technique for the determination of hydroxyl radical rate constants in the photooxidation of chlorophenols following. J. Phys. Chem. 1991, 95, 5116–5120. [Google Scholar] [CrossRef]
  32. Chan, P.Y.; Gamal El-Din, M.; Bolton, J.R. A solar-driven UV/Chlorine advanced oxidation process. Water Res. 2012, 46, 5672–5682. [Google Scholar] [CrossRef]
  33. Li, K.; Zhang, P.; Ge, L.; Ren, H.; Yu, C.; Chen, X.; Zhao, Y. Concentration-dependent photodegradation kinetics and hydroxyl-radical oxidation of phenicol antibiotics. Chemosphere 2014, 111, 278–282. [Google Scholar] [CrossRef] [PubMed]
  34. Fernández, R.L.; McDonald, J.A.; Khan, S.J.; Le-Clech, P. Removal of pharmaceuticals and endocrine disrupting chemicals by a submerged membrane photocatalysis reactor (MPR). Sep. Purif. Technol. 2014, 127, 131–139. [Google Scholar] [CrossRef]
  35. Jung, Y.J.; Kim, W.G.; Yoon, Y.; Kang, J.-W.; Hong, Y.M.; Kim, H.W. Removal of amoxicillin by UV and UV/H2O2 processes. Sci. Total Environ. 2012, 420, 160–167. [Google Scholar] [CrossRef] [PubMed]
  36. Voigt, M.; Savelsberg, C.; Jaeger, M. Photodegradation of the antibiotic spiramycin studied by high-performance liquid chromatography-electrospray ionization-quadrupole time-of-flight mass spectrometry. Toxicol. Environ. Chem. 2017, 99, 624–640. [Google Scholar] [CrossRef]
  37. Mauser, H. Formale Kinetik; Experimentelle Methoden der Physik und der Chemie; Bertelsmann-Universitätsverlag: Düsseldorf, Germany, 1974; ISBN 9783571191889. [Google Scholar]
  38. Mazellier, P.; Méité, L.; De Laat, J. Photodegradation of the steroid hormones 17beta-estradiol (E2) and 17alpha-ethinylestradiol (EE2) in dilute aqueous solution. Chemosphere 2008, 73, 1216–1223. [Google Scholar] [CrossRef] [PubMed]
  39. Wiegand, I.; Hilpert, K.; Hancock, R.E.W. Agar and broth dilution methods to determine the minimal inhibitory concentration (MIC) of antimicrobial substances. Nat. Protoc. 2008, 3, 163–175. [Google Scholar] [CrossRef]
  40. EUCAST. ISO 20776-1:2007; IOS: Geneva, Switzerland, 2007. [Google Scholar]
  41. Martin, T.; Harten, P.; Venkatapathy, R.; Young, D. TEST (Toxicity Estimation Software Tool) Ver 4.1.; U.S. Environmental Protection Agency: Washington, DC, USA, 2016. [Google Scholar]
  42. QSAR Toolbox. Laboratory of Mathematical Chemistry; University Bourgas: Bourgas, Bulgaria, 2012. [Google Scholar]
  43. Gao, L.; Shi, Y.; Li, W.; Niu, H.; Liu, J.; Cai, Y. Occurrence of antibiotics in eight sewage treatment plants in Beijing, China. Chemosphere 2012, 86, 665–671. [Google Scholar] [CrossRef]
  44. Li, W.; Shi, Y.; Gao, L.; Liu, J.; Cai, Y. Occurrence, distribution and potential affecting factors of antibiotics in sewage sludge of wastewater treatment plants in China. Sci. Total Environ. 2013, 445–446, 306–313. [Google Scholar] [CrossRef]
  45. Rosa, J.M.; Tambourgi, E.B.; Vanalle, R.M.; Carbajal Gamarra, F.M.; Curvelo Santana, J.C.; Araújo, M.C. Application of continuous H2O2/UV advanced oxidative process as an option to reduce the consumption of inputs, costs and environmental impacts of textile effluents. J. Clean. Prod. 2019, 246, 119012. [Google Scholar] [CrossRef]
  46. Al-Mamun, M.R.; Kader, S.; Islam, M.S.; Khan, M.Z.H. Photocatalytic activity improvement and application of UV-TiO2 photocatalysis in textile wastewater treatment: A review. J. Environ. Chem. Eng. 2019, 7, 103248. [Google Scholar] [CrossRef]
  47. Oppenländer, T. Photochemical Purification of Water and Air: Advanced Oxidation Processes (AOPs): Principles, Reaction Mechanisms, Reactor Concepts (Chemistry); WILEY-VCH Verlag: Weinheim, Germany, 2003; ISBN 3-527-30463-7. [Google Scholar]
  48. Homem, V.; Santos, L. Degradation and removal methods of antibiotics from aqueous matrices--a review. J. Environ. Manag. 2011, 92, 2304–2347. [Google Scholar] [CrossRef] [PubMed]
  49. Calza, P.; Minella, M.; Demarchis, L.; Sordello, F.; Minero, C. Photocatalytic rate dependence on light absorption properties of different TiO2 specimens. Catal. Today 2020, 340, 12–18. [Google Scholar] [CrossRef] [Green Version]
  50. Fasani, E.; Mella, M.; Caccia, D.; Tassi, S.; Fagnoni, M.; Albini, A. The photochemistry of lomefloxacin. An aromatic carbene as the key intermediate in photodecomposition. Chem. Commun. 1997, 1329–1330. [Google Scholar] [CrossRef]
  51. Budai, M.; Gróf, P.; Zimmer, A.; Pápai, K.; Klebovich, I.; Ludányi, K. UV light induced photodegradation of liposome encapsulated fluoroquinolones: An MS study. J. Photochem. Photobiol. A Chem. 2008, 198, 268–273. [Google Scholar] [CrossRef]
  52. Fasani, E.; Albini, A.; Mella, M.; Rampi, M.; Negra, F.B. Light and drugs: The photochemistry of fluoroquinolone antibiotics. Int. J. Photoenergy 1999, 1, 7–11. [Google Scholar] [CrossRef]
  53. Fasani, E.; Monti, S.; Manet, I.; Tilocca, F.; Pretali, L.; Mella, M.; Albini, A. Inter- and intramolecular photochemical reactions of fleroxacin. Org. Lett. 2009, 11, 1875–1878. [Google Scholar] [CrossRef]
  54. Liu, C.; Nanaboina, V.; Korshin, G.V.; Jiang, W. Spectroscopic study of degradation products of ciprofloxacin, norfloxacin and lomefloxacin formed in ozonated wastewater. Water Res. 2012, 46, 5235–5246. [Google Scholar] [CrossRef]
Figure 1. Sampling of the river Erft (left) and Rhine (right) near a WWTP, (pictures: © 2018 Google, GeoBasis-DE/BKG (© 2009), Google).
Cleantechnol 02 00006 g001
Figure 2. (a) pH dependent protonation and deprotonation of LOM; (b) Absorption spectra of LOM at pH 3 (red), pH 7 (green) and pH 9 (blue) compared to the emission spectra of the UVA (orange) and UVC lamp (purple).
Cleantechnol 02 00006 g002
Figure 3. MS/MS spectra of the quasi molecular ion from LOM dissolved in MilliQ-water (bottom) and from samples of the River Erft (top).
Cleantechnol 02 00006 g003
Figure 4. c-t curves of LOM (♦) and photodegradates with m/z = 308 (▲), 332 (■) and 350 (●) under UVA (left) and UVC irradiation (right) at pH = 4–6.
Cleantechnol 02 00006 g004
Figure 5. Total organic carbon (TOC) of LOM dissolved in MilliQ-water (●) and river Erft water (■) at initial concentration of 20 mg L−1 under UVC irradiation.
Cleantechnol 02 00006 g005
Figure 6. Identified photodegradation products of LOM formed by OH radical addition (green), alteration of the piperazine moiety (orange), the nitrogen substituent (purple), and the quinolone ring (blue).
Cleantechnol 02 00006 g006
Figure 7. Activity-concentration curves of LOM against P. fluorescens for the determination of IC50 values at UVA irradiation times of 0 min (●), 1 min (♦), 2.5 min (■), 3.5 min (▼), 5 min (▲), 7 min (◊), and 30 min (∇).
Cleantechnol 02 00006 g007
Table 1. Properties of Lomefloxacin (LOM).
FluoroquinoloneLomefloxacin
Chemical Structure Cleantechnol 02 00006 i001
Molecular FormulaC17H19F2N3O3
CAS Reg. No.98079-51-7
pKa (1)6.3; 9.0
[M+H]+ (exact)352.147
[M+H]+ (accurate) (2)352.147
MS/MS (3)308
MS/MS/MS (3)265; 288
λ (εmax)/nm at pH 3287
εmax/L·mol1 at pH 337624
λ (εmax)/nm at pH 7282
εmax/L·mol1 at pH 732548
λ (εmax)/nm at pH 9282
εmax/L·mol1 at pH 932181
(1) Babic et al.; (2) Determined using Q-TOF MS; (3) Determined using IT MS.
Table 2. Comparison of the kinetic rate constants, half-lives, and quantum efficiencies at the wavelengths 254 nm, 313 nm and 365 nm obtained for UVA and UVC irradiated solutions of 20 mg L−1 LOM in MilliQ, river Erft water, and effluent.
Radiation SourceWater MatrixpHk1/min−1t1/2/minΦ254 nmΦ313 nmΦ365 nm
UVAMilliQ3–40.960.72-0.630.29
MilliQ4–60.820.85-0.520.32
MilliQ6–71.220.57-0.730.45
MilliQ8–91.990.35-1.300.79
UVCMilliQ3–40.571.210.020.130.39
MilliQ4–60.800.870.020.150.62
MilliQ6–72.830.240.090.572.40
MilliQ8–92.040.340.060.451.90
River Erft6–71.490.47
Effluent WWTP81.470.47
Table 3. Determined rate constants and the resulting half-lives with UVA and UVC irradiation and H2O2 or TiO2 addition.
pHH2O2TiO2UVAUVC
/mg·L−1P25/mg·L−1k/min1t1/2/mink/min1t1/2/min
3–4000.960.720.571.21
0501.710.41
01000.790.88
100 0.930.75
300 1.030.68
6–7001.220.572.830.24
0501.070.65
01001.420.49
100 2.100.33
300 1.840.38
8–9001.990.352.040.34
0500.800.87
01001.050.66
100 1.300.53
300 2.340.30
Table 4. Photoinduced transformation products and their purposed structure. Identification using MS and MS/MS experiments.
[M + H]+ (Theoretical)[M + H]+ (Observed)MS2 MS3Proposed StructureReference
352.147
Lomefloxacin
352.147308265 Cleantechnol 02 00006 i002
294.125 294.123276 Cleantechnol 02 00006 i003this study
300.134 300.148 Cleantechnol 02 00006 i004this study
304.129 Cleantechnol 02 00006 i005this study
308.140 308.140290270 Cleantechnol 02 00006 i006[50,51]
322.120 Cleantechnol 02 00006 i007this study
324.115 324.1468281253 Cleantechnol 02 00006 i008this study
332.140 332.136288245 Cleantechnol 02 00006 i009[50,51,52,53]
346.140 Cleantechnol 02 00006 i010this study
Cleantechnol 02 00006 i011
348.135 348.135330304 Cleantechnol 02 00006 i012[51]
348.135 Cleantechnol 02 00006 i013
350.151 350.144 Cleantechnol 02 00006 i014[51]
350.151 306263 Cleantechnol 02 00006 i015
350.151 332267 Cleantechnol 02 00006 i016
364.150 346195 Cleantechnol 02 00006 i017this study
364.150 Cleantechnol 02 00006 i018
368.142 368.111 Cleantechnol 02 00006 i019[54]
Table 5. MIC values of LOM against P. fluorescens and B. subtilis depending on UVA and UVC irradiation times.
Irradiation Time/minP. fluorescens/µg·mL−1B. subtilis/µg·mL−1
Irradiation SourceUVAUVCUVAUVC
MICIC50 (a)MICIC50 (a)MICIC50 (a)MICIC50 (a)
0<0.550.41<0.550.560.280.140.280.14
1<0.550.421.110.800.280.170.550.22
2.51.100.534.442.340.550.132.220.51
3.52.211.008.880.951.100.26>2.220.21
54.422.31>8.882.592.210.44>2.220.60
78.833.68>8.881.76>2.210.18>2.220.45
30>8.834.41>8.881.27>2.210.65>2.220.22
(a) IC50 values were erranous as insufficient data points were obtained due to too low activity of irradiated solutions.
Table 6. QSAR analysis of the phototransformation products of LOM with less (green) and more hazardous (red) photoproducts as compared to the parent compound. The photoproducts are indicated by their m/z values. The activities against the organisms are given as concentration.
SubstanceDaphnia magna LC50 (48 h) mg/L aFathead Minnow LC50 (96 h) mg/L aFathead Minnow LC50 (96 h) mg/L b,cActinopterygii LC50 (96 h) mg/L b,dBranchiopoda LC50 (48 h) mg/L b,d
Lomefloxacin7.870.423.15 × 1022.51 × 1068.52 × 102
2949.621.952.77 × 1033.69 × 1089.94 × 103
30063.582.101.76 × 1031.12 × 1083.37 × 103
30424.823.167.80 × 1033.83 × 1091.88 × 104
3089.801.501.54 × 1031.15 × 1083.46 × 103
32215.041.392.97 × 1037.20 × 1088.61 × 103
3244.280.401.09 × 1031.02 × 1083.35 × 103
33216.380.705.00 × 1021.07 × 1071.14 × 103
346a17.200.634.73 × 1031.03 × 1091.06 × 104
346b13.670.229.50 × 1023.44 × 1072.05 × 103
348a12.180.441.44 × 1031.46 × 1084.14 × 103
348b17.070.902.62 × 1032.76 × 1085.63 × 103
350a13.050.708.78 × 1023.91 × 1072.19 × 103
350b15.620.369.06 × 1023.91 × 1072.19 × 103
350c15.950.695.21 × 1021.13 × 1071.20 × 103
350d9.220.091.99 × 1017.95 × 1021.36 × 102
364a9.460.671.51 × 1031.22 × 1083.87 × 103
364b15.670.788.52 × 1033.64 × 1092.01 × 104
36810.750.423.73 × 1026.69 × 1069.55 × 102
a T.E.S.T; b QSAR Toolbox; c Pimephales promelas; d unknown testorganisms.
Table 7. Times takt after which the effectiveness of LOM against P. fluorescens and B. subtilis subsides on UVC irradiation, depending on pH and matrix.
pHwatertakt (P. fluorescens)/mintakt (B. subtilis)/min
3–4MilliQ5.408.36
6–7MilliQ1.091.68
8–9MilliQ1.221.89
8Effluent2.093.24

