Article

Selenium and Heavy Metals in Soil–Plant System in a Hydrogeochemical Province with High Selenium Content in Groundwater: A Case Study of the Lower Dniester Valley

by
Sergey Sheshnitsan
1,*,
Nadezhda Golubkina
2,
Tatiana Sheshnitsan
1,
Otilia Cristina Murariu
3,
Alessio Vincenzo Tallarita
4 and
Gianluca Caruso
4
1
Faculty of Forestry, Voronezh State University of Forestry and Technologies, Timiryazeva Str. 8, Voronezh 394087, Russia
2
Analytical Laboratory Department, Federal Scientific Vegetable Centre, Selektsionnaya Str. 14, Vnissok, Moscow 143072, Russia
3
Department of Food Technology, “Ion Ionescu de la Brad” Iasi University of Life Sciences, M. Sadoveanu Alley, 700440 Iasi, Romania
4
Department of Agricultural Sciences, University of Naples Federico II, 80055 Naples, Italy
*
Author to whom correspondence should be addressed.
Soil Syst. 2024, 8(1), 7; https://doi.org/10.3390/soilsystems8010007
Submission received: 28 October 2023 / Revised: 3 January 2024 / Accepted: 4 January 2024 / Published: 5 January 2024

Abstract

:
The bioaccumulation of selenium (Se) and heavy metals (HMs) in plants is important because it can affect plant health and human nutrition. Recognizing the factors affecting Se accumulation in plants may have important implications for agricultural practices and human health in selenium-rich regions. The study primarily focused on the interactions between Se and HMs in the soil–plant system of the Lower Dniester Valley. Total concentrations of HMs (Cu, Mn, Zn) were determined by atomic absorption spectrometry, while Se concentrations were determined by a sensitive single-test-tube fluorometric method in solutions and extracts. Water-soluble Se (0.09 ± 0.03 mg·kg−1) in soils was 32.1% of the total Se (0.33 ± 0.13 mg·kg−1) and increased with the total rising Se content (r = 0.845). The results indicated that plants had a greater Zn accumulation capacity than that of the other HMs, suggesting its importance as a trace element for plant requirements. Se also had a high bioaccumulation rate. Se and Zn accumulation varied in different soil types, reflecting differences in bioavailability. In contrast, Mn and Cu showed low bioaccumulation, which varied with soil conditions and anthropogenic Cu pollution. Despite the Cu contamination of the soils in the investigated region, it can be inferred that the hydrogeochemical province with high Se content in groundwater has favorable conditions for Se mobilization in soils. The absence of antagonistic interactions with HMs in the soil–plant system contributes to the enhanced Se accumulation in plants in the Lower Dniester Valley. These results emphasize the complexity of the interactions between Se and HMs in the soil–plant system and their potential impact on agricultural practices.

Graphical Abstract

1. Introduction

Bioaccumulation is the gradual accumulation of certain substances, such as heavy metals and selenium, in plant tissues. These elements are derived from a variety of sources, including natural deposits, industrial activities, and agricultural practices [1,2,3,4,5]. The accumulation of selenium (Se) and heavy metals (HMs) in plants is of great importance due to the potential threat posed to plant health and human consumption. However, Se and HMs such as copper (Cu), manganese (Mn), and zinc (Zn) are also known as essential micronutrients that can be beneficial or detrimental to plants and animals, with a narrow range between beneficial and toxic depending on their concentration and species [6,7,8]. Although the essentiality of Se has not yet been established for higher plants, it is responsible for a number of beneficial effects in several plant species [9,10] and actively contributes to plant antioxidant defense against all forms of biotic and abiotic stresses [11]. However, it is indispensable for animals and humans [12]. The essentiality of Se for humans provides important protection against viral and cardiovascular diseases and several forms of cancer, and improves immunity, fertility, and mental health among other benefits [13].
The bioaccumulation of HMs and Se in plants and their ecological effects is increasingly being investigated. It was shown that these compounds can either affect plant growth and development or also disrupt the ecological balance of ecosystems [7,8,14,15,16]. The study of bioaccumulation in hydrogeochemical provinces with high concentrations of Se is of great importance for several reasons. Firstly, such areas are generally at higher risk of Se contamination in both soils and water sources, with direct implications for plant uptake. Understanding the mechanisms and patterns of bioaccumulation in these regions may help to develop effective strategies to manage and mitigate the risks associated with Se accumulation in plants. Secondly, as these territories are usually located in agricultural areas, Se accumulation in crops may have important consequences for food safety and health.
The Moldavian hydrogeochemical province with increased Se content in groundwater and shallow waters was identified in the 1980s due to the presence of a significant source of this trace element in rocks and its high concentration in groundwater (0.n–n·10 µg·L−1). Sedimentary formations of the Middle Sarmatian are rich in disseminated selenium-containing sulfides, which are the main source of Se in groundwater [17]. According to Hannigan et al. [18], Neogene (Middle Sarmatian) clays contained abundant Se and they were the source of Se in groundwater, the concentrations of which were shown to locally exceed the maximal permitted value [19] by 1.5–24.0 times and varied from 15.0 to 240.0 µg·L−1. Therefore, a comprehensive investigation is particularly needed to estimate the regional Se distribution because of the possible ecological problems for agricultural practices and the water supply [17]. A more extensive study, which included the Dniester Valley, revealed Se concentrations in the soils ranging from 0.10 to 0.67 g·kg−1. The majority of soils analyzed had an optimal Se content. The highest Se content was observed at a depth of 0.4–0.7 m and decreased nearer to the parent rock. High Se concentrations were also found in the local surface waters with values ranging from 0.2 to 6.1 µg·L−1, indicating the abundant presence of soluble Se that was available to plants [20]. Se accumulation in some components of the regional food chains, including insects [21], bee products [22], and mushrooms [23], was found to be relatively high in the Dniester Valley. Recent studies of Se content in human hair reported a high supply of the trace element in the environment of Moldova [24].
Heavy metal pollution in soils in Moldova was found to have significant impacts on the soil and water environment [25,26]. Moss biomonitoring was used to assess air pollution levels and sources in the Republic of Moldova. The results indicated consistent pollution levels for a wide range of HMs [27]. According to some comprehensive studies [27,28,29], the main sources of anthropogenic HM pollution in the region are industrial emissions, transport, and agricultural practices.
The aim of this study was to determine the level of Se in soils and its accumulation in plants as well as to identify the factors associated with Se bioaccumulation in the hydrogeochemical province with high Se in groundwater. At the same time, it is expected that HMs (Cu, Mn, and Zn) in the soil–plant system can act antagonistically [30] and may reduce the Se bioaccumulation rate in plants.
The choice of these HMs from a wide range of elements was due to the following reasons. Firstly, Cu, Mn, and Zn are essential for plant, animal, and human nutrition in certain concentrations [30]. Secondly, these elements have a higher affinity to accumulate in living organisms in the geochemical landscapes of the Lower Dniester Valley than their water migration ability. This implies that HMs are more actively involved in biological cycling and consequently highlights the distribution of matter within ecosystems [31].

2. Materials and Methods

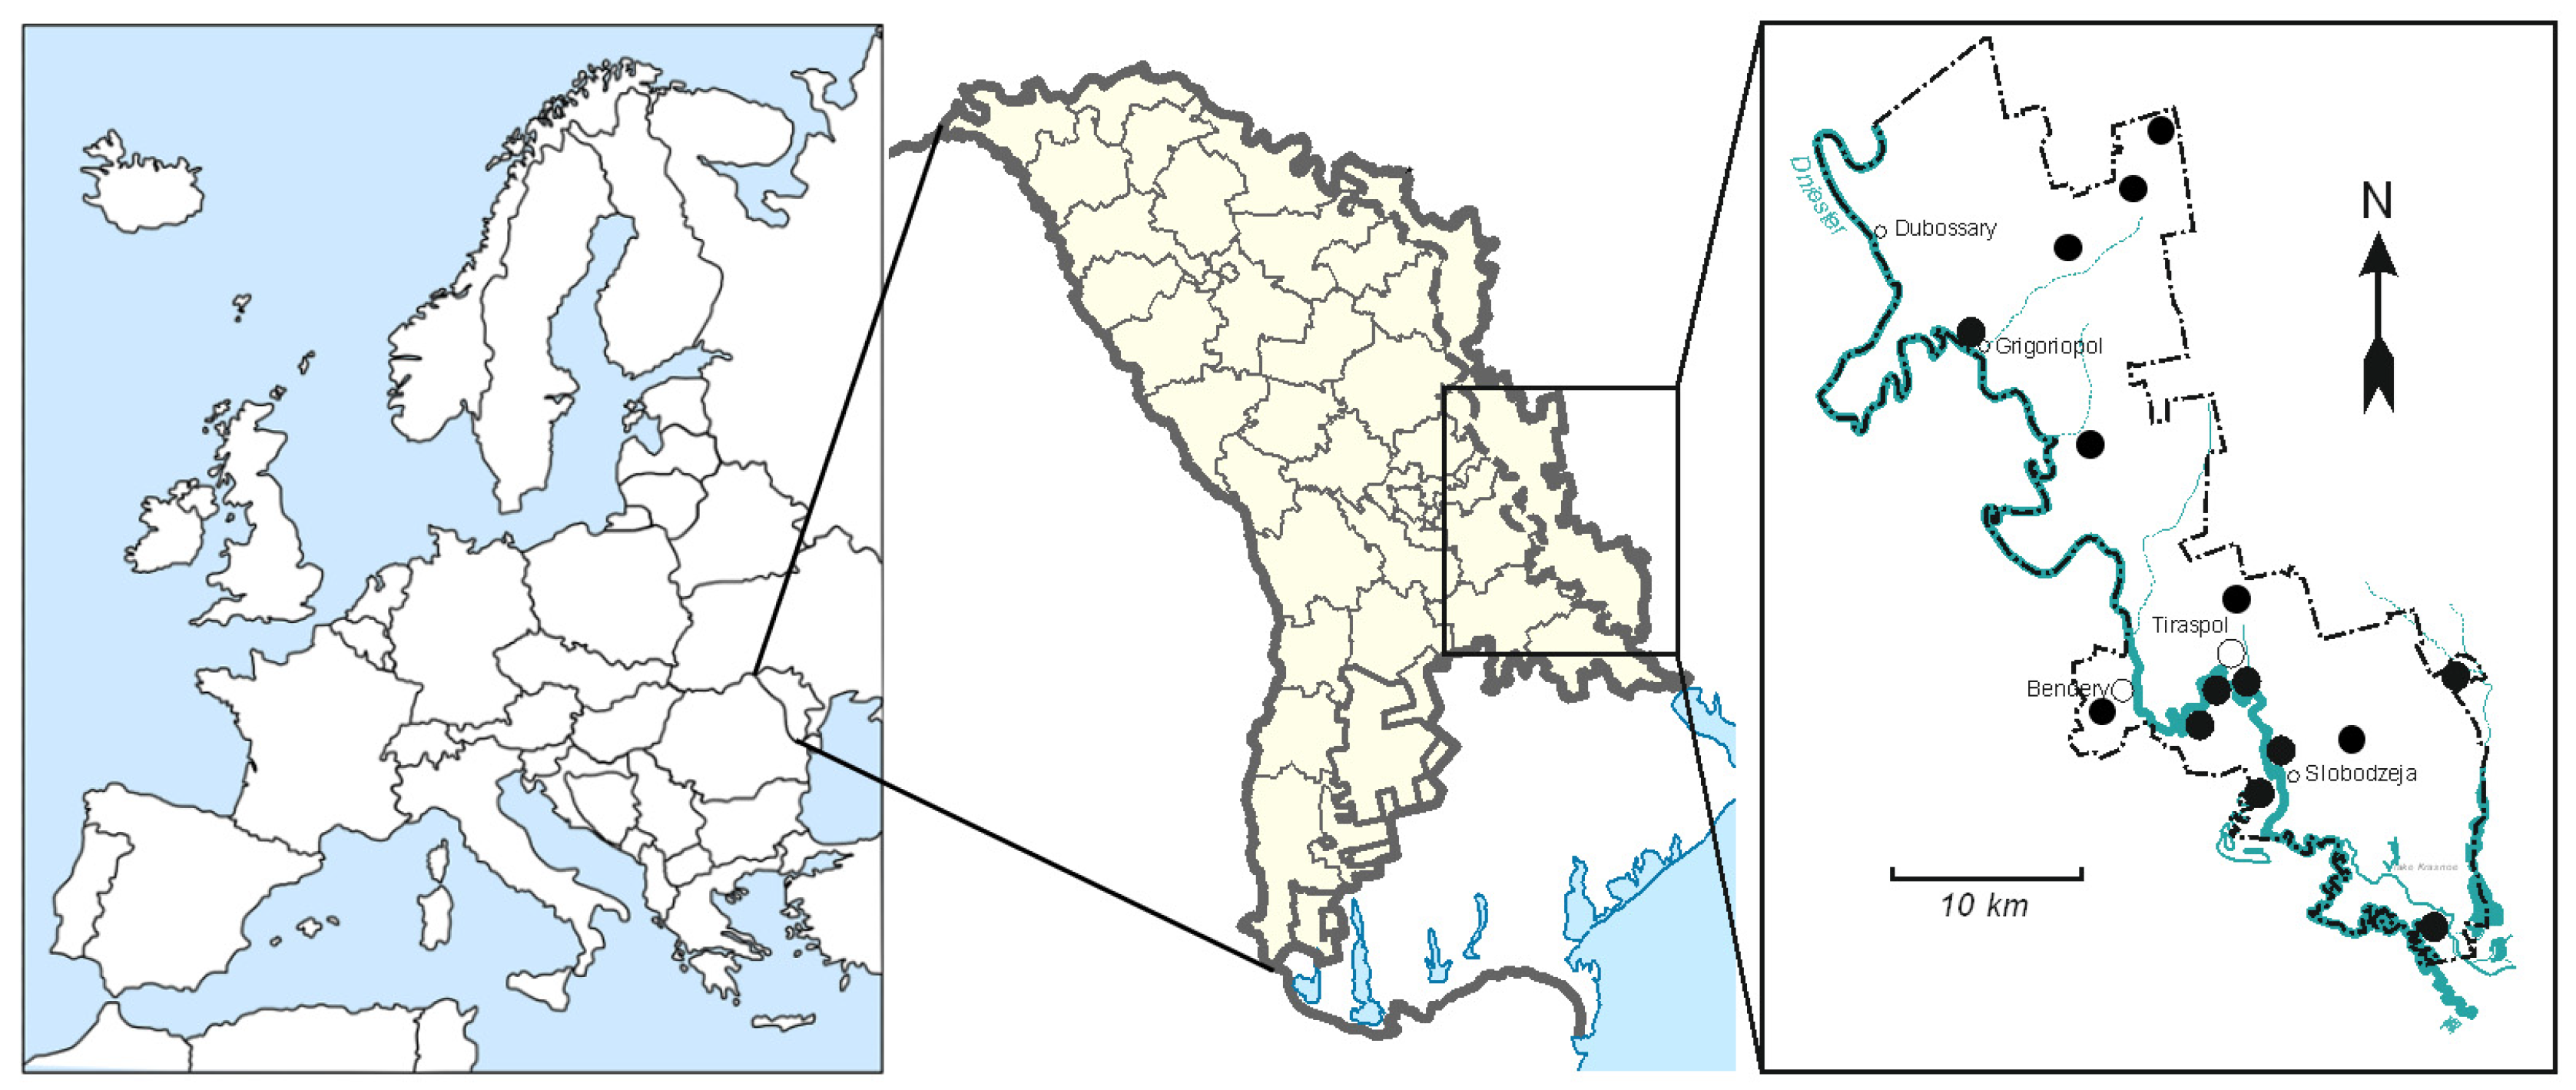
2.1. Study Area and Geochemical Characteristics of the Lower Dniester Valley (LDV)

The study area of about 1848 km2 represents a terraced plain in the south-eastern part of Moldova (46°48′ N 29°38′ E) and occupies mainly the left bank part of the Lower Dniester Valley as well as the small right bank part of the area adjacent to the Bendery (Figure 1).
Most of the region consists of Quaternary terraces. The terraces are covered by a thick layer of loess. Towards the north-east, the terraces merge into the root slope of the Dniester Valley, which is covered by a lower layer of deluvial sediments and is formed by sands and clays of the Upper Sarmatian. Floodplains cover over 20% of the region, with predominantly loamy and sandy soils in central and riverine floodplains, accompanied by shallow groundwater. All floodplain areas in the LDV were artificially isolated from flood waters by dyke systems constructed to prevent river flooding of the agricultural lands. In the northeastern part, absolute heights reach 150–200 m, while in the southeastern part they rarely exceed 80 m. The surface of the terrain is somewhat dissected by small dry gullies with flat, uneroded slopes.
The depth of the groundwater table in the Pleistocene terraces of the Dniester River varies significantly, usually ranging from 10 to 15 m. In the Dniester floodplains, the groundwater level is typically set between 0.5 and 8 m, depending on the fluctuations of the Dniester River, and is susceptible to flooding [32].
The climate of the area is temperate continental, i.e., warm and arid. The region has an average annual air temperature of 9.6 °C with a cumulative temperature (above 10 °C) of 3270°, and active vegetation for approximately 200 days. The yearly average precipitation is 420–430 mm, with a corresponding moisture coefficient of 0.50. The study area is dominated by Chernozem soils which cover almost 77% of the territory. The most important types are Luvy-Calcic Chernozems (43.8%), Vorony-Calcic Chernozems (24.5%), and Voronic Chernozems (4.5%). They are followed by Fluvisols which comprise up to 8% of the whole soil cover.

2.2. Field Studies and Sample Preparation

The study was conducted in the second half of the vegetation season during July and August. Soils were collected from the topsoil at a depth of 0 to 30 cm using a 1 m stainless steel auger, taking into account the mesorelief characteristics (watersheds and terraces, slopes, hollows, floodplains). The combined soil sample was the mixture of 7 to 10 samples taken randomly in a given area. Samples of aboveground parts grown in the current year (shoots and leaves) of cultivated (wheat Triticum aestivum L., sunflower Helianthus annuus L.) and wild (couch grass Elytrigia repens (L.) Nevski) mature plants most common for the study area were collected at soil sampling sites. Dead plant parts from previous years were not included in the sample.
The obtained soil and plant samples were dried at room temperature and then thoroughly powdered (soil samples were powdered with an agate mortar and after that sieved with a 1.0 mm sieve, plant samples were powdered in an electric mill with steel blades) and homogenized. The larger mass of the average sample was reduced by quartering and then packed in polyethylene bags for subsequent analysis.
Samples were dried in a heating oven at 103 ± 2 °C to a constant weight for conversion to dry weight.

2.3. Chemical Analysis and Extraction

Soil organic carbon content (SOC) was obtained from the dichromate redox titration method using N-phenanthranilic acid as an indicator [33]. The soil pH in water extract was measured using a portable pH-meter WTW pH 3110 SET 2 with a SenTix 41 pH electrode in suspension obtained from stirring of the soil sample with deionized water with the ratio 1:5.
The procedure of alkalimetric determination of carbonates (as CaCO3) was the following. A soil sample (0.5–2 g) was put to a dry 250 mL Erlenmeyer flask, placing the sample near the wall of the flask. An empty porcelain crucible was placed in the flask. Five mL of 2 N HCl was poured into the crucible, using a pipette. Then, a tube without welt (25 × 90 mm) with 5 mL of 0.4 N NaOH was placed in the flask. This tube was leaned against the wall of the flask, and it was immediately closed with a rubber stopper moistened with distilled water. Then, the flask was tilted, overturning the crucible with acid allowed to distribute along the bottom of the flask. After 4–5 h, the flask was opened, the test tube was removed, rinsed with distilled water from the outside, and dried with filter paper. Two drops of a solution of phenolphthalein and about 1 mL of a saturated solution of BaCl2 were added to the test tube. Then, the excess NaOH was titrated with 0.2 N HCl until the disappearing of the pink color.
The carbonate content (CaCO3, g·kg−1) was calculated as follows:
CaCO 3 = V   V 1 · C · 0.022 · 2.273 · 1000 m · K ,
where V is the acid volume used for titration of the NaOH solution in the control experiment, mL; V1 is the acid volume used for titration of the excess NaOH in the soil analysis, mL; C is the concentration of HCl, mmol (eq)·mL−1; m is the mass of the air-dry sample, g; 0.022 is the molar mass of the carbon dioxide equivalent (1/2 CO2), g·mol−1 (eq); 2.273 is the coefficient for conversion from CO2 to CaCO3 concentration; 1000 is the coefficient for conversion to g·kg−1; K is the coefficient for conversion of the analysis result to dry soil.
The sum of exchangeable cations Ca2+ + Mg2+ was determined in a 1 N KCl extract according to Shaimukhametov [34].
The determination of total HMs (Cu, Mn, Zn) was performed by atomic absorption spectrometry with an Aanalyst800 (Perkin Elmer, Shelton, CT, USA) using a flow-injection system FLAS-400 in aqua regia extracts of soil according to ISO 11047 [35]. Exchangeable forms (EXC) of trace metals were extracted by the acetate-ammonium buffer solution with pH = 4.8 with a soil:solution ratio of 1:10. The Cu acid-soluble forms in an analytical soil sample were determined through soil extraction. This was achieved by suspending the sample in a 1 N nitric acid solution for 24 h. The determination of exchangeable forms of metals and acid-soluble Cu in soil extracts was carried out using atomic absorption spectrophotometry with the use of a SHIMADZU AA-7000 (Shimadzu, Kyoto, Japan).
Total soil Se was determined in solutions obtained from the acid digestion of perchloric and nitric acids at 120 °C for 1 h, 150 °C for 1 h, and 180 °C for 1 h. Water-soluble (WS) Se, a form of exchangeable Se in soil, was extracted using deionized water with a soil to water ratio of 1:5 in a hot-water bath for 1 h [36]. Se was determined in solutions and extracts by a sensitive single-test-tube procedure for the fluorometric determination [37].

2.4. Bioccumulation Assessment and Statistical Analysis

The bioaccumulation factor (BAF) was used to calculate the Se and HMs transfer from soil to the aboveground part of various plants according to the following equation [38]:
BAF   = C c C s ,
where Cc represents the element contents (in dry matter) in the aboveground part of the plant and Cs shows the element concentration in the corresponding soils.
Descriptive statistics and a correlation analysis among various sample groups were carried out using STATISTICA 10.0 software (StatSoft Inc., Tulsa, OK, USA, 2011). Each variable was checked for outliers, which were excluded from further statistical calculations based on the rejection criterion at p < 0.05. The statistical significance of the differences between the two variables was assessed according to the distribution patterns of the sample data, using non-parametric methods (Mann–Whitney U-test, Kruskal–Wallis ANOVA). Pearson or Spearman correlation coefficients were calculated, and a regression analysis was performed to examine the tightness and type of relationship between the two variables. All statistical calculations were performed at a significance level of p < 0.05.

3. Results

3.1. Total Se and Heavy Metals Content in Soils

3.1.1. Soil Physicochemical Characteristics

The main physicochemical characteristics of soils in the LDV, relevant for assessing Se and HM content and mobility, are shown in Table 1.
Soil pH varied from 7.88 in Vorony-Calcic Chernozems to 8.17 in Luvy-Calcic Chernozems, corresponding to a slightly alkaline soil environment. The ranges of SOC and carbonate content were very wide, from 8.4 to 27.1 g·kg−1 and from 12.6 to 67.2 g·kg−1, respectively. The highest content of exchangeable cations was observed in Voronic Chernozems with a silt loam texture (46.4 mg (eq)·100 g−1), but the lowest content of 18.2 mg (eq)·100 g−1 was found in Vorony-Calcic Chernozems with a loam texture.

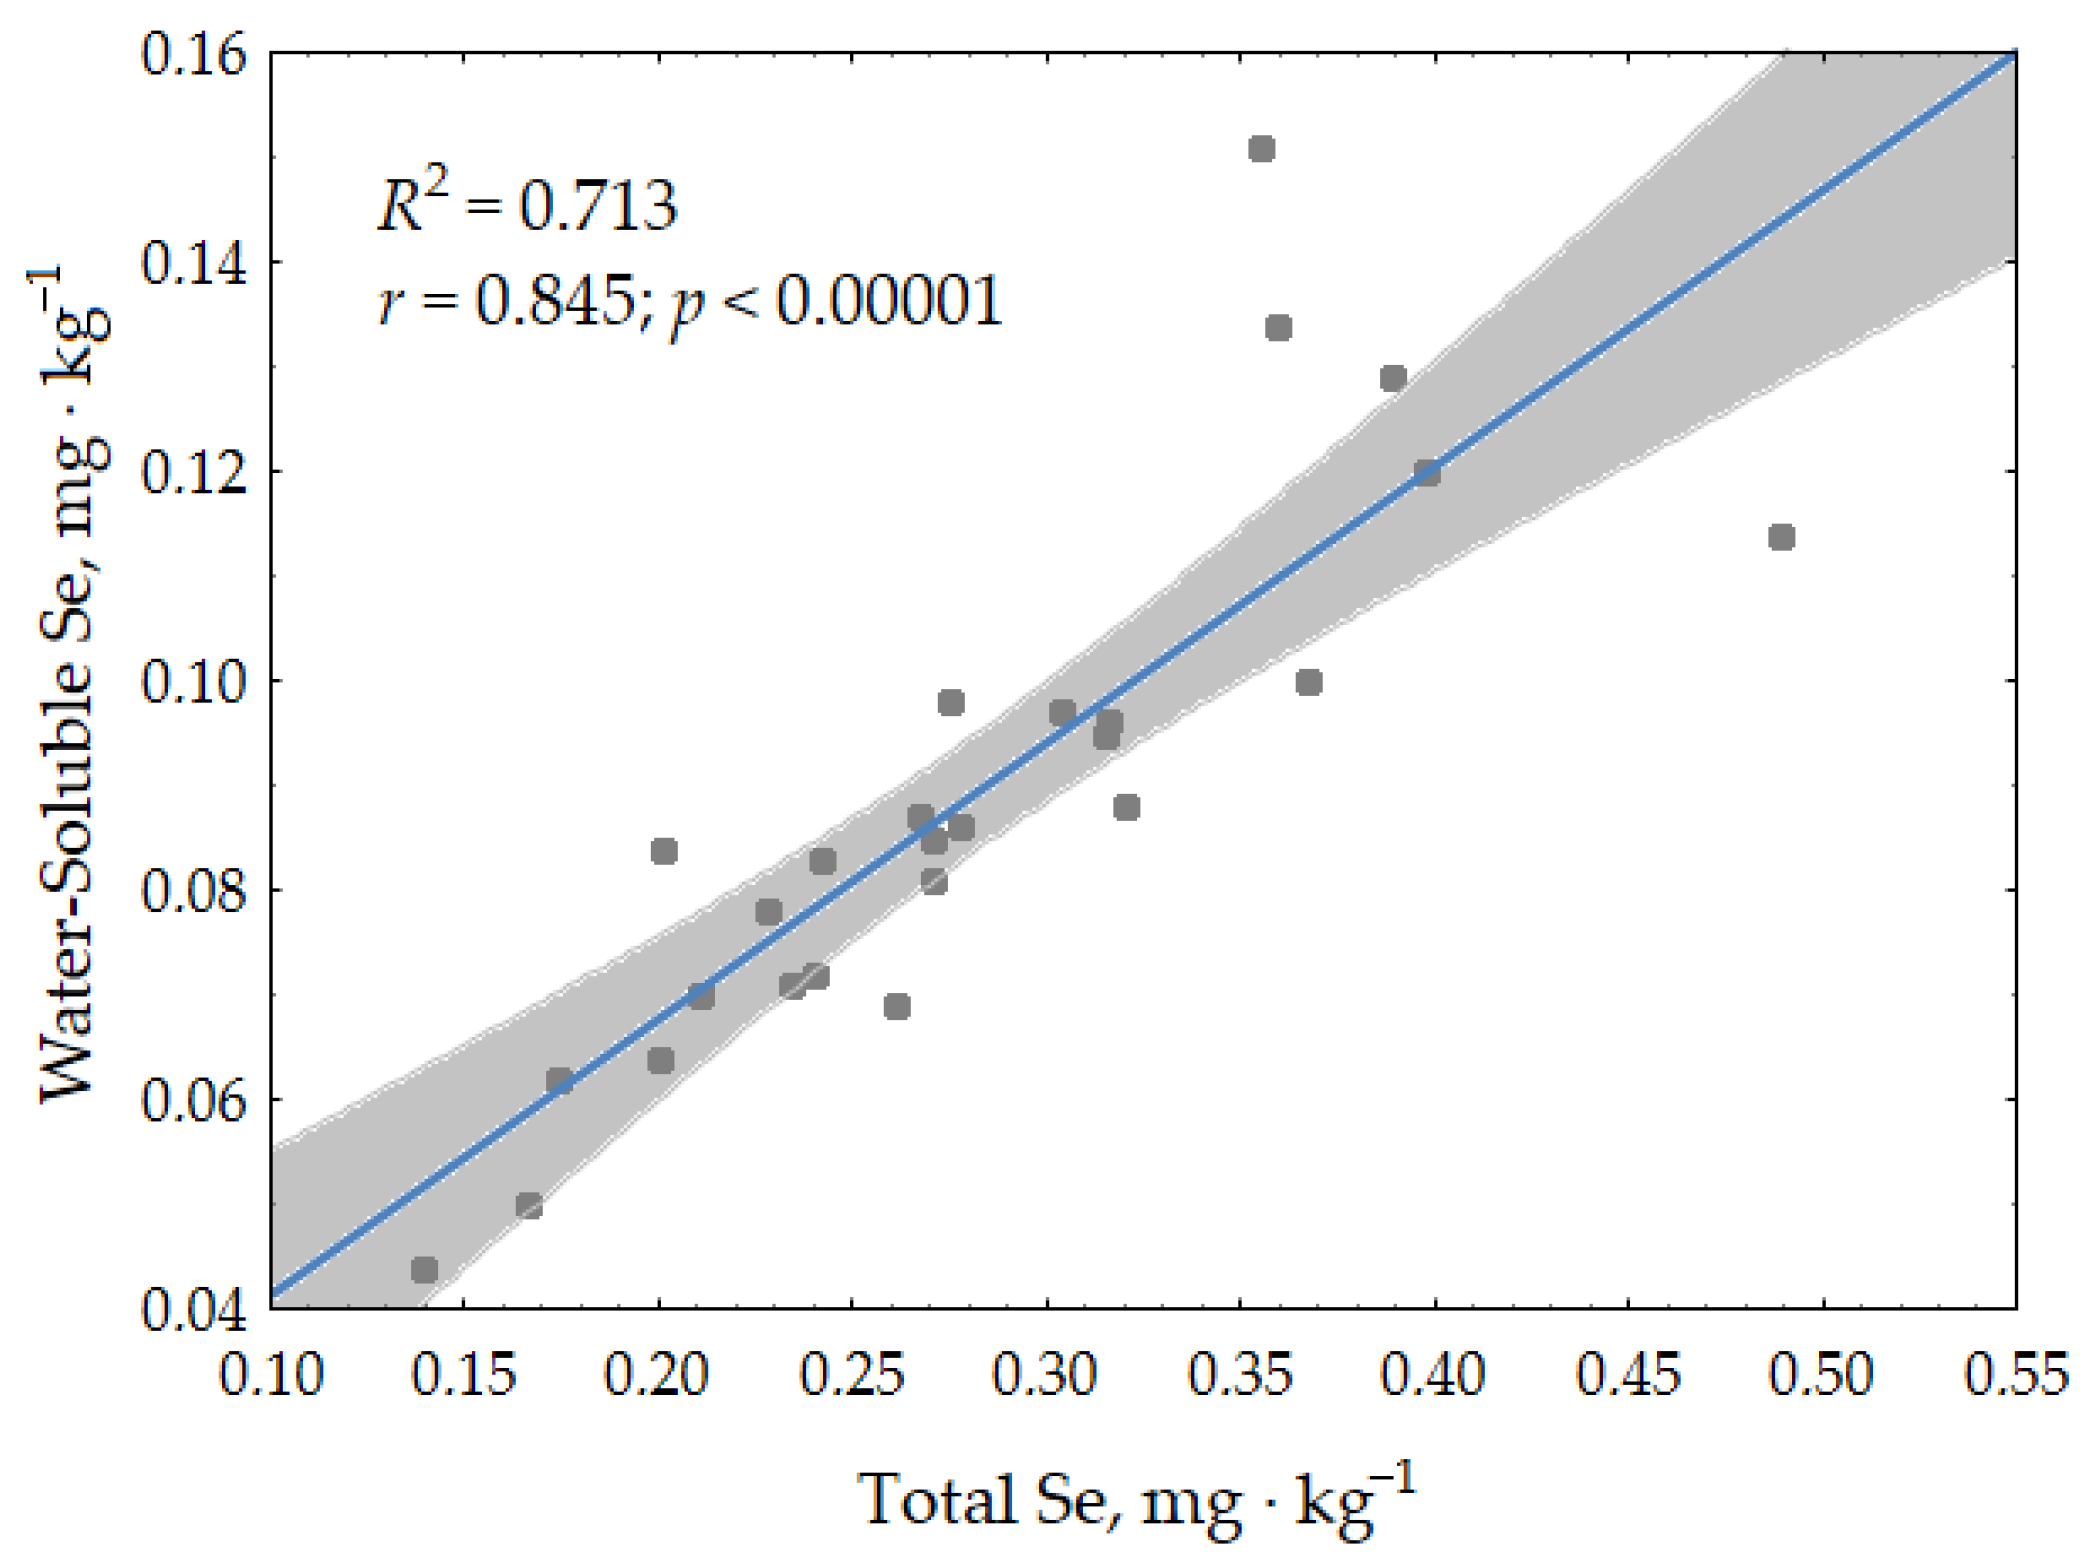
3.1.2. Selenium in Soils

Statistical data for the estimation of the content of total and mobile Se and HMs content in the soils of the Lower Dniester Valley are presented in Table 2.
The topsoil layer had an average content of total Se of 0.33 ± 0.13 mg·kg−1. Total Se was the highest in alluvial soils, which were mainly found in floodplain ecosystems, with an average value of 0.36 ± 0.09 mg·kg−1. The mean Se concentration decreased to 0.32 ± 0.16 mg·kg−1 and 0.33 ± 0.12 mg·kg−1 in Luvy-Calcic Chernozems and Vorony-Calcic Chernozems, respectively, with a rather large variation. Finally, the topsoil of Voronic Chernozems, which are evolutionarily more mature steppe soils, contained the least total Se of 0.23 ± 0.07 mg·kg−1. It should be noted that the maximum concentrations of this element were found in various locations including the Dniester-Turunchuk interfluve soils (0.40 mg·kg−1), the right bank floodplain near Kitskani village (0.44 mg·kg−1), and Copanca village (0.47 mg·kg−1). The highest Se levels were discovered in the soils of the left bank, where concentrations reached up to 0.65 mg·kg−1. However, based on the average concentration of this element, the considered soil types can be ranked in the following order: Fluvisols > Luvy-Calcic Chernozems ≈ Vorony-Calcic Chernozems > Voronic Chernozems.
The average water-soluble Se decreased in a similar sequence as the soil types. Generally, soils have 0.09 ± 0.03 mg·kg−1 of water-extractable Se forms, which is 32.1% of their total content. Nonetheless, even though total Se was noticeably higher in alluvial soils, an analysis of statistics revealed no significant differences for mobile Se concentrations in various soil types (Table 2). A regression analysis was conducted to examine the correlation between the total Se content and its water-soluble forms in soil. The results are shown in Figure 2, indicating a high positive linear correlation (r = 0.845, p < 0.00001). It is evident that water-soluble Se in the topsoil layer of the Dniester Valley increased with the rising total Se content.

3.1.3. Heavy Metals in Soils

Manganese

The soils of the LDV had different levels of Mn, ranging from 196 to 676 mg·kg−1, with an average of 464 mg·kg−1. Mobile Mn in the upper soil horizons, which is available for plant uptake, averaged 75.7 mg·kg−1 or 17.9% of the total Mn (Table 2). Table 2 also displays the significant difference in total Mn content between Voronic Chernozems and Luvy-Calcic Chernozems. This discrepancy can be attributed to two interrelated factors, i.e., the higher content of SOC and exchangeable cations found in Voronic Chernozems, since SOC (r = 0.715, p < 0.05) and exchangeable cations Ca2+ + Mg2+ (r = 0.698, p < 0.05) strongly correlated with the total Mn content (Figure 3). This led to statistically significant differences for exchangeable Mn in Fluvisols and Voronic Chernozems. No significant influence of the investigated physico-chemical properties on the concentration of mobile Mn was observed in the soils. The correlation between the total Mn content and its mobile forms was found to be weak and statistically insignificant.

Zinc

The soils of the LDV had relatively low total Zn concentrations ranging from 13.2 to 63.0 mg·kg−1, with an average of 33.8 mg·kg−1. Table 2 shows a decrease in total Zn content in the soil subtypes with no significant differences between them: Voronic Chernozems > Fluvisols > Vorony-Calcic Chernozems > Luvy-Calcic Chernozems. Similar to Mn, analyses of total Zn concentration dependance from soil properties suggested that SOC (r = 0.558, p < 0.05) and exchangeable cations Ca2+ + Mg2+ (r = 0.598, p < 0.05) played a crucial role in the accumulation of Zn in the upper soil horizons (Figure 3). This explains the higher metal content in Voronic Chernozems, which have a silt clay texture and higher organic matter content. The proportion of mobile Zn forms extracted by an ammonium acetate buffer with pH = 4.8 ranged from 0.3 to 15.6% of the total content, with an average of 4.2%. Statistical significance was found only for Vorony-Calcic Chernozems and Fluvisols.

Copper

The analysis of the homogeneity of the samples for both total and mobile Cu revealed anomalous maximum values. These soil concentrations were found locally. For example, floodplain soils near the village of Kitskani, Slobodzeja district, contained 158.3 mg·kg−1 of total Cu, 115.8 mg·kg−1 of acid-soluble Cu, and 23.7 mg·kg−1 of exchangeable Cu. High Cu concentrations were also found in the vicinity of Slobodzeja town, with exchangeable Cu of 5.98 and 3.88 mg·kg−1. These values were excluded from the calculations for Table 2 since they are outliers and do not belong to the general population.
Data were categorized based on the percentage of acid-soluble Cu compared to total content (Table 3). On the basis of this criterion, two categories of soils were defined according to the level of Cu loading: unpolluted and low-polluted soils with an acid soluble Cu content of up to 35%, and highly polluted soils with an acid-soluble Cu content higher than 50% of the total Cu.
The significant variation in soil Cu concentrations is evident in Table 3. For instance, the total Cu showed a range of two magnitudes, from 12.1 to 158.3 mg·kg−1, while acid-soluble Cu varied within three orders of magnitude, from 2.0 to 115.8 mg·kg−1, whereas the concentrations of mobile Cu varied within four orders of magnitude, from 0.03 to 23.70 mg·kg−1. Hence, the discrepancies in the mean metal content amongst soils with different levels of pollution are dramatically different and statistically significant, both for the total metal content and for the concentrations of acid-soluble and mobile forms. Notably, the values of the acid extraction criterion reached 71–93% for the group of highly polluted soils.
The mean total Cu content in Luvy-Calcic Chernozems was the highest compared to other subtypes of Chernozems and to Fluvisols (Table 2), although statistical calculations allowed us to prove the significance of the differences between Vorony-Calcic Chernozems and Vorony Chernozems. Therefore, the sequence of soil types, according to the average total Cu content in the upper soil horizons, was as follows: Luvy-Calcic Chernozems > Fluvisols > Vorony Chernozems > Vorony-Calcic Chernozems. The content of exchangeable Cu was strongly dependent on the total Cu (r = 0.700, p < 0.01) (Figure 3), and the percentage of mobile Cu in the total content was 1.41% (excluding outliers). The differences in mobile Cu content between Vorony Chernozems and Luvy-Calcic Chernozems were significant according to the Mann–Whitney U-test at p < 0.05.

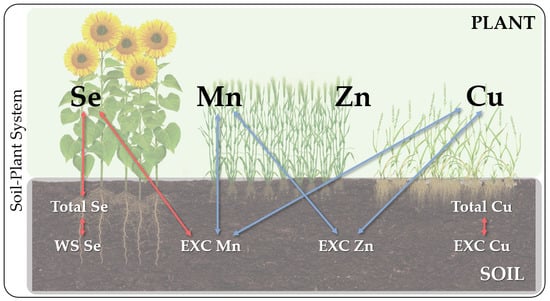
3.2. Se, Mn, Zn, and Cu Concentrations in Plants and Their Bioaccumulation

The Se content in plants of the Dniester Valley varied from 0.06 to 0.58 mg·kg−1. The differences in Se concentrations in aboveground plant tissues and their bioaccumulation among crops (sunflower, wheat) and wild plant species (couch grass) are shown in Table 4.
Sunflowers had the highest Se accumulation capacity among the studied plants. Their tissues contained from 0.08 to 0.58 mg·kg−1 of this element with a mean value of 0.23 mg·kg−1, while wheat and couch grass contained 0.15 and 0.12 mg·kg−1, respectively. A slight positive correlation (r = 0.494, p < 0.001) was observed between the Se content in plants and the total Se in soils (Figure 4). Conversely, no relationship was found between the water-soluble Se and its concentration in plants (Figure 3).
The bioaccumulation factors (BAF) showed that Se concentrations decreased in the order sunflower > wheat > couch grass. This proves that sunflower had a higher ability to accumulate Se. Generally, plants accumulated the highest Se concentrations in Fluvisols (0.30 mg·kg−1) compared to Luvy-Calcic, Vorony-Calcic, and Vorony Chernozems. Moreover, a statistical analysis using Kruskal–Wallis ANOVA proved that BAFs were significantly higher for plants growing on Fluvisols (p < 0.05) compared to those on Chernozem soils (Figure 5). Generally, among plants growing on different Chernozems, only plants growing in Luvy-Calcic and Vorony-Calcic Chernozems showed statistically significant differences.
Similar to Se, higher concentrations of HMs, such as Mn and Cu, were found in the aboveground part of the sunflower but the differences were not statistically significant for the different plant species. Most of the BAFs for these metals were lower than 0.20 and generally did not exceed 0.50. In contrast to Se, Mn, and Cu, the variation in Zn content and accumulation between different plant species was quite different. For example, despite the similarity of HM concentrations in the tissues of different plant species, a significantly higher level of the metal was observed in wheat. In the aboveground parts of sunflower and wheatgrass, its mean value reached up to 25.4 mg·kg−1. Zn accumulated more intensively in the plants, and its BAF reached a value of 1.0 and higher. However, the Mann–Whitney U-test did not prove any species-dependent peculiarities in plant Zn bioaccumulation. A single plant species, couch grass, was used to investigate the influence of soil factors on the concentration and accumulation of metals (see Figure 5).
It is obvious that there was variability in HM accumulation and HM content in plants among different soil types. However, according to Kruskal–Wallis ANOVA, the reliability of these differences (p < 0.05) has only been established for the BAFs of Zn and Cu, but not for Mn BAF as well as HM concentrations in plant tissues.

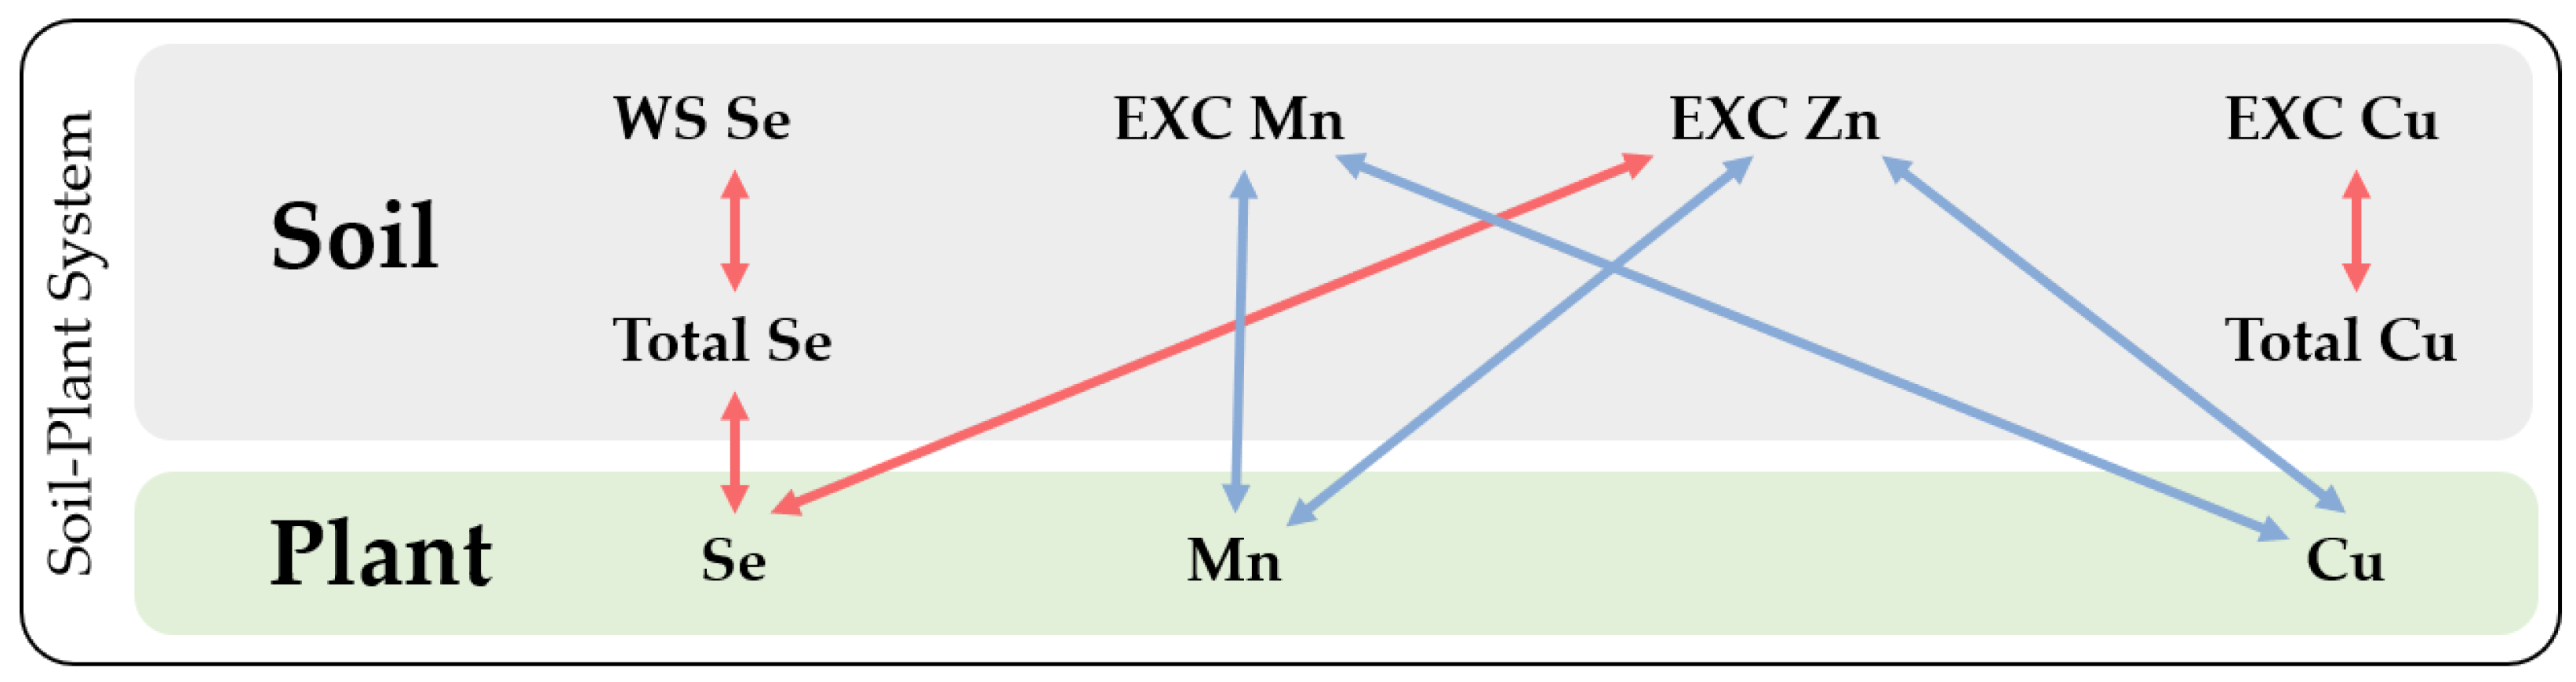
3.3. Se and HMs Interactions in Soil–Plant System

Se and HM interrelations in the soil–plant system in the Lower Dniester Valley are summarized in Figure 6.
As reported above, Se in plants was positively correlated with its total content in soils. Furthermore, a positive correlation was observed between Se in plants and the content of the mobile forms of Zn in soils (r = 0.352, p < 0.05). No antagonistic effects on Se accumulation by HMs in plants were found. Conversely, negative relationships between metals were more common. Indeed, the increase of EXC Mn in soils negatively affected the content of Mn (r = −0.440, p < 0.01) and Cu (r = −0.416, p < 0.01) in plant tissues. Similar relationships were found between EXC Zn and the content of Mn (r = −0.519, p < 0.001) and Cu (r = −0.342, p < 0.05) in the aboveground plant biomass.

4. Discussion

According to the obtained results, Voronic Chernozems were distinguished from other soils by specific conditions predominantly caused by a relatively high content of SOC (up to 27.1 g·kg−1), a higher cation exchange capacity, leaching the upper horizons from carbonates, and the associated lower soil pH. Luvy-Calcic Chernozems were similar to Fluvisols in their physical and chemical properties. Vorony-Calcic Chernozems were characterized by their low carbonate content and pH values comparable to Voronic Chernozems due to leaching from the upper horizon; at the same time, their lighter texture and lower SOC determined the lowest content of exchangeable cations there. Generally, the peculiarities of the soil development process in different soil types under the conditions of the steppe zone of the Dniester Valley have a significant influence on the content of total Se. The top horizons of Fluvisols in floodplains had the highest total Se stocks in comparison with other Chernozems subtypes. Erosion-denudation washout from slopes into floodplains and alluvial-delluvial processes are probably responsible for this phenomenon [20,39]. The mean total Se in soils obtained in this study (0.33 ± 0.13 mg·kg−1) was relatively higher than those in previous studies, 0.143–0.200 mg·kg−1 [18] and 0.246 ± 0.073 mg·kg−1 [20], but it fell within the range of 0.054–0.711 mg·kg−1 [18] and 0.100–0.668 mg·kg−1 [20].
The total soil Se is not a good indicator of the Se supply in the food chain [40]. Biogeochemical processes involving the formation of various compounds by the free biogeochemical energy of living organisms occur in soils. Such biogeochemical processes result in the production of mobile forms of the element, which may be available to plants, involving it in biogenic migration [7,41]. The water-soluble Se forms in soils are of the greatest importance to plants, which are a reliable indicator of the element’s status in landscapes and ecosystems [30,42,43]. It was found that concentrations of WS Se in the upper layer of soils in the LDV increased with rising total soil Se (r = 0.845). The same trend was found for arable soils in arid regions of China, but the correlation coefficient was lower (r = 0.58), while higher values of the coefficient were characteristic only for soils under natural vegetation [44]. This study confirms previous research indicating that the relative abundances of Se species in soil are dependent on total soil Se [18].
The mobility of trace elements in the soils of Moldova is largely determined by the binding of organic matter and soil-absorbing complexes [45]. Meanwhile, the predominantly slightly alkaline conditions of soil solutions, a low content of soil organic matter, and the cation exchange capacity of soils had no significant effect on the content of water-soluble Se. Furthermore, the total soil Se content was only weakly dependent on the soil humus content and the soil pH. Favorable conditions for Se mobility in soils are indicated by all of the above results. On average, at least 32% of the total Se in the soils of the Dniester Valley can be transferred to the water extract. Bogdevich et al. [18] found that the fraction of soluble and ligand-exchangeable organic and inorganic Se species was up to 24.5% of the total soil Se near Carpineni township, which are similar to the data obtained in the present study. Data related to Se in other regions and biogeochemical provinces were provided for comparison. For example, in different types of soils in China, the WS Se was observed in less amounts from 1.07 to 6.69% of total Se [44]; in the acidic soils of Japan—0.5–7.1% [46]; in the soils of Serbia—0.59–16.35% [47]. In Hungary, most of the soils contained no more than 10% of WS Se, and only in some individual samples did its concentrations reach a similar level of 20–35% of the total amount [48]. Therefore, our results are consistent with those reported in other studies.
To identify the geochemical characteristics of Se and studied HMs in the Lower Dniester Valley, we compared the obtained results with data on element content in soils worldwide, as well as with mean values and concentration ranges in the soils of the study region (see Table 5).
In general, the Se content in LDV soils was found to be relatively higher than reported for a broader area, including the Dniester-Prut interfluve. At the same time, world soils had a higher mean value of total soil Se. The total Cu in the soils of the LDV (excluding contaminated sites) was comparable to that of soils in Moldova, which was slightly lower than the average content of soils in the world. The total Mn in the investigated soils was similar to the mean value of the metal in soils of the world, but 1.7 times lower than the total concentrations in the soils of Moldova. Meanwhile, the LDV had relatively low concentrations of total Zn in the soils. On average, they were more than twice as low as the regional background and similar to those found in soils worldwide. It is important to note that the Se and HMs of soils were typically far below the known thresholds.
The investigation of Mn, Zn, and Cu contents in the soil, which are possible anthropogenic pollutants, confirmed the absence of any systematic contamination with Mn and Zn, but not with Cu [28,45,49]. Agricultural pollution is the main source of high Cu concentrations in the environment of Moldova [29,50]. Unlike total metal concentrations, which reflect general soil contamination, the mobile forms are the main indicator that fully characterizes the degree of adverse effect on plants. Many researchers explain that aggressive extracting agents, such as acids, extract the significant quantity of HMs from the soil. Acidic extracts contain not only the forms available to plants, but also a part of the total, which can be considered as the next reserve capable of being mobilized [51,52]. Acid-soluble Cu varied within three orders of magnitude from 3.0 to 115.8 mg·kg−1 soil, then the concentrations of mobile metal forms varied within four orders of magnitude from 0.04 to 23.70 mg·kg−1 soil. According to Kiriluk [45], the range for the soils of Moldova was much wider (0.1–60.0 mg·kg−1) with an average value of 1.6 mg·kg−1 soil. The acid extract contained significantly large amounts of mobile Cu in polluted soils, potentially available for assimilation by plants. Chemicals have been used extensively in Moldavian agriculture, with approximate estimates of copper-containing preparations being around 6000–8000 tons per year from the early 1950s to the early 1990s [45]. The accumulation of Cu in soils can result in high concentrations of Cu even after the cessation of pesticide use [53,54]. In this respect, the analysis revealed the existence of local Cu contamination in the alluvial soils of the Dniester Valley with relatively low total content and mobility in most of the studied region.
Regarding the average Se and HMs content in plants, there were no significant differences in element concentrations, except for Se in sunflower and Zn in wheat, which were the highest. This variability, in addition to species-dependent accumulation, could imply a different availability of elements in the soil.
The studied plants belonged to the ecological group of non-accumulators according to their ability to accumulate Se in their tissues [55]. Se content in the aboveground part of the studied crops and wild-growing plants was found to be relatively low compared to its content in most soils. Substantially, plants growing on Fluvisols, the soils associated with floodplains, accumulated more Se than plants growing on Chernozems on terraces and slopes in steppe and arable lands. This can be explained by the higher total Se content in floodplain soils, which are subordinate in landscape-geochemical systems compared to Chernozem soils. However, it cannot be ignored that artificially constructed dyke systems to prevent river flooding isolated the agricultural lands in the floodplain from flood waters. This altered soil formation process in alluvial soils may have resulted in a greater influence of groundwater on Se loading in alluvial soils, as shallow groundwater provides additional moisture to the root zone via capillary fluxes [56]. This may have implications for the cultivation of selenium-enriched crops and the production of functional foods. Considering the slightly alkaline nature of soil solutions, the relatively low SOC content, and the significant cation exchange capacity of soils [30,55,57], selenates, selenites, and ligand-exchangeable organoselenium compounds are expected to be readily available for plant uptake. In another study of the soil–plant–groundwater system [58], the Se content in plants was also relatively low.
The use of biogeochemical indicators (BAFs) characterizing interrelations can be used to assess certain cases of the soil–plant system. Biological selectivity allows plants to control their chemical composition within certain boundaries [59,60]. Plants accumulated Zn more intensively, as indicated by BAFs ≥ 1, in order to meet their requirements. Se was also characterized by high BAFs ≥ 1, although it is not an essential trace element for higher plants [11,12,61]. Significant differences in the accumulation of Se and Zn were observed in different soil types of the Dniester Valley. This indicates that the bioavailability of these elements differs depending either on the specific landscape and geochemical conditions or the intensity of their migration. No such patterns were observed for Mn and its BAFs were low. The bioaccumulation of Cu also varied as a function of the soil geochemical conditions and the level of anthropogenic pollution, but it was low too (BAFs < 0.5).

5. Conclusions

The conditions for Se bioaccumulation in plants in the Dniester Valley were found to be favorable. The reasons are connected to the territory location within a hydrogeochemical province with high selenium content in groundwater, the Se optimal level in soils, its high mobility, and the occurrence of favorable physical and chemical conditions of soils for selenium mobilization. Se concentrations in plants varied from 0.06 to 0.58 mg·kg−1 depending on either the plant species or the local landscape and geochemical conditions. Plants growing on Fluvisols accumulated more Se than those on Chernozems due to the higher total Se in floodplain soils. This may have implications for producing Se-fortified crops and functional foods. However, the absence of systematic soil contamination caused by Mn and Zn, their relatively low levels in soils, as well as local foci of soil pollution with Cu, determined the absence of antagonistic interactions in the soil–plant system. Further studies are required to identify the reasons for the high mobility of Se and the significant content of its water-soluble forms in soils.

Author Contributions

Conceptualization, S.S. and N.G.; methodology, S.S. and T.S.; software, S.S.; validation, S.S., O.C.M. and G.C.; formal analysis, G.C.; investigation, S.S., T.S. and N.G.; resources, S.S. and T.S.; data curation, S.S. and A.V.T.; writing—original draft preparation, S.S.; writing—review and editing, N.G. and G.C.; visualization, S.S.; supervision, N.G.; project administration, S.S.; funding acquisition, S.S. All authors have read and agreed to the published version of the manuscript.

Funding

This research received no external funding.

Institutional Review Board Statement

Not applicable.

Informed Consent Statement

Not applicable.

Data Availability Statement

Data are contained within the article.

Conflicts of Interest

The authors declare no conflicts of interest.

References

  1. Szynkowska, M.I.; Pawlaczyk, A.; Maćkiewicz, E. Bioaccumulation and Biomagnification of Trace Elements in the Environment. In Recent Advances in Trace Elements; Chojnacka, K., Saeid, A., Eds.; Wiley: Hoboken, NJ, USA, 2018; pp. 251–276. [Google Scholar] [CrossRef]
  2. Obaid, H.; Ma, L.; Nader, S.E.; Hashimi, M.H.; Sharifi, S.; Kakar, H.; Ni, J.; Ni, C. Heavy Metal Contamination Status of Water, Agricultural Soil, and Plant in the Semiarid Region of Kandahar, Afghanistan. ACS Earth Space Chem. 2023, 7, 1446–1458. [Google Scholar] [CrossRef]
  3. Massas, I.; Kairis, O.; Gasparatos, D.; Ioannou, D.; Vatougios, D.; Zafeiriou, I. Impaired Soil Health in Agricultural Areas Close to Fe-Ni Mines on Euboea Island, Greece, Caused by Increased Concentrations of Potentially Toxic Elements, and the Associated Impacts on Human Health. Environments 2023, 10, 150. [Google Scholar] [CrossRef]
  4. Xie, X.; Liu, Y.; Qiu, H.; Yang, X. Quantifying Ecological and Human Health Risks of Heavy Metals from Different Sources in Farmland Soils within a Typical Mining and Smelting Industrial Area. Environ. Geochem. Health 2023, 45, 5669–5683. [Google Scholar] [CrossRef] [PubMed]
  5. Wang, Y.; Mo, L.; Yu, X.-X.; Shi, H.-D.; Fei, Y. Enrichment Characteristics, Source Apportionment, and Risk Assessment of Heavy Metals in the Industrial and Mining Area of Northern Guangdong Province. Huan Jing Ke Xue Huanjing Kexue 2023, 44, 1636–1645. [Google Scholar] [CrossRef] [PubMed]
  6. Li, C.; Zhou, K.; Qin, W.; Tian, C.; Qi, M.; Yan, X.; Han, W. A Review on Heavy Metals Contamination in Soil: Effects, Sources, and Remediation Techniques. Soil Sediment Contam. Int. J. 2019, 28, 380–394. [Google Scholar] [CrossRef]
  7. Natasha; Shahid, M.; Niazi, N.K.; Khalid, S.; Murtaza, B.; Bibi, I.; Rashid, M.I. A Critical Review of Selenium Biogeochemical Behavior in Soil-Plant System with an Inference to Human Health. Environ. Pollut. 2018, 234, 915–934. [Google Scholar] [CrossRef] [PubMed]
  8. Alengebawy, A.; Abdelkhalek, S.T.; Qureshi, S.R.; Wang, M.-Q. Heavy Metals and Pesticides Toxicity in Agricultural Soil and Plants: Ecological Risks and Human Health Implications. Toxics 2021, 9, 42. [Google Scholar] [CrossRef]
  9. Jiang, H.; Lin, W.; Jiao, H.; Liu, J.; Chan, L.; Liu, X.; Wang, R.; Chen, T. Uptake, Transport, and Metabolism of Selenium and Its Protective Effects against Toxic Metals in Plants: A Review. Metallomics 2021, 13, mfab040. [Google Scholar] [CrossRef]
  10. Farman, M.; Nawaz, F.; Majeed, S.; Ahmad, K.S.; Rafeeq, R.; Shehzad, M.A.; Shabbir, R.N.; Usmani, M.M. Interplay between Selenium and Mineral Elements to Improve Plant Growth and Development. In Handbook of Bioremediation; Elsevier: Amsterdam, The Netherlands, 2021; pp. 221–236. [Google Scholar] [CrossRef]
  11. Liu, H.; Xiao, C.; Qiu, T.; Deng, J.; Cheng, H.; Cong, X.; Cheng, S.; Rao, S.; Zhang, Y. Selenium Regulates Antioxidant, Photosynthesis, and Cell Permeability in Plants under Various Abiotic Stresses: A Review. Plants 2022, 12, 44. [Google Scholar] [CrossRef]
  12. Guignardi, Z.; Schiavon, M. Biochemistry of Plant Selenium Uptake and Metabolism. In Selenium in Plants; Pilon-Smits, E.A.H., Winkel, L.H.E., Lin, Z.-Q., Eds.; Plant Ecophysiology; Springer International Publishing: Cham, Germany, 2017; Volume 11, pp. 21–34. [Google Scholar] [CrossRef]
  13. Rayman, M.P. The Importance of Selenium to Human Health. Lancet 2000, 356, 233–241. [Google Scholar] [CrossRef]
  14. Ali, S.; Sami, U.; Hasnain, U.; Arsalan, S.; Sohaib, N.; Zarmina, A.; Hamza, J.M.; Zain, U.A.; Rimsha, Z. Effects of Heavy Metals on Soil Properties and Their Biological Remediation. Indian J. Pure Appl. Biosci. 2022, 10, 40–46. [Google Scholar] [CrossRef]
  15. Wang, Z.; Huang, W.; Pang, F. Selenium in Soil–Plant-Microbe: A Review. Bull. Environ. Contam. Toxicol. 2022, 108, 167–181. [Google Scholar] [CrossRef] [PubMed]
  16. Naveed, S.; Oladoye, P.O.; Alli, Y.A. Toxic Heavy Metals: A Bibliographic Review of Risk Assessment, Toxicity, and Phytoremediation Technology. Sustain. Chem. Environ. 2023, 2, 100018. [Google Scholar] [CrossRef]
  17. Moraru, C. Groundwater Quality in the Republic of Moldova. In Management of Water Quality in Moldova; Duca, G., Ed.; Water Science and Technology Library; Springer International Publishing: Cham, Germany, 2014; Volume 69, pp. 177–194. [Google Scholar] [CrossRef]
  18. Hannigan, R.E.; Bogdevich, O.P.; Izmailova, D.N. Selenium in Soils and Groundwater of Moldova. Environ. Geosci. 2006, 13, 267–279. [Google Scholar] [CrossRef]
  19. World Health Organization. Guidelines for Drinking-Water Quality: Fourth Edition Incorporating the First Addendum; World Health Organization: Geneva, Switzerland, 2017. [Google Scholar]
  20. Kapitalchuk, I.; Golubkina, N.; Kapitalchuk, M.; Sheshnitsan, S. Selenium in Soils of Moldova. J. Environ. Sci. Eng. A 2014, 3, 268–273. [Google Scholar] [CrossRef]
  21. Golubkina, N.; Sheshnitsan, S.; Kapitalchuk, M. Ecological Importance of Insects in Selenium Biogenic Cycling. Int. J. Ecol. 2014, 2014, 835636. [Google Scholar]
  22. Golubkina, N.A.; Sheshnitsan, S.S.; Kapitalchuk, M.V.; Erdenotsogt, E. Variations of Chemical Element Composition of Bee and Beekeeping Products in Different Taxons of the Biosphere. Ecol. Indic. 2016, 66, 452–457. [Google Scholar] [CrossRef]
  23. Golubkina, N.A.; Kapitalchuk, M.V.; Sheshnitsan, S.S.; Grishina, T.L.; Kapitalchuk, I.P. Selenium Accumulation by Mushrooms of the Dniester River Valley. Trace Elem. Med. Mosc. 2014, 15, 19–26. [Google Scholar]
  24. Kapitalchuk, M.V.; Golubkina, N.A.; Kapitalchuk, I.P. Hair Concentrations of Selenium in the Moldovan Population. Ekol. Cheloveka Hum. Ecol. 2023, 30, 363–373. [Google Scholar] [CrossRef]
  25. Botnaru, V.; Mirlean, N.; Quintana, G.C.R. Informative Eco-Geochemical Assessment of Soil Layer Pollution in Chisinau during the Peak Period of Industrial Activity. Bull. Inst. Geol. Seismol. 2022, 1, 33–40. [Google Scholar] [CrossRef]
  26. Zubcov, E.; Zubcov, N. The Dynamics of the Content and Migration of Trace Metals in Aquatic Ecosystems of Moldova. E3S Web Conf. 2013, 1, 32009. [Google Scholar] [CrossRef]
  27. Zinicovscaia, I.; Hramco, C.; Duliu, O.G.; Vergel, K.; Culicov, O.A.; Frontasyeva, M.V.; Duca, G. Air Pollution Study in the Republic of Moldova Using Moss Biomonitoring Technique. Bull. Environ. Contam. Toxicol. 2017, 98, 262–269. [Google Scholar] [CrossRef] [PubMed]
  28. Zinicovscaia, I.; Duliu, O.; Culicov, O.A.; Frontasyeva, M.; Sturza, R. Major and Trace Elements Distribution in Moldavian Soils. Romanian Rep. Phys. 2018, 70, 1–10. [Google Scholar]
  29. Zinicovscaia, I.; Sturza, R.; Duliu, O.; Grozdov, D.; Gundorina, S.; Ghendov-Mosanu, A.; Duca, G. Major and Trace Elements in Moldavian Orchard Soil and Fruits: Assessment of Anthropogenic Contamination. Int. J. Environ. Res. Public Health 2020, 17, 7112. [Google Scholar] [CrossRef] [PubMed]
  30. Kabata-Pendias, A. Trace Elements in Soils and Plants, 4th ed.; CRC Press: Boca Raton, FL, USA, 2010. [Google Scholar] [CrossRef]
  31. Antosyak, G. Atlas of Moldavian SSR; Main Directorate of Geodesy and Cartography: Moscow, Russia, 1978. [Google Scholar]
  32. Grebenshchikov, V.P.; Grebenshchikova, N.V. Hydrogeological Features of the Territory of Tiraspol. Sci. Dev. Trends Educ. 2019, 56, 79–82. [Google Scholar] [CrossRef]
  33. Skjemstad, J.; Baldock, J. Total and Organic Carbon. In Soil Sampling and Methods of Analysis, 2nd ed.; Carter, M., Gregorich, E., Eds.; CRC Press: Boca Raton, FL, USA, 2007. [Google Scholar] [CrossRef]
  34. Shaimukhametov, M.S. On the Methods of Exchangeable Ca and Mg Determination in Chernozemic Soils. Eurasian Soil Sci. 1993, 12, 105–111. [Google Scholar]
  35. ISO 11047:1998; Soil Quality—Determination of Cadmium, Chromium, Cobalt, Copper, Lead, Manganese, Nickel and Zinc—Flame and Electrothermal Atomic Absorption Spectrometric Methods. German Institute for Standardization: Berlin, Germany, 1998. Available online: https://www.iso.org/standard/24010.html (accessed on 10 September 2023).
  36. Gupta, U.; Hettiarachchi, G. Boron, Molybdenum, and Selenium. In Soil Sampling and Methods of Analysis, 2nd ed.; Carter, M., Gregorich, E., Eds.; CRC Press: Boca Raton, FL, USA, 2007. [Google Scholar] [CrossRef]
  37. Alfthan, G. A Micromethod for the Determination of Selenium in Tissues and Biological Fluids by Single-Test-Tube Fluorimetry. Anal. Chim. Acta 1984, 165, 187–194. [Google Scholar] [CrossRef]
  38. Hussain, B.; Abbas, Y.; ur-Rahman, S.; Ali, H.; Zafar, M.; Ali, S.; Ashraf, M.N.; Zehra, Q.; Espinoza, S.T.L.; Valderrama, J.R.D. Metal and Metalloids Speciation, Fractionation, Bioavailability, and Transfer toward Plants. In Metals Metalloids Soil Plant Water Systems; Elsevier: Amsterdam, The Netherlands, 2022; pp. 29–50. [Google Scholar] [CrossRef]
  39. Song, T.; Liu, C.; Cui, G.; Tong, S. Research on the Migration and Transformation Behaviors of Soil Selenium in the Flood Irrigation Process. Arch. Agron. Soil Sci. 2021, 67, 1388–1399. [Google Scholar] [CrossRef]
  40. Jones, G.D.; Winkel, L.H.E. Multi-Scale Factors and Processes Controlling Selenium Distributions in Soils. In Selenium in Plants; Pilon-Smits, E.A.H., Winkel, L.H.E., Lin, Z.-Q., Eds.; Plant Ecophysiology; Springer International Publishing: Cham, Germany, 2017; Volume 11, pp. 3–20. [Google Scholar] [CrossRef]
  41. Murphy, D.V.; Stockdale, E.A.; Brookes, P.C.; Goulding, K.W.T. Impact of Microorganisms on Chemical Transformations in Soil. In Soil Biological Fertility; Abbott, L.K., Murphy, D.V., Eds.; Springer Netherlands: Dordrecht, The Netherlands, 2004; pp. 37–59. [Google Scholar] [CrossRef]
  42. Jump, R.K.; Sabey, B.R. Soil Test Extractants for Predicting Selenium in Plants. In SSSA Special Publications; Jacobs, L.W., Ed.; Soil Science Society of America and American Society of Agronomy: Madison, WI, USA, 2015; pp. 95–105. [Google Scholar] [CrossRef]
  43. Wang, Z.; Gao, Y. Biogeochemical Cycling of Selenium in Chinese Environments. Appl. Geochem. 2001, 16, 1345–1351. [Google Scholar] [CrossRef]
  44. Tan, J.; Zhu, W.; Wang, W.; Li, R.; Hou, S.; Wang, D.; Yang, L. Selenium in Soil and Endemic Diseases in China. Sci. Total Environ. 2002, 284, 227–235. [Google Scholar] [CrossRef]
  45. Kiriluk, V.P. Trace Elements in the Components of the Biosphere of Moldova; Pontos: Chișinău, Moldova, 2006. [Google Scholar]
  46. Yamada, H.; Hattori, T. Forms of Soluble Selenium in Soil. Soil Sci. Plant Nutr. 1989, 35, 553–563. [Google Scholar] [CrossRef]
  47. Čuvardić, M.S. Selenium in Soil. Proc. Nat. Sci. 2003, 104, 23–27. [Google Scholar]
  48. Gondi, F.; Pantó, G.; Fehér, J.; Bogye, G.; Alfthan, G. Selenium in Hungary: The Rock-Soil-Human System. Biol. Trace Elem. Res. 1992, 35, 299–306. [Google Scholar] [CrossRef] [PubMed]
  49. Kapitalchuk, I.P.; Sheshnitsan, T.L.; Sheshnitsan, S.S.; Kapitalchuk, M.V. Migration of Manganese, Zinc, Copper and Molybdenum in Landscape-Geochemical Catena of the Lower Dniester Valley. South Russ. Ecol. Dev. 2018, 13, 96–112. [Google Scholar] [CrossRef]
  50. Sapozhnikova, Y.; Zubcov, N.; Hungerford, S.; Roy, L.A.; Boicenco, N.; Zubcov, E.; Schlenk, D. Evaluation of Pesticides and Metals in Fish of the Dniester River, Moldova. Chemosphere 2005, 60, 196–205. [Google Scholar] [CrossRef] [PubMed]
  51. Udeigwe, T.K.; Eichmann, M.; Eze, P.N.; Ogendi, G.M.; Morris, M.N.; Riley, M.R. Copper Micronutrient Fixation Kinetics and Interactions with Soil Constituents in Semi-Arid Alkaline Soils. Soil Sci. Plant Nutr. 2016, 62, 289–296. [Google Scholar] [CrossRef]
  52. Yuan, D.; Lian, W.; Lianggang, Z.; Dezhi, C. Expression of Copper and Cadmium Plant Availability in Soils. Environ. Sci. Technol. 2010, 33, 27–30. [Google Scholar]
  53. Vázquez-Blanco, R.; Nóvoa-Muñoz, J.C.; Arias-Estévez, M.; Fernández-Calviño, D.; Pérez-Rodríguez, P. Changes in Cu Accumulation and Fractionation along Soil Depth in Acid Soils of Vineyards and Abandoned Vineyards (Now Forests). Agric. Ecosyst. Environ. 2022, 339, 108146. [Google Scholar] [CrossRef]
  54. Li, X.; Zhang, J.; Gong, Y.; Liu, Q.; Yang, S.; Ma, J.; Zhao, L.; Hou, H. Status of Copper Accumulation in Agricultural Soils across China (1985–2016). Chemosphere 2020, 244, 125516. [Google Scholar] [CrossRef]
  55. White, P.J. Selenium Accumulation by Plants. Ann. Bot. 2016, 117, 217–235. [Google Scholar] [CrossRef]
  56. Soylu, M.E.; Bras, R.L. Dataset on the Global Distribution of Shallow Groundwater. Data Brief 2023, 47, 108973. [Google Scholar] [CrossRef] [PubMed]
  57. Wang, S.; Liang, D.; Wang, D.; Wei, W.; Fu, D.; Lin, Z. Selenium Fractionation and Speciation in Agriculture Soils and Accumulation in Corn (Zea mays L.) under Field Conditions in Shaanxi Province, China. Sci. Total Environ. 2012, 427–428, 159–164. [Google Scholar] [CrossRef] [PubMed]
  58. Eliopoulos, G.D.; Eliopoulos, I.-P.D.; Tsioubri, M.; Economou-Eliopoulos, M. Distribution of Selenium in the Soil–Plant–Groundwater System: Factors Controlling Its Bio-Accumulation. Minerals 2020, 10, 795. [Google Scholar] [CrossRef]
  59. Hasanuzzaman, M.; Hawrylak-Nowak, B.; Islam, T.; Fujita, M. (Eds.) Biostimulants for Crop Production and Sustainable Agriculture; CABI: Wallingford, UK, 2022. [Google Scholar] [CrossRef]
  60. Rahman, S.U.; Wang, X.; Shahzad, M.; Bashir, O.; Li, Y.; Cheng, H. A Review of the Influence of Nanoparticles on the Physiological and Biochemical Attributes of Plants with a Focus on the Absorption and Translocation of Toxic Trace Elements. Environ. Pollut. 2022, 310, 119916. [Google Scholar] [CrossRef]
  61. Ferreira, G.D.S.; De Brito, P.O.B.; Lima, T.D.A.; Aderaldo, F.Í.C.; De Carvalho, G.T.; De Sousa Filho, E.D.N.; Gondim, F.A. Assessment of the Effects of Selenium Application on Leaves or Substrate on the Growth of Sunflower Plants: Avaliação Dos Efeitos Da Aplicação de Selênio Nas Folhas Ou No Substrato Sobre o Crescimento de Plantas de Girassol. Braz. J. Anim. Environ. Res. 2022, 5, 3972–3982. [Google Scholar] [CrossRef]
Figure 1. Location of the study area and sampling sites (●) in the Lower Dniester Valley. White circles represent geographic position of towns.
Soilsystems 08 00007 g001
Figure 2. Pearson correlation between total Se in soils and water-soluble Se in soils. The grey shade area represents the 95% confidence interval.
Soilsystems 08 00007 g002
Figure 3. Pearson correlation matrix: correlation coefficients between soil and plant variables. Bold values are statistically significant (p < 0.05). The abbreviations are the same as in Table 1 and Table 2.
Soilsystems 08 00007 g003
Figure 4. Pearson correlation between total Se in soils and Se concentrations in plant tissues. The grey shade area represents the 95% confidence interval.
Soilsystems 08 00007 g004
Figure 5. Heavy metal concentrations and their bioaccumulation in couch grass (E. repens) in the Lower Dniester Valley. Soil types: FL—Fluvisols, LCCh—Luvy-Calcic Chernozems, VCCh—Vorony-Calcic Chernozems, VCh—Voronic Chernozems. Data are presented as the mean values ± SD (n = 30). p-values represent the statistical significance of difference between soil types by Kruskal–Wallis ANOVA. Values with the same letters do not differ statistically at p < 0.05.
Soilsystems 08 00007 g005
Figure 6. Interactions between Se and HMs concentrations in soil–plant system in the Lower Dniester Valley. Red lines indicate positive correlations, blue lines indicate negative correlations. Only significant correlations, as determined by Pearson’s correlation matrix in Figure 3, were shown. Abbreviations are consistent with those presented in Table 2.
Soilsystems 08 00007 g006
Table 1. Soil’s physical and chemical properties.
Soil TypepHSOCCaCO3Exchangeable Cations Ca2+ + Mg2+Texture
(g·kg−1)(g·kg−1)(mg (eq)·100 g−1)
Fluvisols8.09 ± 0.10 ab13.9 ± 5.9 a67.2 ± 38.0 ab25.0 ± 8.9 aSandy loam
Luvy-Calcic Chernozems8.17 ± 0.11 a13.6 ± 6.3 a43.9 ± 23.8 b32.8 ± 10.0 aLoam
Vorony-Calcic Chernozems7.88 ± 0.24 b8.4 ± 8.1 a28.4 ± 37.0 c18.2 ± 10.5 aLoam
Voronic Chernozems7.95 ± 0.10 b27.1 ± 1.5 b12.6 ± 7.9 c46.4 ± 4.8 bSilt loam
SOC: soil organic carbon; CaCO3: carbonate content. Data (n = 34) are presented as the mean values ± SD. Within each column, values with the same letters do not differ statistically according to Mann–Whitney U-test at p < 0.05.
Table 2. Selenium and heavy metal concentrations in different soil types (0–30 cm) (mg·kg−1).
Soil TypeSeMnZnCu
TotalWSTotalEXCTotalEXCTotalEXC
Fluvisols0.36 ± 0.09 ab0.11 ± 0.03 a429 ± 173 ab96.1 ± 24.0 a35.5 ± 25.0 a1.91 ± 1.29 a27.6 ± 10.9 ab0.35 ± 0.22 ab
Luvy-Calcic Chernozems0.32 ± 0.16 b0.09 ± 0.02 a458 ± 122 a76.2 ± 25.0 ab29.3 ± 16.4 a0.97 ± 0.70 ab39.1 ± 10.8 a0.52 ± 0.51 a
Vorony-Calcic Chernozems0.33 ± 0.12 b0.08 ± 0.03 a374 ± 115 ab64.6 ± 12.5 ab25.2 ± 10.3 a0.46 ± 0.19 b13.1 ± 8.5 b0.18 ± 0.03 b
Voronic Chernozems0.23 ± 0.07 bc0.08 ± 0.01 a565 ± 17 b56.1 ± 6.2 b44.0 ± 16.2 a0.82 ± 1.25 ab26.2 ± 7.7 b0.09 ± 0.05 b
All soil types0.33 ± 0.130.09 ± 0.03464 ± 12975.7 ± 24.533.8 ± 18.41.04 ± 0.9031.2 ± 12.70.41 ± 0.45
WS: water-soluble forms; EXC: exchangeable forms. Data (n = 42 for Se, n = 34 for Mn, Zn, and n = 30 for Cu) are presented as the mean values ± SD. Within each column, values with similar letters do not differ statistically according to Mann–Whitney U-test at p < 0.05.
Table 3. Copper concentrations (mg·kg−1) in soil samples with different levels of pollution.
Pollution Level Cu
TotalASEXC
Unpolluted and low-polluted soilsMean ± SD27.3 ± 8.1 a6.2 ± 3.5 a0.23 ± 0.19 a
(n = 14)Min–max12.1–38.32.0–11.50.03–0.52
Highly polluted soilsMean ± SD73.7 ± 57.7 b53.8 ± 43.7 b8.00 ± 10.71 b
(n = 4)Min–max28.9–158.320.6–115.80.85–23.70
EXC: exchangeable forms; AS: acid-soluble forms. Within the pollution levels, values with the same letters do not differ statistically according to Mann–Whitney U-test at p < 0.05.
Table 4. Selenium and heavy metal concentrations in plants (mg·kg−1) and their bioaccumulation factors (BAFs).
Plant Species SeMnZnCu
(mg·kg−1)BAF(mg·kg−1)BAF(mg·kg−1)BAF(mg·kg−1)BAF
Sunflower
(Helianthus annuus)
Mean ± SD0.23 ± 0.17 a0.70 ± 0.41 a94.9 ± 46.7 a0.18 ± 0.08 a21.2 ± 5.5 b0.74 ± 0.46 a5.1 ± 6.4 a0.15 ± 0.13 a
Min–max 0.08–0.580.30–1.4343.6–166.00.08–0.3014.6–27.70.36–1.351.5–16.40.06–0.38
Wheat
(Titicum aestivum)
Mean ± SD0.15 ± 0.08 ab0.53 ± 0.26 ab90.4 ± 28.5 a0.20 ± 0.01 a30.1 ± 4.4 a0.75 ± 0.22 a3.1 ± 0.9 a0.11 ± 0.04 a
Min–max 0.07–0.360.29–1.0526.1–126.50.19–0.2022.4–35.60.55–1.061.9–4.30.06–0.15
Couch grass
(Elytrigia repens)
Mean ± SD0.12 ± 0.07 b0.43 ± 0.20 b78.2 ± 37.4 a0.20 ± 0.17 a25.4 ± 7.7 b1.03 ± 0.56 a3.3 ± 1.6 a0.14 ± 0.13 a
Min–max 0.06–0.320.20–0.8626.2–152.50.05–0.4913.3–43.40.32–2.581.5–7.90.04–0.49
Data (n = 12 for wheat, n = 10 for sunflower, and n = 26 for couch grass) are presented as the mean values ± SD. For each plant species, mean values with the same letters do not differ statistically according to Mann–Whitney U-test at p < 0.05.
Table 5. Selenium and heavy metal concentrations in soils and their threshold levels (mg·kg−1).
Chemical
Elements
World Soils [30]Soils of Moldova [20,45]Soils of the LDV
(This Study)
Threshold Levels [30]
TotalTotalEXCTotalEXCMAC TAV
SeMean0.440.250.330.09 *
Min–max0.10–0.650.08–0.650.04–0.15 *3–10
MnMean4887902.446475.7
Min–max150–22500.4–195196–67643–136
ZnMean70711.433.81.04
Min–max10–1660.1–4.913.2–63.00.14–3.34100–130200–1500
CuMean38.9321.631.2 **0.41 **
Min–max2–4000.1–607.0–158.30.01–23.7060–15060–500
(*) Data on water-soluble forms; (**) mean value was calculated excluding outliers. Threshold levels: ranges of maximum allowable concentrations (MAC) and trigger action values (TAV) for potentially harmful chemical elements in agricultural soils.
Disclaimer/Publisher’s Note: The statements, opinions and data contained in all publications are solely those of the individual author(s) and contributor(s) and not of MDPI and/or the editor(s). MDPI and/or the editor(s) disclaim responsibility for any injury to people or property resulting from any ideas, methods, instructions or products referred to in the content.

