Article

Exploring the Combined Effects of Different Nitrogen Sources and Chabazite Zeolite-Tuff on Nitrogen Dynamics in an Acidic Sandy-Loam Soil

1
Department of Chemical, Pharmaceutical and Agricultural Sciences, University of Ferrara, Via Luigi Borsari 46, 44121 Ferrara, Italy
2
Department of Environmental and Prevention Science, University of Ferrara, Via Luigi Borsari 46, 44121 Ferrara, Italy
3
Department of Chemical and Geological Sciences, University of Modena and Reggio Emilia, Via Giuseppe Campi 103, 41125 Modena, Italy
*
Author to whom correspondence should be addressed.
Soil Syst. 2024, 8(1), 16; https://doi.org/10.3390/soilsystems8010016
Submission received: 14 December 2023 / Revised: 23 January 2024 / Accepted: 24 January 2024 / Published: 26 January 2024

Abstract

:
Volcanic tuffs rich in chabazite zeolites have been extensively examined for their potential to enhance soil properties and increase fertilizer efficiency, both in their natural state and when enriched with nitrogen (N). However, there is a scarcity of data regarding their utilization in acidic sandy soil, particularly when used alongside organic fertilizers. This paper presents the findings of a 50-day laboratory incubation study that investigated the dynamics of N pools in an acidic sandy-loam agricultural soil treated with various N sources. These sources included urea, N-enriched chabazite zeolite tuff, and pelleted composted manure applied at a rate of 170 kg N/ha. Additionally, the N sources were tested in combination with chabazite zeolite tuff mixed into the soil to assess its role as a soil conditioner. The results revealed distinct behaviours among the tested N sources, primarily impacting soil pH and N dynamics. Soil fertilized with manure exhibited slow N mineralization, whereas N-enriched zeolite displayed a more balanced behaviour concerning net NO3-N production and NH4+-N consumption. Both N-enriched zeolite and urea temporarily altered the soil pH, resembling a “liming” effect, while pelleted manure facilitated a prolonged shift towards neutral pH values. Considering the water adsorption capacity of zeolite minerals, caution is advised when adjusting water content and employing combustion methods to measure soil organic matter in zeolite-treated soil to avoid potential inaccuracies. In summary, N-enriched chabazite zeolite tuff emerged as a valuable N source in acidic sandy-loam soil, offering a promising alternative to synthetic fertilizers and showcasing a sustainable means of N recycling.

1. Introduction

Increasing the sustainability of agricultural practices is undoubtedly a matter under the spotlight. Given the expected growth in world population and food demand, crop production must be increased without further degrading the soil and minimizing energy consumption. Soil degradation is among the most severe threats that mankind is facing [1]. Since our food production relies on the capacity of soil to support plant growth, incorrect agricultural practices, such as overuse of chemical fertilizers and pesticides, monoculture farming, overgrazing, and excessive water use, may stimulate soil degradation, erosion, and loss of crop productivity [2]. Avoiding soil degradation is important to prevent loss of soil fertility and biodiversity and hence land productivity [3].
The management of nutrients and soil organic matter (SOM) plays a pivotal role in the fertility of agricultural soils and consequently in the production of food for humans and livestock. Prolonged and continuous use of chemical fertilizers such as urea (CO(NH2)2) is known to boost the mineralization of SOM, lowering the capacity of soils to sustain crop growth [4]. According to stoichiometric decomposition theory, the introduction of inorganic N, particularly when N is a limiting resource, is expected to boost microbial biomass and activity, consequently leading to increased SOM mineralization and losses [5].
Excessive use of fertilizers is also known to cause severe environmental problems, such as nitrogen (N) and phosphorous (P) pollution of various environmental compartments. These elements can reach the groundwater and the surface water bodies, through leaching and run-off processes causing eutrophication [6]. Additionally, N can be lost from agricultural soil after fertilizer application in various gaseous forms, such as NH3, N2O, and NOx [7]. These nutrient losses represent a major threat to the sustainability of the food production system because they lead to a decrease in the fertilizer efficiency and economic viability, and are also a serious environmental threat.
For these reasons, chemical fertilizers represent an important issue to face, to which must be added the fact that their production requires large amounts of energy and non-renewable resources. Currently, up to 1–2% of global world energy production is used for synthesising urea—which is 46% composed of N—also requiring non-renewable and expensive fossil resources (natural gas) [8,9]. Most of the food production today relies on urea fertilizer and, therefore, to increase agricultural sustainability and decrease the use of energy and non-renewable resources, great effort needs to be put into finding efficient alternatives. In this view, the adoption of any technology which can lead to reducing the use of low-efficiency and energy-demanding chemicals in favour of lesser-impacting fertilizers will surely have a global positive impact.
Contrary to urea, livestock manure is rich in organic matter and contains a vast amount of macro- and micronutrients, but with a significantly lower N content. Both urea and livestock manure may have severe problems in terms of efficiency, due to several pathways of nutrient losses which can occur at different stages. It is not uncommon that fractions ranging from 10 to 80% of the N applied with manure or urea can be lost in the form of NH3 after application to soil [10,11,12]. N leaching after fertilizer application may also be a serious problem in agricultural areas characterized by sandy soils, due to their high permeability and limited capacity for cation retention [13]. Sandy soils usually have low organic matter content and lack clay minerals with remarkable cation exchange capacity (CEC). In this kind of soil, it is mandatory to mitigate nutrient losses and safeguard both economic viability and ecosystem integrity. This can be achieved by managing nutrient release rates through the application of “slow-release” fertilizers [14].
To mitigate N losses and concomitantly increase soil physico-chemical properties, natural zeolites have been widely proposed in the last decades as a component of fertilizers, as soil amendment, and also recently as particle film for crop protection [13,15,16,17,18,19,20].
Natural zeolites are often components of volcanic tuffs [21] and are available at a low cost in many countries [22,23,24,25]. Zeolite minerals are characterized by an open 3D framework of linked tetrahedra of [SiO4]4− and [AlO4]5− that delimits extra-framework sites which are usually occupied by H2O and other molecules that are commonly exchangeable [26]. The main properties of zeolite minerals can be summarized in (i) high-cation CEC, (ii) reversible dehydration, and (iii) molecular sieve [26,27]. Because of these properties, natural zeolites have been applied in a wide range of industrial, environmental, and commercial applications.
In the agricultural context, zeolite-rich tuffs (ZRT) have been widely studied to improve the soil’s physico-chemical properties. Notwithstanding several natural zeolites existing, those most available worldwide are clinoptilolite, mordenite, chabazite (CHA), and phillipsite ZRT, each of them differing in terms of ion exchange capacity, structure of the framework, and chemical composition [28,29]. However, only a few of them occur in sufficient quantity and purity to be considered exploitable natural resources [30]. Clinoptilolite is the most abundant natural zeolite but CHA is particularly attractive for agricultural applications because of its very high CEC (3840 mEq/kg) and easy sorption/release of NH4+ ions [24,31]. In central Italy, many pyroclastic deposits have been altered to ZRT, containing mostly chabazite and phillipsite zeolites. Some of these ZRT units are of commercial interest since they are tens of meters thick and may contain more than 50% of zeolite minerals (also denoted as “zeolitite”). Italian ZRT containing CHA was deeply studied as a tool for N removal from animal slurries (e.g., [13,20,32]) and used (both at natural and N-enriched state) as soil amendment [33,34,35,36]. In particular, CHA ZRT has been found to mildly reduce the gross nitrification rate in silty-clay agricultural soil [35] and influence the C/N ratio of the microbial biomass [34] as well as significantly reduce CO2, NH3, and NOx gaseous losses [33].
Despite the vast number of studies, a knowledge gap still exists about the effects of this specific ZRT on N dynamics in acid sandy-loam soil in comparison to urea and manure-based fertilizers.
To fulfil this knowledge gap, in this paper, we present the results of a 50-day laboratory incubation study in which the N pool dynamics in an acidic sandy agricultural soil fertilized with different N sources have been investigated. The N sources included urea, N-enriched CHA ZRT derived from livestock effluent treatment, and pelleted composted manure. The effects of these fertilization techniques were also evaluated in combination with the use of CHA ZRT at natural state as soil improver.
We expect that the addition of CHA ZRT to the acidic sandy soil will lead to a significant alteration of the N dynamics in comparison to unamended soil. Also, we expect that the fertilization with N-enriched CHA ZRT will provide a more balanced output of N forms.

2. Materials and Methods

2.1. Soil

The soil used in this experiment has been already described by [37] and can be classified as sandy loam according to USDA classification. The sampling area was an agricultural field located in Lackendorf (47°58′98″ N, 16°50′31″ E. Burgenland, Austria). The soil was sampled in September 2021 with an excavator that reached ~50 cm depth. One composite sample was generated by pooling 10 sub-samples, then transported to the laboratory in cooling boxes, sieved to pass 2 mm, and stored in closed PVC containers at 4 °C until the beginning of the incubation.
The main physico-chemical properties of the soil are reported in Table 1.

2.2. N Sources and Natural Chabazite Tuff

The pelleted composted manure consisted of a mixture of cow and poultry manure that was subjected to a composting process and pelletized. The N-enriched chabazite tuff was obtained from a farm-scale treating system of raw pig liquid slurry mixed with Italian chabazite tuff. The treatment system is located in Soncino (Cremona, Italy) and can treat about 15 m3 of liquid raw pig slurry by sequential adsorption batches with zeolite tuff. This process led to the progressive removal of NH4+ from the liquid manure and the formation of the N-enriched chabazite tuff as output material. Concerning urea, high purity 46% N urea fertilizer was used in the experiments.
In Table 2, the total N content and NH4+-N of the employed fertilizers are reported.
The natural zeolite tuff (not artificially enriched) used as soil improver consisted of a volcanic tuff quarried in the surrounding of Sorano (42°41′27″ N, 11°44′35″ E. Grosseto, Italy). As recently reported by [37], this zeolite tuff was composed of the following mineral phases: CHA (71.3%), K-feldspar (13.8%), phillipsite (4.71%), and volcanic glass (6.73%). The CEC was 2170 mEq/kg, with calcium (Ca2+) and potassium (K+) as the main exchangeable ions, while the average pH measured in 1:5 (w:v) H2O extracts was 8.1. The NH4+ adsorption properties and performances of the same rock were previously studied in raw liquid pig slurry [32].

2.3. Experimental Set-Up

The experimental design included 3 factors: (I) N sources, (II) the presence/absence of zeolite as soil improver, and (III) incubation time.
The tested N sources were represented by urea fertilizer (UREA), N-enriched chabazite tuff from livestock wastewater treatment (CZ), and pelleted composted manure (M). All these N sources were added to the soil making sure to equilibrate all the treatments to the same N content, equal to 170 kg N/ha, which is the upper limit of the N applicable in Nitrate Vulnerable Zones according to the Nitrate Directive (91/676/EEC). For incubating soil, steel rings (100 cm3) were used containing all the same amounts of soil, adjusted to equal bulk density ~1.12 g/cm3. The soil bulk density was measured by knowing the cylinder volume, the gross soil weight, and its water content (at 105 °C). By knowing these parameters, it was also possible to calculate soil porosity, volumetric water content, and the water-filling pore space (WFPS). Before starting the incubation, the samples were equilibrated to 45% of the WFPS for 4 days to activate soil microbial biomass. Six replicates were prepared for each N source (Factor I), but half of the samples (n = 3) also received 10% (w:w) of natural state CHA ZRT which was carefully mixed with the sandy soil to test the effect of natural zeolites as soil improver (Factor II). At the beginning of the experiment (day 1), the N sources were added to the samples and carefully mixed to allow for a homogeneous distribution of the fertilizer in the volume of soil; afterwards, Milli-Q water was added until reaching 65% of WFPS. This level of WFPS was chosen because it is considered a threshold value between the relative prevalence of nitrification and denitrification processes in soil and to allow for comparison with previous experiments [33,35,38]. Each treatment was incubated in 3 replicates for a total period of 50 days at a constant temperature (20 °C) and WFPS (65%) in an incubator. The weight of each sample was constantly checked in order to track the amount of water lost by evaporation and constant refilling with Milli-Q water was made to maintain the correct WFPS level. On days 1, 7, 15, 33, and 50 (Factor III), 10 g of soil were sampled from each ring to perform a series of chemical analyses. After each sampling, the soil was recompacted at the correct bulk density and the WFPS was set again to 65% by adding Milli-Q water. The amount of soil sampled at each time point was kept as low as possible to minimize soil disturbance and avoid an excessive reduction in the soil volume.

2.4. Analytical Techniques

SOM was estimated by the weight loss that occurred at 550 °C after 24 h (on samples already dried at 105 °C) [39]. Soil samples were extracted with H2O Milli-Q water in a 1:5 w/v ratio followed by 1 h shacking in an orbital shaker at 150 rpm and 5 min of centrifugation at 4000 rpm. The pH and electrical conductivity (EC) were measured with a pH electrode connected to an 877 Titrino Plus titration unit (Methrom, Origgio, Italy) and an RS 180-7127 conductivity probe (Hanna Instrument, Woonsocket, RI, USA) [13], respectively. The water extracts were also analyzed for soluble anions (F, Cl, NO2, Br, NO3, PO43−, SO42−) with an ICS-1000 Dionex isocratic dual pump Ion chromatography System connected to an AS40 Autosampler (Thermo Fisher Scientific, Waltham, MA, USA). The Ion Chromatography (IC) system was equipped with an AS9-HC 4 × 250 mm anion column, an AG9-HC 4 × 50 mm guard column, and ADRS600 suppressor [37].
Exchangeable NH4+-N was measured in 1:10 1M KCl extracts by direct distillation with a K-360 Distillation unit (Büchi, Flawil, Switzerland) in a Kjeldahl system connected to the above-mentioned titration unit [13].
Soil total N was measured by Elemental Analysis (EA) with a Vario Micro Cube Elemental Analyser (Elementar, Langenselbold, Germany) [40].

2.5. Calculations and Statistical Analysis

The soil organic N (Org-N) was calculated by difference following Equation (1):
Org-N = TN − inorganic N
where TN is the soil total N measured by EA and inorganic N is the sum of inorganic N forms (NH4+-N, NO3-N, NO2-N).
Net ammonification and nitrification rates were determined according to Equation (2):
Net ammonification/nitrification = [(Cf − Ci)/t]
where Cf and Ci are final and initial concentrations of NH4+-N (for net ammonification) or NO3-N (for net nitrification) and t is the number of days intercurred.
After checking for data normality and homoscedasticity with Shapiro–Wilk and Bartlett tests, significant differences between the treatments were evaluated by applying 1-way ANOVA to the dataset at p = 0.05 to check for differences between the different N sources (CZ, M and, UREA). Two-way ANOVA was also applied to address interactions between factors “zeolite” and “time” within each N source group. The Tukey HSD test was used as a multi-comparison test.
Correlation analysis (using Pearson “ρ” coefficient at p = 0.05) was applied to the dataset and is reported in the Supplementary Material Figure S1. The statistical analysis was performed with R (version 4.2.2) and R studio (version 2022-12.0-353) software [41,42].
The complete dataset is reported in Appendix A Table A1, Table A2 and Table A3.

3. Results

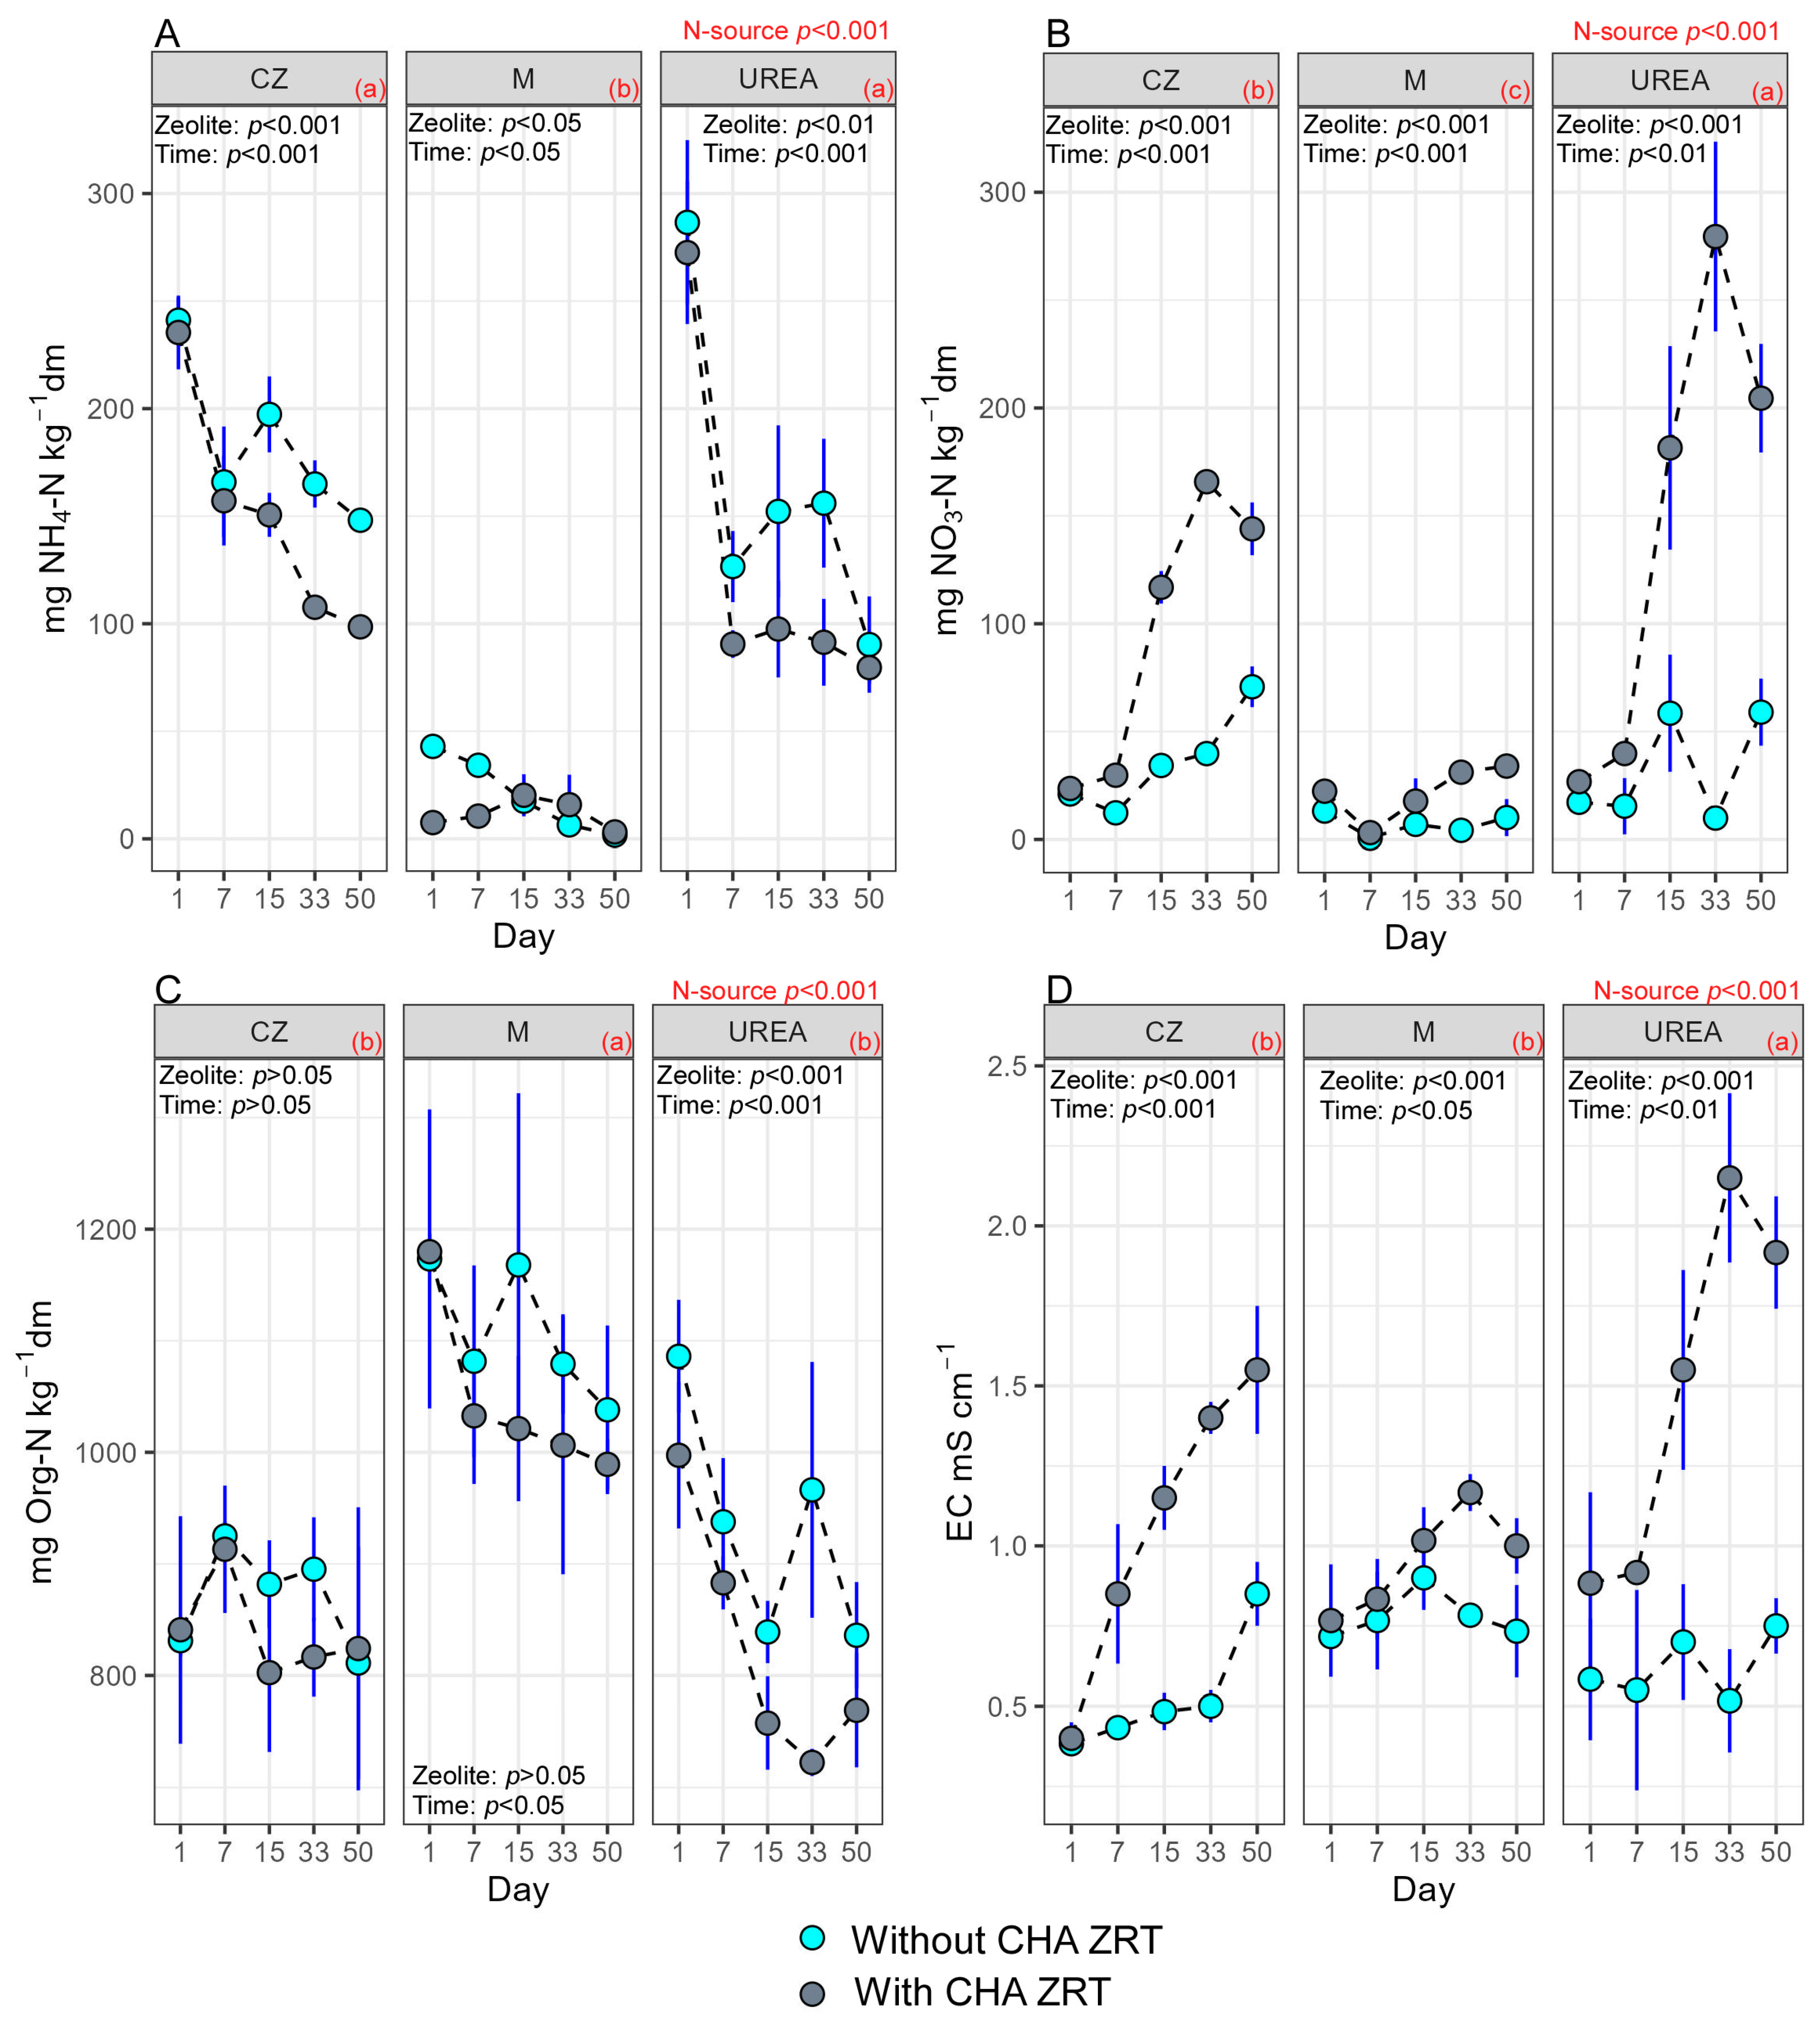
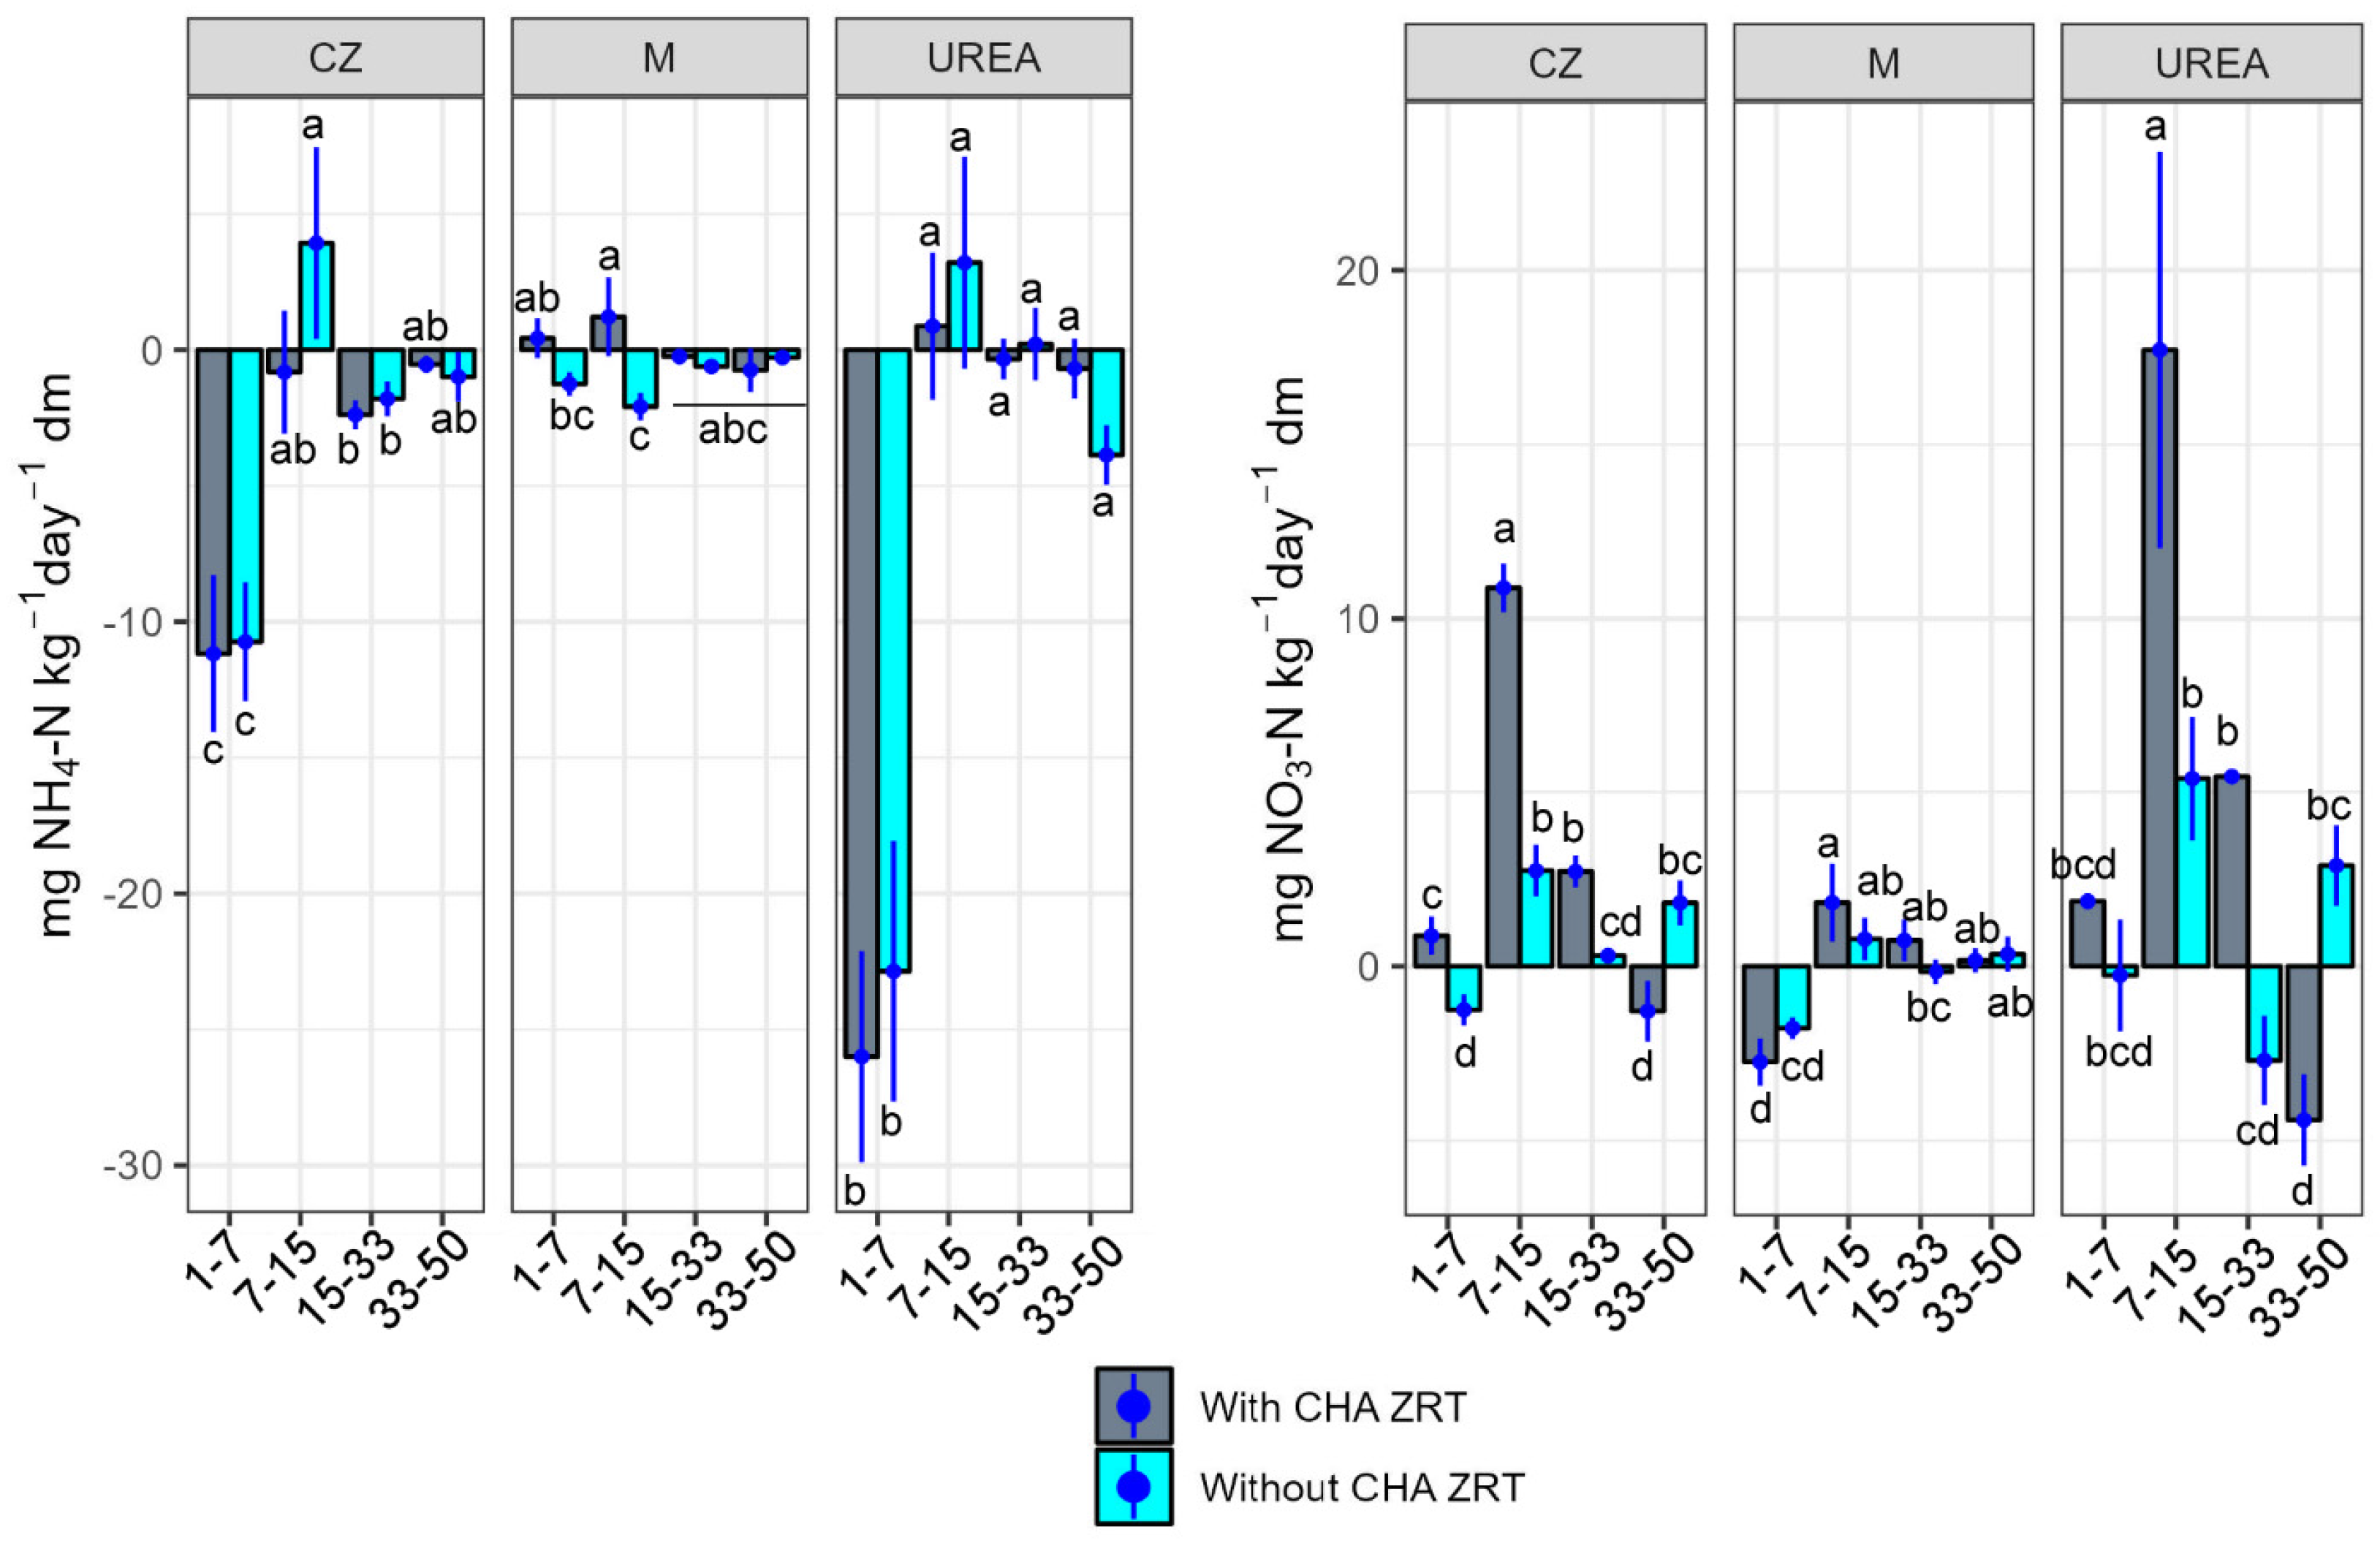
3.1. Effects of the Different N Sources

pH is recognized as a master variable that influences most of the biotic and abiotic processes in soil [2,43]. The addition of the N sources significantly increased the pH of the soil toward more neutral values in M and CZ treatments (Figure 1). The addition of urea instead led to an immediate shift towards alkaline values close to pH 8. In CZ and UREA treatments, this “liming” effect was only temporary because already from day 7, the pH values started to decrease towards the original soil pH (pH 5.27, Table 1). This trend was not observed for M, in which the pH remained stable around neutral values for the whole duration of the incubation.
The pH behaviour can be explained by several factors, including the differences in organic matter content of the various N sources, and/or the ions formed during the hydrolysis of the fertilizers and/or the dynamics of the N species. The M treatment received significantly higher inputs of organic material due to the addition of pelleted composted manure, which increased the pH to neutral values, acting as a buffer for the whole duration of the experiment. Similar results were obtained by [44] who observed an increase in soil pH to values close to 7 for 90 days after the addition of composted rice straw and chicken manure to acidic tropical soil (initial pH of 4.66). The organic matter added through the composted pelleted manure in M treatments is therefore responsible for the pH shift and the great capacity to maintain the pH unaltered (buffering capacity) during the incubation [45].
On the contrary in UREA treatment, the typical effect of urea hydrolysis was observed, leading to pH values up to 8 after the fertilizer application (Figure 1). Urea hydrolysis is catalyzed by urease enzymes and it is a fast process in soils which involves proton consumption and increases the soil pH significantly, augmenting the risk of N losses due to volatilization of ammonia (NH3 gas) [46,47,48]. A similar trend was also observed by [49] who reported a temporary amelioration of the soil acidity in soil from a tea plantation after the use of urea fertilizer.
CZ treatment showed an intermediate behaviour compared to M and UREA, with a moderate initial pH increase and a gradual return toward the initial soil pH values. Contrasting results are reported in the literature about the effects of zeolite addition on soil pH. To cite some examples, [50] observed no effects of clinoptilolite zeolite addition to acidic pasture and wetland soils while [37] observed a slight but significant alkalinization effect (from 5.27 to 5.66) 3 days after the addition of N-enriched chabazite in the same acidic sandy soil used in this study. No significant effect of clinoptilolite zeolite addition was reported by [51] while [52] observed a slight increase in soil pH after adding zeolites, from 4.69 to 4.92 and from 6.13 to 6.39 in the two different soils. Some authors explained this pH alkalinization both by the alkaline pH of the used zeolites (in some studies the clinoptilolite showed a pH > 8.0 in H2O) or by the adsorption of H+ from the soil solution which can lead to a temporary rise in soil pH.
M treatment also influenced the Cl and SO42− content of the soil that significantly increased among the incubation plausibly solubilized from the pelleted manure (Supplementary Material Figure S2).
Due to the different natures of the various N sources, the initial levels of organic and inorganic N were different among the treatments (Figure 2A–C, Supplementary Material Figure S3). CZ and UREA treatments showed high initial levels of NH4+-N, while M was characterized by low levels of inorganic N and higher Org-N concentrations. The EC of the soil (Figure 2D) was positively correlated with the NO3-N dynamics (Supplementary Material Figure S1, ρ = 0.87), with a marked increase in conductivity toward the mid-end of the incubation period. With the NO3 molecule being very mobile due to anionic repulsion from soil mineral particles and SOM, any increase in this pool due to mineralization processes would translate into an increase in the EC measured in soil water extracts. Evidence of mineralization processes can be observed by the dynamics of Org-N, NH4+-N, and NO3-N pools, especially in CZ and UREA treatments. At the set WFPS (65%), which is considered as a threshold between the relative prevalence of nitrification and denitrification processes [38], a significant net consumption of NH4+-N was observed in favour of a net production of NO3-N for all the N sources (Figure 3). The net increase in the NO3-N pool over time corroborates the quick return to the former acid pH of the soil due to the release of H+ ions during the two-step reaction of nitrification [53]. Consequently, the increased net NO3-N production contributes to the observed pH decrease in both UREA and CZ treatments. Conversely, the net nitrification observed in the M treatment was considerably lower compared to that in the UREA and CZ treatments, resulting in notably reduced H+ production. As a result, this contributed to preventing the pH decline observed in the other treatments.
In the UREA treatment, the overall NH4+-N consumption (calculated on a 50-day average) was significantly greater than in CZ and commensurate NO3-N production was not observed (Figure 4). As previously hypothesized, it is plausible that in the case of UREA treatment (without CHA ZRT as soil improver), part of the consumed NH4+-N was lost in the form of NH3 instead of being converted into NO3-N.
The estimated N losses can be attributed to two primary factors: Firstly, the initial shift in pH towards alkaline levels during the early stage of incubation (from 5.27 to approximately 8) may have promoted NH3 volatilization losses. Secondly, the relatively limited presence of cation exchangers in the sandy-loam soil might have provided less protection for NH4+ against NH3 volatilization [33].
Although no information is available on gross production and consumption and microbial N immobilization, these data suggest that the addition of N in the form of CZ in acid sandy loam soil is a valid alternative to urea fertilizer for reducing net NH4+-N consumption over time, which can be attributed to the reduced pH shift and increased protection of N against volatilization by the ion exchange properties of zeolite minerals [33].
Zeolites are known to slowly release the adsorbed molecules over time, acting as slow-release fertilizers [16,54]. Nevertheless, itis important to view this relative slow-release effect. Other studies have demonstrated that the majority of N absorbed by this particular chabazite is in a readily exchangeable form, easily accessible to soil microorganisms in the short term [34,37]. However, when examining the data gathered and considering recent studies on the same chabazite zeolite [13], the “slower” release effect becomes evident when compared to synthetic urea fertilizer or liquid slurry/digestates.
CZ application also provided great levels of exchangeable NH4+-N that served as a substrate for net NO3-N production in the long period but apparently was less prone to other transformation pathways, such as NH3 volatilization, which is known to be significantly reduced by zeolites [33,55,56]. This holds significant importance concerning plant nutrition and in providing more efficient alternatives to energy-demanding N-fertilizers for food production.
On the other hand, the pelleted manure showed the best effects in terms of liming effect and organic matter supply, but the mineralization of the Org-N pool was very slow under the experimental conditions (Figure 2), suggesting that a limited amount of inorganic N would be available for plant uptake in the considered period.

3.2. Effects of Natural CHA Zeolite Tuff as Soil Improver

A significant effect of zeolite addition as soil improver was observed in the soil fertilized with CZ and UREA, in which the pH decreased quicker than the unamended soil over time (Figure 1). Notwithstanding the alkaline pH of the natural CHA ZRT, its addition as soil improver in this acidic soil promoted a quicker return to the initial pH values. Several studies pointed out the “liming” effect of zeolites once added to the soil because of the alkaline pH of the zeolite itself and/or the adsorption of H+ ions which would decrease soil acidity [57,58].
In our opinion, natural zeolites played a pivotal role in the alteration of the abiotic properties of the soil which in turn has a major impact on soil N processes such as, for example, nitrification [59]. It is well known that hydrophilic natural zeolites can adsorb high amounts of water and release it reversibly at temperatures generally lower than 400 °C [26,60]. And we believe that an unintended discrepancy arose while regulating the WFPS levels. Despite accurately adding the required water to attain the 65% WFPS, it was not possible to regulate the portion of water absorbed by zeolite minerals, hence not filling soil pores. Consequently, we believe this resulted in “false” WFPS readings in the zeolite-amended soil, fostering more aerated conditions than intended. Lower WFPS tends to favour aerobic processes like nitrification, partially accounting for the increased net production of NO3-N observed during the incubation period in zeolite-amended soils.
This aspect should be considered in incubation studies involving substantial amounts of zeolite tuff in the soil.
Therefore, it is evident that in this case, the typical liming effect operated by zeolites was probably masked by the augmented nitrification observed in the soil treated with CHA ZRT at 10%, which promoted H+ release (Figure 3).
The net NH4+-N consumption observed in CZ perfectly mirrors the net NO3-N production and, notably, the same was observed also in the UREA treatment but only in the samples that received CHA ZRT as soil improver. The almost perfect balance between the net NH4+-N consumption and NO3-N production may suggest that other pathways of N losses, such as NH3 volatilization, were probably lesser pronounced and, therefore, that zeolite addition as soil improver promoted a more efficient long-term conversion of NH4+ into NO3. Although gaseous emissions were not measured in this study, the effects of various typologies of natural zeolites on NH3 emissions are well documented [33,37,56,61,62]. In a study in which the gross ammonification and nitrification rates were measured in the short term after the application of CHA ZRT, a mild reduction of NO3-N production was found [35]. However, in that study, the N transformation rates were calculated after a few days from the zeolite addition, while in this study the experiment lasted 50 days. If we consider net nitrification occurred between days 1 and 7 (Figure 4), the net NO3-N production was significantly lower compared to the global average calculated on 50 days and with no striking differences due to the presence/absence of natural CHA ZRT as soil improver.
The effects of zeolite addition as soil improver on net nitrification were more evident, especially on days 7–15, when net NO3-N production rates were higher. A slight delay between net NH4+-N consumption and net NO3-N production is also visible (Figure 4). NH4+ decreased predominantly during the first week of incubation, while NO3-N started to accumulate from the second week of incubation. A similar delay in NO3-N production was also observed by [63], who found a maximum net nitrification rate after 7 days of incubation in urea-fertilized soil. An increase in net nitrification rates on days 7–15 was also accounted for in the M treatment, which indicates that CHA ZRT also slightly promoted N mineralization in this treatment and can represent a way to improve the nutrient availability when using this kind of N source.
Another aspect to discuss is the weight loss occurred at 550 °C which is commonly used as a proxy of SOM content [64]. In this experiment, a significant positive effect on SOM was encountered in all the samples which received 10% CHA ZRT as soil amendment (Supplementary Material Figure S4). From these data, it seems that the addition of natural CHA ZRT may have a beneficial effect on SOM; however, it is unrealistic because natural zeolites do not contribute to any fresh SOM input to soil. Moreover, the eventual SOM increase should be the result of long-term beneficial effects on various soil parameters which occur in the build-up and accumulation of SOM. It is more likely that the structural water of zeolite minerals influenced SOM measurements. Chabazite zeolite is known to release water at temperatures that are also higher than 105 °C (the temperature at which the soil water content is commonly measured) and up to 250 °C [26,31,65], partially overlapping with the weight loss that occurs in SOM determination. Therefore, we hypothesize that the SOM content of samples containing 10% of CHA ZRT was overestimated because part of the weight loss observed was probably due to dehydration of chabazite at temperatures higher than 105 °C and not to SOM oxidation. As suggested by [64], a correction factor should always be used to account for clay minerals’ structural water, but similarly, we suggest that in zeolite-amended soil, ad hoc correction factors should also be established to avoid errors in SOM values.

4. Conclusions

In this work, the N dynamics in a sandy-loam acid soil following the combined application of different N sources and chabazite zeolite tuff as soil improver have been evaluated.
The application of composted pelleted manure raised the soil pH from acidic to neutral values, maintaining pH neutrality for 50 days after fertilization thanks to the high organic matter content and the low stimulation of mineralization processes. However, this also translated into a lower short-term nutrient supply for crop growth if compared to the other tested N sources.
Urea fertilizer induced a strong pH shift towards alkaline values after the application that was likely responsible for N losses (most likely as NH3 volatilization) as testified by the significantly higher net NH4+ consumption, not counterbalanced by net NO3 production. On the other hand, N-enriched chabazite zeolite represented the more balanced N source, with a more equilibrated net NH4+ consumption and NO3 production and a moderate pH shift after the application which probably prevented excessive N losses and a more balanced nutrient release.
Under these experimental conditions, the addition of 10% of chabazite zeolite tuff as soil improver favoured net nitrification rates. This can be attributed to the augmented soil aeration because of pore water adsorption by zeolite minerals which may have decreased soil WFPS and hence favoured nitrification processes. The augmented nitrification in turn affected soil pH by speeding up the return to the original acidic pH of the soil and decreasing the pH amelioration potential of this material.
In conclusion, N-charged chabazite zeolite tuff also acted as a valuable N source in acidic sandy-loam soil, representing a valid alternative to synthetic fertilizers and a great way to recycle N from livestock wastewaters with reduced N losses and a good capacity in supplying nutrients for crop nutrition.
Future studies should focus more on the effects on plants and how plants influence the N dynamics in a zeolite-amended soil, as well as on the determination of specific correction factors to account for water sorption and structural water loss by zeolite minerals when calculating the WFPS and SOM in amended soils.

Supplementary Materials

The following supporting information can be downloaded at: https://www.mdpi.com/article/10.3390/soilsystems8010016/s1, Figure S1: Correlation matrix; Figure S2: Dynamics of chloride and sulphate in soil water extracts during the experimental incubation; Figure S3: Dynamics of soil total N (TN) during the incubation. Figure S4: Soil organic matter content of the soil samples measured after calcination at 550 °C.

Author Contributions

Conceptualization, G.F. and M.A.; data curation, G.F.; funding acquisition, G.F.; investigation, M.A. and V.M.; methodology, G.F. and M.A.; supervision, M.C.; validation, M.A. and G.G.; writing—original draft, G.F.; writing—review and editing, G.F., G.G., B.F., S.B. and M.C. All authors have read and agreed to the published version of the manuscript.

Funding

This research was conducted within the framework of project 09-G-48651-5 CUP F71B21005820007 “Uso dei geomateriali innovativi per un’agricoltura sostenibile: impatto dei processi biotici e abiotici sul ciclo dell’Azoto e applicazioni per il trattamento di acque grigie e reflui zootecnici” and research contract R/FERTALIS/FERGI/02/21–R/D/A542/02/21.

Institutional Review Board Statement

Not applicable.

Informed Consent Statement

Not applicable.

Data Availability Statement

All the data relevant to this study are published in this manuscript.

Acknowledgments

We are gratefully thankful to Giancone Gioacchino for the pelleted manure furniture. We gratefully thank the “Regenerativhof Grötschl” farm and Franz Grötschl, Katharina Keiblinger and Axel Mentler for the agricultural soil furniture and for helping with soil sampling.

Conflicts of Interest

The authors declare no conflict of interest.

Appendix A

Table A1. Complete dataset about the treatment CZ (soil fertilized with N-enriched chabazite tuff). Standard deviation within brackets. Different letters indicate significant differences (p < 0.05) between the treatments. CHA ZRT is the zeolite tuff at natural state.
ParameterUnits10% CHA-ZRTN SOURCE: CZ
PresenceSampling Day
17153350
pH No6.36a 5.94b5.64c5.47c4.84de
(0.12)(0.05)(0.09)(0.20)(0.09)
Yes6.45a5.62c5.13d4.77e4.64e
(0.10)(0.12)(0.06)(0.04)(0.02)
ECmS cm−1No0.38d0.43d0.48d0.50d0.85c
(0.03)(0.03)(0.06)(0.05)(0.10)
Yes0.40d0.85c1.15bc1.40ab1.55a
(0.05)(0.22)(0.10)(0.05)(0.20)
NH4+-Nmg kg−1No241a166cd197bc165cd148de
(11)(26)(18)(11)(4)
Yes235ab157cd151d108ef98.6f
(17)(21)(10)(4)(2.8)
NO3-Nmg kg−1No21.1fg 12.3g34.3ef39.8e70.8d
(2.5)(0.6)(5.3)(4.7)(9.4)
Yes23.6efg29.8efg117c166a144b
(0.9)(4.6)(8)(3)(12)
Org-Nmg kg−1No831a925a882a895a811a
(13)(13)(39)(47)(104)
Yes841a913a803a817a824a
(102)(57)(71)(35)(127)
TNmg kg−1No1093a1103a1113a1100a1030a
(6)(15)(21)(40)(113)
Yes1100a1100a1070a1090a1067a
(87)(78)(76)(35)(132)
Clmg kg−1No16.7bc28.4abc27.8abc15.0c14.3c
(2.9)(6.5)(7.4)(1.1)(1.8)
Yes19.8abc 33.8ab34.9a17.3abc16.5bc
(1.3)(14.3)(7.2)(1.5)(1.1)
SO42−mg kg−1No9.40d15.3c19.5bc22.8bc19.5bc
(0.81)(1.0)(0.9)(2.7)(1.4)
Yes8.98d20.4b23.5ab25.5a23.9ab
(0.20)(1.5)(2.2)(1.9)(2.3)
Table A2. Complete dataset about the treatment M (soil fertilized with composted pelleted manure). Standard deviation within brackets. Different letters indicate significant differences (p < 0.05) between the treatments. CHA ZRT is the zeolite tuff at natural state.
ParameterUnits10% CHA-ZRTN SOURCE: M
PresenceSampling Day
17153350
pH No7.08abc7.36a7.12ab6.78c6.83bc
(0.12)(0.18)(0.21)(0.03)(0.04)
Yes6.92bc7.33a7.01bc6.88bc6.80c
(0.05)(0.06)(0.09)(0.04)(0.08)
ECmS cm−1No0.72b0.77b0.90ab0.78b0.73b
(0.03)(0.15)(0.10)(0.03)(0.14)
Yes0.77b0.83b1.02ab1.17a1.00ab
(0.18)(0.13)(0.10)(0.06)(0.09)
NH4+-Nmg kg−1No43.0a34.2ab17.5bcd6.49cd1.74d
(2.0)(1.1)(4.1)(2.61)(0.75)
Yes7.56cd10.6cd20.2bc15.9cd3.21d
(3.83)(1.9)(9.8)(13.9)(0.56)
NO3-Nmg kg−1No13.1cde0.73e7.00de4.24de10.1cde
(2.4)(0.18)(4.79)(1.59)(8.6)
Yes22.4abc3.17de17.8bcd31.2ab34.0a
(3.7)(1.79)(10.5)(5.5)(4.2)
Org-Nmg kg−1No1173a1082a1168a1079a1038a
(134)(86)(154)(45)(76)
Yes1180a1033a1021a1006a989a
(16)(61)(65)(116)(23)
TNmg kg−1No1230a1117a1193a1090a1050a
(135)(85)(150)(44)(75)
Yes1210a1047a1060a1053a1027a
(10)(59)(66)(110)(23)
Clmg kg−1No65.3ab70.7ab74.7ab82.4a53.0b
(15.4)(8.6)(15.4)(3.5)(11.1)
Yes73.7ab67.3ab78.2ab69.8ab56.2ab
(12.2)(6.6)(2.0)(3.3)(6.7)
SO42−mg kg−1No44.4d119c172abc40.2d135bc
(0.7)(12)(52)(3.3)(17)
Yes35.7d113c188ab224a136bc
(4.5)(21)(13)(15)(21)
Table A3. Complete dataset about the treatment U (soil fertilized with urea). Standard deviation within brackets. Different letters indicate significant differences (p < 0.05) between the treatments. CHA ZRT is the zeolite tuff at natural state.
ParameterUnits10% CHA-ZRTN SOURCE: U
PresenceSampling Day
17153350
pH No7.99a6.72bc6.01cde6.46cd5.59defg
(0.06)(0.61)(0.32)(0.11)(0.44)
Yes7.60ab5.81cdef5.22efg4.95fg4.85g
(0.23)(0.13)(0.39)(0.24)(0.23)
ECmS cm−1No0.58b0.55b0.70b0.52b0.75b
(0.19)(0.31)(0.18)(0.16)(0.09)
Yes0.88b0.92b1.55a2.15a1.92a
(0.28)(0.03)(0.31)(0.26)(0.18)
NH4+-Nmg kg−1No287a127cd152bc156cd90.3bc
(38)(17)(40)(30)(22.4)
Yes273a90.5cd97.5d91.4ef79.6c
(33)(6.4)(22.5)(20.2)(7.5)
NO3-Nmg kg−1No17.2c15.4c58.5c9.89c59.0c
(2.8)(13.0)(27.1)(4.09)(15.5)
Yes26.8c39.8c182b279a205b
(1.2)(2.3)(47)(44)(25)
Org-Nmg kg−1No1086a938ab839bc966ab836bc
(51)(57)(28)(115)(48)
Yes997ab883bc758c722c769c
(66)(24)(42)(12)(51)
TNmg kg−1No1390a1080c1050c1133bc987c
(75)(61)(40)(127)(42)
Yes1297ab1013c1037c1093c1053c
(95)(31)(21)(29)(68)
Clmg kg−1No15.6b22.4ab21.7ab16.2b12.0b
(2.7)(3.1)(4.2)(4.0)(2.2)
Yes24.4ab22.9ab37.9a16.0b14.7b
(16.3)(3.8)(8.7)(2.3)(2.1)
SO42−mg kg−1No8.14ef12.3de14.3bcd4.81f18.3bc
(0.29)(1.1)(1.3)(0.74)(2.6)
Yes9.49e14.1cd18.5ab22.6a18.1bc
(2.67)(0.4)(1.5)(1.2)(0.9)

References

  1. Gobinath, R.; Ganapathy, G.P.; Gayathiri, E.; Salunkhe, A.A.; Pourghasemi, H.R. Ecoengineering practices for soil degradation protection of vulnerable hill slopes. In Computers in Earth and Environmental Sciences; Elsevier: Amsterdam, The Netherlands, 2022; pp. 255–270. [Google Scholar] [CrossRef]
  2. Daniels, W.L. The Nature and Properties of Soils, 15th Edition Ray R. Weil and Nyle C. Brady. Pearson Press, Upper Saddle River NJ, 2017. 1086 p. $164.80. ISBN-10: 0-13-325448-8; ISBN-13: 978-0-13-325448-8. Also available as eText for $67.99. Soil Sci. Soc. Am. J. 2016, 80, 1428. [Google Scholar] [CrossRef]
  3. Maximillian, J.; Brusseau, M.L.; Glenn, E.P.; Matthias, A.D. Pollution and Environmental Perturbations in the Global System. In Environmental and Pollution Science; Academic Press: London, UK, 2019. [Google Scholar]
  4. Verma, S.; Sharma, P.K. Effect of long-term manuring and fertilizers on carbon pools, soil structure, and sustainability under different cropping systems in wet-temperate zone of northwest Himalayas. Biol. Fertil. Soils 2007, 44, 235–240. [Google Scholar] [CrossRef]
  5. Chen, R.; Senbayram, M.; Blagodatsky, S.; Myachina, O.; Dittert, K.; Lin, X.; Blagodatskaya, E.; Kuzyakov, Y. Soil C and N availability determine the priming effect: Microbial N mining and stoichiometric decomposition theories. Glob. Chang. Biol. 2014, 20, 2356–2367. [Google Scholar] [CrossRef]
  6. Dodds, W.K.; Smith, V.H. Nitrogen, phosphorus, and eutrophication in streams. Inl. Waters 2016, 6, 155–164. [Google Scholar] [CrossRef]
  7. Bijay-Singh; Craswell, E. Fertilizers and nitrate pollution of surface and ground water: An increasingly pervasive global problem. SN Appl. Sci. 2021, 3, 518. [Google Scholar] [CrossRef]
  8. Dawson, C.J.; Hilton, J. Fertiliser availability in a resource-limited world: Production and recycling of nitrogen and phosphorus. Food Policy 2011, 36, S14–S22. [Google Scholar] [CrossRef]
  9. Pankievicz, V.C.S.; Irving, T.B.; Maia, L.G.S.; Ané, J.-M. Are we there yet? The long walk towards the development of efficient symbiotic associations between nitrogen-fixing bacteria and non-leguminous crops. BMC Biol. 2019, 17, 99. [Google Scholar] [CrossRef]
  10. Boaretto, R.M.; Mattos, D.; Quaggio, J.A.; Cantarella, H.; Trivelin, P.C.O. Absorption of 15NH3 volatilized from urea by Citrus trees. Plant Soil 2013, 365, 283–290. [Google Scholar] [CrossRef]
  11. Soares, J.R.; Cantarella, H.; Menegale, M.L.d.C. Ammonia volatilization losses from surface-applied urea with urease and nitrification inhibitors. Soil Biol. Biochem. 2012, 52, 82–89. [Google Scholar] [CrossRef]
  12. Cantarella, H.; Mattos, D.; Quaggio, J.A.; Rigolin, A.T. Fruit yield of Valencia sweet orange fertilized with different N sources and the loss of applied N. Nutr. Cycl. Agroecosystems 2003, 67, 215–223. [Google Scholar] [CrossRef]
  13. Ferretti, G.; Galamini, G.; Medoro, V.; Faccini, B. Amount and speciation of N leached from a sandy soil fertilized with urea, liquid digestate, struvite and NH4 -enriched chabazite zeolite-tuff. Soil Use Manag. 2022, 39, 456–473. [Google Scholar] [CrossRef]
  14. Al-Zahrani, S.M. Controlled-release of fertilizers: Modelling and simulation. Int. J. Eng. Sci. 1999, 37, 1299–1307. [Google Scholar] [CrossRef]
  15. Keiblinger, K.M.; Kral, R.M. Sustainable intensification of agricultural production: A review of four soil amendments. Bodenkultur 2018, 69, 141–153. [Google Scholar] [CrossRef]
  16. Ming, D.W.; Allen, E.R. Use of natural zeolites in agronomy, horticulture, and environmental soil remediation. Rev. Mineral. Geochem. 2001, 45, 618–654. [Google Scholar] [CrossRef]
  17. Di Giuseppe, D.; Ferretti, G.; Faccini, B.; Blasi, E.; Passeri, N.; Bianchini, G.; Coltorti, M. Is it possible to cultivate corn in a sustainable way using a quarry waste? Period. Mineral. 2016, 85, 179–183. [Google Scholar] [CrossRef]
  18. Azarpour, E.; Motamed, M.K.; Moraditochaee, M.; Bozorgi, H.R. Effects of zeolite application and nitrogen fertilization on yield components of Cowpea (Vigna unguiculata L.). World Appl. Sci. J. 2011, 14, 687–692. [Google Scholar]
  19. Nakhli, S.A.A.; Delkash, M.; Bakhshayesh, B.E.; Kazemian, H. Application of Zeolites for Sustainable Agriculture: A Review on Water and Nutrient Retention. Water Air Soil Pollut. 2017, 228, 464. [Google Scholar] [CrossRef]
  20. Ferretti, G.; Galamini, G.; Medoro, V.; Coltorti, M.; Di Giuseppe, D.; Faccini, B. Impact of sequential treatments with natural and na-exchanged chabazite zeolite-rich tuff on pig-slurry chemical composition. Water 2020, 12, 310. [Google Scholar] [CrossRef]
  21. Delkash, M.; Bakhshayesh, B.E.; Kazemian, H. Using zeolitic adsorbents to cleanup special wastewater streams: A review. Microporous Mesoporous Mater. 2015, 214, 224–241. [Google Scholar] [CrossRef]
  22. Dwairi, I.M. Evaluation of jordanian zeolite tuff as a controlled slow-release fertilizer for NH4+. Environ. Geol. 1998, 34, 1–4. [Google Scholar] [CrossRef]
  23. Ferretti, G.; Di Giuseppe, D.; Faccini, B.; Coltorti, M. Mitigation of sodium risk in a sandy agricultural soil by the use of natural zeolites. Environ. Monit. Assess. 2018, 190, 646. [Google Scholar] [CrossRef]
  24. Innovative Biological Technologies for Lesser Developed Countries—Workshop Proceedings (Washington, DC: U.S. Congress, Office of Technology Assessment, OTA13P-F-29, July 1985). Available online: https://ota.fas.org/reports/8512.pdf (accessed on 10 January 2024).
  25. Passaglia, E. Zeoliti Naturali, Zeolititi e Loro Applicazioni; Arvan: Mira, Italy, 2008; ISBN 9788887801194. [Google Scholar]
  26. Coombs, D.S.; Alberti, A.; Armbruster, T.; Artioli, G.; Colella, C.; Galli, E.; Grice, J.D.; Liebau, F.; Mandarino, J.A.; Minato, H.; et al. Recommended nomenclature for zeolite minerals: Report of the subcommittee on zeolites of the International Mineralogical Association, Commission on new Minerals and Mineral names. Can. Mineral. 1997, 35, 1571–1606. [Google Scholar] [CrossRef]
  27. Moshoeshoe, M.; Nadiye-Tabbiruka, M.S.; Obuseng, V. A Review of the Chemistry, Structure, Properties and Applications of Zeolites. Am. J. Mater. Sci. 2017, 7, 196–221. [Google Scholar] [CrossRef]
  28. Galli, E.; Passaglia, E. Natural zeolites in environmental engineering. In Zeolites in Chemical Engineering; Holzapfel, H., Ed.; Verlag ProcessEng Engineering GmbH: Wien, Austria, 2011; pp. 392–416. [Google Scholar]
  29. Mumpton, F.A. La roca magica: Uses of natural zeolites in agriculture and industry. Proc. Natl. Acad. Sci. USA 1999, 96, 3463–3470. [Google Scholar] [CrossRef] [PubMed]
  30. Ouki, S.K.; Kavannagh, M. Performance of natural zeolites for the treatment of mixed metal-contaminated effluents. Waste Manag. Res. 1997, 15, 383–394. [Google Scholar] [CrossRef]
  31. Gualtieri, A.F.; Passaglia, E. Rietveld structure refinement of NH4-exchanged natural chabazite. Eur. J. Mineral. 2006, 18, 351–359. [Google Scholar] [CrossRef]
  32. Galamini, G.; Ferretti, G.; Medoro, V.; Tescaro, N.; Faccini, B.; Coltorti, M. Isotherms, Kinetics, and Thermodynamics of NH4+ Adsorption in Raw Liquid Manure by Using Natural Chabazite Zeolite-Rich Tuff. Water 2020, 12, 2944. [Google Scholar] [CrossRef]
  33. Ferretti, G.; Keiblinger, K.M.; Zimmermann, M.; Di Giuseppe, D.; Faccini, B.; Colombani, N.; Mentler, A.; Zechmeister-Boltenstern, S.; Coltorti, M.; Mastrocicco, M. High resolution short-term investigation of soil CO2, N2O, NOx and NH3 emissions after different chabazite zeolite amendments. Appl. Soil Ecol. 2017, 119, 138–144. [Google Scholar] [CrossRef]
  34. Ferretti, G.; Keiblinger, K.M.; Di Giuseppe, D.; Faccini, B.; Colombani, N.; Zechmeister-Boltenstern, S.; Coltorti, M.; Mastrocicco, M. Short-Term Response of Soil Microbial Biomass to Different Chabazite Zeolite Amendments. Pedosphere 2018, 28, 277–287. [Google Scholar] [CrossRef]
  35. Ferretti, G.; Galamini, G.; Deltedesco, E.; Gorfer, M.; Fritz, J.; Faccini, B.; Mentler, A.; Zechmeister-Boltenstern, S.; Coltorti, M.; Keiblinger, K.M. Gross Ammonification and Nitrification Rates in Soil Amended with Natural and NH4-Enriched Chabazite Zeolite and Nitrification Inhibitor DMPP. Appl. Sci. 2021, 11, 2605. [Google Scholar] [CrossRef]
  36. Ferretti, G.; Faccini, B.; Antisari, L.V.; Di Giuseppe, D.; Coltorti, M. 15N natural abundance, nitrogen and carbon pools in soil-sorghum system amended with natural and NH4+-enriched zeolitites. Appl. Sci. 2019, 9, 4524. [Google Scholar] [CrossRef]
  37. Galamini, G.; Ferretti, G.; Rosinger, C.; Huber, S.; Medoro, V.; Mentler, A.; Diaz-Pines, E.; Gorfer, M.; Faccini, B.; Keiblinger, K.M. Recycling nitrogen from liquid digestate via novel reactive struvite and zeolite minerals to mitigate agricultural pollution. Chemosphere 2023, 317, 137881. [Google Scholar] [CrossRef]
  38. Bateman, E.J.; Baggs, E.M. Contributions of nitrification and denitrification to N2O emissions from soils at different water-filled pore space. Biol. Fertil. Soils 2005, 41, 379–388. [Google Scholar] [CrossRef]
  39. Salehi, M.H.; Beni, O.H.; Harchegani, H.B.; Borujeni, I.E.; Motaghian, H.R. Refining Soil Organic Matter Determination by Loss-on-Ignition. Pedosphere 2011, 21, 473–482. [Google Scholar] [CrossRef]
  40. Zhang, Q.; Song, Y.; Wu, Z.; Yan, X.; Gunina, A.; Kuzyakov, Y.; Xiong, Z. Effects of six-year biochar amendment on soil aggregation, crop growth, and nitrogen and phosphorus use efficiencies in a rice-wheat rotation. J. Clean. Prod. 2020, 242, 118435. [Google Scholar] [CrossRef]
  41. De Mendiburu, F. Agricolae: Statistical Procedures for Agricultural Research. R Package Version 1.2-0. 2014. Available online: http://CRAN.R-project.org/package=agricolae (accessed on 10 January 2024).
  42. Ginestet, C. ggplot2: Elegant Graphics for Data Analysis. J. R. Stat. Soc. Ser. A Stat. Soc. 2011, 174, 245–246. [Google Scholar] [CrossRef]
  43. Oshunsanya, S. (Ed.) Soil pH for Nutrient Availability and Crop Performance; IntechOpen: London, UK, 2019; ISBN 978-1-78985-015-4. [Google Scholar]
  44. Latifah, O.; Ahmed, O.H.; Majid, N.M.A. Soil pH Buffering Capacity and Nitrogen Availability Following Compost Application in a Tropical Acid Soil. Compost Sci. Util. 2018, 26, 1–15. [Google Scholar] [CrossRef]
  45. García-Gil, J.C.; Ceppi, S.B.; Velasco, M.I.; Polo, A.; Senesi, N. Long-term effects of amendment with municipal solid waste compost on the elemental and acidic functional group composition and pH-buffer capacity of soil humic acids. Geoderma 2004, 121, 135–142. [Google Scholar] [CrossRef]
  46. Terman, G.L. Volatilization Losses of Nitrogen as Ammonia from Surface-Applied Fertilizers, Organic Amendments, and Crop Residues. Adv. Agron. 1980, 31, 189–223. [Google Scholar] [CrossRef]
  47. Ernst, J.W.; Massey, H.F. The Effects of Several Factors on Volatilization of Ammonia Formed from Urea in the Soil. Soil Sci. Soc. Am. J. 1960, 24, 87–90. [Google Scholar] [CrossRef]
  48. Cantarella, H.; Otto, R.; Soares, J.R.; de Brito Silva, A.G. Agronomic efficiency of NBPT as a urease inhibitor: A review. J. Adv. Res. 2018, 13, 19–27. [Google Scholar] [CrossRef]
  49. Wang, J.; Tu, X.; Zhang, H.; Cui, J.; Ni, K.; Chen, J.; Cheng, Y.; Zhang, J.; Chang, S.X. Effects of ammonium-based nitrogen addition on soil nitrification and nitrogen gas emissions depend on fertilizer-induced changes in pH in a tea plantation soil. Sci. Total Environ. 2020, 747, 141340. [Google Scholar] [CrossRef]
  50. Zaman, M.; Nguyen, M.L.; Matheson, F.; Blennerhassett, J.D.; Quin, B.F. Can soil amendments (zeolite or lime) shift the balance between nitrous oxide and dinitrogen emissions from pasture and wetland soils receiving urine or urea-N? Aust. J. Soil Res. 2007, 45, 543–553. [Google Scholar] [CrossRef]
  51. Ghorbani, M.; Amirahmadi, E.; Konvalina, P.; Moudrý, J.; Bárta, J.; Kopecký, M.; Teodorescu, R.I.; Bucur, R.D. Comparative Influence of Biochar and Zeolite on Soil Hydrological Indices and Growth Characteristics of Corn (Zea mays L.). Water 2022, 14, 3506. [Google Scholar] [CrossRef]
  52. Tsadilas, C.D.; Dimoyiannis, D.; Samaras, V. Effect of zeolite application and soil pH on cadmium sorption in soils. Commun. Soil Sci. Plant Anal. 1997, 28, 1591–1602. [Google Scholar] [CrossRef]
  53. De Boer, W.; Kowalchuk, G.A. Nitrification in acid soils: Micro-organisms and mechanisms. Soil Biol. Biochem. 2001, 33, 853–866. [Google Scholar] [CrossRef]
  54. Li, Z.; Zhang, Y.; Li, Y. Zeolite as slow release fertilizer on spinach yields and quality in a greenhouse test. J. Plant Nutr. 2013, 36, 1496–1505. [Google Scholar] [CrossRef]
  55. Cataldo, E.; Salvi, L.; Paoli, F.; Fucile, M.; Masciandaro, G.; Manzi, D.; Masini, C.M.; Mattii, G.B. Application of Zeolites in Agriculture and Other Potential Uses: A Review. Agronomy 2021, 11, 1547. [Google Scholar] [CrossRef]
  56. De Campos Bernardi, A.C.; Oliviera, P.P.A.; De Melo Monte, M.B.; Souza-Barros, F. Brazilian sedimentary zeolite use in agriculture. Microporous Mesoporous Mater. 2013, 167, 16–21. [Google Scholar] [CrossRef]
  57. Ramesh, V.; Jyothi, J.S.; Shibli, S.M.A. Effect of zeolites on soil quality, plant growth and nutrient uptake efficiency in sweet potato (Ipomoea batatas L.). J. Root Crops 2015, 41, 25–31. [Google Scholar]
  58. Ravali, C.; Rao, J.K.; Anjaiah, T.; Suresh, K. Effect of zeolite on soil physical and physico-chemical properties. J. Sci. Agric. Eng. 2020, 10, 776–781. [Google Scholar]
  59. Norton, J.M. Nitrification in Agricultural Soils. In Nitrogen in Agricultural Systems; Wiley: Hoboken, New Jersey, USA, 2015; pp. 173–199. ISBN 9780891181910. [Google Scholar]
  60. Król, M. Natural vs. Synthetic Zeolites. Crystals 2020, 10, 622. [Google Scholar] [CrossRef]
  61. Bundan, L.; Majid, N.M.A.; Ahmed, O.H.; Jiwan, M.; Kundat, F.R. Ammonia volatilization from urea at different levels of zeolite. Int. J. Phys. Sci. 2011, 6, 7717–7720. [Google Scholar] [CrossRef]
  62. Ahmed, O.H.; Yap, C.H.B.; Muhamad, A.M.N. Minimizing ammonia loss from urea through mixing with zeolite and acid sulphate soil. Int. J. Phys. Sci. 2010, 5, 2198–2202. [Google Scholar]
  63. Bi, Q.-F.; Chen, Q.-H.; Yang, X.-R.; Li, H.; Zheng, B.-X.; Zhou, W.-W.; Liu, X.-X.; Dai, P.-B.; Li, K.-J.; Lin, X.-Y. Effects of combined application of nitrogen fertilizer and biochar on the nitrification and ammonia oxidizers in an intensive vegetable soil. AMB Express 2017, 7, 198. [Google Scholar] [CrossRef]
  64. Hoogsteen, M.J.J.; Lantinga, E.A.; Bakker, E.J.; Groot, J.C.J.; Tittonell, P.A. Estimating soil organic carbon through loss on ignition: Effects of ignition conditions and structural water loss. Eur. J. Soil Sci. 2015, 66, 320–328. [Google Scholar] [CrossRef]
  65. Nakatsuka, A.; Kawata, N.; Fujiwara, K. Dehydration behavior of a natural hydrated Ca-chabazite studied by in-situ high-temperature single-crystal X-ray diffraction. Microporous Mesoporous Mater. 2020, 311, 110648. [Google Scholar] [CrossRef]
Figure 1. Dynamics of soil pH during the incubation. Treatments with and without CHA ZRT addition as soil improver are shown by grey and cyan dots, respectively. Blue lines indicate standard deviation (3 replicates). Different letters (in red) refer to significant differences between the N sources (N-enriched chabazite “CZ”, manure “M”, and urea fertilizer “UREA”). The general results of the 2-way ANOVA are shown in terms of p-value inside each box (additional details are reported in Appendix A Table A1, Table A2 and Table A3).
Soilsystems 08 00016 g001
Figure 2. Dynamics of soil N species (graphs (AC)) and electrical conductivity (EC, graph (D)). Blue lines indicate standard deviation (3 replicates). Different letters (in red) refer to significant differences between the N sources (N-enriched chabazite “CZ”, manure “M”, and urea fertilizer “UREA”). The general results of the 2-way ANOVA are shown in terms of p-value inside each box (additional details are reported in Appendix A Table A1, Table A2 and Table A3).
Soilsystems 08 00016 g002
Figure 3. Net ammonification and nitrification rates in soil fertilized with N-enriched chabazite zeolite tuff (CZ), pelleted composted manure (M), and UREA. Bar filling indicates the presence (grey)/absence (cyan) of natural chabazite zeolite tuff in the soil. Blue lines indicate standard deviation (3 replicates). Different letters indicate significant differences (p < 0.05) between the treatments.
Soilsystems 08 00016 g003
Figure 4. Net ammonification (left) and nitrification (right) rates in soil fertilized with N-enriched chabazite zeolite tuff (CZ), pelleted composted manure (M), and UREA calculated between days 1–7, 7–15, 15–33, and 33–50 of incubation. Bar filling indicates the presence (grey) or absence (cyan) of natural CHA zeolite tuff in the soil. Blue lines indicate standard deviation. Different letters indicate significant differences within each N source (p < 0.05).
Soilsystems 08 00016 g004
Table 1. Main physico-chemical properties of the soil used in the experiments. PSD = particle size distribution (Udden-Wentworth); CEC = cation exchange capacity; EC = electrical conductivity. Values are displayed as mean ± SD. Data from [37].
PSDDiameter (µm)Weight %CEC(mEq/kg)
Very coarse sand2000–10009.50 ± 0.41Na+0.35 ± 0.03
Coarse sand1000–63010.4 ± 1.6Mg2+9.56 ± 0.42
Medium sand630–20020.0 ± 1.6K+4.6 ± 0.02
Fine sand200–6316.5 ± 0.1Ca2+23.3 ± 0.90
Coarse silt63–2024.8 ± 0.0
Silt20–29.28 ± 1.00
Clay<29.50 ± 0.60Total CEC37.9 ± 1.40
pH5.27 ± 0.03
EC (mS/cm)0.59 ± 0.07
Total N (g/kg)1.17 ± 0.07
Organic C (g/kg)8.77 ± 0.25
Table 2. Concentration of total N (TN), NH4+-N and total C (TC) of the employed N sources. NO3 were not detected. M is pelleted composted manure, UREA is urea fertilizer, and CZ in N-enriched chabazite-tuff.
N SourcesTN (g/kg)NH4+-N (g/kg)TC (g/kg)
M38.30.207305
UREA460 */200
CZ6.024.021.70 ¥
* Data calculated from molecular formula.
Disclaimer/Publisher’s Note: The statements, opinions and data contained in all publications are solely those of the individual author(s) and contributor(s) and not of MDPI and/or the editor(s). MDPI and/or the editor(s) disclaim responsibility for any injury to people or property resulting from any ideas, methods, instructions or products referred to in the content.

