Article

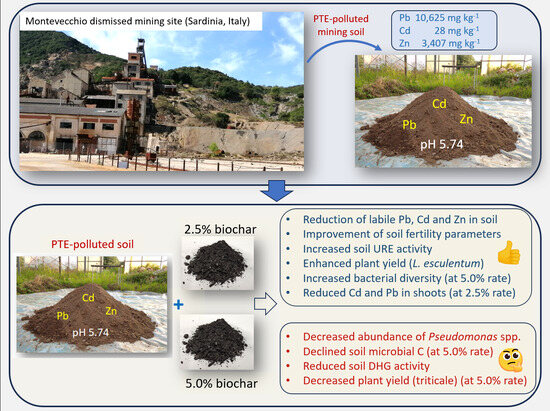
Sustainable Restoration of Soil Functionality in PTE-Affected Environments: Biochar Impact on Soil Chemistry, Microbiology, Biochemistry, and Plant Growth

1
Department of Agriculture, University of Sassari, Viale Italia 39, 07100 Sassari, Italy
2
Desertification Research Centre, University of Sassari, 07100 Sassari, Italy
3
Department of Biochemistry and Biotechnology, University of Thessaly, Viopolis, 41500 Larissa, Greece
*
Author to whom correspondence should be addressed.
Soil Syst. 2023, 7(4), 96; https://doi.org/10.3390/soilsystems7040096
Submission received: 30 August 2023 / Revised: 23 October 2023 / Accepted: 25 October 2023 / Published: 26 October 2023
(This article belongs to the Special Issue Soil Pollution: Monitoring, Risk Assessment and Remediation)

Abstract

:
Biochar can be useful for the functional recovery of soils contaminated with potentially toxic elements (PTEs), even if its effectiveness is variable and sometimes limited, and conflicting results have been recently reported. To shed some light on this regard, softwood-derived biochar was added at 2.5 (2.5-Bio) and 5.0% w/w (5.0-Bio) rates to an acidic (pH 5.74) soil contaminated by Cd (28 mg kg−1), Pb (10,625 mg kg−1), and Zn (3407 mg kg−1). Biochar addition increased soil pH, available P and CEC, and reduced labile Cd, Pb, and Zn (e.g., by 27, 37, and 46% in 5.0-Bio vs. the unamended soil). The addition of biochar did not change the number of total heterotrophic bacteria, actinomycetes, and fungi, while it reduced the number of Pseudomonas spp. and soil microbial biomass. Dehydrogenase activity was reduced in amended soils (e.g., by ~60 and 75% in 2.5- and 5.0-Bio, respectively), while in the same soils, urease increased by 48 and 78%. Approximately 16S rRNA gene amplicon sequencing and the Biolog community-level physiological profile highlighted a significant biochar impact (especially at a 5% rate) on soil bacterial diversity. Tomato (but not triticale) yield increased in the amended soils, especially in 2.5-Bio. This biochar rate was also the most effective at reducing Cd and Pb concentrations in shoots. Overall, these results demonstrate that 2.5% (but not 5.0%) biochar can be useful to restore the soil chemical fertility of PTE-polluted soils with limited (or null) impact on soil microbial and biochemical parameters.

Graphical Abstract

1. Introduction

Soil pollution by potentially toxic elements (PTE; e.g., Pb, Zn, Cd, As, and Sb) is of growing concern worldwide due to its critical effects on soil biota, including plants, and its potential impact on public health [1,2,3]. Soils polluted by PTE cannot be used for agricultural purposes (due to the health risks mentioned above), not contributing to the provision of food or feed, and limiting the achievement of many of the United Nations Sustainable Development Goals (SDGs), e.g., zero hunger (SDG 2), no poverty (SDG 1), and decent work and economic growth (SDG 8) (https://sdgs.un.org/goals, accessed on 20 August 2023). Sustainable remediation of these soils is therefore urgently needed to limit PTE spread in the environment and attenuate their negative consequences for health and society. In this sense, remediation interventions can be fundamental to converting marginal lands (i.e., PTE-polluted areas) into productive ones, e.g., by cultivating high-income non-food crops.
Adding organic amendments to PTE-polluted soils is one of the sustainable remediation options to increase soil fertility, reduce labile PTE (i.e., potentially bioavailable fractions), and reduce potential health risks [4,5]. In this context, biochar, i.e., the solid material deriving from the pyrolysis of different feedstock biomasses, can have relevant implications [6]. In particular, its large surface area, high pH, presence of different functional groups, relevant porosity, surface charge, cation exchange capacity (CEC), and abundance of recalcitrant C are responsible for effective immobilization of labile PTE in soil through a variety of mechanisms such as precipitation, specific and non-specific adsorption, and diffusion within pores [7,8,9,10,11]. Such PTE-immobilizing capacities are greatly influenced by the feedstock nature and pyrolysis conditions, among others [12]. A recent meta-analysis showed that biochar’s effectiveness in reducing PTE bioavailability in polluted soils depended mainly on soil pH (after amendment), texture, aging time, and the pyrolysis temperature of biochar [13]. In the same study, other important drivers regulating the bioavailability of PTE were identified, such as PTE species in soil, biochar feedstock, and application rate. This implies that a detailed characterization of each biochar x soil combination is needed to develop tailored solutions for soil recovery. This is essentially supported by the scientific literature of the last 10 years, which, however, has not provided so far any conclusive solutions and/or well-defined guidelines for biochar use in different soil pollution scenarios (e.g., [14]). For instance, while softwood-derived biochar was effective at immobilizing As and Cu in an aqueous solution [8], Beesley at al. [15,16] reported increased mobilization of As and Cu after soil amendment with hardwood biochar. Moreover, while a large literature reports on the PTE-immobilization capacities of biochar (e.g., [17,18,19]), an increase of Cu, Cd, Ni, and Zn in soil solution after biochar amendment was reported by El-Naggar et al. [20]. Additionally, similar biochars added to different soils in comparable amounts and incubation times showed varying effectiveness of PTE immobilization, e.g., Cd immobilization by maize straw biochar (pyrolyzed at ~500 °C) in two alkaline soils reached 24% in one case and 71% in the other [12]. Again, this supports the view that a customized, or case-by-case, assessment of biochar effectiveness is required and that knowledge gaps on biochar use for the recovery of PTE-polluted soils still exist.
Another aspect requiring more research efforts concerns the biochar impact on the soil microbial community and its functioning. This is an important point, as plant growth and health greatly rely on belowground microbial communities [21,22]. Although many studies reported a positive impact of biochar on soil microbial abundance, diversity, and activity (e.g., [23] and references therein), others highlighted contrasting results [24,25], making it impossible to draw general conclusions on this point. For instance, Anders et al. [26] showed that soil microbial biomass did not change after the addition of different biochars, while Andres et al. [27] reported a significant reduction. In addition, Wang et al. [28] reported a reduction in the relative abundance of fungi and bacteria when high rates of maize straw biochar were applied to the soil. Decreased soil basal respiration was noticed by Domene et al. [29] after corn stover biochar addition at the 0.2–7.0% rate, while reduced microbial activity (i.e., N mineralization) was reported by Dempster at al. [30] with increasing biochar from eucalyptus. Finally, the addition of biochar (from oak and hickory hardwood sawdust) also resulted in a null influence on soil microbial community structure [31], while many other critical effects of biochar on soil biota have been discussed elsewhere [25,32]. For instance, biochar can reduce nutrient bioavailability, thereby limiting plant growth and agricultural yield (e.g., [19,33,34]). This possibility, which mainly depends on feedstock and amendment rate, should be carefully evaluated before biochar employment in soil recovery intervention, as plant growth (PTE phytostabilizing species in particular) can be essential to reducing labile PTE and their spread into the environment [18,35,36].
The aim of this study was therefore to gain new knowledge on the effectiveness of softwood biochar in the functional recovery of a PTE-polluted soil from the dismissed Montevecchio mine in Sardinia, where Zn and Pb were extracted from galena (PbS) and sphalerite (Zn,Fe)S for more than one century [37]. In particular, PTE mobility was evaluated through sequential extraction in the polluted soil and in the same soil amended with two biochar rates. Soil microbial and biochemical parameters (e.g., soil microbial biomass, number of culturable microorganisms, community-level physiological profile, enzyme activities, amplicon sequencing analysis) were also addressed in the same soils. Finally, the biochar impact on soil fertility, plant growth, and PTE uptake was considered using different plant species, i.e., triticale and tomato.

2. Materials and Methods

2.1. Soil Origin, Biochar, and Mesocosms Set Up

The soil used in this study was sampled in the vicinity of the dismissed Montevecchio mine (39° 33′ 35″ N; 8° 25′ 29″ E) in Southwestern Sardinia (Italy). The mine was exploited for more than a century (1848–1991) to extract Pb and Zn from galena and sphalerite [37]. The mining area (i.e., Montevecchio-Ingurtosu) includes about 150 dumps, accounting for approx. 8 Mm3 of waste dumps and tailings. In addition, approx. 7 Mm3 of tailings are dispersed in a large area around the mining site [38]. Due to limited management and securing of dumps and tailings, the area is characterized by significant PTE pollution consequent to the weathering of metal sulfides. Different soil samples (upper 30 cm) were collected near the mining site, pooled in the laboratory (150 kg in total), and sieved to <2 mm before mesocosms were set up. The soil was acidic (pH 5.74) and had a sandy loam texture (USDA classification: 28% coarse sand, 41.5% fine sand, 15.8% silt, 14.7 clay; [39]).
The softwood-biochar used in this study (from elder, beech, and poplar pyrolyzed at 700 °C) was kindly provided by Ronda S.p.A. (Zanè, Italy). A detailed physico-chemical characterization of this biochar was previously described by Pinna et al. [8] and reported in Table S1. Briefly, the biochar was alkaline (pH 9.3) with a pHPZC = 5.0, had approx. 60% of total C, 85 mg kg−1 of available P, and a CEC of 19 cmol(+) kg−1. The content of total N and dissolved organic carbon (DOC) was low, i.e., 0.3% and 0.02 mg kg−1 respectively. Biochar acidity was mainly due to phenolic groups (2.1 cmol(+) kg−1) rather than carboxylic ones (0.14 cmol(+) kg−1), while Pb, Cd, and Zn were not detected.
Triplicate mesocosms (approx. 15 kg each) were set up in plastic containers for control soil (C soil), soil amended with 2.5% biochar (2.5-Bio), and soil amended with 5.0% biochar (5.0-Bio). Such biochar rates were established based on previous studies carried out on soils with a PTE pollution status comparable to the one investigated here (e.g., [18,40]). Before addition to soil, biochar was sieved to <2 mm. Mesocosms were left to equilibrate for 3 months at 20–22 °C and a constant humidity level (i.e., 40% of their water holding capacity). During this time, they were mixed weekly to favor soil-amendment contact.

2.2. Soil Chemical Analyses

After the contact period, physico-chemical analyses were carried out on duplicate soil samples from each mesocosm. Soil pH and electrical conductivity (EC) were determined in 1:2.5 and 1:5 soil-to-water suspensions; available P and cation exchange capacity (CEC) were determined using the Olsen and the BaCl2-triethanolamine methods, respectively, according to Gazzetta Ufficiale n. 84 [41]. Soil organic C and total N were determined using a Leco CHN628 CHN analyzer and a Soil LCRM Leco part no. 502–697 as a calibration sample. DOC was quantified following Manzano et al. [19], while pseudo-total PTE (i.e., Pb, Cd, and Zn) was determined after microwave mineralization of soil samples (as previously reported) using a Perkin Elmer AAnalyst 400 HGA 900 atomic adsorption spectrometer (FAAS) for Zn and a Perkin Elmer AAnalyst 400 equipped with an HGA 900 graphite furnace (GFAAS) for Pb and Cd. The NIST-SRM 2711-certified reference soil was included for quality assurance.

2.3. Mobility of Pb, Cd, and Zn in Soil

The mobility of Pb, Cd, and Zn in each mesocosm was evaluated (after the contact period) through the sequential extraction procedure described by Basta and Gradwohl [42]. Readily soluble and exchangeable fractions (labile PTE) were quantified after the extraction of duplicate soil samples (1 g each) from each mesocosm with 0.5 M Ca(NO3)2 solution, acid-soluble fractions, and those weakly complexed by soil colloids were quantified after extraction with 1 M NaOAc (pH 5); finally, surface-complexed and precipitated PTE fractions were quantified after extraction with Na2EDTA (pH 7). Residual PTE (i.e., very insoluble and occluded fractions) were quantified after microwave soil mineralization as described for pseudo-total PTE. After each extraction step, the soil suspensions were centrifuged (3500 rpm for 10 min), and the PTE concentration in the filtered supernatant (0.45 µm cellulose acetate filters) was determined using FAAS and GFAAS as already reported.

2.4. Culturable Microorganisms and Soil Microbial Biomass

After the contact period, the number of total culturable heterotrophic bacteria, fungi, actinomycetes, and Pseudomonas spp. was determined in duplicate soil samples (10 g) from each mesocosm as previously described [2]. Briefly, soil samples were serially 10-fold diluted using a 0.89% NaCl solution, and aliquots (100 µL) of the resulting suspensions were used to inoculate Petri dishes containing the following microbiological growth media: 1:10 Tryptone Soy Agar (for heterotrophic bacteria; Microbiol, Cagliari, Italy); Rose Bengal Chloramphenicol Agar (for fungi; Biolife, Monza, Italy); Actinomycetes Isolation Agar Glycerol (for actinomycetes; Difco, Milan, Italy); Pseudomonas Selective Agar (for Pseudomonas spp.; Microbiol, Cagliari, Italy). Colony counts were carried out after 48 h of incubation at 28 °C for heterotrophic bacteria and fungi and after 72 h at 28 °C for actinomycetes and Pseudomonas spp. Microbial counts were expressed as Log10 colony-forming units (CFU g−1 soil).
Soil microbial biomass (SMB) was estimated in each mesocosm using the chloroform-fumigation extraction method, as reported by Nunan et al. [43]. In brief, duplicate soil samples (40 g) from each mesocosm were divided into two 20 g aliquots: one was immediately extracted with 80 mL of a 0.5 M K2SO4 solution after shaking (60 min) and filtering with Whatman No. 42 filter paper; the other was incubated for 24 h under vacuum with ethanol-free chloroform as described by ISO 14240-2 [44] and subsequently extracted as described for the unfumigated samples. Afterwards, the increase in UV readings at 280 nm (A280) of the fumigated vs. unfumigated extracts was used to estimate soil microbial biomass C, as previously reported [40]. The values of soil microbial biomass C were expressed as µg C kg−1 soil.

2.5. Molecular Analysis of the Soil Bacterial Community through 16S rRNA Gene Amplicon Sequencing

2.5.1. Bioinformatics

After the contact time, the PowerSoil DNA isolation kit (Mo Bio Laboratories, Carlsbad, CA, USA) was used to extract DNA from soil samples (~500 mg) of each mesocosm. DNA extracts were provided to the Integrated Microbiome Resource sequencing center (Dalhousie University, Halifax, NS, Canada), and amplicon sequencing was performed according to their Illumina MiSeq 2x300bp in-house protocol for amplicons generated with the V4-V5 515FB (5′-GTGYCAGCMGCCGCGGTAA-3′)/926R(5′-CCGYCAATTYMTTTRAGTTT-3′) primers [45,46]. The retrieved sequences were subjected to quality assessment and control with the dada2 v1.24.0 [47] pipeline using the R software v4.1.3 [48], and ASV matrices were obtained as follows. Sequence reads were trimmed at the first instance of very low bases (Phred Q values of 2) while screened from the read error-prone end towards the start. The remaining parts were rejected if the expected error rates were at most 2 or if the remaining read parts were shorter than 150 bp. Moreover, read-pairs where the reconstruction of the amplicon of origin via merging (allowing no mismatches) was not possible were removed. Finally, chimeric, non-specific, or off-target amplicons (non-prokaryotic, unclassified, mitochondrial, or chloroplast) were also rejected from downstream analysis. Classification of the ASVs into taxa was performed with the Bayesian Classifier [49] version of dada2 against the Silva v138 database using an 80% bootstrap cutoff value [50]. The retrieved phylogenetic markers were also analyzed for their functional potential with PICRUSt2 [51] using the default parameters.

2.5.2. Biostatistics

The retrieved ASV and predicted microbial function matrices were used for a series of statistical analysis tasks. α-diversity indices representing members or functions of the studied microbial communities of various dominance levels were calculated with the Vegan v2.6-4 [52] and the Entropart v1.6-11 [53] R packages. Specifically, the observed richness (representing all communities), the Shannon index (representing the, at least, low-dominance community members), the Inverse Simpson index (representing the, at least, intermediate-dominance community members), and the Fisher’s α index (representing the highly dominant community members) were calculated. Permutational multivariate analysis of variance (PERMANOVA) and canonical analysis were performed with the vegan package of R to assess the effect of the biochar treatment on the microbial communities and their functions. Analysis of variance with the Tukey’s post hoc test or their non-parametric equivalents (Kruskal–Wallis and the Wilcoxon rank sum analysis) was used for comparing α-diversity indices, while analysis for differentially abundant taxa between treatments was performed with the Kruskal–Wallis (k test-factor levels, with k > 2) and the Wilcoxon rank sum (pairwise) analysis.

2.6. Soil Enzyme Activities and Community Level Physiological Profile

Dehydrogenase (DHG) and urease (URE) were quantified (after the incubation period) in duplicate soil samples from each mesocosm. Both enzyme activities were determined using the protocols described by Alef and Nannipieri [54]. Briefly, the DHG activity was determined colorimetrically (A480) as triphenyl formazan released after incubation of soil samples (10 g at 30 °C for 24 h) with triphenyl tetrazolium chloride, while URE was determined as ammonia released (A690) after incubation of soil samples (5 g at 37 °C for 2 h) with urea [54].
The Biolog community-level physiological profile (CLPP) was obtained for soil microbial communities extracted from the different mesocosms, as reported by Diquattro et al. [2]. In particular, soil microbial communities from the different mesocosms were inoculated in 96-well Biolog (microtiter) Ecoplates (Biolog Inc., Hayward, CA, USA) containing a total of 31 C sources of environmental relevance (one in each well) and a blank well replicated three times. After recording the A590 readings for each well (every 24 h for 5 days), using a Biolog MicroStation™ reader (Biolog Inc., Hayward, CA, USA), the following CLPP indexes were determined, i.e., the Average Well Color Development (AWCD), the Shannon–Weaver index (H′), and the Richness (S) value.
The AWCD, or the potential catabolic activity of the different soil microbial communities, was calculated as in Equation (1):
AWCD = i = 1 31 R i C / 31
where Ri is the absorbance value (A590) of each response well, C is the absorbance value of the control well, and 31 is the number of C substrates in the plate [52].
H′, indicating the catabolic functional diversity (substrate use) of the different soil microbial communities, was calculated as in Equation (2):
H = p i   Log   p i
where pi is the absorbance ratio of each of the 31 substrates to the total absorbance value of the plate [55].
S was calculated as the number of C substrates used (A590 > 0.15) by the different soil microbial communities [56].
Standardized A590 values, i.e., [(Ri—C)/AWCD of the plate], were also subject to Principal Component Analysis (PCA) using the variance/covariance matrix [56] to allow for a more straightforward data interpretation of multidimensional data.

2.7. Plant Growth and PTE Uptake

After the incubation time, the soil from each mesocosm was used to fill 2 pots (approx. 2 kg of soil each), which were planted with triticale (x Triticosecale Wittm. cv. Trimour) and tomato (Lycopersicon esculentum L. cv. Rio Grande) seeds. These species, characterized by different physiologies and taxonomically distant, were chosen as bioindicator organisms to fully evaluate the remediation effectiveness of biochar and not to test the possibility of growing food or feeding crops in the polluted soil. Ten and five plants of triticale and tomato were grown, respectively, in each pot (without fertilization) for 2 months at 20–22 °C. At harvest, plants were removed from pots, and roots and shoots were carefully washed. All plant heights were recorded, shoots and roots were separated, and their dry weight was determined after 10 days in the oven at 55 °C. To quantify PTE uptake, root and shoot tissues were mineralized using microwave (ultraWave, Milestone, Sorisole, Italy) and a digestion solution containing 2 mL of suprapure H2O2 and 4 mL of a mixture of HNO3 and ultrapure H2O (ratio 1:1). After mineralization, Pb, Cd, and Zn were determined using FAAS for Zn and GFAAS for Pb and Cd. Peach leaves (NIST-SRM 1547) were used as standard reference material for quality assurance.

2.8. Data Analysis

Soil chemical, biochemical, and microbiological data are reported in tables and figures as mean values ± standard errors (SE). Data were analyzed to investigate differences due to the treatments applied (i.e., biochar at two different rates). All traits were evaluated for normality and homoscedasticity using the Shapiro and Bartlett tests, respectively. The variables that passed both tests were analyzed through ANOVA, whereas those that did not were analyzed through the Kruskal–Wallis test (p < 0.05). In Table S2, the statistical analysis adopted for each of the investigated traits was reported. All statistical analyses were carried out in R 4.2.1 [48].

3. Results and Discussion

3.1. Influence of Biochar on the Chemical Characteristics of the Polluted Soil

The main physico-chemical characteristics of the polluted soil used in this study are reported in Table 1. This latter soil had a sandy loam texture with an acidic pH and a low content of organic matter, total N, and DOC. However, available P and CEC values were high, but pseudo-total concentrations of Pb, Cd, and Zn were all abundantly exceeding the threshold values established by the Italian law for potentially contaminated soils devoted to commercial and/or industrial use (i.e., 1000, 15, and 1500 mg kg−1 for Pb, Cd, and Zn, respectively; [57]) or to agriculture (i.e., 100, 5, and 300 mg kg−1 for Pb, Cd, and Zn, respectively; [58]). Overall, these data suggest limited soil fertility, with N being the most limiting factor for agricultural yields [59], and with low pH and high PTE content adding more stress for plant establishment and growth, as well as for the soil microbial community [42,56,60]. The low DOC content also suggests some additional constraints on microbial growth and abundance in the studied soil.
Biochar addition increased soil pH, which approached neutrality in 5.0-Bio (Table 1). This was due to biochar alkalinity (Table S1), and it is expected to have a positive impact on both soil physico-chemical properties, e.g., through the reduction of soluble Al3+ and PTE, and soil microbial activities [61]. Also, the increase in available P (especially in 5.0-Bio) and CEC recorded in amended soils is deemed positive, as these latter are important soil fertility parameters. The biochar ability to increase soil CEC was previously reported and attributed to the presence of oxygen-containing functional groups on biochar surfaces (e.g., carboxylic and phenolic) able to retain cations [12]. Moreover, biochar’s natural oxidation and/or its incubation with soil can further increase the formation of oxygenated groups [62], likely explaining the CEC values of amended soils. The high amount of available P in biochar (i.e., 85 mg kg−1 soil; Table S1) can finally explain its increase in the amended soils (especially in 5.0-Bio; Table 1).

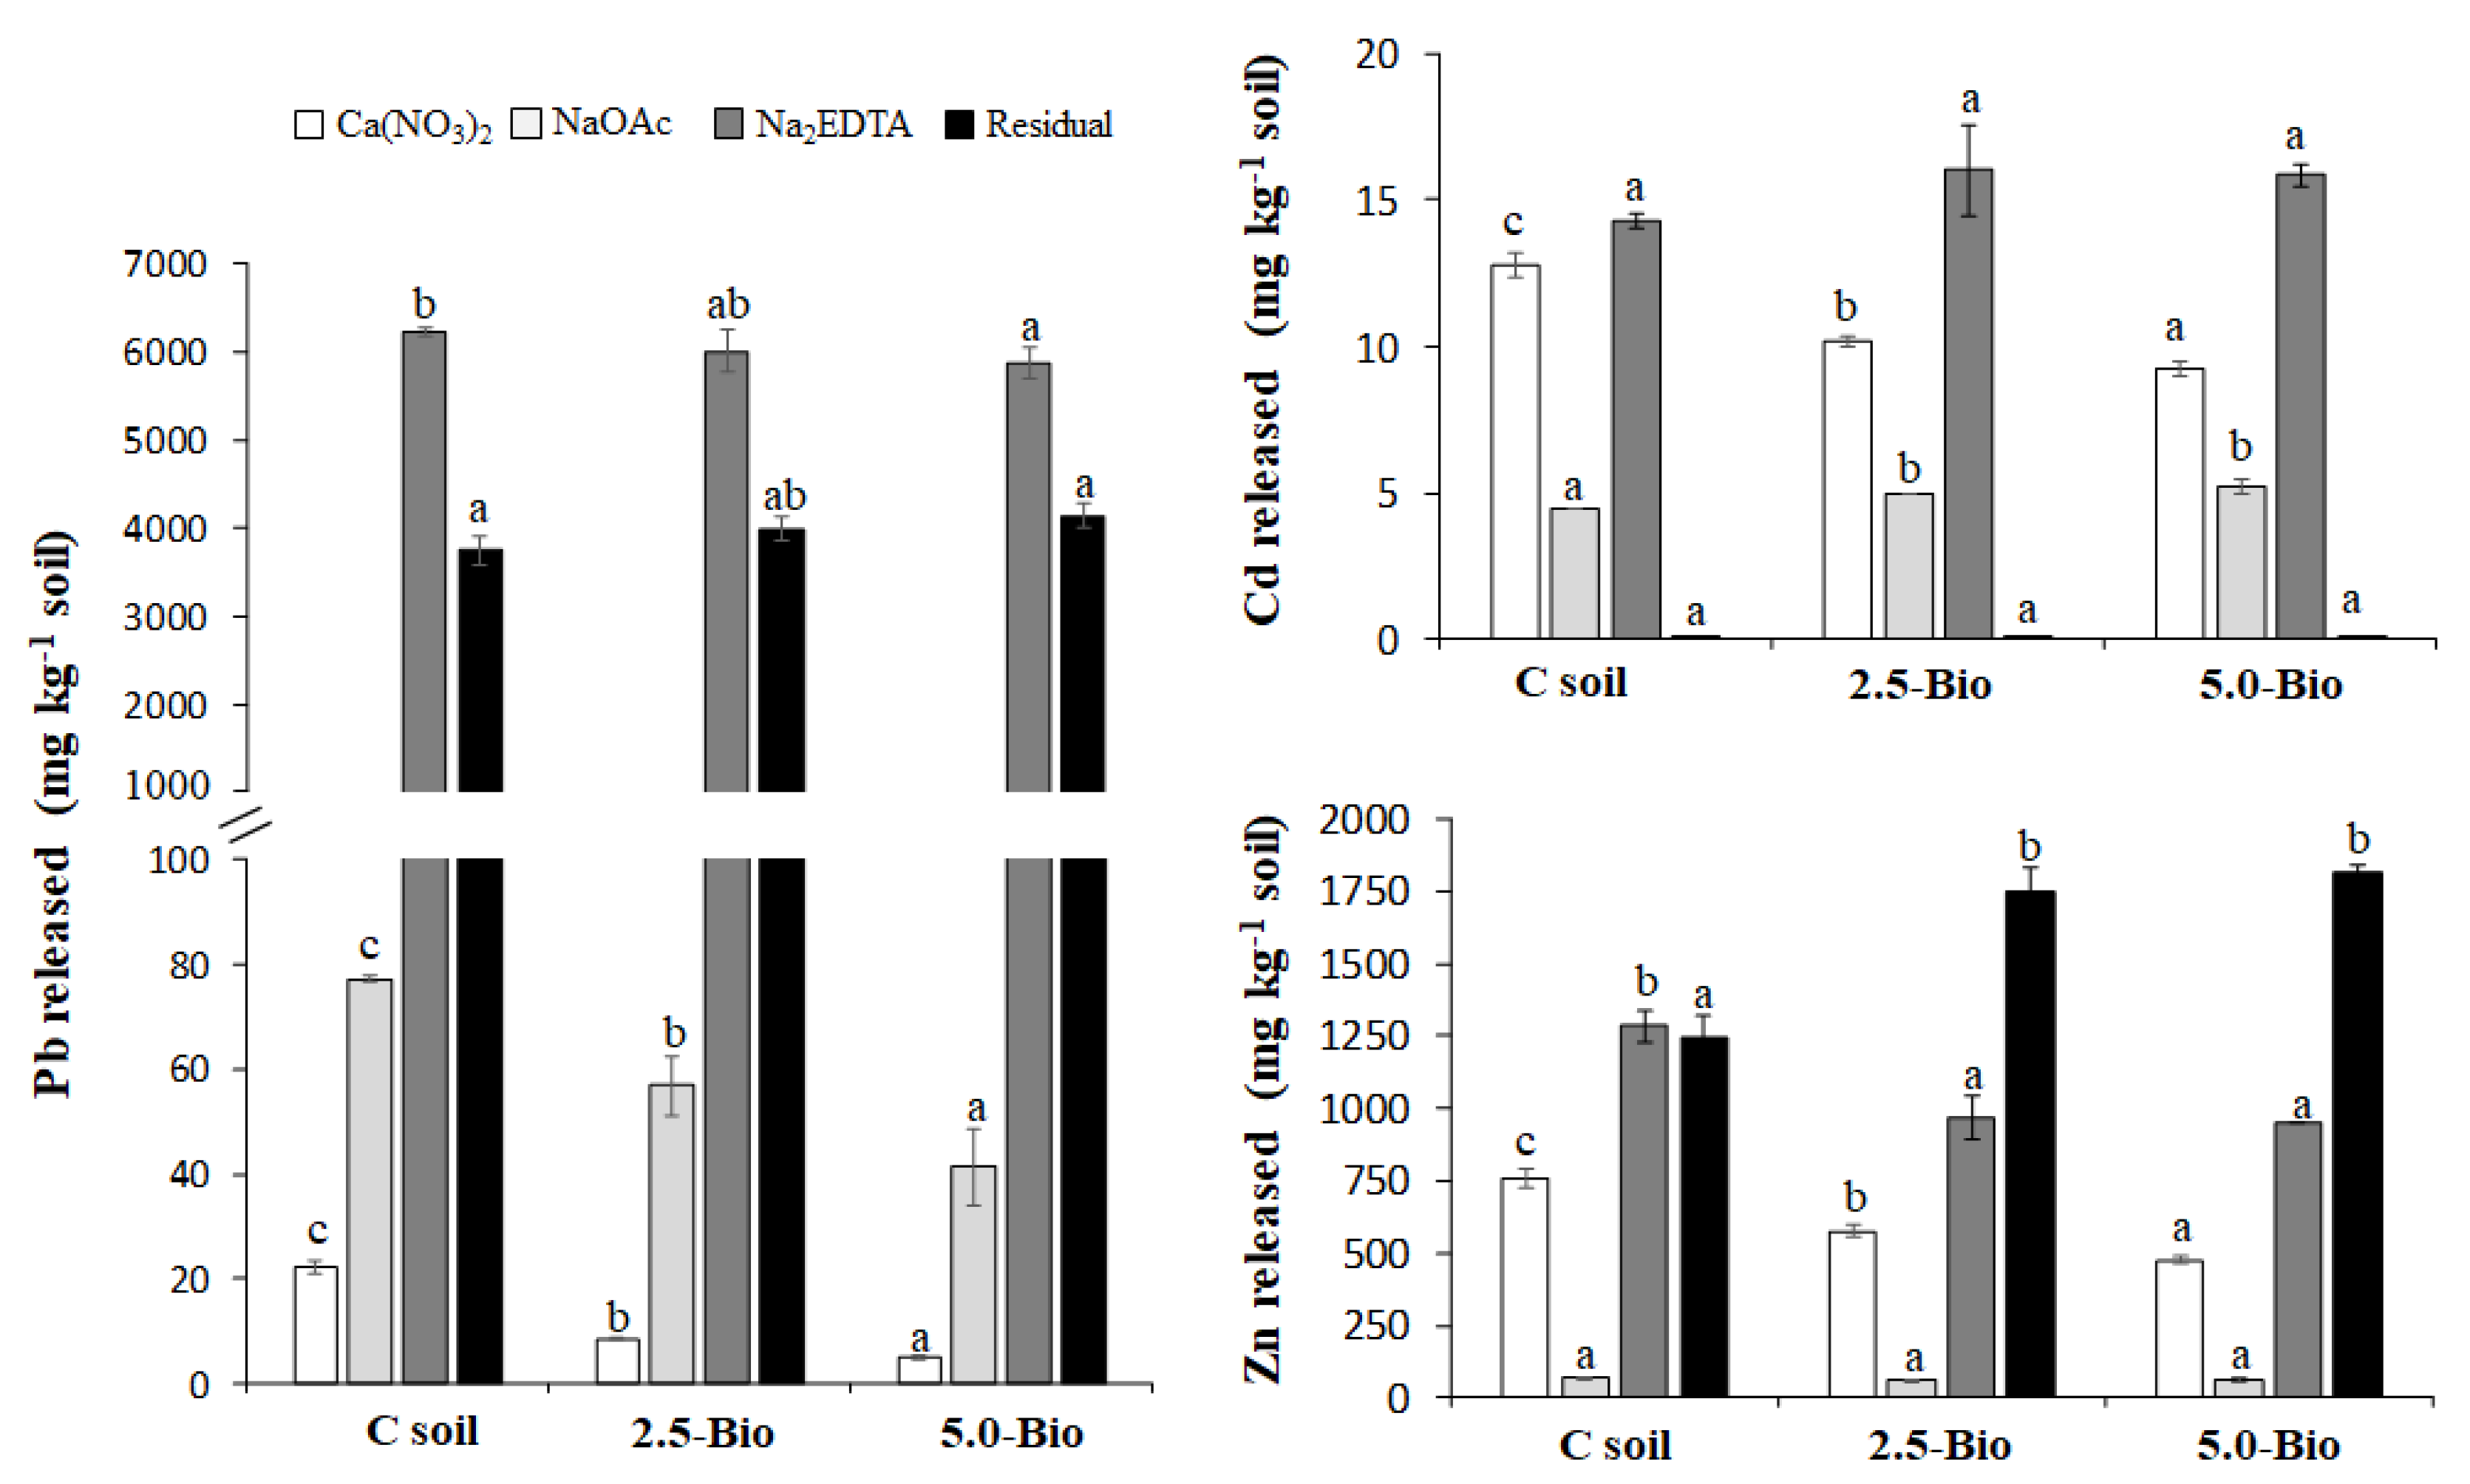
3.2. Influence of Biochar on the Mobility of Pb, Cd and Zn in Soil

Both rates of biochar had a great influence on PTE mobility, significantly reducing the concentration of labile (readily soluble and exchangeable) Pb, Cd, and Zn in the amended soils (Figure 1). For instance, labile Pb [extracted with Ca(NO3)2] reduced by approx. 76% in 5.0-Bio, while in the same soil, Cd and Zn reduced up to 27 and 37%, respectively (Figure 1). Weakly complexed Pb (extracted with NaOAc) reduced up to 46% in Bio-5.0, while Cd and Zn increased or remained unchanged, respectively (Figure 1). After biochar addition, the surface complexed and precipitated PTE (extracted with Na2EDTA) reduced in the case of Pb (up to ~5%) and Zn (up to ~26%) but remained unchanged for Cd. Very insoluble and occluded fractions (residual PTE) remained unaffected for Pb and Cd, while significantly increasing for Zn (up to ~45%).
During the three-month contact period, a PTE redistribution clearly occurred in amended soils (especially in 5.0-Bio), leading to a shift from more mobile and potentially bioavailable fractions [i.e., labile PTE extracted with Ca(NO3)2] to less mobile and poorly bioavailable ones (e.g., those extracted with Na2EDTA and/or residual). This was previously reported by other studies (e.g., [63]) and is of outmost importance from a remediation perspective since labile PTE are the most impactful on plants and soil (micro)organisms [4,18,40]. Such biochar-driven PTE redistribution towards less bioavailable fractions can be due to a variety of mechanisms, such as: (i) Pb, Cd, and Zn partial precipitation as oxides or hydroxides following the significant pH increase in the amended soils [7]; (ii) the formation of insoluble PTE-phosphates or PTE-carbonates (e.g., the biochar used contained substantial available phosphate, Table 1; [8]); (iii) the formation of strong complexes between PTE and oxygenated functional groups of biochar (e.g., phenolic and carboxylic, Table 1; [64]); (iv) PTE surface adsorption and diffusion within biochar pores [7,14].

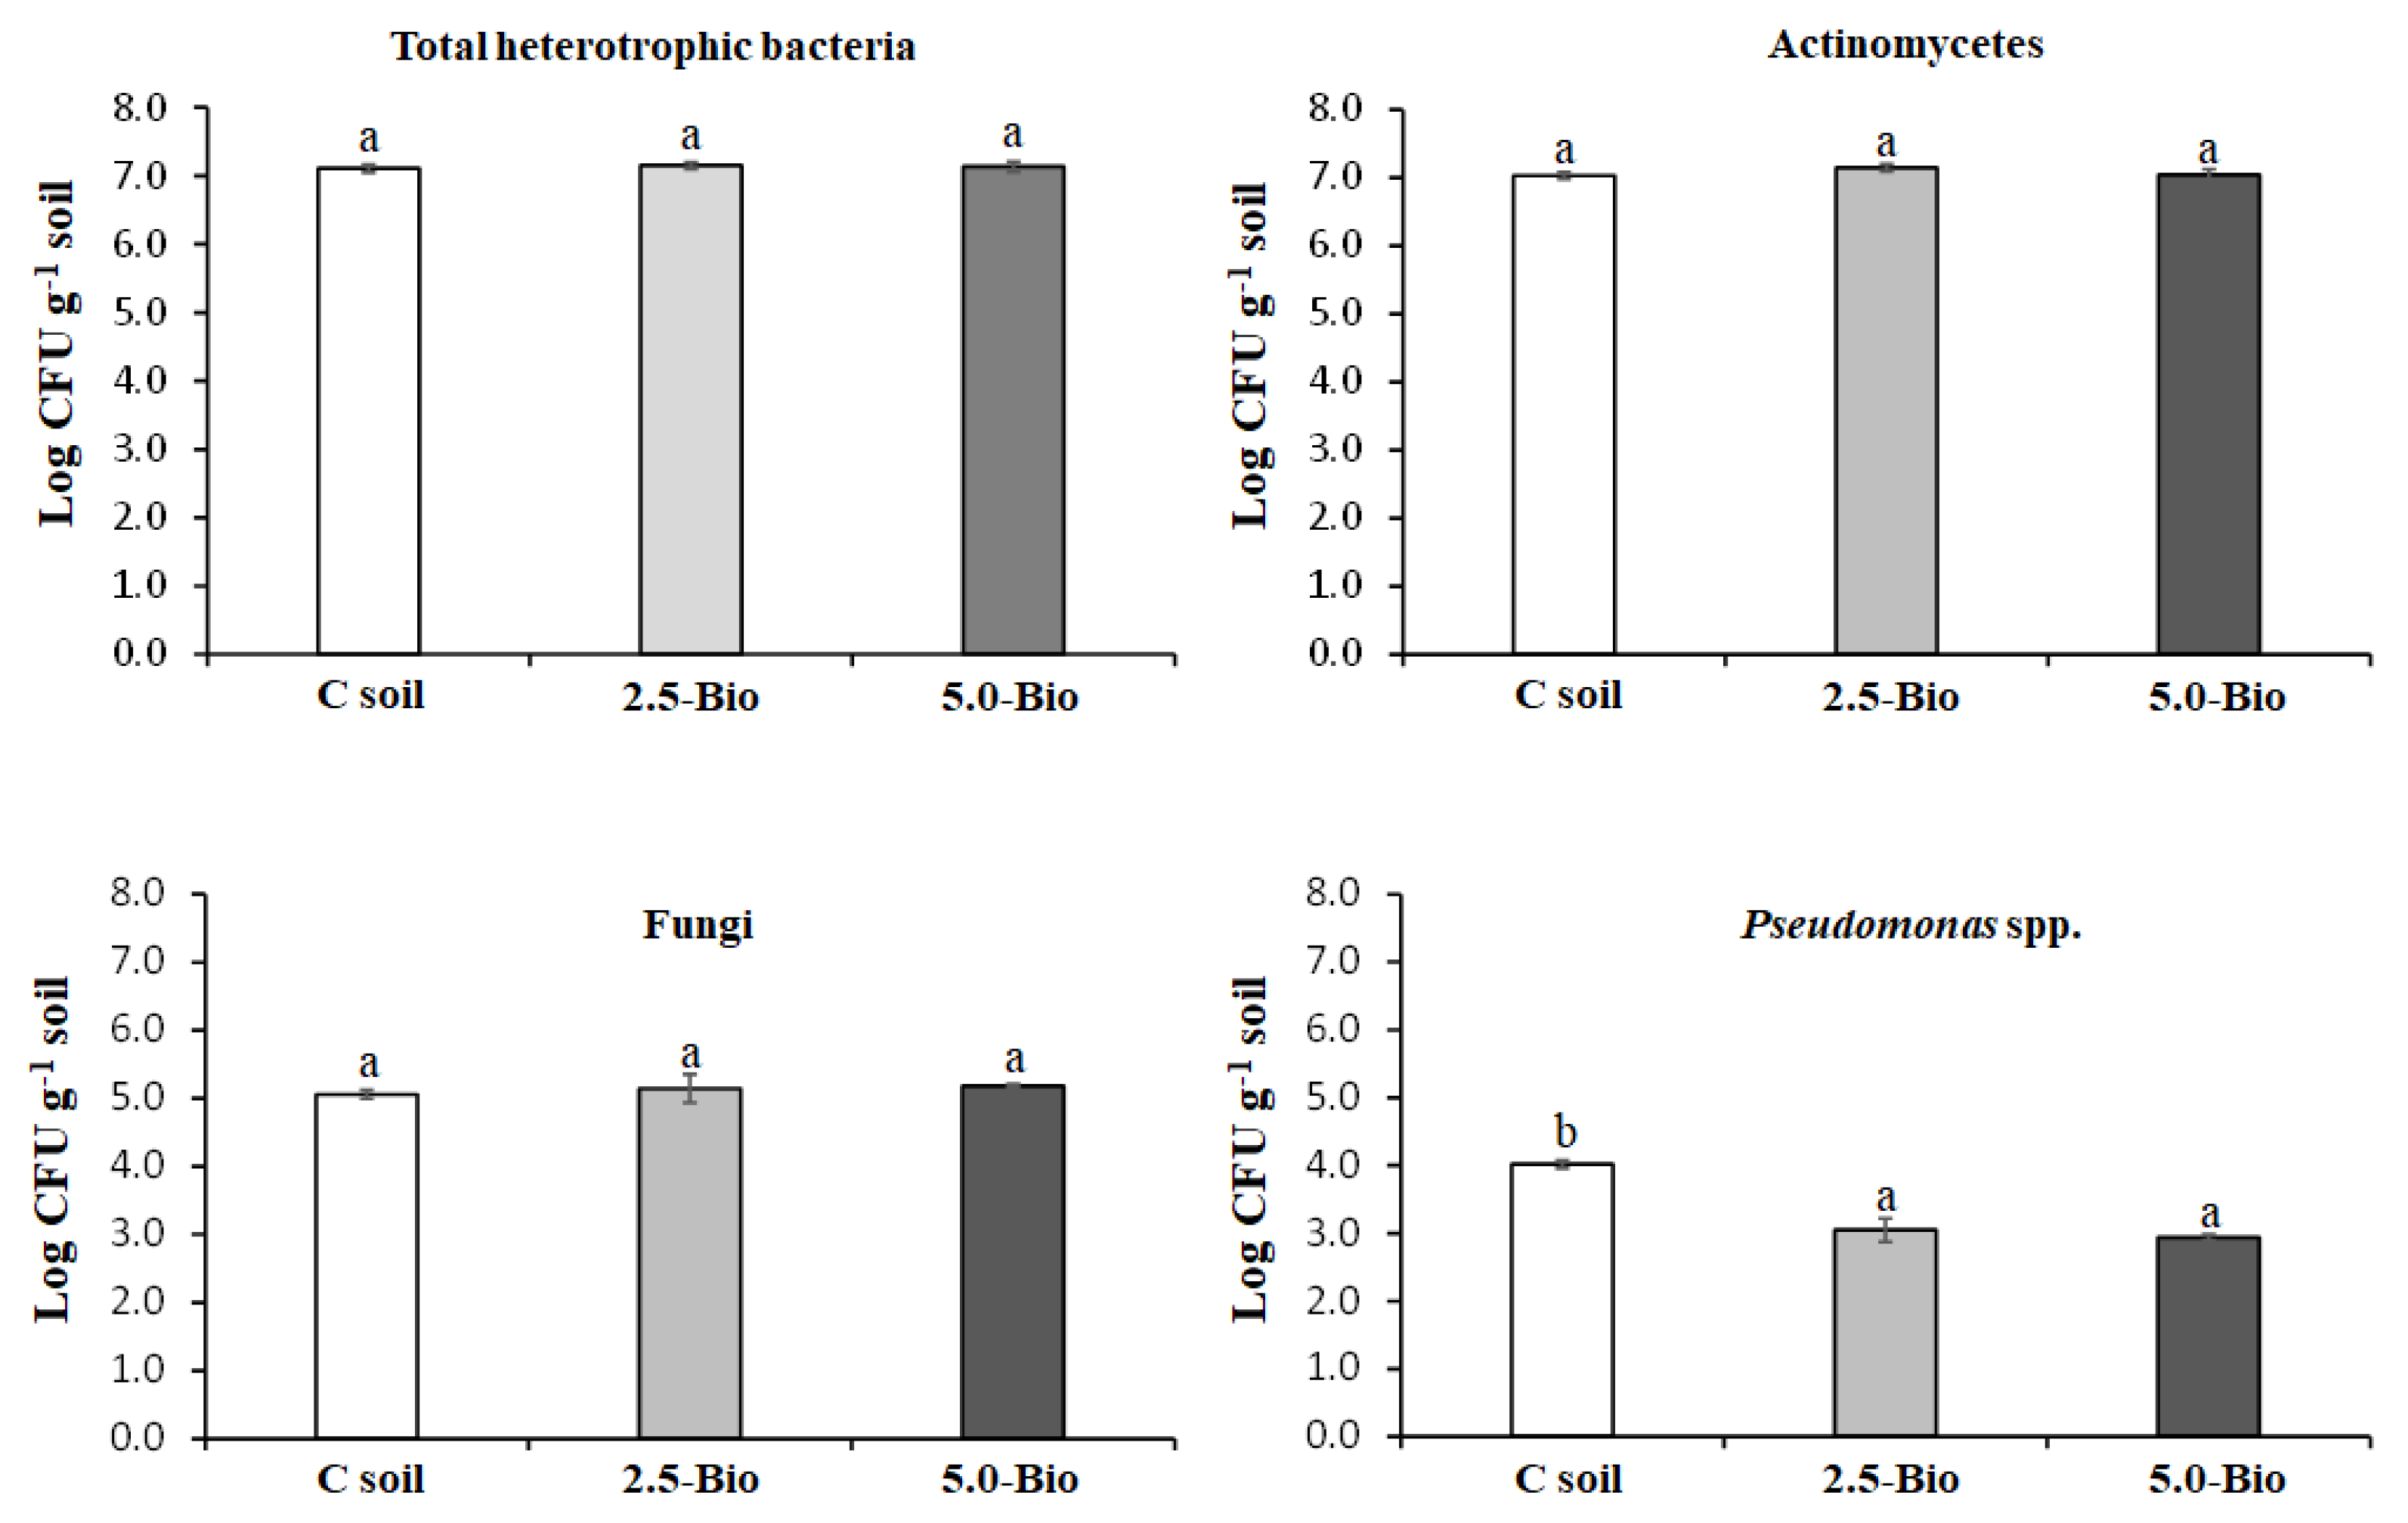
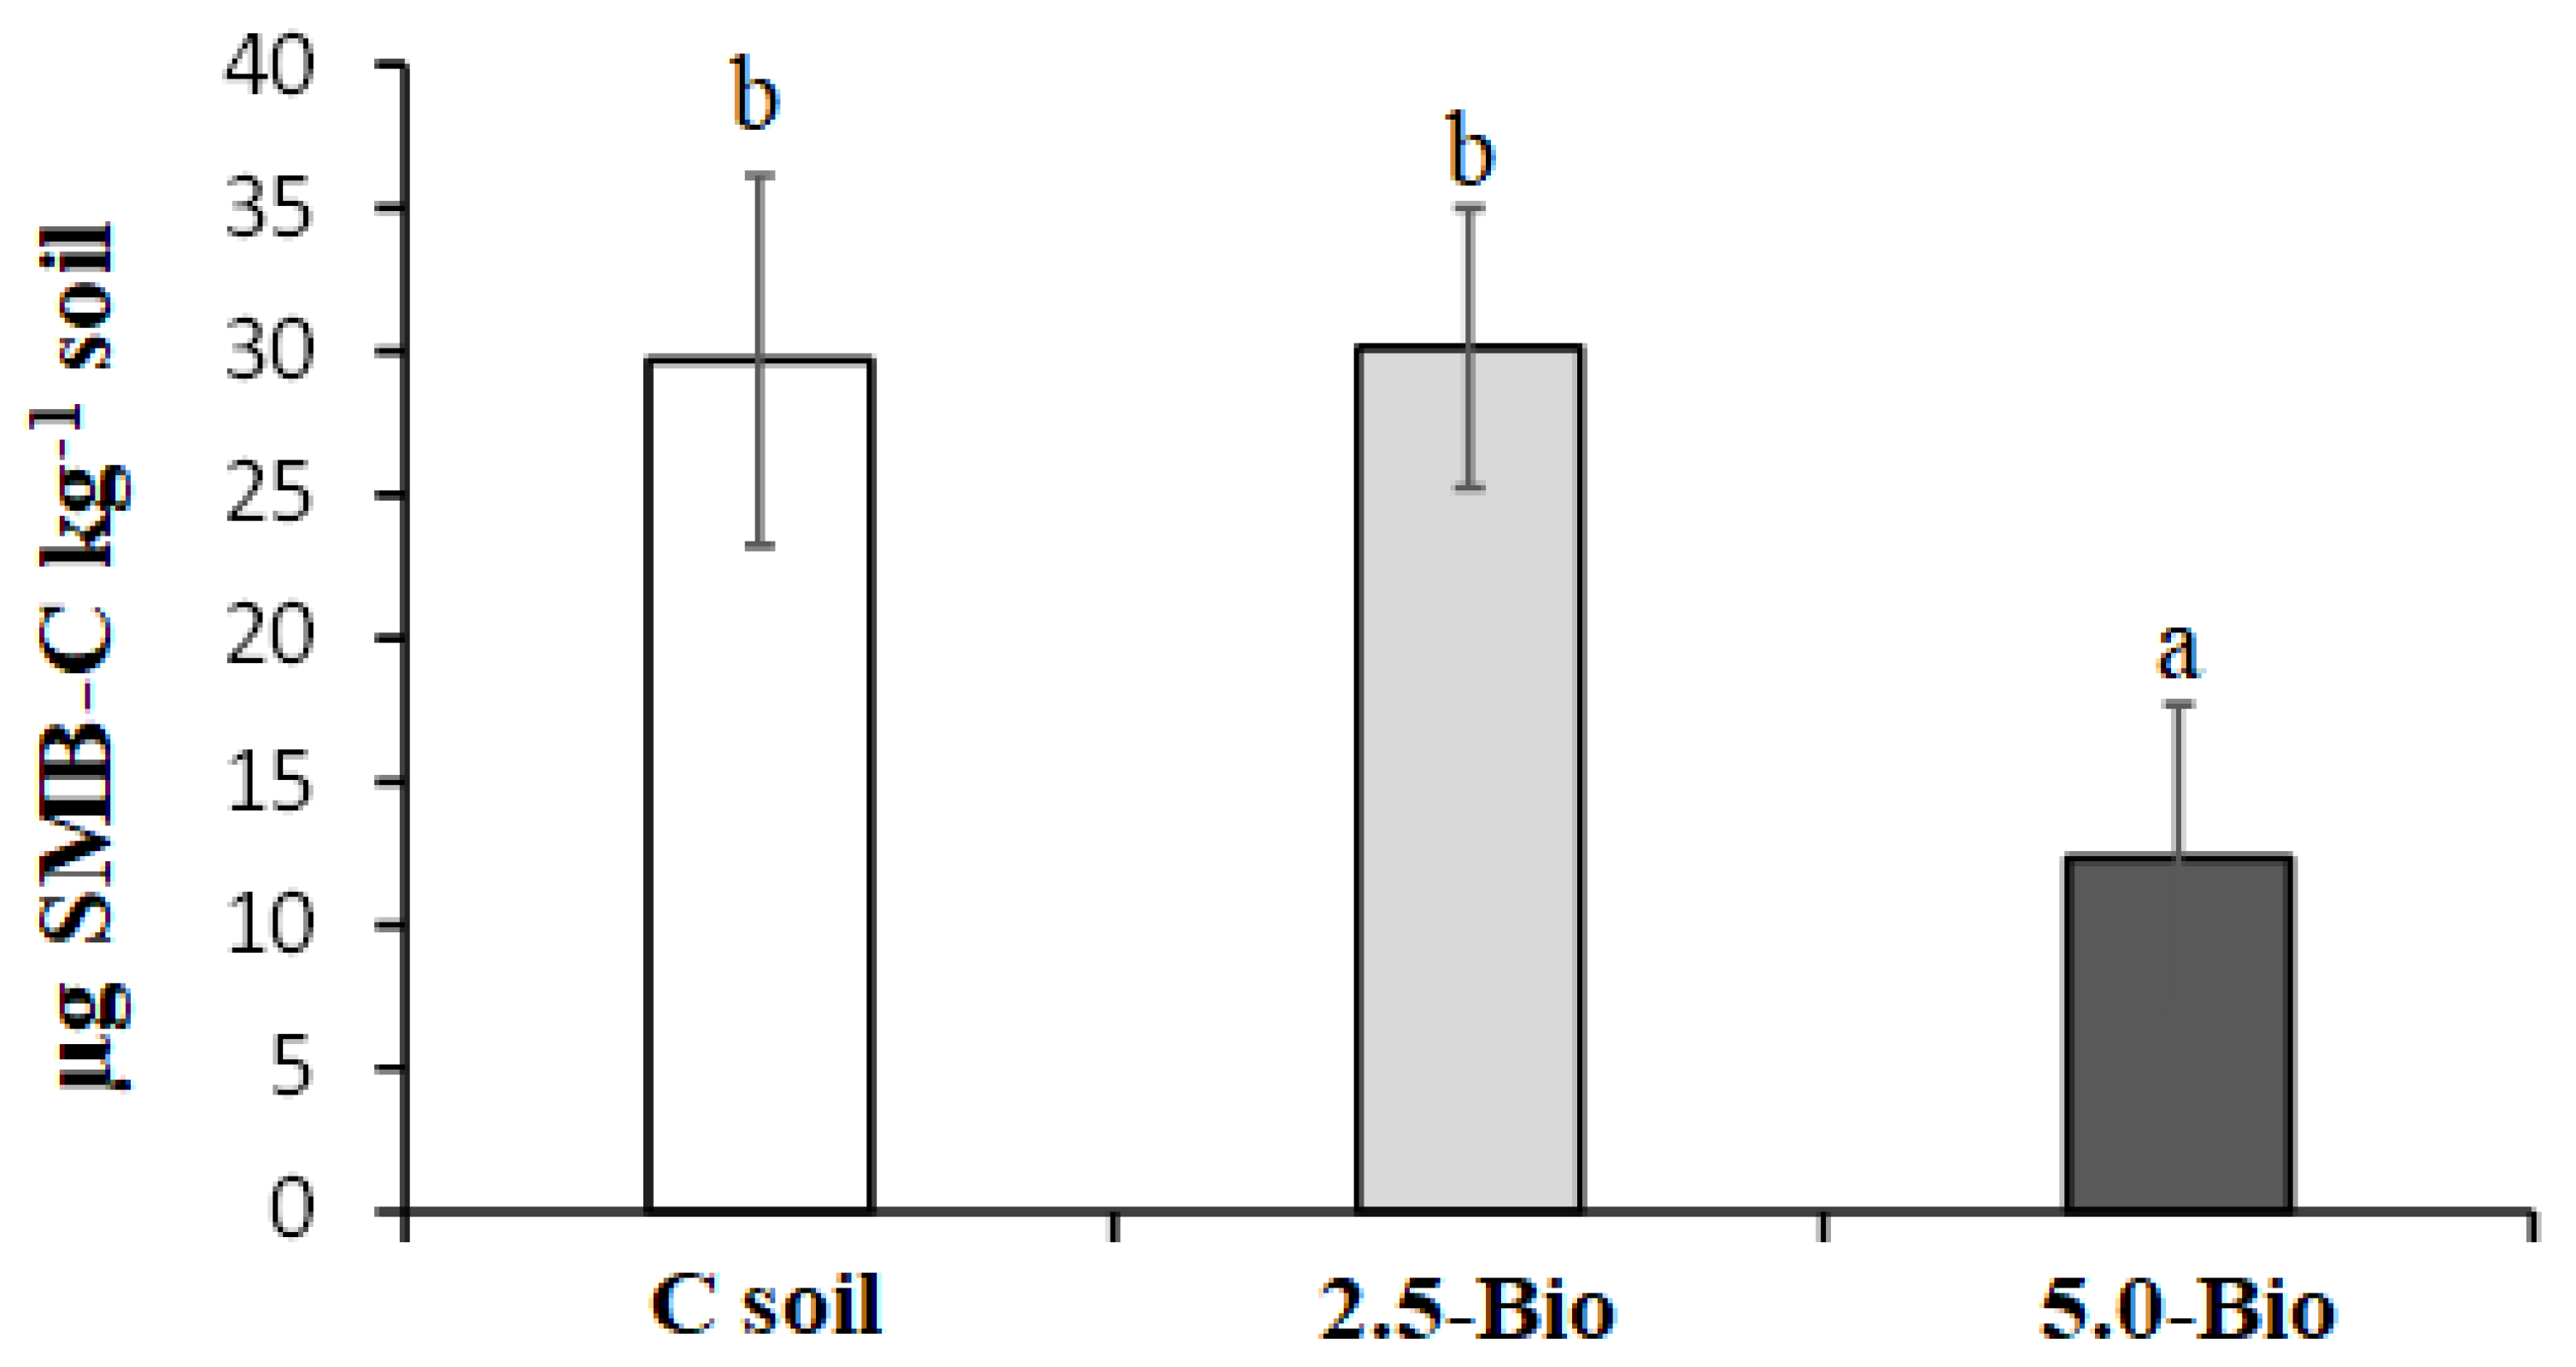
3.3. Influence of Biochar on Culturable Microorganisms and Soil Microbial Biomass

The size of the targeted culturable soil microbial communities was mostly unaffected by biochar addition (Figure 2). The number of total heterotrophic bacteria, actinomycetes, and fungi did not change after soil amendment, while that of Pseudomonas spp. was reduced by approx. 10-fold (Figure 2). This is interesting as in the very few studies focusing on the effect of biochar on soil culturable microorganisms, increased microbial numbers were commonly reported after amendment (e.g., [65,66,67]). Our results can be explained by the DOC values recorded in the amended and unamended soils: DOC represents an important source of C for soil microorganisms [68], and its marginal reduction in the amended soils, also reported by Manzano et al. [19] and explained by adsorption phenomena, did not allow an increase of culturable microorganisms, while it reduced the number of Pseudomonas spp. [69]. However, PAHs accumulated in biochar during pyrolysis could have contributed to such adverse effects against Pseudomonas spp. [24]. Both DOC reduction and PAH accumulation in amended soils could also explain the approx. 60% reduction of SMB recorded in 5.0-Bio (Figure 3). Similar results were reported by Andrés et al. [27] after adding maize biochar to Mediterranean vineyards and by Dempster et al. [30] after using eucalyptus biochar in wheat cultivation. While the impact of the highest amount of soft-wood biochar was clear, at least vs. Pseudomonas spp. and SMB, its relevance for soil functioning is hardly predictable, although microbial biomass is recognized to play a relevant role in soil ecosystem functioning and productivity [70].

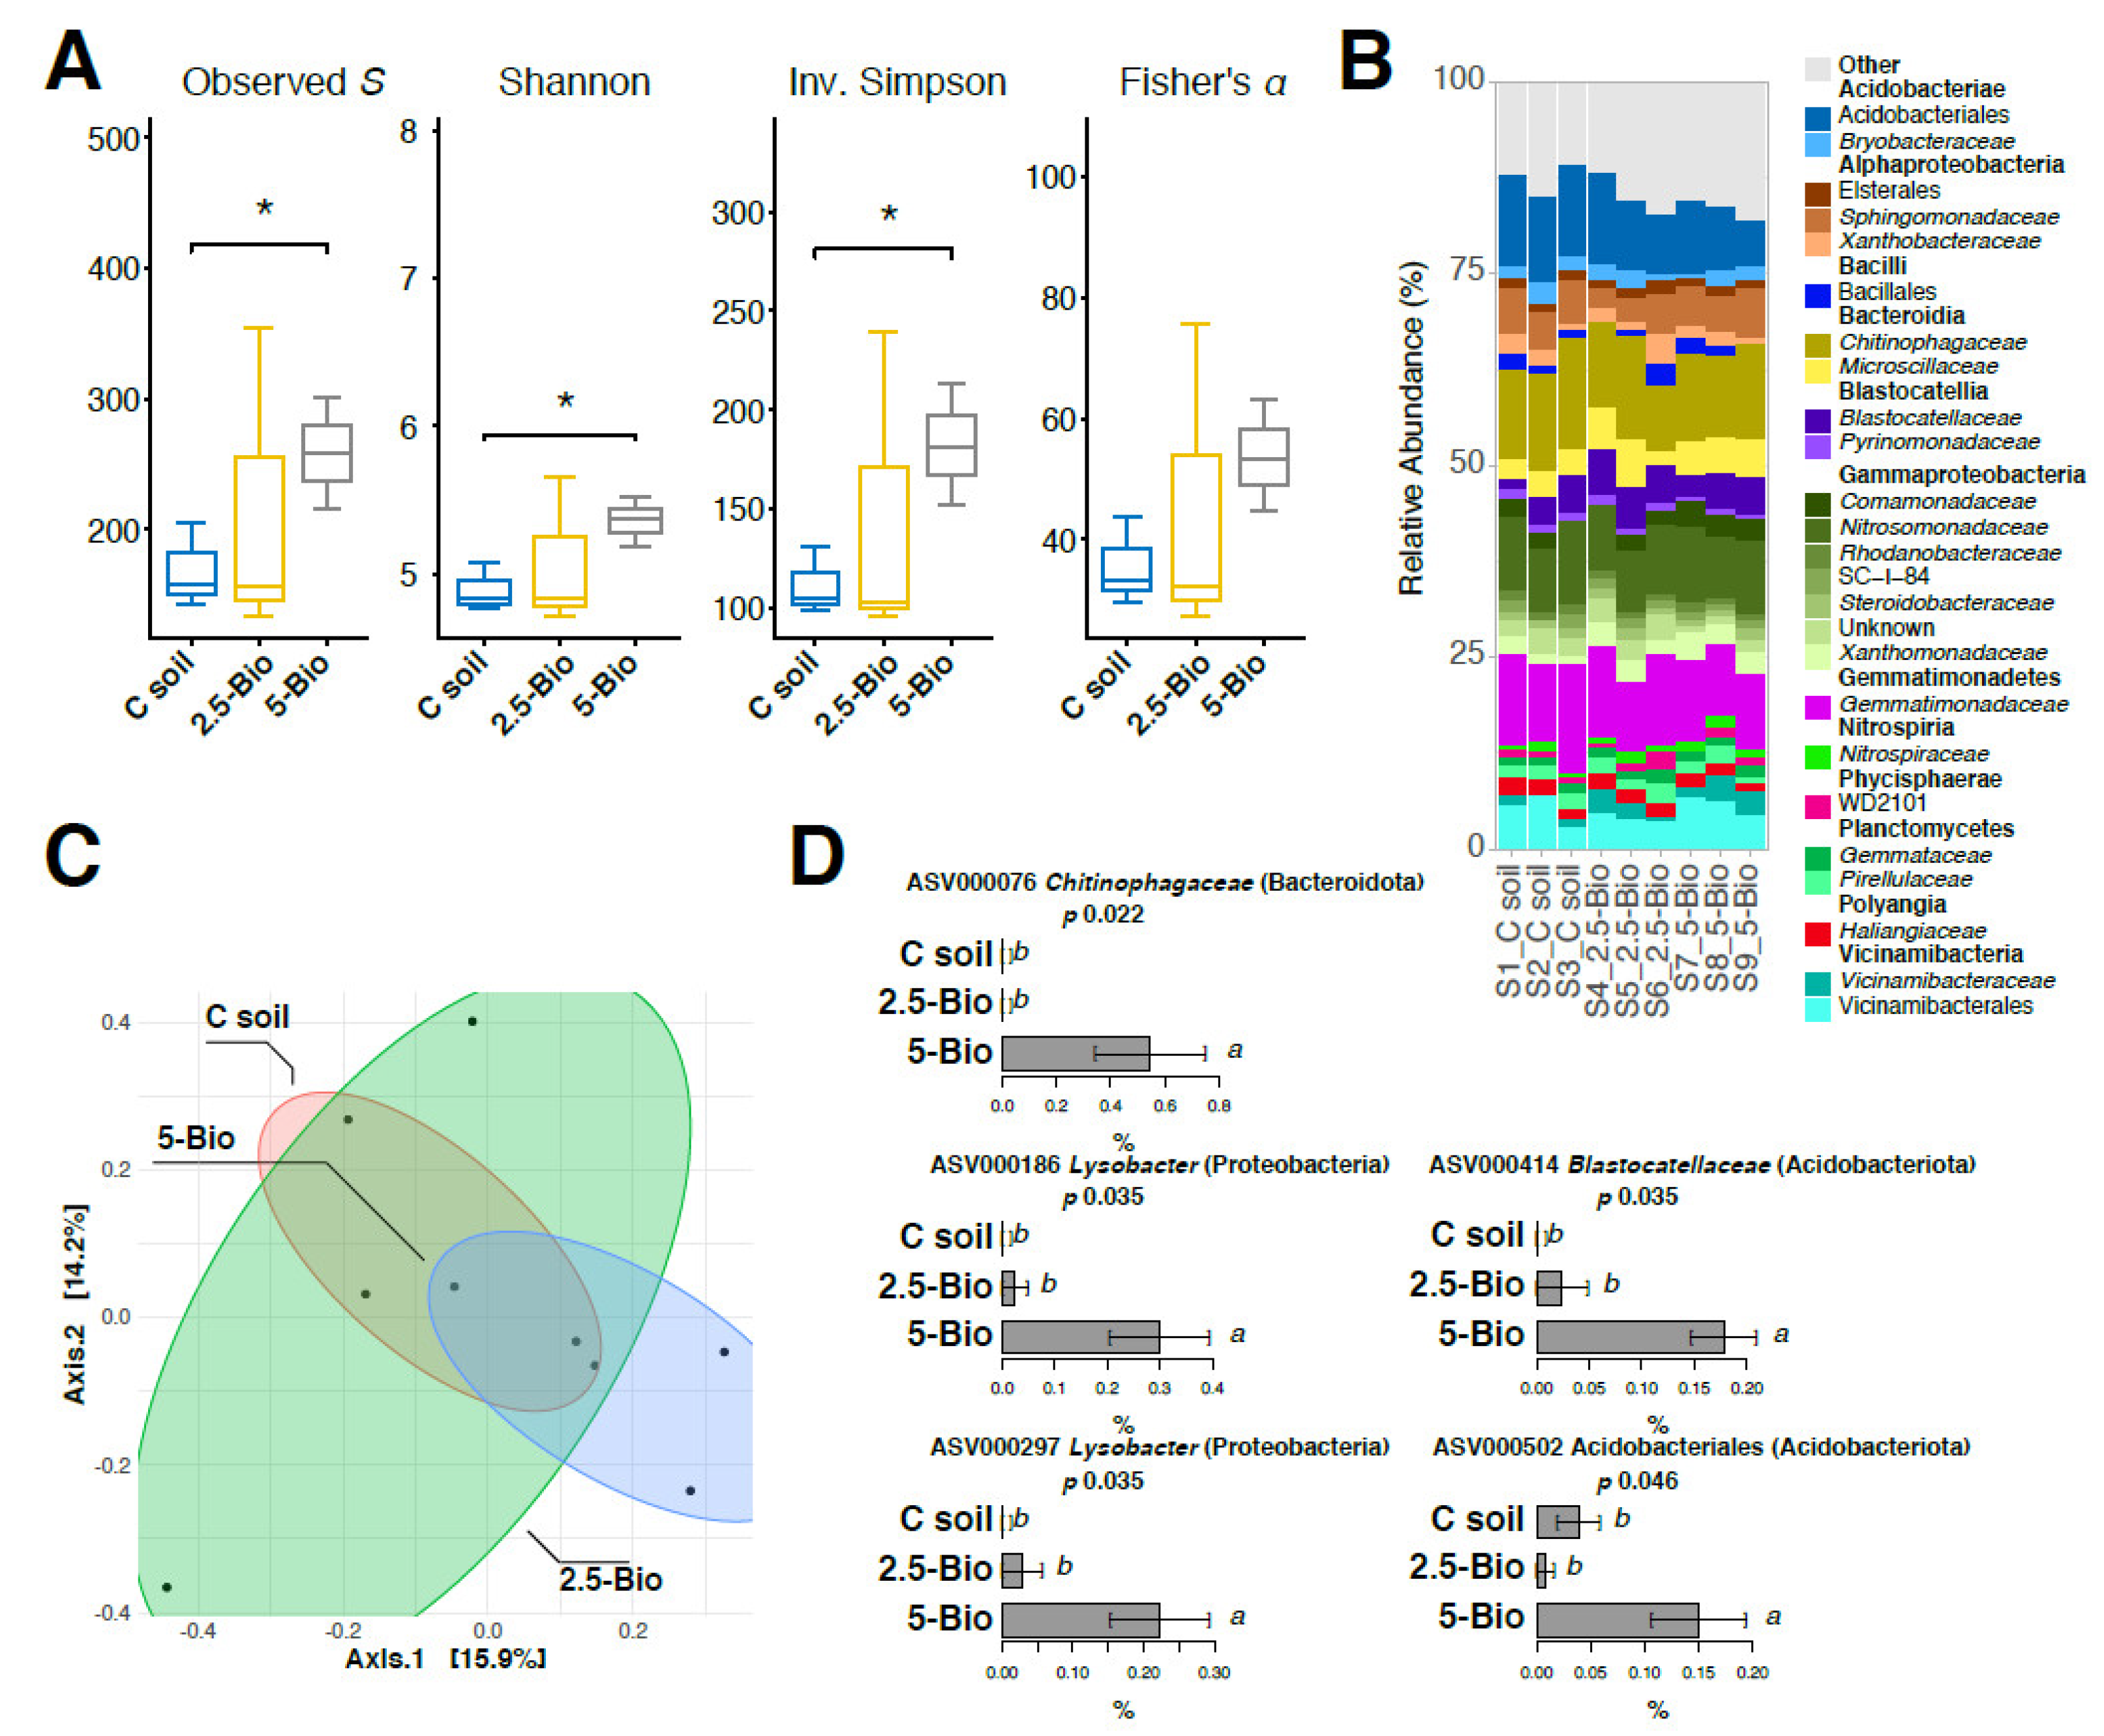
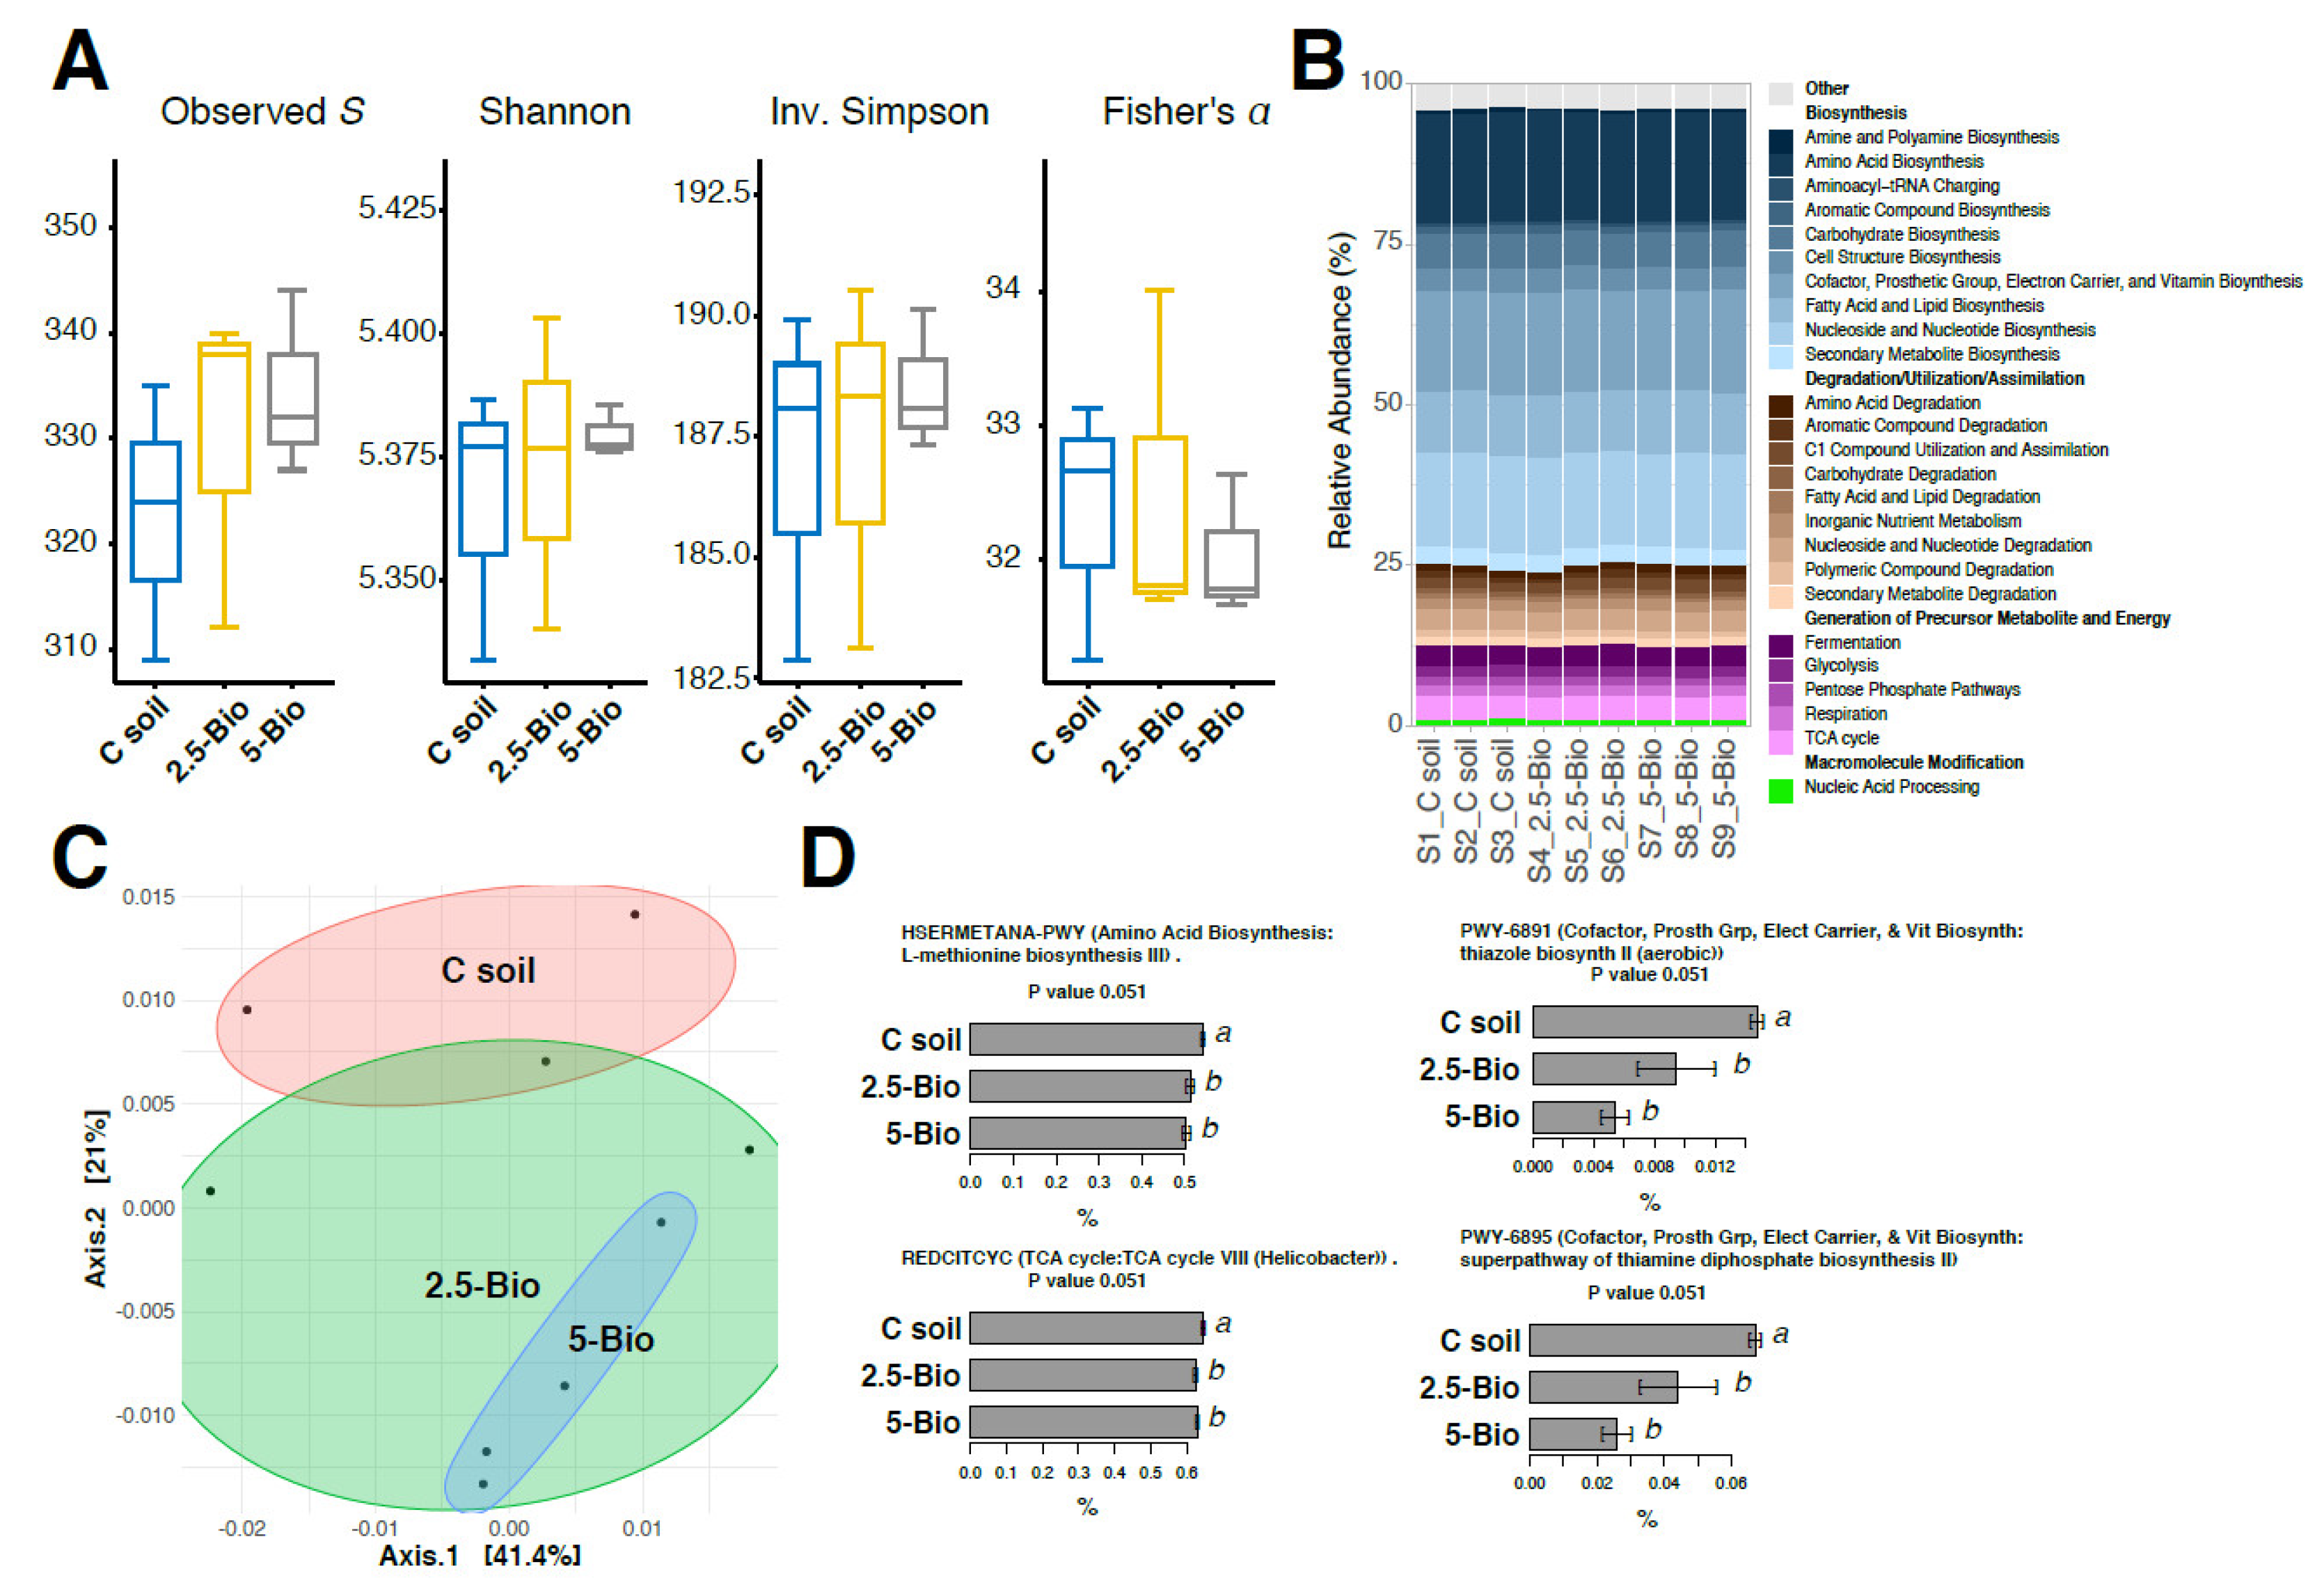
3.4. Influence of Biochar on the Structure of Soil Bacterial Community

ASV matrices were generated with dada2 as described in the materials and methods. Out of a total of 261,009 read pairs, a final amount of 47,618 high-quality sequences passed the quality control process and were used in the analysis (Table S3).
Significant differences between the control soil and 5.0-Bio were observed in α-diversity indices, i.e., the observed richness S, the Shannon, and the inverse Simpson (Figure 4A). In the case of the Fisher’s α index, which is more representative of the highly dominant ASVs, no significant differences resulted from the tests performed. Twelve phyla dominated the samples, with Acidobacteriae, α-Proteobacteria, Bacteroidia, γ-Proteobacteria, Gemmatimonadetes, and Vicinamibacteria being the most dominant among those (Figure 4B). Principal coordinates analysis (PCoA) showed a partial separation of the treatments, mostly due to the 5% biochar treatment (Figure 4C). Differential abundance analysis showed that 5 ASVs were mainly responsible for these structural differences, belonging to Bacteroidota, Proteobacteria, and Acidobacteriota (Figure 4D).
These data indicated a positive influence of biochar, when used at the highest rate, on soil bacterial diversity. This was previously reported by other authors (e.g., [71,72]) and can be attributed to the highest reduction of labile PTE and the highest increase of soil pH, which occurred in 5.0-Bio. Both factors likely contributed to reducing the environmental pressure faced by microbial communities in the polluted soil, allowing for the appearance (and/or increase) of rare or intermediate-dominant bacterial taxa [4,71,73]. The significant abundance of Lysobacter in 5.0-Bio could also be relevant from an environmental perspective, as members of this genus produce antibiotics and can be useful in the control of plant diseases [74].
Statistical analysis of the inferred functions according to Picrust2 output was also performed (Figure 5). The results showed no significant differences in the α-diversity of the functions (Figure 5A). Major identified functional classes included Biosynthesis, Degradation/Utilization/Assimilation, Generation of Precursor Metabolite and Energy, and Macromolecule Modification (Figure 5B). PCoA showed a separation between the control soil and 2.5- and 5.0-Bio, with this latter treatment being more distant (Figure 5C). Pathways showing significant differences were those of the TCA cycle (Helicobacter type) and L-methionine, thiazole, and thiamine diphosphate biosynthesis, with all of them being reduced at an increasing biochar application rate. These data suggest that the observed changes in the bacterial community structure were likely paralleled by functional changes, which could have a role in adapting to changed environmental conditions (e.g., lower labile PTE, increased pH, reduced N and DOC content; Table 1).

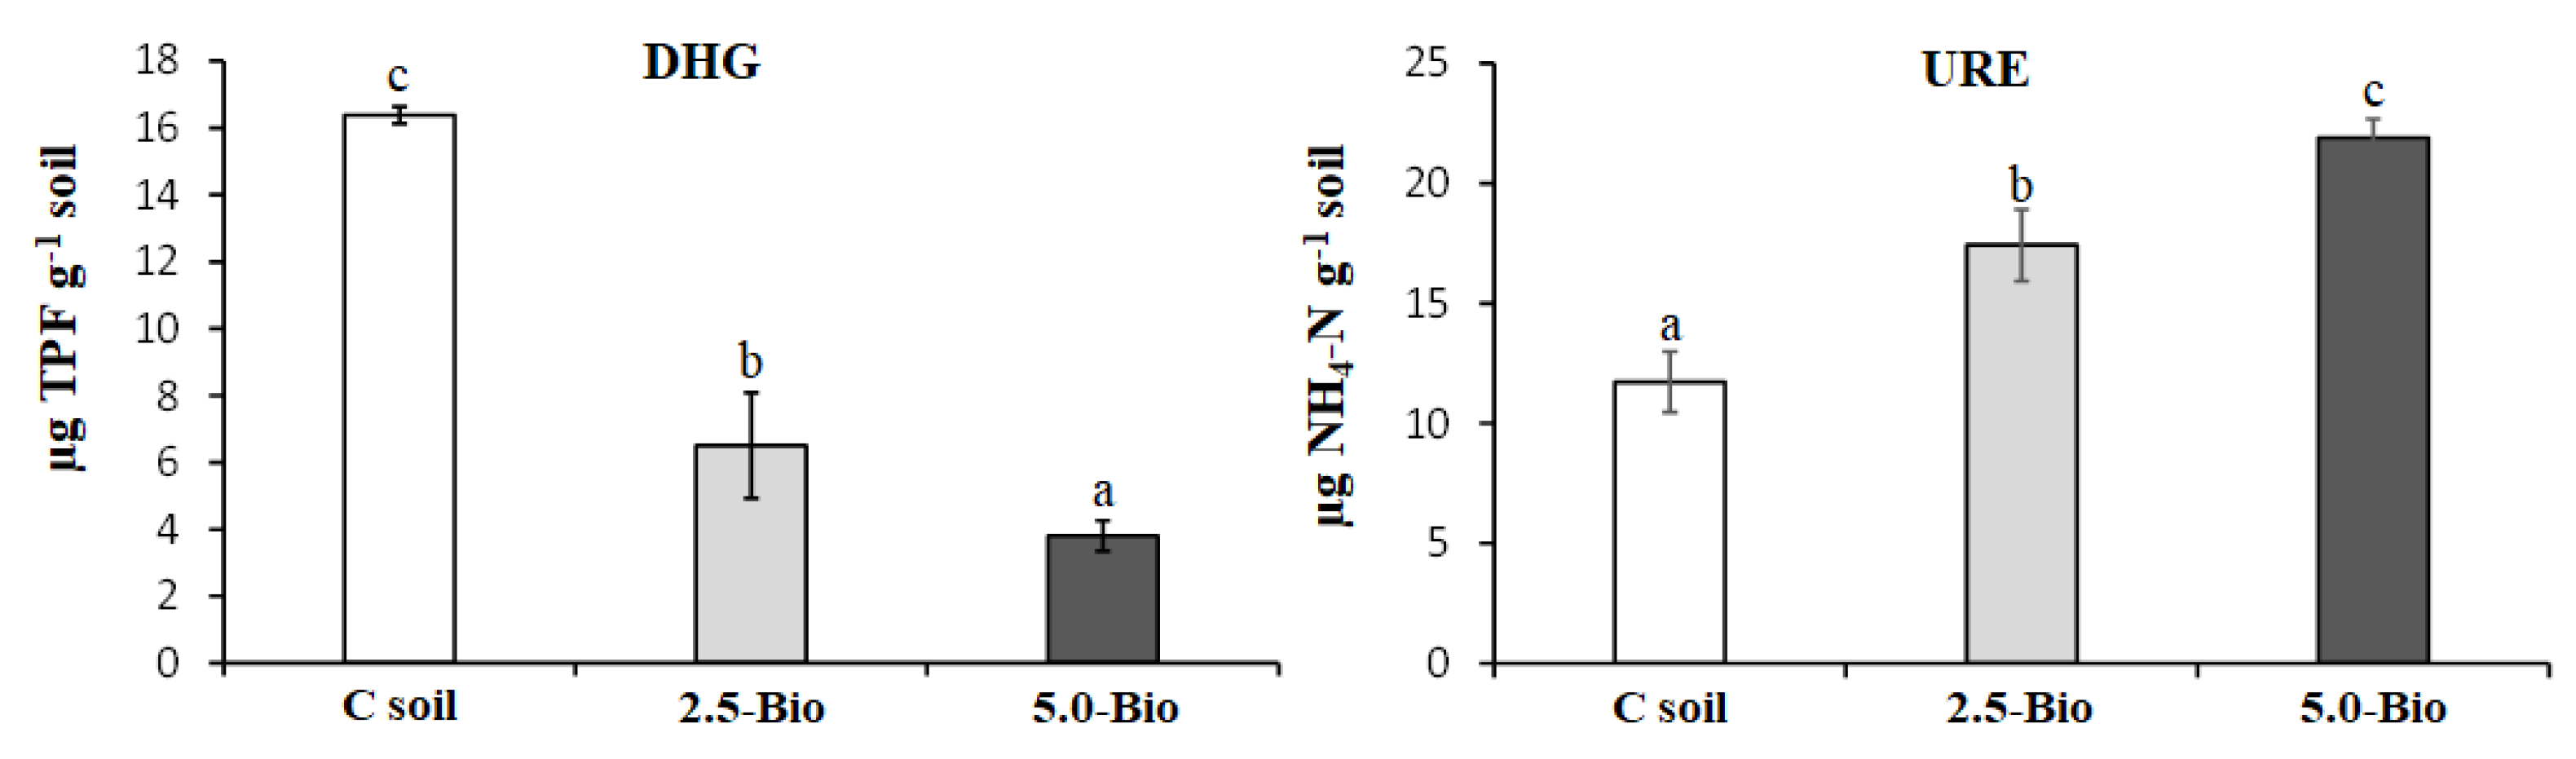
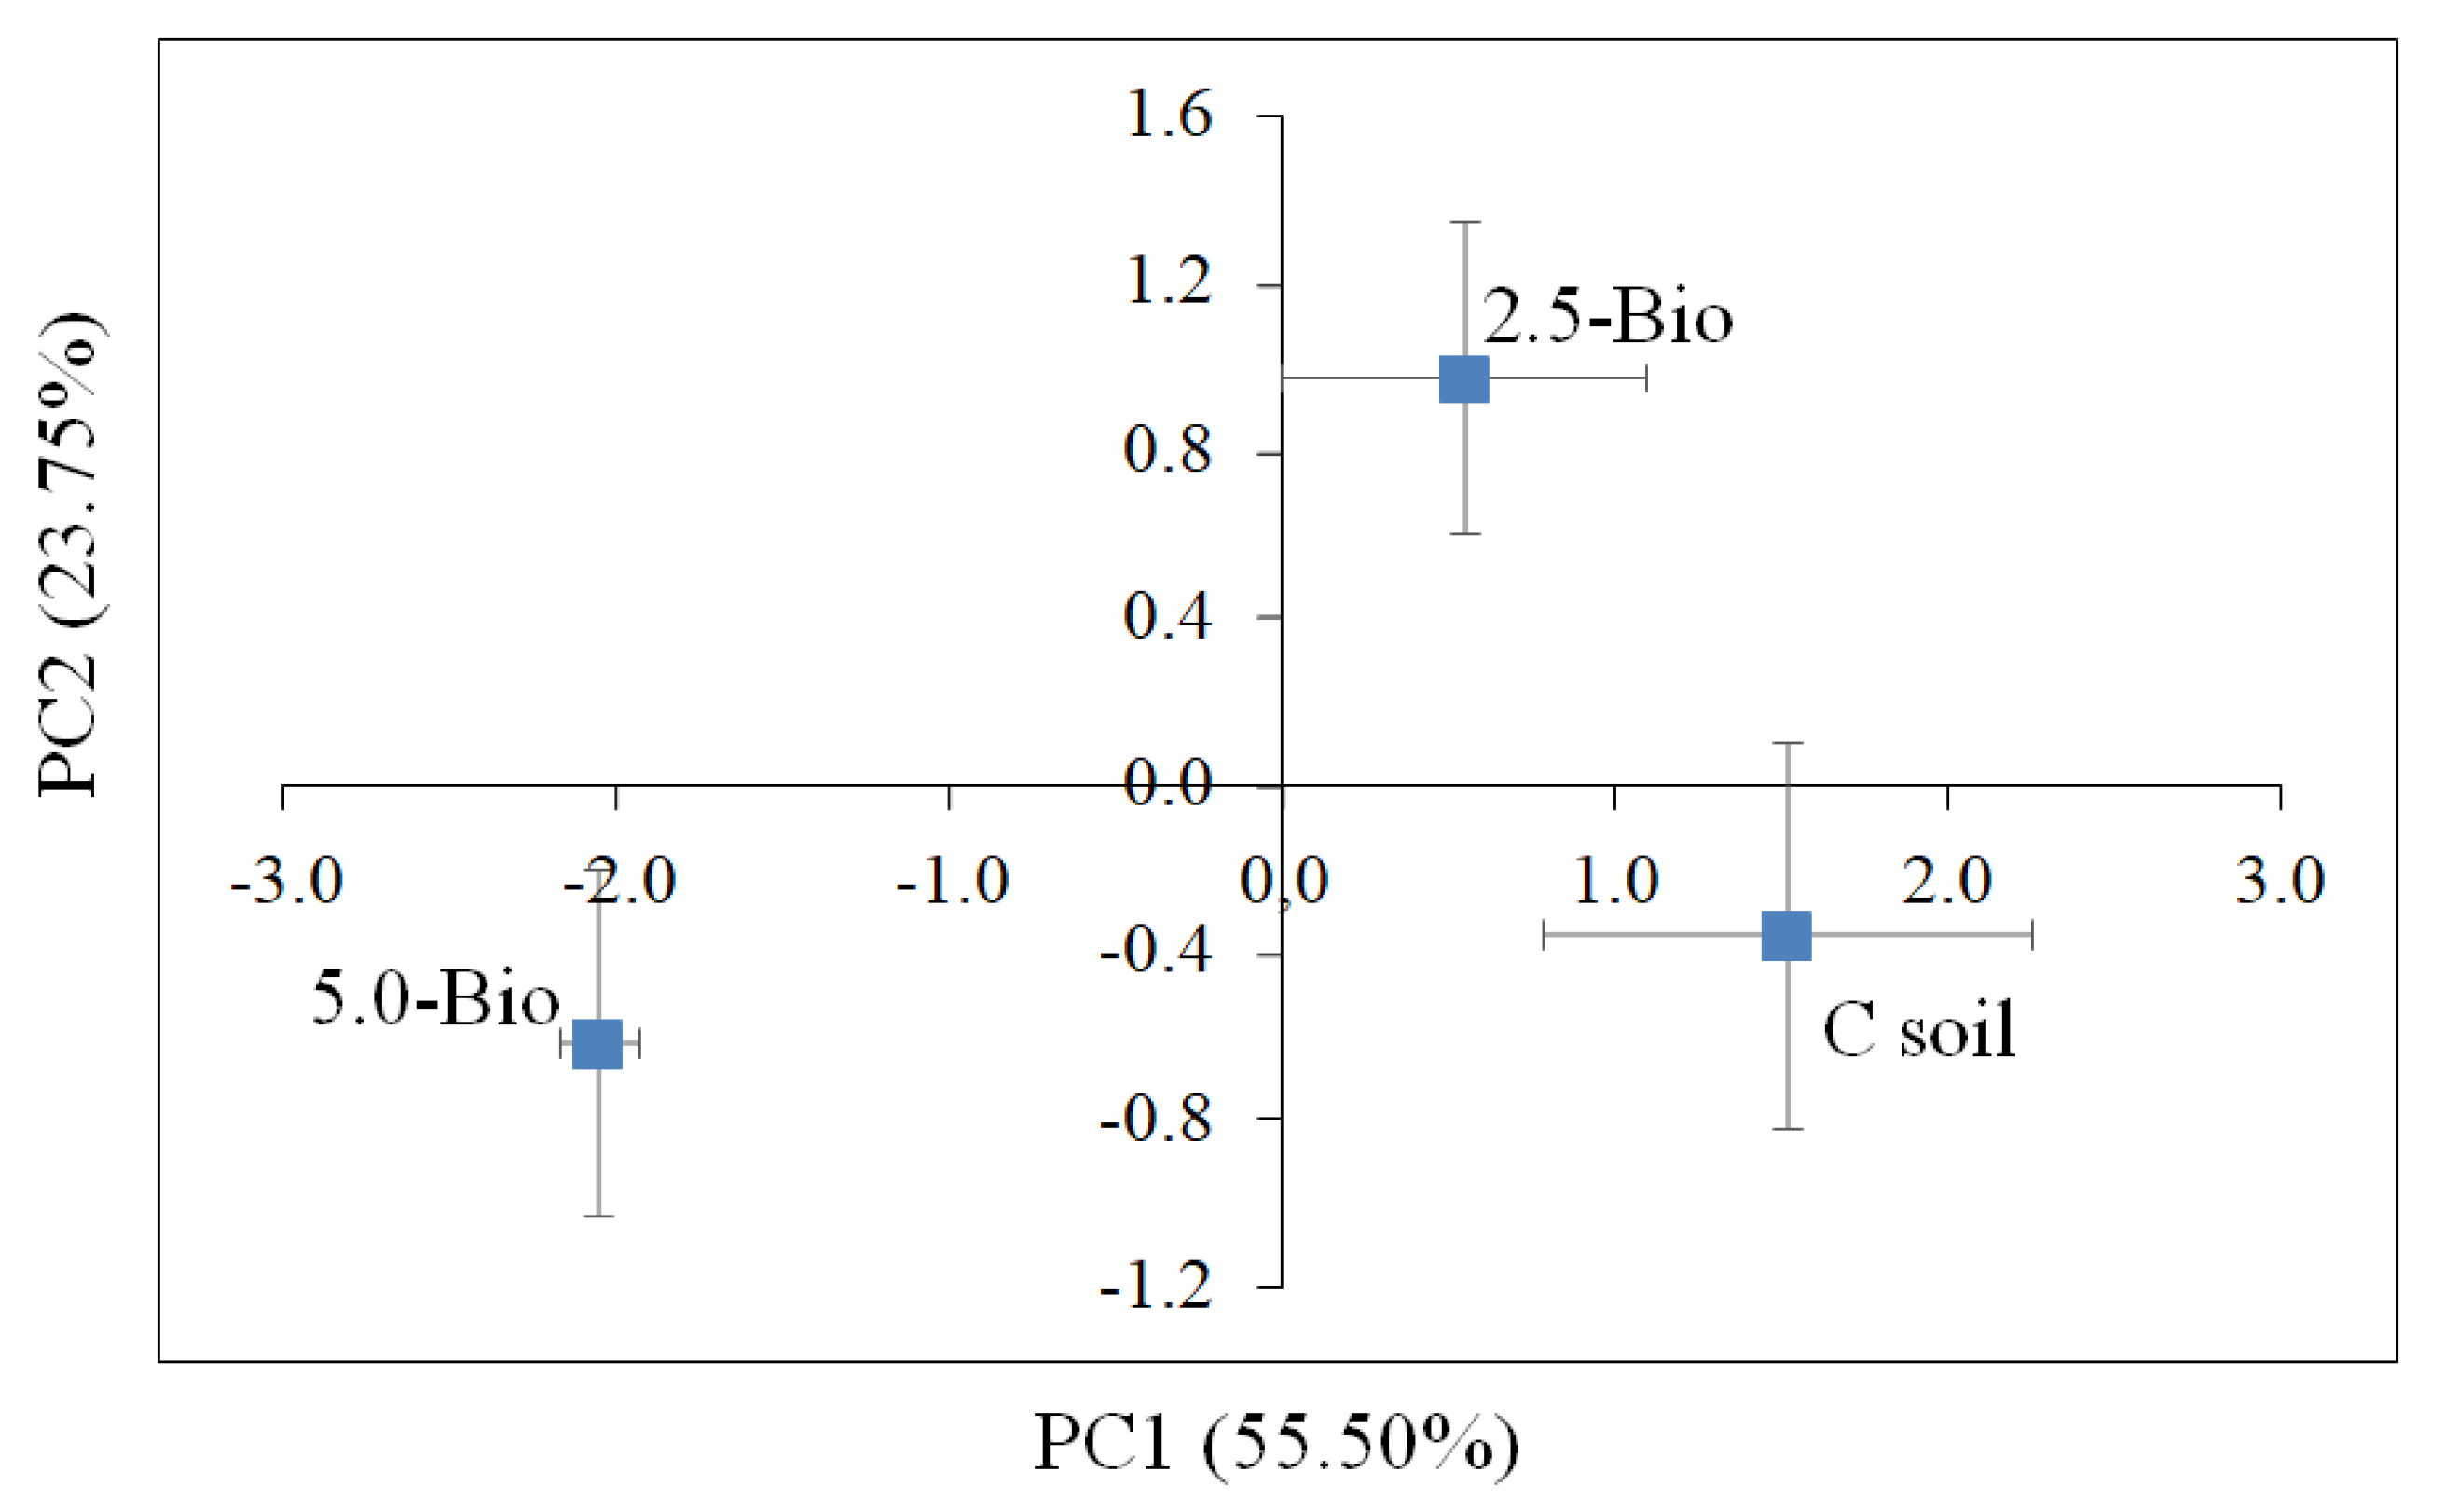
3.5. Influence of Biochar on Soil Enzyme Activities and Community Level Physiological Profile

DHG activity in soil is generally reduced according to the amount of biochar added, while the opposite was found for URE. In particular, DHG reduced by approx. 60 and 75% in 2.5-Bio and 5.0-Bio, respectively, compared to control soil, while in the same soils, URE increased by 48 and 78% (Figure 6). DHG data seemed to indicate a negative biochar effect on soil microbial activity, and this was not obvious since a reduction of labile PTE (which occurred in amended soils; Figure 1) is commonly expected to increase DHG (e.g., [4,17,56]). As mentioned for culturable Pseudomonas spp., this could be due to a reduction of readily usable C sources in DOC (which occurred in amended soils; Table 1) and/or to a direct toxic effect of biochar on soil microorganisms [24,25,32]. PAHs, but also other biotoxic compounds adsorbed and/or accumulated on biochar surfaces, e.g., environmentally persistent free radicals and/or catechol, can be responsible for microbial toxicity phenomena and the consequent reduction of DHG and SMB [32]. Interestingly, the DHG decrease recorded in amended soils could be seen as a confirmation of the reduction of the TCA pathway highlighted by Picrust2 (Figure 5C).
The increased URE activity observed in the amended soils, together with the reduction of total N content (Table 1), was likely indicative of a stimulation of urea hydrolysis due to biochar rather than an increased microbial content in amended soils (i.e., SMB reduced in 2.5- and 5.0-Bio; Figure 3). Such accelerated rate of URE activity in the presence of biochar was recently reported by Zhao et al. [75] and could be partly responsible for the N reduction observed in the amended soils (especially 5.0-Bio; Table 1). The increased URE observed in the amended soils can also be due to an increased microbial synthesis of the enzyme stimulated by a more limited N availability in these soils [76], which in turn can be explained by NO3-N and NH4-N adsorption by biochar, as previously observed [19].
The Biolog CLPP did not show significant differences between control and amended soils according to the AWCD, H’, and Richness values (Figure S1). However, when C source consumption was analyzed by PCA, clear differences appeared. PCA, which accounted for approx. 80% of the total variance (in PC1 and PC2), highlighted substantial differences in the potential catabolic activity of the microbial communities (Figure 7). PC1 (approx. 55% of the total variance) mainly separated the different microbial communities and was correlated with the catabolism of the following substrates: β-methyl-D-glucoside (r = 0.76), D-xylose (r = −0.99), 2-hydroxy benzoic acid (r = 0.78), L-arginine (r = −0.79), and L-threonine (r = 0.77); while PC2 (approx. 24% of the total variance) was mainly correlated with the usage of α-cyclodextrin (r = 0.76), 4-hydroxy benzoic acid (r = 0.78) and α-ketobutyric acid (r = 0.79). These results support a relevant impact of biochar (and of the rate added) on the structure of the soil microbial community, as also highlighted by the molecular analysis (Figure 4 and Figure 5) and by recent studies (e.g., [23,24,28]). Overall, this kind of impact was somewhat expected given the profound changes that biochar exerted on soil physico-chemical properties and nutrient dynamics (e.g., this study and Li et al. [7]). The reduction of labile PTE in the amended soils could also have been co-responsible for the observed changes, e.g., by decreasing the abundance of PTE-resistant strains in treated soils and favoring the appearance of new ones with different catabolic capacities, as previously reported [4,5].

3.6. Influence of Biochar on Plant Growth and PTE Uptake

Plant growth was tested to gain a wider view of the role of biochar in restoring soil fertility in PTE-polluted soils. Interestingly, biochar had a different impact on the growth of triticale and tomato. The height of the former species, together with the respective shoot dry weight, were unaffected by biochar, while substantial increases were recorded for tomato (Figure S2 and Figure 8). The height of tomato plants increased by approx. 2.5- and 2.1-fold for 2.5-Bio and 5.0-Bio, respectively (Figure S2), while shoot dry weight increased by approx. 8.0- and 4.5-fold in the same soils (Figure 8). Moreover, the higher biochar rate had a negative effect on triticale root dry weight, while both rates had a positive effect on the weight of tomato roots, with 2.5-Bio revealing the most effective treatment (Figure 8).
Overall, these data highlight the importance of using different plant species to understand the biochar potentials in the recovery of soil fertility in PTE-polluted soils. Our results suggest a quite different tolerance/sensitivity of the two plants towards labile PTE (as evident from the comparison of plant growth in control soil) and a different adaptation to soil chemical characteristics, e.g., pH and total N. Tomato yield increased dramatically when labile PTE was reduced in the amended soils, while triticale did not (Figure 8), likely suggesting a higher PTE tolerance of the latter species that allowed substantial plant growth in the control soil. This is probably why triticale, likewise other grass species, has been used in different phytoremediation studies (e.g., [77,78,79,80]). Furthermore, S. lycopersicum is very sensitive to soil acidity (and soluble Al3+), and the pH increase recorded in 2.5- and 5.0-Bio could have contributed to improving its growth in the amended soils [81]. Finally, the yield reduction observed for both plant species in 5.0-Bio compared to 2.5-Bio was likely due to excessive nutrient adsorption by biochar, which reduced plant growth, and/or to other biochar toxicity effects previously reported [24,25]. In the first case, combining biochar with fertilizers and/or using biochar enriched with nutrients could mitigate the nutrient depletion effects arising from excessive biochar rates [24]; in the second case, phytotoxic effects can be avoided using lower biochar amounts, e.g., ≤2.5% [25].
Also, biochar influence on PTE uptake differed depending on the plant species: the concentration of Pb and Cd in triticale roots increased in the amended soils (up to 36 and 100%, respectively, vs. control), while that of Zn was reduced (up to 76% vs. control; Table 2). These results could be explained by a higher and/or altered root activity in the amended soils (e.g., increased secretion of siderophore, organic acids, and other root exudates), which led to enhanced Pb and Cd mobilization from the soil and their subsequent uptake [79], as well as a reduced Zn uptake (which was also correlated with the reduction of labile Zn in the amended soils; Figure 1).
With regards to tomato, PTE uptake by roots was reduced in 5.0-Bio vs. 2.5-Bio (Table 2) in agreement with labile PTE in these soils (Figure 1; control root yield was not enough to quantify PTE uptake). Differently from triticale, these data support a clear positive influence of biochar on the fertility recovery of PTE-polluted soils, as highlighted elsewhere [5,18].
In both triticale and tomato plants, PTE was largely accumulated in the roots rather than the shoots (Table 2). Overall, biochar impact on PTE uptake by shoots was more limited in the case of triticale and, for both plants, confirmed a better effectiveness of 2.5-Bio rather than 5.0-Bio in reducing Cd and Pb concentrations in the aerial part.

4. Conclusions

The results from this study showed that softwood biochar added at 2.5 and 5.0% rates was able to significantly reduce labile (and potentially bioavailable) Pb, Cd, and Zn in a PTE-polluted mining soil and to increase selected fertility parameters (e.g., soil pH, available P, and CEC). This is relevant from a practical viewpoint since it suggests reduced ecotoxicological effects in amended soils as well as increased functionality. However, soil microbiological and biochemical data did not support this view, with the exception of bacterial α-diversity (which increased in 5.0-Bio vs. control) and urease activity (which increased in both 2.5- and 5.0-Bio vs. control). These results raise some questions about the overall biochar impact on soil functionality, or at least the ideal amount that should be added to any soil. In this regard, 2.5-Bio appeared to be the most effective treatment able to combine soil chemical restoration with a limited impact on soil microorganisms (e.g., on Pseudomonas ssp.) and biochemical activity (DHG was repressed but URE was stimulated by 2.5-Bio). This was supported by plant growth data, which showed reduced tomato and triticale yields for 5.0-Bio vs. 2.5-Bio, likely due to excessive nutrient adsorption by biochar. Overall, our results showed that chemical data alone cannot be sufficient to predict the effect of biochar on soil functionality, while the measurement of several (micro)biological proxies and the use of different bioindicators, such as different plant species, can be helpful. Given the significant role of plants in shaping rhizosphere microbial communities and their activities (e.g., through their root exudates), further studies should focus on the impact of endemic plants on the microbial abundance and diversity in biochar-amended polluted soils.

Supplementary Materials

The following supporting information can be downloaded at: https://www.mdpi.com/article/10.3390/soilsystems7040096/s1, Figure S1: AWCD, H’, and Richness values of contaminated (C soil) and amended soils (2.5-Bio or 5.0-Bio); Figure S2: height of triticale and tomato plants grown in contaminated (C soil) and amended soils (2.5-Bio or 5.0-Bio); Table S1: selected chemical properties of the biochar used in this study; Table S2: statistical analysis adopted for each of the investigated traits; Table S3: quality control (QC) of the received sequence data.

Author Contributions

Conceptualization, P.C. and G.G.; methodology, M.G., P.C., M.V.P., S.D., A.C., N.P.M., S.V. and G.G; formal analysis, M.G, M.V.P., A.C., N.P.M. and S.V.; investigation, P.C., M.V.P., S.D. and G.G.; resources, G.G.; data curation, M.G., M.V.P., S.D., A.C., N.P.M. and S.V.; writing—original draft preparation, G.G.; writing—review and editing, P.C. and S.V. All authors have read and agreed to the published version of the manuscript.

Funding

This research was supported by the Agritech National Research Center and received funding from the European Union Next-GenerationEU (PIANO NAZIONALE DI RIPRESA E RESILIENZA (PNRR)—MISSIONE 4 COMPONENTE 2, INVESTIMENTO 1.4—D.D. 1032, 17 June 2022, CN00000022). This manuscript reflects only the authors’views and opinions; neither the European Union nor the European Commission can be considered responsible for them.

Institutional Review Board Statement

Not applicable.

Informed Consent Statement

Not applicable.

Data Availability Statement

The data presented in this study are available on request from the corresponding author.

Acknowledgments

The authors would like to thank the staff of UniNuoro (M. Biagioli, R. Mattu, and G. Bonamici) for technical assistance and support.

Conflicts of Interest

The authors declare no conflict of interest.

References

  1. Aponte, H.; Meli, P.; Butler, B.; Paolini, J.; Matus, F.; Merino, C.; Cornejo, P.; Kuzyakov, Y. Meta-analysis of heavy metal effects on soil enzyme activities. Sci. Total Environ. 2020, 737, 139744. [Google Scholar] [CrossRef] [PubMed]
  2. Diquattro, S.; Garau, G.; Mangia, N.P.; Drigo, B.; Lombi, E.; Vasileiadis, S.; Castaldi, P. Mobility and potential bioavailability of antimony in contaminated soils: Short-term impact on microbial community and soil biochemical functioning. Ecotoxicol. Environ. Saf. 2020, 196, 110576. [Google Scholar] [CrossRef] [PubMed]
  3. Yu, B.; Lu, X.; Wang, L.; Liang, T.; Fan, X.; Yang, Y.; Lei, K.; Zuo, L.; Fan, P.; Bolan, N.; et al. Potentially toxic elements in surface fine dust of residence communities in valley industrial cities. Environ. Pollut. 2023, 327, 121523. [Google Scholar] [CrossRef] [PubMed]
  4. Garau, G.; Porceddu, A.; Sanna, M.; Silvetti, M.; Castaldi, P. Municipal solid wastes as a resource for environmental recovery: Impact of water treatment residuals and compost on the microbial and biochemical features of As and trace metal-polluted soils. Ecotoxicol. Environ. Saf. 2019, 174, 445–454. [Google Scholar] [CrossRef] [PubMed]
  5. Garau, G.; Roggero, P.P.; Diquattro, S.; Garau, M.; Pinna, M.V.; Castaldi, P. Innovative amendments derived from industrial and municipal wastes enhance plant growth and soil functions in potentially toxic elements-polluted environments. Ital. J. Agron. 2021, 16, 1777. [Google Scholar] [CrossRef]
  6. Kumar, A.; Bhattacharya, T.; Shaikh, W.A.; Roy, A.; Chakraborty, S.; Vithanage, M.; Biswas, J.K. Multifaceted applications of biochar in environmental management: A bibliometric profile. Biochar 2023, 5, 11. [Google Scholar] [CrossRef]
  7. Li, H.; Dong, X.; da Silva, E.B.; de Oliveira, L.M.; Chen, Y.; Ma, L.Q. Mechanisms of metal sorption by biochars: Biochar characteristics and modifications. Chemosphere 2017, 178, 466–478. [Google Scholar] [CrossRef]
  8. Pinna, M.V.; Lauro, G.P.; Diquattro, S.; Garau, M.; Senette, C.; Castaldi, P.; Garau, G. Softwood-derived biochar as a green material for the recovery of environmental media contaminated with potentially toxic elements. Water Air Soil Pollut. 2022, 233, 152. [Google Scholar] [CrossRef]
  9. Ghorbani, M.; Amirahmadi, E.; Konvalina, P.; Moudrý, J.; Bárta, J.; Kopecký, M.; Teodorescu, R.I.; Bucur, R.D. Comparative Influence of Biochar and Zeolite on Soil Hydrological Indices and Growth Characteristics of Corn (Zea mays L.). Water 2022, 14, 3506. [Google Scholar] [CrossRef]
  10. Lomaglio, T.; Hattab-Hambli, N.; Bret, A.; Miard, F.; Trupiano, D.; Scippa, G.S.; Motelica-Heino, M.; Bourgerie, S.; Morabito, D. Effect of biochar amendments on the mobility and (bio) availability of As, Sb and Pb in a contaminated mine technosol. J. Geochem. Explor. 2017, 182, 138–148. [Google Scholar] [CrossRef]
  11. Shaheen, S.M.; Mosa, A.; Natasha; Jeyasundar, P.G.S.A.; Hassan, N.E.E.; Yang, X.; Antoniadis, V.; Li, R.; Wang, J.; Zhang, T.; et al. Pros and Cons of Biochar to Soil Potentially Toxic Element Mobilization and Phytoavailability: Environmental Implications. Earth Syst. Environ. 2023, 7, 321–345. [Google Scholar] [CrossRef]
  12. Sachdeva, S.; Kumar, R.; Sahoo, P.K.; Nadda, A.K. Recent advances in biochar amendments for immobilization of heavy metals in an agricultural ecosystem: A systematic review. Environ. Pollut. 2023, 319, 120937. [Google Scholar] [CrossRef]
  13. Yuan, C.; Gao, B.; Peng, Y.; Gao, X.; Fan, B.; Chen, Q. A meta-analysis of heavy metal bioavailability response to biochar aging: Importance of soil and biochar properties. Sci. Total Environ. 2021, 756, 144058. [Google Scholar] [CrossRef] [PubMed]
  14. Zama, E.F.; Reid, B.J.; Arp, H.P.H.; Sun, G.X.; Yuan, H.Y.; Zhu, Y.G. Advances in research on the use of biochar in soil for remediation: A review. J. Soils Sediments 2018, 18, 2433–2450. [Google Scholar] [CrossRef]
  15. Beesley, L.; Moreno-Jiménez, E.; Gomez-Eyles, J.L. Effects of biochar and greenwaste compost amendments on mobility, bioavailability and toxicity of inorganic and organic contaminants in a multi-element polluted soil. Environ. Pollut. 2010, 158, 2282–2287. [Google Scholar] [CrossRef]
  16. Beesley, L.; Dickinson, N. Carbon and trace element fluxes in the pore water of an urban soil following greenwaste compost, woody and biochar amendments, inoculated with the earthworm Lumbricus terrestris. Soil Biol. Biochem. 2011, 43, 188–196. [Google Scholar] [CrossRef]
  17. Abou Jaoude, L.; Castaldi, P.; Nassif, N.; Pinna, M.V.; Garau, G. Biochar and compost as gentle remediation options for the recovery of trace elements-contaminated soils. Sci. Total Environ. 2020, 711, 134511. [Google Scholar] [CrossRef]
  18. Garau, M.; Garau, G.; Sizmur, T.; Coole, S.; Castaldi, P.; Pinna, M.V. Biochar and Eisenia fetida (Savigny) promote sorghum growth and the immobilization of potentially toxic elements in contaminated soils. Appl. Soil Ecol. 2023, 182, 104697. [Google Scholar] [CrossRef]
  19. Manzano, R.; Diquattro, S.; Roggero, P.P.; Pinna, M.V.; Garau, G.; Castaldi, P. Addition of softwood biochar to contaminated soils decreases the mobility, leachability and bioaccesibility of potentially toxic elements. Sci. Total Environ. 2020, 739, 139946. [Google Scholar] [CrossRef]
  20. El-Naggar, A.; Shaheen, S.M.; Ok, Y.S.; Rinklebe, J. Biochar affects the dissolved and colloidal concentrations of Cd, Cu, Ni, and Zn and their phytoavailability and potential mobility in a mining soil under dynamic redox-conditions. Sci. Total Environ. 2018, 624, 1059–1071. [Google Scholar] [CrossRef]
  21. Lahlali, R.; Ibrahim, D.S.; Belabess, Z.; Roni, Z.K.; Radouane, N.; Vicente, C.S.; Menéndez, E.; Mokrini, F.; Barka, E.A.; Mota, M.G.D.M.E.; et al. High-throughput molecular technologies for unraveling the mystery of soil microbial community: Challenges and future prospects. Heliyon 2021, 7, e08142. [Google Scholar] [CrossRef]
  22. Li, H.; Zhao, H.M.; Purchase, D.; Chen, X.W. Microbial communities and functions contribute to plant performance under various stresses. Front. Microbiol. 2022, 13, 992909. [Google Scholar] [CrossRef]
  23. Zhao, Y.; Wang, X.; Yao, G.; Lin, Z.; Xu, L.; Jiang, Y.; Jin, Z.; Shan, S.; Ping, L. Advances in the effects of biochar on microbial ecological function in soil and crop quality. Sustainability 2022, 14, 10411. [Google Scholar] [CrossRef]
  24. Brtnicky, M.; Datta, R.; Holatko, J.; Bielska, L.; Gusiatin, Z.M.; Kucerik, J.; Hammerschmiedt, T.; Danish, S.; Radziemska, M.; Mravcova, L.; et al. A critical review of the possible adverse effects of biochar in the soil environment. Sci. Total Environ. 2021, 796, 148756. [Google Scholar] [CrossRef]
  25. Godlewska, P.; Ok, Y.S.; Oleszczuk, P. The dark side of black gold: Ecotoxicological aspects of biochar and biochar-amended soils. J. Hazard. Mater. 2021, 403, 123833. [Google Scholar] [CrossRef] [PubMed]
  26. Anders, E.; Watzinger, A.; Rempt, F.; Kitzler, B.; Wimmer, B.; Zehetner, F.; Stahr, K.; Zechmeister-Boltenstern, S.; Soja, G. Biochar affects the structure rather than the total biomass of microbial communities in temperate soils. Agric. Food Sci. 2013, 22, 404–423. [Google Scholar] [CrossRef]
  27. Andrés, P.; Rosell-Melé, A.; Colomer-Ventura, F.; Denef, K.; Cotrufo, M.F.; Riba, M.; Alcañiz, J.M. Belowground biota responses to maize biochar addition to the soil of a Mediterranean vineyard. Sci. Total Environ. 2019, 660, 1522–1532. [Google Scholar] [CrossRef] [PubMed]
  28. Wang, X.; Song, D.; Liang, G.; Zhang, Q.; Ai, C.; Zhou, W. Maize biochar addition rate influences soil enzyme activity and microbial community composition in a fluvo-aquic soil. Appl. Soil Ecol. 2015, 96, 265–272. [Google Scholar] [CrossRef]
  29. Domene, X.; Hanley, K.; Enders, A.; Lehmann, J. Short-term mesofauna responses to soil additions of corn stover biochar and the role of microbial biomass. Appl. Soil Ecol. 2015, 89, 10–17. [Google Scholar] [CrossRef]
  30. Dempster, D.N.; Gleeson, D.B.; Solaiman, Z.M.; Jones, D.L.; Murphy, D.V. Decreased soil microbial biomass and nitrogen mineralisation with Eucalyptus biochar addition to a coarse textured soil. Plant Soil 2012, 354, 311–324. [Google Scholar] [CrossRef]
  31. Elzobair, K.A.; Stromberger, M.E.; Ippolito, J.A.; Lentz, R.D. Contrasting effects of biochar versus manure on soil microbial communities and enzyme activities in an Aridisol. Chemosphere 2016, 142, 145–152. [Google Scholar] [CrossRef]
  32. Xiang, L.; Liu, S.; Ye, S.; Yang, H.; Song, B.; Qin, F.; Shen, M.; Tan, C.; Zeng, G.; Tan, X. Potential hazards of biochar: The negative environmental impacts of biochar applications. J. Hazard. Mater. 2021, 420, 126611. [Google Scholar] [CrossRef]
  33. El-Naggar, A.; El-Naggar, A.H.; Shaheen, S.M.; Sarkar, B.; Chang, S.X.; Tsang, D.C.; Rinklebe, J.; Ok, Y.S. Biochar composition-dependent impacts on soil nutrient release, carbon mineralization, and potential environmental risk: A review. J. Environ. Manag. 2019, 241, 458–467. [Google Scholar] [CrossRef] [PubMed]
  34. Novak, J.M.; Busscher, W.J.; Watts, D.W.; Laird, D.A.; Ahmedna, M.A.; Niandou, M.A.S. Short-term CO2 mineralization after additions of biochar and switchgrass to a Typic Kandiudult. Geoderma 2010, 154, 281–288. [Google Scholar] [CrossRef]
  35. Garau, M.; Castaldi, P.; Patteri, G.; Roggero, P.P.; Garau, G. Evaluation of Cynara cardunculus L. and municipal solid waste compost for aided phytoremediation of multi potentially toxic element–contaminated soils. Environ. Sci. Pollut. Res. 2021, 28, 3253–3265. [Google Scholar] [CrossRef] [PubMed]
  36. Lebrun, M.; Nandillon, R.; Miard, F.; Bourgerie, S.; Morabito, D. Biochar assisted phytoremediation for metal(loid) contaminated soils. In Assisted Phytoremediation; Pandey, V., Ed.; Elsevier: Amsterdam, The Netherlands, 2022; pp. 101–130. [Google Scholar] [CrossRef]
  37. Vacca, A.; Bianco, M.R.; Murolo, M.; Violante, P. Heavy metals in contaminated soils of the rio sitzerri floodplain (Sardinia, Italy): Characterization and impact on pedodiversity. Land Degrad. Develop. 2012, 23, 350–364. [Google Scholar] [CrossRef]
  38. Manca, P.P.; Massacci, G.; Mercante, C. Environmental management and metal recovery: Re-processing of mining waste at Montevecchio site (SW Sardinia). In 18th International Symposium on Environmental Issues and Waste Management in Energy and Mineral Production; Widzyk-Capehart, E., Hekmat, A., Singhal, R., Eds.; Springer Nature: Cham, Switzerland, 2019. [Google Scholar] [CrossRef]
  39. Tan, K.H. Soil Sampling, Preparation, and Analysis, 2nd ed.; CRC Press: Boca Raton, FL, USA, 2005; pp. 169–170. [Google Scholar]
  40. Lomaglio, T.; Hattab-Hambli, N.; Miard, F.; Lebrun, M.; Nandillon, R.; Trupiano, D.; Scippa, G.S.; Gauthier, A.; Motelica-Heino, M.; Bourgerie, S.; et al. Cd, Pb, and Zn mobility and (bio)availability in contaminated soils from a former smelting site amended with biochar. Environ. Sci. Pollut. Res. 2018, 25, 25744–25756. [Google Scholar] [CrossRef]
  41. Gazzetta Ufficiale Della Repubblica Italiana n. 84 del 10 aprile 2002. Metodi Ufficiali di Analisi Chimica dei Suoli. DM 11 Maggio 1992, suppl. G.U. 121, 25 maggio 1992. [Official Gazette of the Italian Republic No 84 of 10 April 2002, 2002. Official Methods of Chemical Analysis of Soils. DM 11 Maggio 1992, Suppl. G.U. 121, 25 May 1992]. Available online: https://www.gazzettaufficiale.it/eli/id/1992/05/25/092A2322/sg (accessed on 29 August 2023).
  42. Basta, N.; Gradwohl, R. Estimation of Cd, Pb and Zn bioavailability in smelter-contaminated soils by a sequential extraction procedure. J. Soil Contam. 2020, 9, 149–164. [Google Scholar] [CrossRef]
  43. Nunan, N.; Morgan, M.A.; Herlihy, M. Ultraviolet absorbance (280 nm) of compounds released from soil during chloroform fumigation as an estimate of the microbial biomass. Soil Biol. Biochem. 1998, 30, 1599–1603. [Google Scholar] [CrossRef]
  44. ISO 14240-2 Soil Quality—Determination of Soil Microbial Biomass—Part 2: Fumigation-Extraction Method. 1997. Available online: https://www.iso.org/obp/ui/#iso:std:iso:14240:-2:ed-1:v1:en (accessed on 20 August 2023).
  45. Walters, W.; Hyde, E.R.; Berg-Lyons, D.; Ackermann, G.; Humphrey, G.; Parada, A.; Gilbert, J.A.; Jansson, J.K.; Caporaso, J.G.; Fuhrman, J.A.; et al. Improved bacterial 16S rRNA gene (V4 and V4-5) and fungal internal transcribed spacer marker gene primers for microbial community surveys. mSystems 2016, 1, e00009-15. [Google Scholar] [CrossRef]
  46. Comeau, A.M.; Douglas, G.M.; Langille, M.G.I. Microbiome helper: A custom and streamlined workflow for microbiome research. mSystems 2017, 2, e00127-16. [Google Scholar] [CrossRef] [PubMed]
  47. Callahan, B.J.; McMurdie, P.J.; Rosen, M.J.; Han, A.W.; Johnson, A.J.A.; Holme, S.P. DADA2: High-resolution sample inference from Illumina amplicon data. Nat. Methods 2016, 13, 581–583. [Google Scholar] [CrossRef] [PubMed]
  48. R Core Team. R: A Language and Environment for Statistical Computing, Reference Index Version 4.3.1. R Foundation. 2023. Available online: https://www.r-project.org/ (accessed on 20 August 2023).
  49. Wang, Q.; Garrity, G.M.; Tiedje, J.M.; Cole, J.R. Naive Bayesian classifier for rapid assignment of rRNA sequences into the new bacterial taxonomy. Appl. Environ. Microbiol. 2007, 73, 5261–5267. [Google Scholar] [CrossRef] [PubMed]
  50. Yilmaz, P.; Parfrey, L.W.; Yarza, P.; Gerken, J.; Pruesse, E.; Quast, C.; Schweer, T.; Peplies, J.; Ludwig, W.; Glöckner, F.O. The SILVA and “All-species Living Tree Project (LTP)” taxonomic frameworks. Nucleic Acids Res. 2014, 42, D643–D648. [Google Scholar] [CrossRef] [PubMed]
  51. Douglas, G.M.; Maffei, V.J.; Zaneveld, J.R.; Yurgel, S.N.; Brown, J.R.; Taylor, C.M.; Huttenhower, C.; Langille, M.G.I. PICRUSt2 for prediction of metagenome functions. Nat. Biotechnol. 2020, 38, 685–688. [Google Scholar] [CrossRef]
  52. Dixon, P. VEGAN, a package of R functions for community ecology. J. Veg. Sci. 2003, 14, 927–930. [Google Scholar] [CrossRef]
  53. Marcon, E.; Hérault, B. Entropart: An R package to measure and partition diversity. J. Stat. Softw. 2015, 67, 1–26. Available online: http://EconPapers.repec.org/RePEc:jss:jstsof:v:067:i08 (accessed on 20 August 2023). [CrossRef]
  54. Alef, K.; Nannipieri, P. Methods in Applied Soil Microbiology and Biochemistry; Academic Press: San Diego, CA, USA, 1995. [Google Scholar]
  55. Gomez, E.; Ferreras, L.; Toresani, S. Soil bacterial functional diversity as influenced by organic amendment application. Bioresour. Technol. 2006, 97, 1484–1489. [Google Scholar] [CrossRef]
  56. Garau, G.; Castaldi, P.; Santona, L.; Deiana, P.; Melis, P. Influence of red mud, zeolite and lime on heavy metal immobilization, culturable heterotrophic microbial populations and enzyme activities in a contaminated soil. Geoderma 2007, 142, 47–57. [Google Scholar] [CrossRef]
  57. Decreto Legislativo 152/2006 (2006) Decreto Legislativo 3 Aprile 2006, n. 152 Norme in Materia Ambientale. Gazzetta Ufficiale Serie Generale n.88 del 14-04-2006—Supplemento Ordinario n. 96. [Legislative Decree No. 152/2006 (2006) Legislative Decree No. 152 of 3 April 2006 Environmental Regulations. Official Gazette General Series No. 88 of 14-04-2006—Ordinary Supplement No. 96]. Available online: https://www.gazzettaufficiale.it/dettaglio/codici/materiaAmbientale (accessed on 20 August 2023).
  58. Decreto Ministeriale 1 Marzo 2019 n. 46—Regolamento Relativo Agli Interventi di Bonifica, di Ripristino Ambientale e di Messa in Sicurezza, D’emergenza, Operativa e Permanente, Delle Aree Destinate Alla Produzione Agricola e All’allevamento, ai Sensi Dell’articolo 241 del Decreto Legislativo 3 Aprile 2006, n. 152 [Ministerial Decree (D.M.) 1 March 2019 n. 46—Regulation on the Remediation, Environmental Restoration and Safety Interventions, Emergency, Operational and Permanent, of Areas Intended for Agricultural Production and Livestock Farming, Pursuant to Article 241 of Legislative Decree No. 152 of 3 April 2006]. Available online: https://www.gazzettaufficiale.it/eli/id/2019/06/07/19G00052/sg (accessed on 20 August 2023).
  59. Gao, Y.; Fang, Z.; Van Zwieten, L.; Bolan, N.; Dong, D.; Quin, B.F.; Meng, J.; Li, F.; Wu, F.; Wang, H.; et al. A critical review of biochar-based nitrogen fertilizers and their effects on crop production and the environment. Biochar 2022, 4, 36. [Google Scholar] [CrossRef]
  60. Sade, H.; Meriga, B.; Surapu, V.; Gadi, J.; Sunita, M.S.L.; Suravajhala, P.; Kishor, P.B.K. Toxicity and tolerance of aluminum in plants: Tailoring plants to suit to acid soils. Biometals 2016, 29, 187–210. [Google Scholar] [CrossRef] [PubMed]
  61. Bolan, N.; Sarmah, A.K.; Bordoloi, S.; Bolan, S.; Padhye, L.P.; Van Zwieten, L.; Sooriyakumar, P.; Khan, B.A.; Ahmad, M.; Solaiman, Z.M.; et al. Soil acidification and the liming potential of biochar. Environ. Pollut. 2023, 317, 120632. [Google Scholar] [CrossRef]
  62. Cheng, C.-H.; Lehmann, J.; Engelhard, M.H. Natural oxidation of black carbon in soils: Changes in molecular form and surface charge along a climosequence. Geochim. Cosmochim. Acta 2008, 72, 1598–1610. [Google Scholar] [CrossRef]
  63. De Lima Veloso, V.; da Silva, F.B.V.; dos Santos, N.M.; do Nascimento, C.W.A. Phytoattenuation of Cd, Pb, and Zn in a slag-contaminated soil amended with rice straw biochar and grown with energy maize. Environ. Manag. 2022, 69, 196–212. [Google Scholar] [CrossRef] [PubMed]
  64. Inyang, M.I.; Gao, B.; Yao, Y.; Xue, Y.; Zimmerman, A.; Mosa, A.; Pullammanappallil, P.; Ok, Y.S.; Cao, X. A review of biochar as a low-cost adsorbent for aqueous heavy metal removal. Crit. Rev. Environ. Sci. Technol. 2016, 46, 406–433. [Google Scholar] [CrossRef]
  65. Adekiya, A.O.; Olaniran, A.F.; Adenusi, T.T.; Aremu, C.; Ejue, W.S.; Iranloye, Y.M.; Gbadamosi, A.; Olayanju, A. Effects of cow dung and wood biochars and green manure on soil fertility and tiger nut (Cyperus esculentus L.) performance on a savanna Alfisol. Sci. Rep. 2020, 10, 21021. [Google Scholar] [CrossRef] [PubMed]
  66. Jiang, L.-L.; Han, G.-M.; Lan, Y.; Liu, S.-N.; Gao, J.-P.; Yang, X.; Meng, J.; Chen, W.-F. Corn cob biochar increases soil culturable bacterial abundance without enhancing their capacities in utilizing carbon sources in Biolog Eco-plates. J. Integr. Agric. 2017, 16, 713–724. [Google Scholar] [CrossRef]
  67. Zhang, Q.; Li, S.; Saleem, M.; Ali, M.Y.; Xiang, J. Biochar and earthworms synergistically improve soil structure, microbial abundance, activities and pyraclostrobin degradation. Appl. Soil Ecol. 2021, 168, 104154. [Google Scholar] [CrossRef]
  68. Neff, J.; Asner, G. Dissolved organic carbon in terrestrial ecosystems: Synthesis and a model. Ecosyst. 2001, 4, 29–48. [Google Scholar] [CrossRef]
  69. Azeem, M.; Jeyasundar, P.G.S.A.; Ali, A.; Riaz, L.; Khan, K.S.; Hussain, Q.; Kareem, H.A.; Abbas, F.; Latif, A.; Majrashi, A.; et al. Cow bone-derived biochar enhances microbial biomass and alters bacterial community composition and diversity in a smelter contaminated soil. Environ. Res. 2023, 216, 114278. [Google Scholar] [CrossRef]
  70. Singh, J.S.; Gupta, V.K. Soil microbial biomass: A key soil driver in management of ecosystem functioning. Sci. Total Environ. 2018, 634, 497–500. [Google Scholar] [CrossRef]
  71. Campos, P.; Miller, A.Z.; Prats, S.A.; Knicker, H.; Hagemann, N.; De la Rosa, J.M. Biochar amendment increases bacterial diversity and vegetation cover in trace element-polluted soils: A long-term field experiment. Soil Biol. Biochem. 2020, 150, 108014. [Google Scholar] [CrossRef]
  72. Wang, M.; Yu, X.; Weng, X.; Zeng, X.; Li, M.; Sui, X. Meta-analysis of the effects of biochar application on the diversity of soil bacteria and fungi. Microorganisms 2023, 11, 641. [Google Scholar] [CrossRef] [PubMed]
  73. Xu, W.; Xu, H.; Delgado-Baquerizo, M.; Gundale, M.J.; Zou, X.; Ruan, H. Global meta-analysis reveals positive effects of biochar on soil microbial diversity. Geoderma 2023, 436, 116528. [Google Scholar] [CrossRef]
  74. Hayward, A.C.; Fegan, N.; Fegan, M.; Stirling, G.R. Stenotrophomonas and Lysobacter: Ubiquitous plant-associated gamma-proteobacteria of developing significance in applied microbiology. J. Appl. Microbiol. 2010, 108, 756–770. [Google Scholar] [CrossRef] [PubMed]
  75. Zhao, R.; Liu, J.; Xu, N.; He, T.; Meng, J.; Liu, Z. Urea hydrolysis in different farmland soils as affected by long-term biochar application. Front. Environ. Sci. 2022, 10, 1304. [Google Scholar] [CrossRef]
  76. Mobley, H.L.T.; Hausinger, R.P. Microbial ureases: Significance, regulation, and molecular characterization. Microbiol. Rev. 1989, 53, 85–108. [Google Scholar] [CrossRef]
  77. Diquattro, S.; Garau, G.; Garau, M.; Lauro, G.P.; Pinna, M.V.; Castaldi, P. Effect of municipal solid waste compost on antimony mobility, phytotoxicity and bioavailability in polluted soils. Soil Syst. 2021, 5, 60. [Google Scholar] [CrossRef]
  78. Klik, B.; Holatko, J.; Jaskulska, I.; Gusiatin, M.Z.; Hammerschmiedt, T.; Brtnicky, M.; Liniauskienė, E.; Baltazar, T.; Jaskulski, D.; Kintl, A.; et al. Bentonite as a functional material enhancing phytostabilization of post-industrial contaminated soils with heavy metals. Materials 2022, 15, 8331. [Google Scholar] [CrossRef]
  79. Sladkovska, T.; Wolski, K.; Bujak, H.; Radkowski, A.; Sobol, Ł. A review of research on the use of selected grass species in removal of heavy metals. Agronomy 2022, 12, 2587. [Google Scholar] [CrossRef]
  80. Willscher, S.; Mirgorodsky, D.; Jablonski, L.; Ollivier, D.; Merten, D.; Büchel, G.; Wittig, J.; Werner, P. Field scale phytoremediation experiments on a heavy metal and uranium contaminated site, and further utilization of the plant residues. Hydrometallurgy 2013, 131–132, 46–53. [Google Scholar] [CrossRef]
  81. Doss, B.D.; Evans, C.E.; Turner, J.L. Influence of subsoil acidity on tomato yield and fruit size. J. Amer. Soc. Hort. Sci. 1977, 102, 643–645. [Google Scholar] [CrossRef]
Figure 1. Concentrations of Pb, Cd, and Zn extracted from contaminated control (C soil) and amended soils (2.5-Bio and 5.0-Bio) using the sequential extraction procedure. Color bars refer to the different extraction solutions. For each PTE and within the same extraction solution, different letters indicate significant differences between treatments (p < 0.05).
Soilsystems 07 00096 g001
Figure 2. Number of culturable microorganisms in contaminated control (C soil) and amended soils (2.5-Bio and 5.0-Bio). For each microbial group, different letters indicate significant differences between treatments (p < 0.05).
Soilsystems 07 00096 g002
Figure 3. Soil microbial biomass C (SMB-C) in contaminated (C soil) and amended soils (2.5-Bio or 5.0-Bio). Different letters indicate significant differences between treatments (p < 0.05).
Soilsystems 07 00096 g003
Figure 4. Microbial community data analysis outputs for contaminated (C soil) and amended soils (2.5-Bio or 5.0-Bio). (A) α-diversity boxplots with ANOVA results and post hoc pairwise Tukey’s analysis (α 0.05). (B) Barplots of the dominant taxa with taxonomy resolution as low as family level. (C) Principal coordinates analysis (PCoA) scatter plot generated using the Bray–Curtis dissimilarity, with the explained variance provided at each axis. (D) Barplots of the five ASVs showing differential abundance between the treatments (different letters indicate significant differences according to Kruskal and Wilcoxon rank sum tests for α of 0.05). * p < 0.05.
Soilsystems 07 00096 g004
Figure 5. Microbial function analysis outputs according to Picrust 2 for contaminated (C soil) and amended soils (2.5-Bio or 5.0-Bio). (A) α-diversity boxplots of functions with ANOVA results and post hoc pairwise Tukey’s analysis (α > 0.05; no statistically significant differences were identified). (B) Barplots of the dominant functions. (C) Principal coordinates analysis (PCoA) scatter plot generated using the Bray-Curtis dissimilarity, with the explained variance provided at each axis. (D) Barplots of the four differentially enriched pathways showing differences between the treatments (different letters indicate significant differences according to Kruskal and Wilcoxon rank sum tests for α of 0.05).
Soilsystems 07 00096 g005
Figure 6. Dehydrogenase (DHG) and urease (URE) activities in contaminated (C soil) and amended soils (2.5-Bio or 5.0-Bio). For each enzyme activity, different letters indicate significant differences between treatments (p < 0.05).
Soilsystems 07 00096 g006
Figure 7. PCA plot of standardized C source utilization data of microbial communities extracted from contaminated (C soil) and amended soils (2.5-Bio or 5.0-Bio).
Soilsystems 07 00096 g007
Figure 8. Root and shoot dry weight of triticale and tomato plants grown in contaminated (C soil) and amended soils (2.5-Bio or 5.0-Bio). For each parameter, different letters indicate significant differences between treatments (p < 0.05).
Soilsystems 07 00096 g008
Table 1. Selected physico-chemical characteristics of the contaminated (C soil) and biochar-amended soils (2.5-Bio and 5.0-Bio). Mean values ± SE followed by different letters within a row denote statistically significant differences (p < 0.05).
Physico-Chemical CharacteristicsC Soil2.5-Bio5.0-Bio
TextureSandy loam--
pH5.74 ± 0.02 a6.35 ± 0.01 b6.58 ± 0.01 c
CE (µS cm−1)376 ± 9 a325 ± 5 b333 ± 4 b
Organic matter (g kg−1)32.67 ± 0.58 a34.67 ± 0.58 b36.33 ± 0.58 c
Total N (g kg−1)1.00 ± 0.0 a1.00 ± 0.0 a0.91 ± 0.0 b
P Olsen (mg kg−1)31.53 ± 1.22 a32.43 ± 0.98 a35.73 ± 0.47 b
CEC (cmol(+) kg−1)24.36 ± 0.02 a24.55 ± 0.08 b25.15 ± 0.42 c
DOC (mg kg−1)13.79 ± 0.43 b12.51 ± 0.26 a12.04 ±0.12 a
Pb (mg kg−1)10.625 ± 2058 a10.238 ± 372 a10.064 ± 141 a
Cd (mg kg−1)28.3 ± 0.4 a27.2 ± 1.05 a27.1 ± 1.07 a
Zn (mg kg−1)3407 ± 140 a3291 ± 241 a3323 ± 120 a
Table 2. PTE uptake (mg kg−1, mean ± SE) by triticale and tomato plants grown in contaminated (C soil) and biochar-amended soils (2.5-Bio or 5-Bio). Mean values ± SE, followed by different letters within each column, denote statistically significant differences between treatments (p < 0.05). ND was not detected because of the limited availability of root biomass.
Triticale
Pb Uptake (mg kg−1)Cd Uptake (mg kg−1)Zn Uptake (mg kg−1)
ShootsRootsShootsRootsShootsRoots
C soil39.2 ± 0.3 b434.8 ± 21.5 a5.7 ± 0.1 b30.3 ± 1.1 a631.1 ± 25.8 a1596.3 ± 8.3 c
2.5-Bio38.3 ± 0.5 a593.7 ± 2.9 b5.1 ± 0.1 a61.6 ± 1.1 c733.2 ± 5.0 c1307.4 ± 19.7 b
5.0-Bio53.3 ± 0.2 c456.8 ± 25.3 ab7.9 ± 0.1 c52.6 ± 0.7 b683.4 ± 10.1 b928.0 ± 6.7 a
Tomato
Pb uptake (mg kg−1)Cd uptake (mg kg−1)Zn uptake (mg kg−1)
ShootsRootsShootsRootsShootsRoots
C soil514.7 ± 22.8 cND17.7 ± 0.6 bND2843.1 ± 22.3 cND
2.5-Bio89.2 ± 7.4 a695.4 ± 20.3 b15.3 ± 1.1 a133.5 ± 2.1 b879.1 ± 86.5 b4859.2 ± 28.3 b
5.0-Bio115.5 ± 9.2 b616.8 ± 17.0 a24.9 ±0.2 c104.2 ± 1.7 a680.3 ± 9.5 a3101.2 ± 28.4 a
Disclaimer/Publisher’s Note: The statements, opinions and data contained in all publications are solely those of the individual author(s) and contributor(s) and not of MDPI and/or the editor(s). MDPI and/or the editor(s) disclaim responsibility for any injury to people or property resulting from any ideas, methods, instructions or products referred to in the content.

