
Rotational Tillage Practices to Deal with Soil Compaction in Carbon Farming


Department of Agriculture, Crop Production and Rural Environment, University of Thessaly, Fytokou Str., 38500 Volos, Greece
*
Author to whom correspondence should be addressed.
Soil Syst. 2023, 7(4), 90; https://doi.org/10.3390/soilsystems7040090
Submission received: 31 August 2023
/
Revised: 10 October 2023
/
Accepted: 16 October 2023
/
Published: 18 October 2023
(This article belongs to the Special Issue Integrated Soil Management: Food Supply, Environmental Impacts, and Socioeconomic Functions)
Abstract
:Conservation tillage practices, such as reduced tillage and no-tillage, have recently garnered significant attention as core elements of the regenerative agriculture and carbon farming concepts. By minimizing mechanical soil disturbance, these practices preserve soil carbon and facilitate CO2 fixation in the soil. Despite the widely acknowledged benefits, many farmers still approach no-tillage with skepticism. Their primary concerns are weed management and soil compaction. While weeds can be effectively controlled with the deployment of integrated weed management strategies, urgent soil compaction problems can be rapidly resolved only with mechanical interventions. That is why many no-till farmers resort to occasional heavy tillage, in a scheme characterized as rotational tillage, inadvertently sacrificing their regenerative assets in soil carbon. This is also a pivotal issue within carbon farming: the fate of soil carbon at the end of a compliant scheme focused on carbon fixation. The present study explores data of soil organic matter (SOM), soil penetration resistance (PR), and dry bulk density (DBD) from the initial, six-year period of a long-term tillage experiment in Greece. During that period, modifications to the experimental design allowed diverse combinations of five tillage methods (conventional tillage, 3 reduced tillage methods, and no-tillage). The findings indeed underscore the farmers’ concerns about soil compaction. High levels of PR and DBD were observed even at the topsoil layer of the no-tillage (NT). Conventional, moldboard plowing (MP) or reduced, chisel plowing (CP) applied after four years of uninterrupted no-tillage ameliorated most of the soil compaction; however, at the same time, this induced unfavorable consequences for SOM. In contrast, NT applied permanently for six years resulted in a substantial enhancement in SOM that reached 2.24%, for a sampling depth 0–0.30 m compared to 1.54% for permanent MP. When no-tillage was rotated with plowing in the fifth year, almost 50% of the sequestered carbon was lost and the SOM dropped to 1.87%. Nevertheless, the amount of SOM observed at the deeper 0.15–0.30 m layer was greater compared to permanent NT. This suggests that while plowing induced some loss of SOM, it also facilitated the uniform distribution into the soil profile, in contrast with the accumulation in the topsoil at prolonged NT. The permanent CP method and the NT/CP rotation provided comparative outcomes in terms of both soil compaction and soil carbon sequestration with the rotational NT/MP scheme, while all the other tillage combinations were inferior.
1. Introduction
Conservation tillage is a management approach that aims to minimize the frequency or intensity of tillage operations in order to leave at least 30% of plant residues on the soil surface for erosion control and moisture conservation [1]. It encompasses various forms such as reduced tillage, vertical tillage, strip tillage, ridge tillage, mulch tillage, no-tillage, and others. Many of these practices have been implemented worldwide for many decades. But, despite the wide acknowledgement of their profits, the rate of adoption, especially in areas with traditional agricultural cultures, such as Europe, Asia, and Africa, is still relatively low [2,3]. Farmers generally appear cautious and skeptical about problems regarding efficient crop establishment, soil compaction, weed management, yield losses, and other [4,5,6,7]. Nevertheless, conservation tillage and, mainly, no-tillage have been recently brought to the foreground again as core components of the contemporary regenerative agriculture and carbon farming concepts [8,9,10,11,12].
Reduced tillage is a conservative practice that involves minimum soil disturbance utilizing various tillage implements that avoid soil inversion, operate at shallow depths, and avoid intensive soil crumbling. No-tillage, on the other hand, implicates minimal soil disturbance by performing direct drilling into mulches and stable or natural vegetation [7]. Beyond-surface disturbance is “banned” to avoid distortion of the soil biota and the destruction of its natural habitat [13,14]. That way, the soil is gradually enriched with soil organic matter and the soil structure becomes improved, containing more stable aggregates and a soil porosity with higher continuity and diffusivity [15,16,17,18,19]. Nevertheless, quite often, farmers complain about increased soil compaction that poses a negative impact on crop yields [6,20]. Soil compaction is a combined result of physical and artificially induced processes. Physical processes include natural soil consolidation under the impact of its own mass and suppression from heavy precipitation (snow, rain) [21,22]. Artificially induced compaction is the most severe and comes from the movement of heavy agricultural vehicles in the field (tractors, sprayers, harvesters, etc.), especially under wet soil conditions [23,24,25]. The above effects, in combination with the absence of annual mechanical soil loosening due to the elimination or abortion of tillage, result in accumulated soil compaction that, after several years, may act adversely to plant root development [26]. Consequently, crop yields are lower [27,28], with dicots being more sensitive compared to monocots [29]. Nonetheless, soils have the ability to employ a self-repairing action through physical shrinking-swelling cycles induced by natural wet/drying and freezing/thawing processes [30,31,32], but this is not sufficiently effective for the semi-arid Mediterranean climate of southern Europe [33,34]. Moreover, poorly structured soils with low amounts of organic matter are most susceptible to compaction and may also suffer from poor infiltration and aeriation [35,36].
To deal with the above problems, farmers employing no-tillage have two options: either to implement an integrated strategy using special cover crops with strong tap roots that perform a “biological” kind of tillage in the soil [37,38], which is, however, a long-term process requiring persistence and patience, or, to perform periodically some kind of shallow or deep tillage operation which has rapid outcomes [39,40]. Certainly, the second solution is favored by the majority of farmers, with plowing, chiseling, or subsoiling being among the most frequently employed methods to tackle soil compaction [41,42,43,44,45,46]. This strategy is also referred to as rotational tillage [47,48,49,50] or occasional tillage [51]. However, introducing mechanical disturbance to a soil that has gradually developed its natural structure over years of uninterrupted no-tillage comes with a host of adverse outcomes. Among these, the most significant is the oxidation of soil organic matter (SOM), resulting in loss of soil carbon due to the aeriation of the soil [52], especially when a soil inversive kind of tillage is performed, such as moldboard or disc plowing [53,54]. Destruction of the continuous pores and losses in soil biodiversity are also noteworthy [55,56]. Losses of soil carbon implies that CO2 is released to the atmosphere, and it is added to the GHGs that are responsible for climate change [57,58,59,60]. On the other hand, carbon farming aims at mitigating climate change through capturing atmospheric carbon and fixing it in organic pools into the soil [10,61,62]. As realized, introducing a periodic soil tillage in carbon farming conflicts with the aims and scopes of the strategy. Nonetheless, hybrid systems that intermittently combine intensive and less intensive tillage practices could provide a practical solution for soil compaction, easing the farmers’ apprehensions and facilitating a smoother transition toward regenerative soil management systems [47,51,63,64]. The present study capitalizes on the above hypothesis and explores data from the first period of a long-term tillage experiment established in Greece, during which some changes were imposed to the experimental design, leading to diverse combinations of conventional and conservation tillage practices. The study examines the impacts on soil compaction, along with the changes in soil carbon, and aims to identify the optimum tillage schemes that compromise benefits and drawbacks.
2. Materials and Methods
2.1. Experiment Description
The data shown in the present work are obtained from the long-term tillage experiment named THESUSTILL that was established in 1997 at the University of Thessaly Farm in Velestino, Central Greece. The data concern the first six years of the experiment and give a special focus on the fourth, fifth, and sixth years, during which a rotation in tillage treatments was introduced. The initial experimental design established in 1997 was a randomized complete block (RCB) with five methods of tillage:
- ∘
- Conventional, moldboard-based tillage (MP). This method included moldboard plowing at a depth of 0.25–0.30 m while seedbed preparation was accomplished with two or three passes of a disk harrow or a field cultivator at a depth of 0.07–0.09 m. A moldboard plow with four 13-inch plowshares was used. The working speed ranged from 4 to 6 km/h, according to the soil conditions. A tandem disk harrow was used for secondary tillage, with disks of 0.5 m diameter operating at a speed of 7–8 km/h. The field cultivator had spring-type tines, 0.3 m long in 0.07 m spaces, and was operating also at 7–8 km/h. Plowing was usually performed in autumn and secondary tillage was accomplished a few days prior to planting the winter or summer crops. This is the most common method for soil preparation in Greece.
- ∘
- Reduced, chisel plowplow-based tillage (CP). The primary tillage was performed with a chisel plow (also referred as a “heavy cultivator”) at a depth of 0.20–0.25 m, and seedbed preparation was accomplished with one or two passes of a disk harrow or a field cultivator. The chisel plow had rigidly mounted tines, 0.80 m long, placed at 0.23 m space intervals. It operated at a speed of 5–6 km/h, according to the soil conditions. This method is common for the establishment of winter crops in Greece.
- ∘
- Reduced, power harrow-based tillage (PH). A single tillage was performed with one pass of a power harrow (also referred to as a “rotary cultivator”) at a depth of 0.12–0.15 m, close to planting. In spring-sown crops, one pass of a disk harrow was performed during the previous autumn to control natural vegetation. The implement had tandem vertical tines, 0.30 m long, placed on rotating plates, with a frequency of 180 rpm. The working speed was 4 km/h.
- ∘
- Reduced, disc harrow-based tillage (DH). Shallow tillage was performed with the same disk harrow used for secondary tillage in conventional tillage. The implement operated at a depth of 0.06–0.08 m with a speed of 8 km/h. In autumn-sown crops, two to three passes were made a few days before planting. In spring-sown crops, one pass was made in autumn for residue management and weed destruction and two passes were made in the spring, prior to planting.
- ∘
- No-tillage (NT). Direct sowing was applied using a row crop seeder for the summer crops and a drill seeder for winter wheat. All crop and natural vegetation residues were left on the soil surface. Weeds were destroyed with glyphosate (5–6 kg∙ha−1) within one week prior to or after planting the crops.
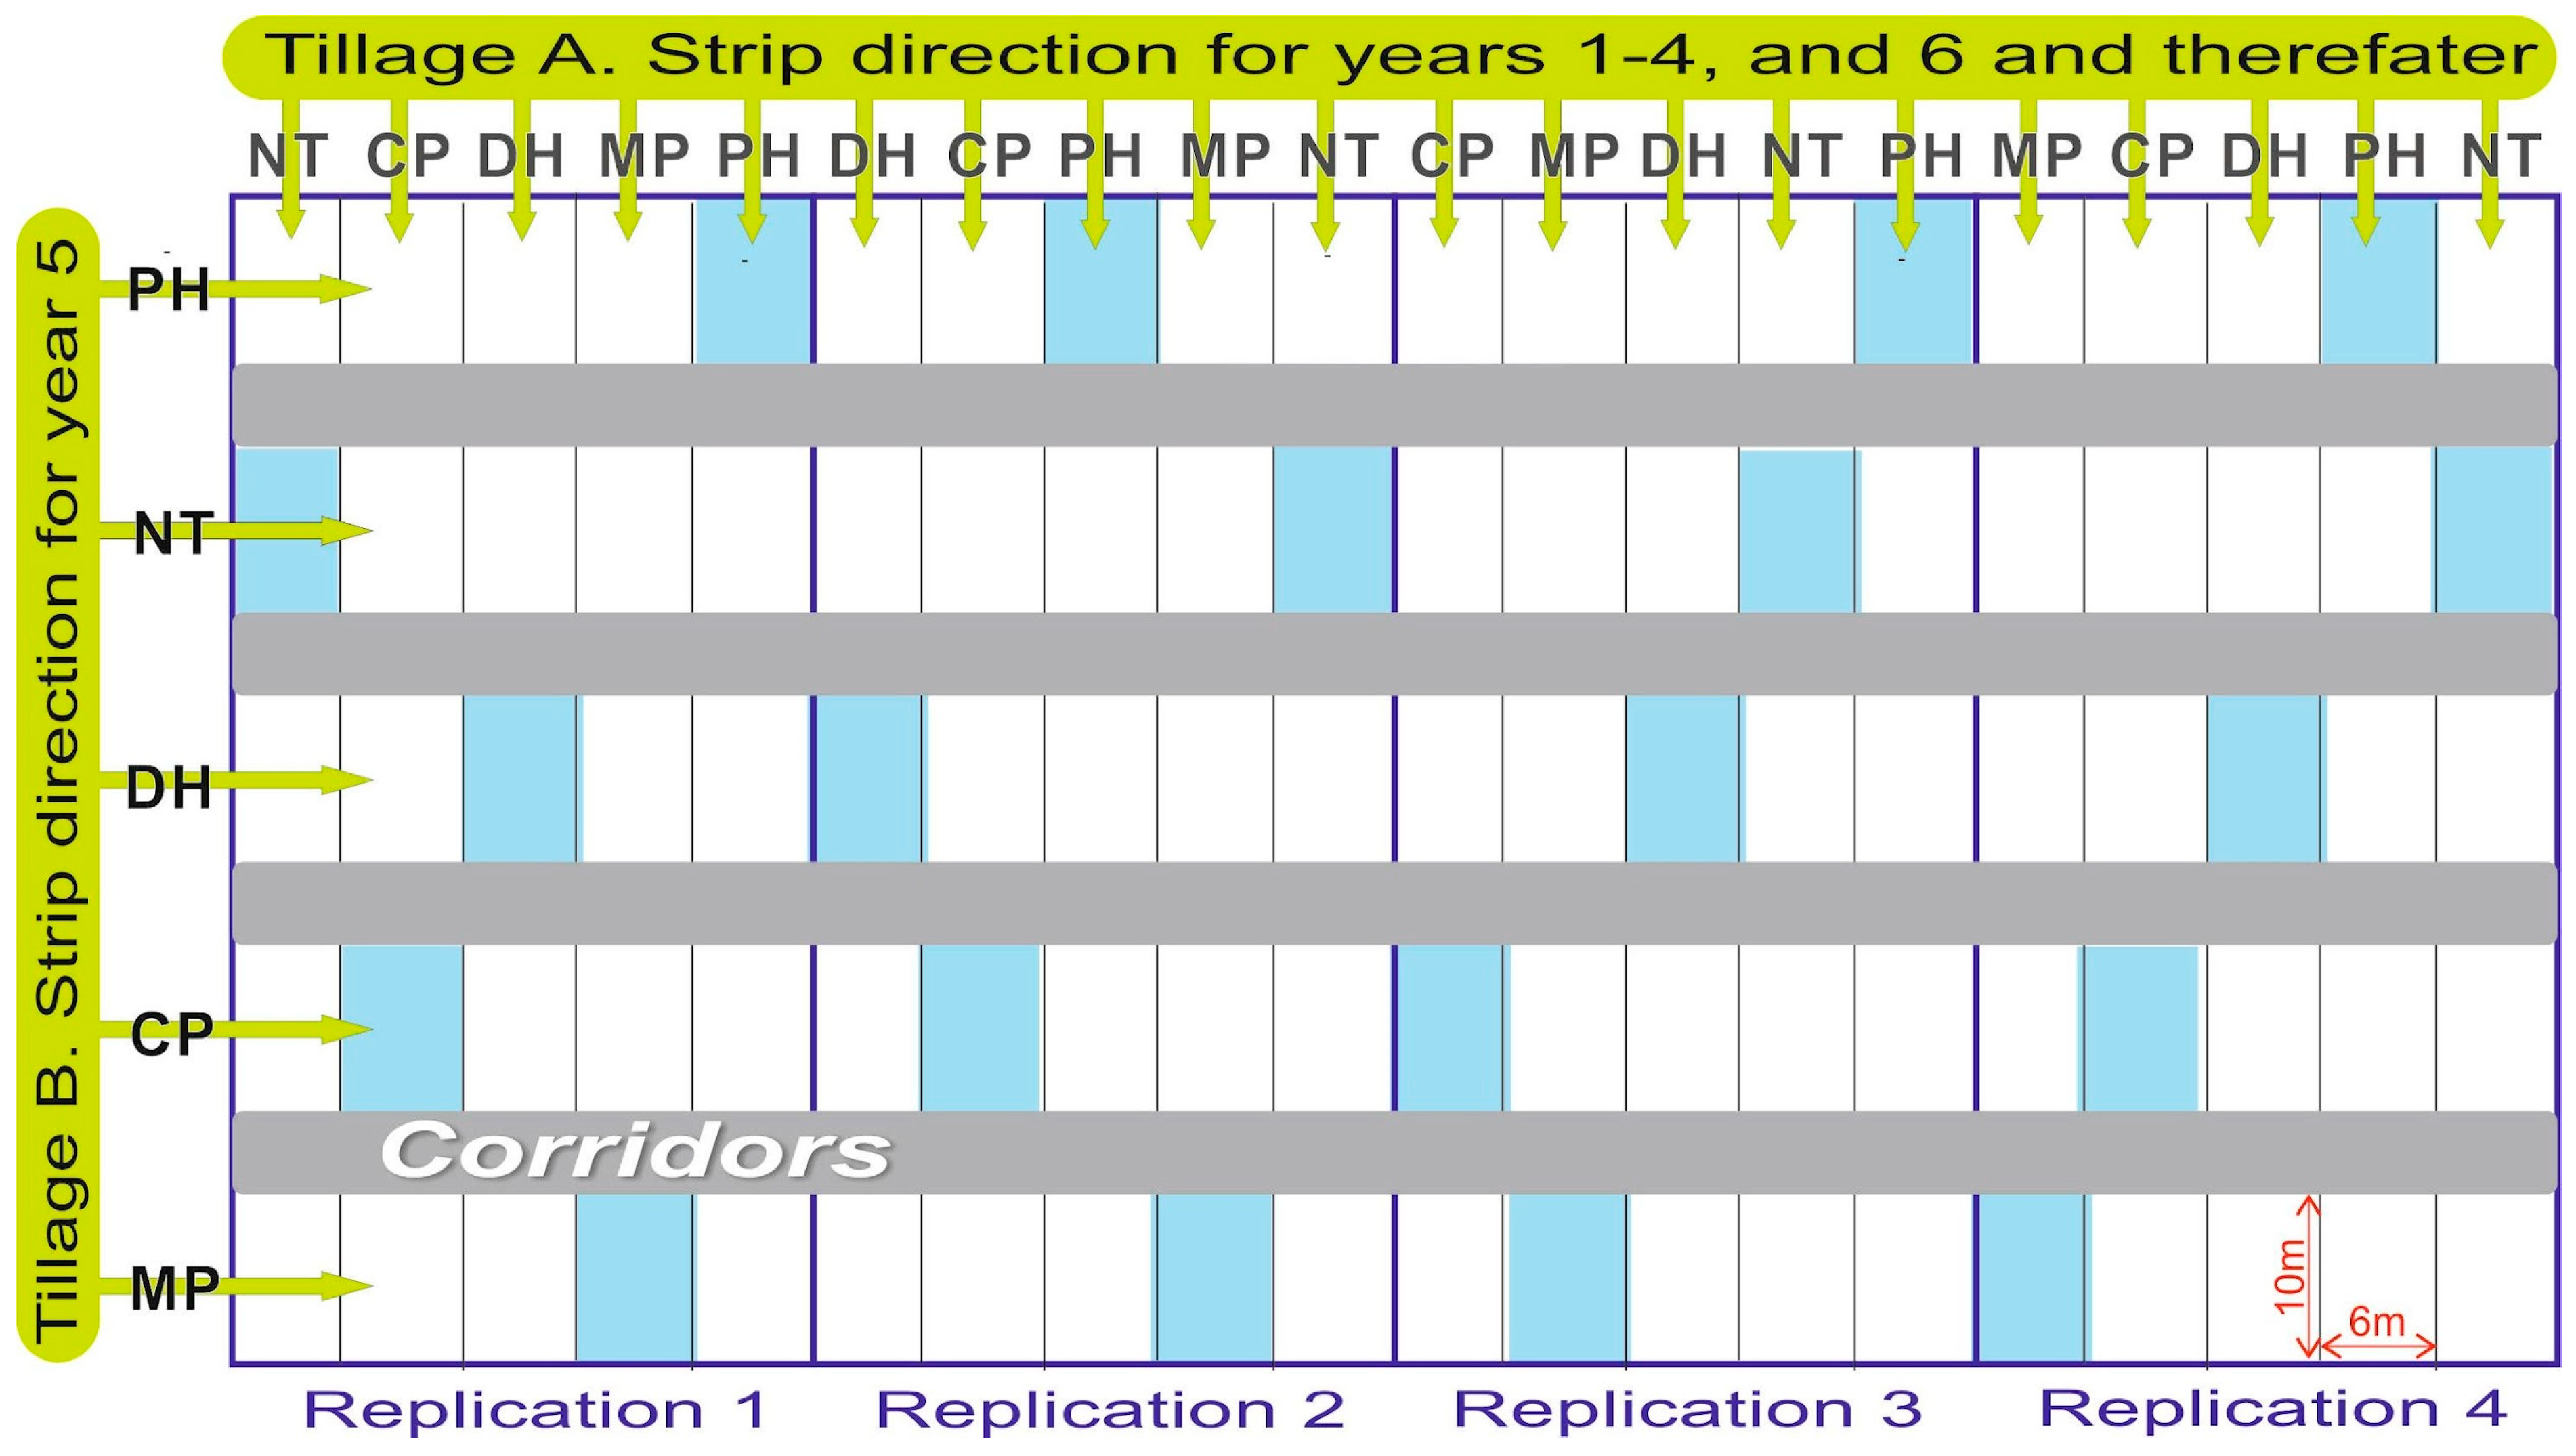
The original experimental plots were 6 m wide by 60 m long (Figure 1) (the corridors shown on the image were not yet formed). This RCB design was kept constant for a four-year period. In the fifth year (2001), a modification of the original design was introduced, and the tillage strips were performed perpendicular to the original ones (Figure 1). That way, a new strip plot design was formed, with the initial tillage strips comprising the horizontal factor A and the newly introduced perpendicular tillage comprising the vertical factor B. The combinations of factors A and B provided sub-plots, where a new tillage operation was introduced over the previous four-year ones, along with sub-plots still continuing the initial treatments for a fifth year. The dimensions of the newly formed sub-plots were 6 × 10 m. This formation allowed the study of the effects of the lastly introduced tillage operations over the previous ones, as well as the study of the residual effects from the previous operations on the last ones. A total of 5 × 5 = 25 tillage combinations were formed and compared (Table 1).
In the sixth year (2002), the direction of tillage was reversed to its original design. In that way, 25 tillage combinations were formed again with plots of constant tillage for six years, as well as plots where tillage was interrupted by another method for one year (such as 4MP + 1CP + 1MP, 4NT + 1MP + 1NT, and so on). The experimental design was again a strip plot.
The present work examines results from the first six years of the trial, focusing particularly on the transition period 2000–2002.
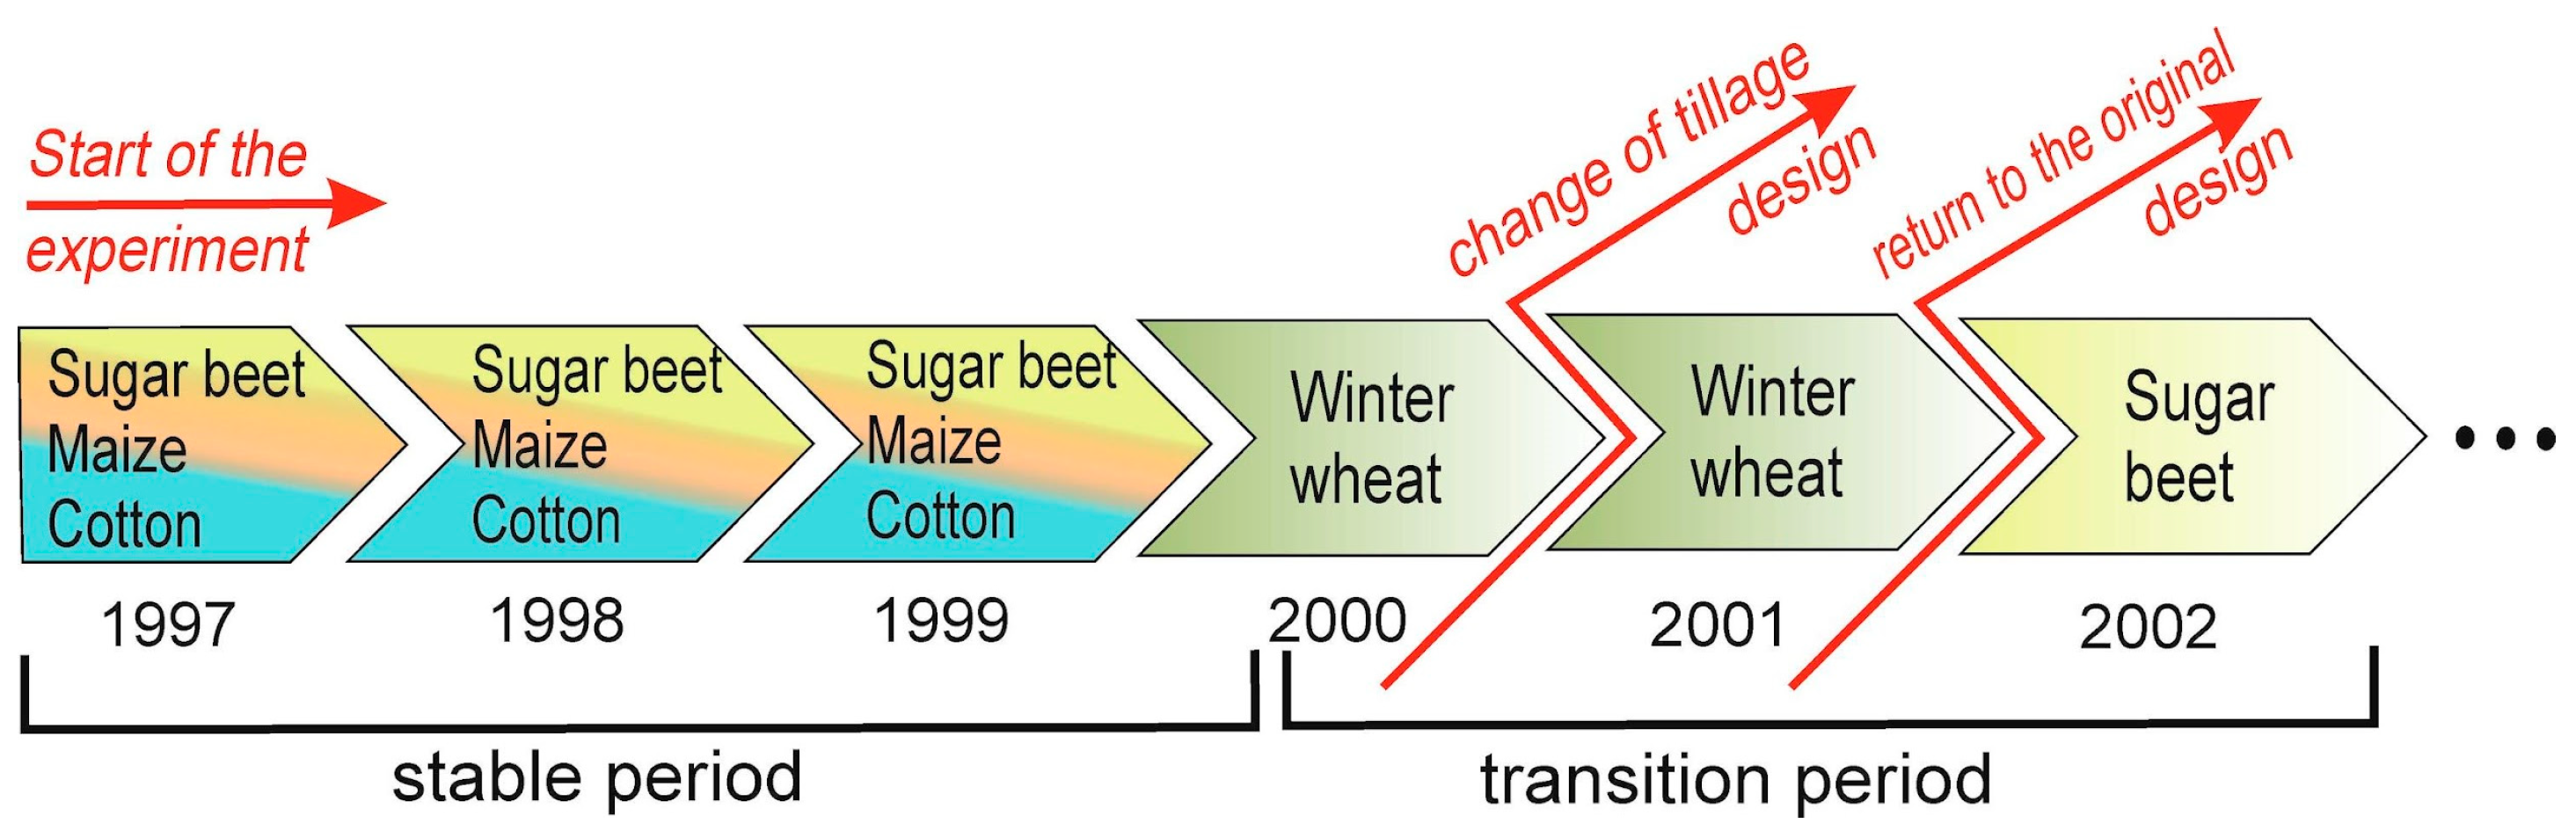
A regional common crop rotation scheme was followed, including annual summer and winter crops (Figure 2). Multiple rotations of sugar beet, maize, and cotton were followed during the 1997–1999 summer periods, winter wheat was introduced in 1999–2000 and 2000–2001, and the summer cycle started again with sugar beet in 2002, continued with maize in the following year, and other crops thereafter (the experiment is still running). Both fields were fallow for a long period before starting the trials.
The experiment had four replicates and was repeated at two fields with different soil types. Field 1 (39°23′43.87″ N, 22°45′25.23″ E) was a silty-clayey Vertisol (sand 9.7%, silt 41%, clay 49.2%) and Field 2 (39°24′1.37″ N, 22°45′34.11″ E) was a clayey Vertisol (sand 20.1, silt 32.7, clay 47.1). Both fields present a calcaric Fluvisol origin.
2.2. Field Measurements
Soil properties were measured once per year at selected periods. Multiple sampling was performed on each plot. During 1997–2000, each experimental field consisted of 5 × 4 = 20 main plots. In 2001 and 2002, after changing the tillage direction, each field consisted of 25 × 4 = 100 sub-plots. The properties examined in the present study are soil penetration resistance, soil dry bulk density, and soil organic matter.
2.2.1. Soil Penetration Resistance
Soil penetration resistance (PR) was measured with a handheld soil penetrometer (Findley-Irvine Ltd., Penicuik, Midlothian, Scotland UK) with a cone base diameter of 12.83 mm and a tip angle of 30°, following the standards of ASABE [65]. The instrument recorded the soil penetration resistance at intervals of 0.01 m, down to a depth of 0.50 m. Five insertions were made randomly at each plot and average values were estimated at intervals of 0.05 m down to 0.40 m. The 0.40–0.50 m interval was aborted because it was not possible to always achieve the full (0.50 m) depth, due to the extreme resistance. Measurements were made once per year, two to three months after the last tillage operation, to allow adequate time for the soil to consolidate. The mean soil water content during the measurements were obtained from four soil cores obtained at random places from each replication, at three depth intervals: 0–0.15 m, 0.15–0.30 m, and 0.30–0.45 m (Supplementary Materials Table S5). Since the soil resistance on the penetration of a metal tip depends highly on soil moisture, and since water regime always differs in time, the penetration resistance values were normalized to allow a year-by-year comparison. The normalization was performed over the annual MP values that were used as a common basis according to the formula:
where:
- NPRi = the normalized value of penetration resistance for a specific treatment i (i refereeing to MP, CP, PH, DH, and NT) for a particular depth interval.
- PRMP = the penetration resistance value for the MP treatment at the corresponding depth.
- PRi = the penetration resistance value for a treatment (i) at the corresponding depth.
From the above expression (1) it is conceived that the PRi value for the MP treatment is always estimated to be 100, being the common base to construct a comparable time series.
2.2.2. Soil Dry Bulk Density
Dry bulk density (DBD) of the soil was assessed from undisturbed core samples taken at a depth of 0.30 m. A sampling device consisting of an outer metal cylinder containing retractable and exchangeable inner plastic tubes for holding the soil cores was used (Figure 3). The device was designed and constructed by the Laboratory of Agricultural Engineering, University of Thessaly. The metal cylinder with the inner plastic tube was pressed into the soil with the help of a farm tractor hydraulic system. After each sampling, the plastic tube containing the undisturbed soil sample was removed and replaced with a new, empty one. The plastic tubes have an inner base diameter of 0.048 m and a height of 0.30 m. These tubes were carried to the lab where the soil was passed gently to another plastic tube of the same diameter that had predefined perpendicular slots at distances 0.025 m, 0.10 m, 0.20 m, and 0.275 m from the top (Figure 4). These slots were used as a guide to separate with a knife the 0–0.30 m original soil core at three fractions, A: 0.025–0.100 m, B: 0.100–0.200 m, and C: 0.200–0.275 m. For the border, 0.025 m-long core pieces were omitted from the top and the bottom of the tube to secure any soil losses during extraction and transportation. As a result, from each original sample, three sub-samples of constant volume were obtained. The volumes of “A” and “C” samples were 1.3565 × 10⁻⁴ m3, and “B” was 1.8086 × 10⁻⁴ m3. The “A” sample represented the 0–0.10 m soil depth, B the 0.10–0.20 m, and C the 0.20–0.30 m depth. The sub-samples were crumbled manually, oven dried for 48 h at 104 °C, and weighted. Dry bulk density of the soil was expressed as the ratio of the mass to the soil volume (Mg∙m−3). From each plot, three 0–0.30 m samples were taken randomly. From these, average dry bulk densities were estimated for the three depth intervals. The sampling was performed close to the penetration resistance measurements.
2.2.3. Soil Organic Matter
Soil Organic Matter (SOM) was measured at two depths, 0–0.15 m and 0.15–0.30 m. Preliminary measurements were taken in 1997, before the introduction of any tillage treatments, to address the start conditions. The measurements were repeated in 2001 after the introduction of the tillage combinations and in 2002 when the treatments were revered to the initial design. The sampling was performed with a screw-type open auger in 1997, while, for 2001 and 2002, the hydraulic device used for the dry bulk density was utilized. Three samples were taken from every plot. The same depths were thoroughly mixed and homogenized to give one composite sample for each plot and depth. The soil organic matter was estimated with the Walkley and Black method [66].
2.3. Statistical Analysis
Two statistical models were used for the analysis of the data. For the first four years, a one-way analysis of variance (ANOVA) was performed for the tillage treatment A. For years five and six, where a second vertical factor (Tillage B) was introduced, a custom univariate linear model was built with the following sources of variation: Location, Replication, Tillage A, error 1, Tillage B, error 2, Tillage AxB, error 3, total. The statistical analysis was performed in SPSS (IBM SPSS Statistics v29.0. Armonk, NY, USA: IBM Corp). Post hoc tests for mean comparisons were conducted using Tukey correction with a p level 0.05. The graphs were built with OriginPro, 2022 (OriginLab Corporation, Northampton, MA, USA).
3. Results
The statistical analysis showed no significant interaction between the site (Field 1 and Field 2) and the tillage treatments. Therefore, the average values from the two fields are henceforth presented.
3.1. Soil Penetration Resistance
The soil penetration resistance measurements were carried out at least two months after the last soil tillage on already established crops. Figure 4 presents measurements obtained from the plots with a constant tillage regime (blue shaded plots in Figure 2) for years one, three, five, and six. There are significant differences among the tillage treatments, as revealed by the error bars and the corresponding p-values in Tables S1–S4 (Supplementary Materials). The graphs reveal also the efficient decompaction effect of the moldboard plow in the MP treatment. Deep soil plowing provided essential soil loosening, surprisingly expanding even beyond the 0.30-m tillage depth. The differences are statistically significant from DH and NT, and occasionally from PH, but not from CP (see also Supplementary Materials Tables S1–S4). The deep layer differences cannot be attributed to a mechanical action (conversely, moldboard plows are known for causing a hardpan underneath), but rather to differences in soil water content due to altered infiltration and water-holding capacity. This evidence of course requires further investigation. The CP treatment also provided considerable soil loosening that was significantly lower than DH and NT below 0.15 m. The use of a chisel plow in that case, with shanks working also on a deep depth (about 0.25 m), introduced cracks and soil crumbling without inverting the soil, as did the moldboard plow. The soil loosening effect shows a gradual decrease with depth. The PH and DH methods utilized machinery that operated at shallower depths (around 0.10 m). As a result, soil penetration resistance increased rapidly beyond the disturbed top layer. In 1997, these methods introduced a soil compaction right below the tillage depth due to the rather wet conditions during the soil preparation (Figure 4a). The NT method presented an increased soil penetration resistance, even from the topsoil 0–0.05 m layer. The differences were not significant from CP, PH, and DH, but were statistically significant compared to MP (Table S1, Supplementary Materials). This is somehow anticipated, due to the absence of soil loosening at any depth. Aside from the year 2001, the soil compaction in NT depicted through penetration resistance presents a rather uniform vertical distribution. The smaller differences among the treatments in 1999 are attributed to the higher soil water content during the measurements (Supplementary Materials Table S5).
Soil penetration resistance is a useful and simple measurement to address soil compaction, but it is highly affected and too sensitive to differences in soil moisture. The results may be useful for a ‘snapshot’ comparison during a singular time, but cannot be used to compare data from different dates or periods with alternative soil water regimes. To overcome this difficulty, the data were normalized using the MP results as a basis, to construct a timeseries of soil penetration resistance and access through that the evolution of soil compaction in time (Formula (1)). For each date, MP were given an arbitrary stable value of NPR = 100 and the rest of the treatment levels were expressed as a change % (Figure 5). Average PR values are estimated for three depths: 0–0.10 m, 0.10–0.20 m, and 0.20–0.30 m. The NT and DH treatments presented a gradual increase in soil penetration resistance in time. After the fifth year of constant application, the PR reached a maximum plateau at the 0.10–0.20 m and 0.20–0.30 m layers, but was still increasing at the top 0–0.10 m layer. In particular, the NT method had a 25–30% higher PR in the top layer, even from the first year that was gradually increasing in time, and exceeded 40% in the sixth year. At the 0.10–0.20 m layer, the PR was 15–20% higher in the beginning and became 30–35% higher in the fifth year, after which it remained constant. At the deeper, 0.20–0.30 m, layer, PR was only about 8% higher at the beginning and became 30–35% higher after the fifth year. The pattern was similar for DH, besides some lower PR levels at the top layer. The PH method presented a 10–20% increased PR from the first year at the 0–0.10 m depth, and a 15–25% higher PR at the 0.10–0.20 m depth, which remained relatively constantly higher in time. At the lower 0.20–0.30 m layer, however, the PR showed again a gradual increase from 10% to 20–25% during a five-year period. Finally, the CP treatment presented an almost similar PR with the control MP during the first year at the 0–0.10 m layer, but it had an around 10% higher PR at the 0.10–0.20 m and 0.20–0.30 m depths. Compared with MP, the differences in PR remained constant at the 0.10–0.20 m layer but presented an increase in time of about 10% for the upper 0–0.10 m and the deeper 0.20–0.30 m layers.
The previous findings confirm the farmers’ concerns for increased soil compaction after some years of reducing or ceasing soil tillage. As revealed in Figure 6a and Figure 7a, the increase in soil compaction during the first year of non-plowing is relatively low because the residual effects of the plowshares are still present. Therefore, the farmers do not encounter serious compaction problems at the beginning. Notably, some residual effects of the moldboard plow and the chisel plow were detectable in NT, even after four years (Figure 6c). However, when the intensive plow tillage was abandoned, soil compaction gradually built in the soil (Figure 5). On the other hand, introducing some kind of deep soil tillage after a constant no-tillage period was capable of ameliorating most of the built-in compaction (Figure 6b and Figure 7c). It is also remarkable in Figure 7b that using a disk harrow after no-tillage was the worst combination for exacerbating the compaction problems.
3.2. Dry Bulk Density
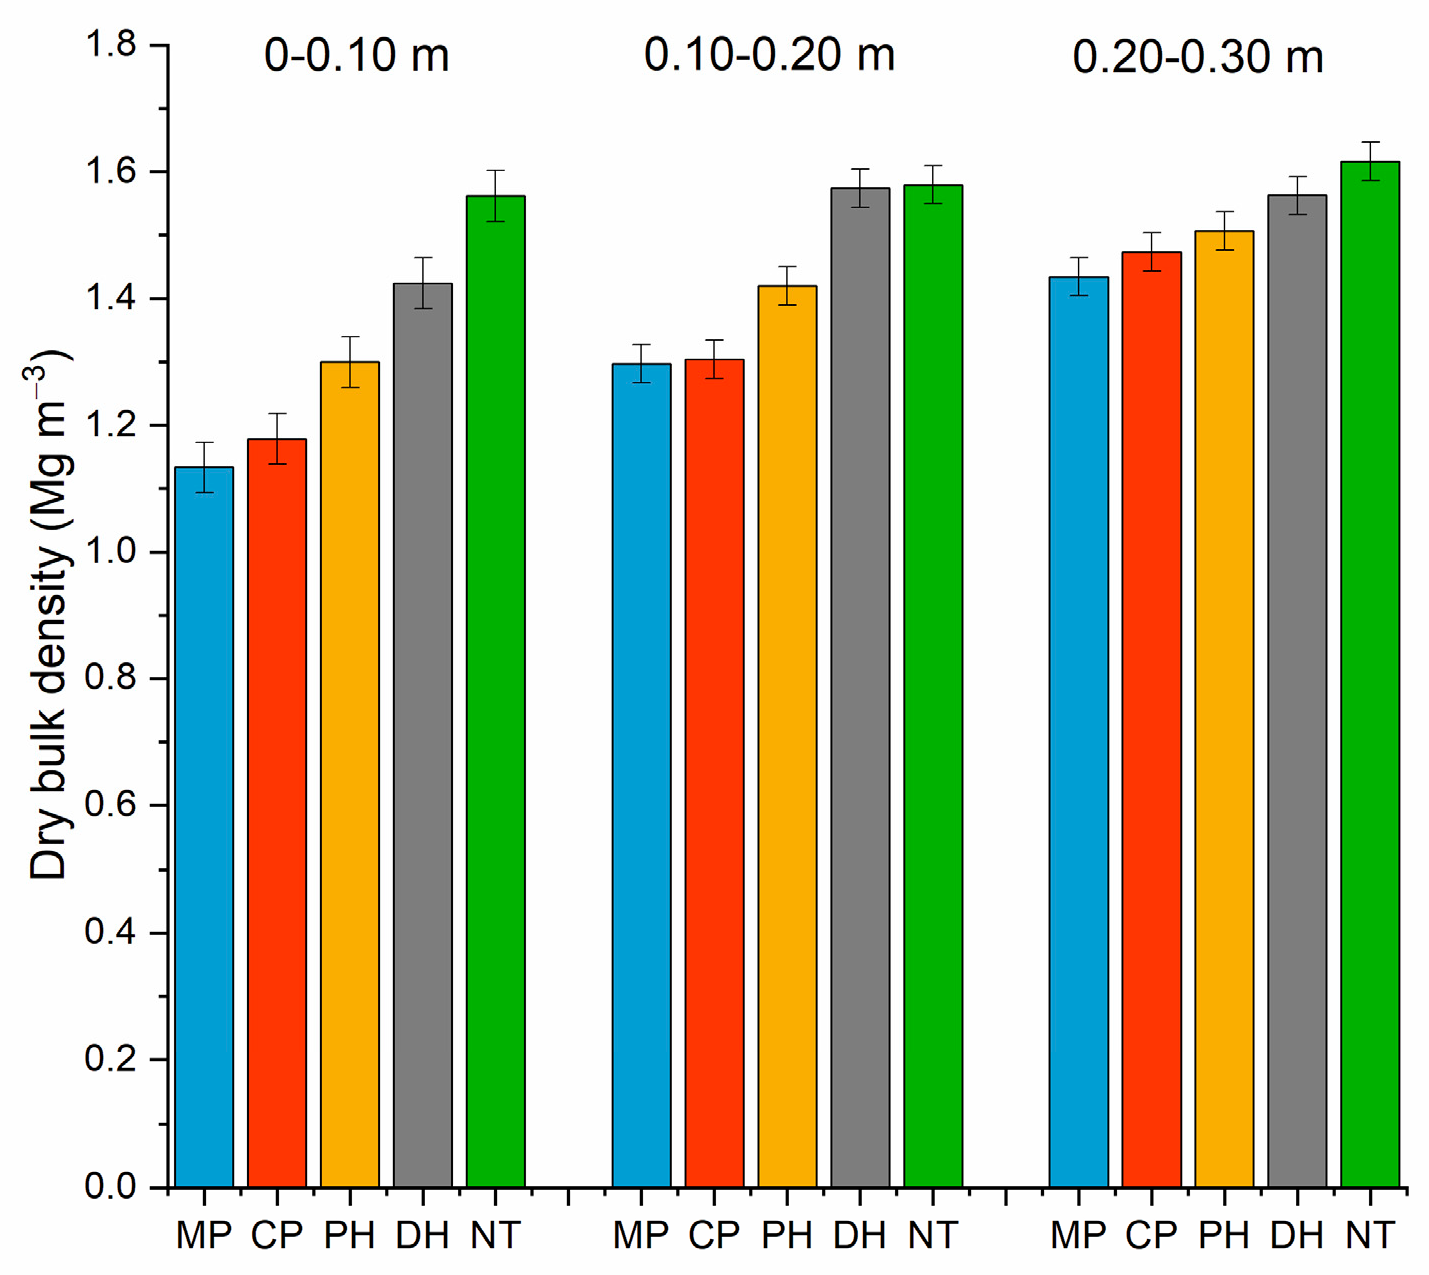
Dry bulk density was monitored three times; first in 2000, prior to the tillage change, in 2001 after the tillage alternation, and in 2002 when the tillage treatments were reversed to the original pattern. The measurements were made in parallel to the penetration resistance monitoring. The average results for the two fields for 2000 are presented in Figure 8. After four years of continuous reduced and no-tillage application, compaction is built into the soil. At the 0–0.10 m depth, no-tillage presents significantly higher dry bulk density (1.56 Mg∙m−3), and so do the DH and PH methods (1.42 and 1.30 Mg∙m−3, respectively, Supplementary Materials Table S6). Even though the 0–0.10 m depth is within the active range of the power harrow, the implement caused much less soil loosening compared to the moldboard plow (1.13 Mg∙m−3) or the chisel plow (1.18 Mg∙m−3). The disc harrow was operating at a shallower depth of 0.08–0.10 m; therefore, it presented a higher bulk density. At a greater depth of 0.10–0.20 m, the DH had almost the same dry bulk density with no-tillage (1.57 and 1.58 Mg∙m−3, respectively). At that depth, the bulk density was generally high for all the treatment levels, although MP and CP still presented lower values (1.29 Mg∙m−3) compared to PH, and especially DH and NT. The same applies to the third sampling depth of 0.20–0.30 m and, although the differences among the treatment levels are smaller, they are still statistically significant (p-value = 0.000). The results of the dry bulk density agree with the penetration resistance measurements shown in Figure 4.
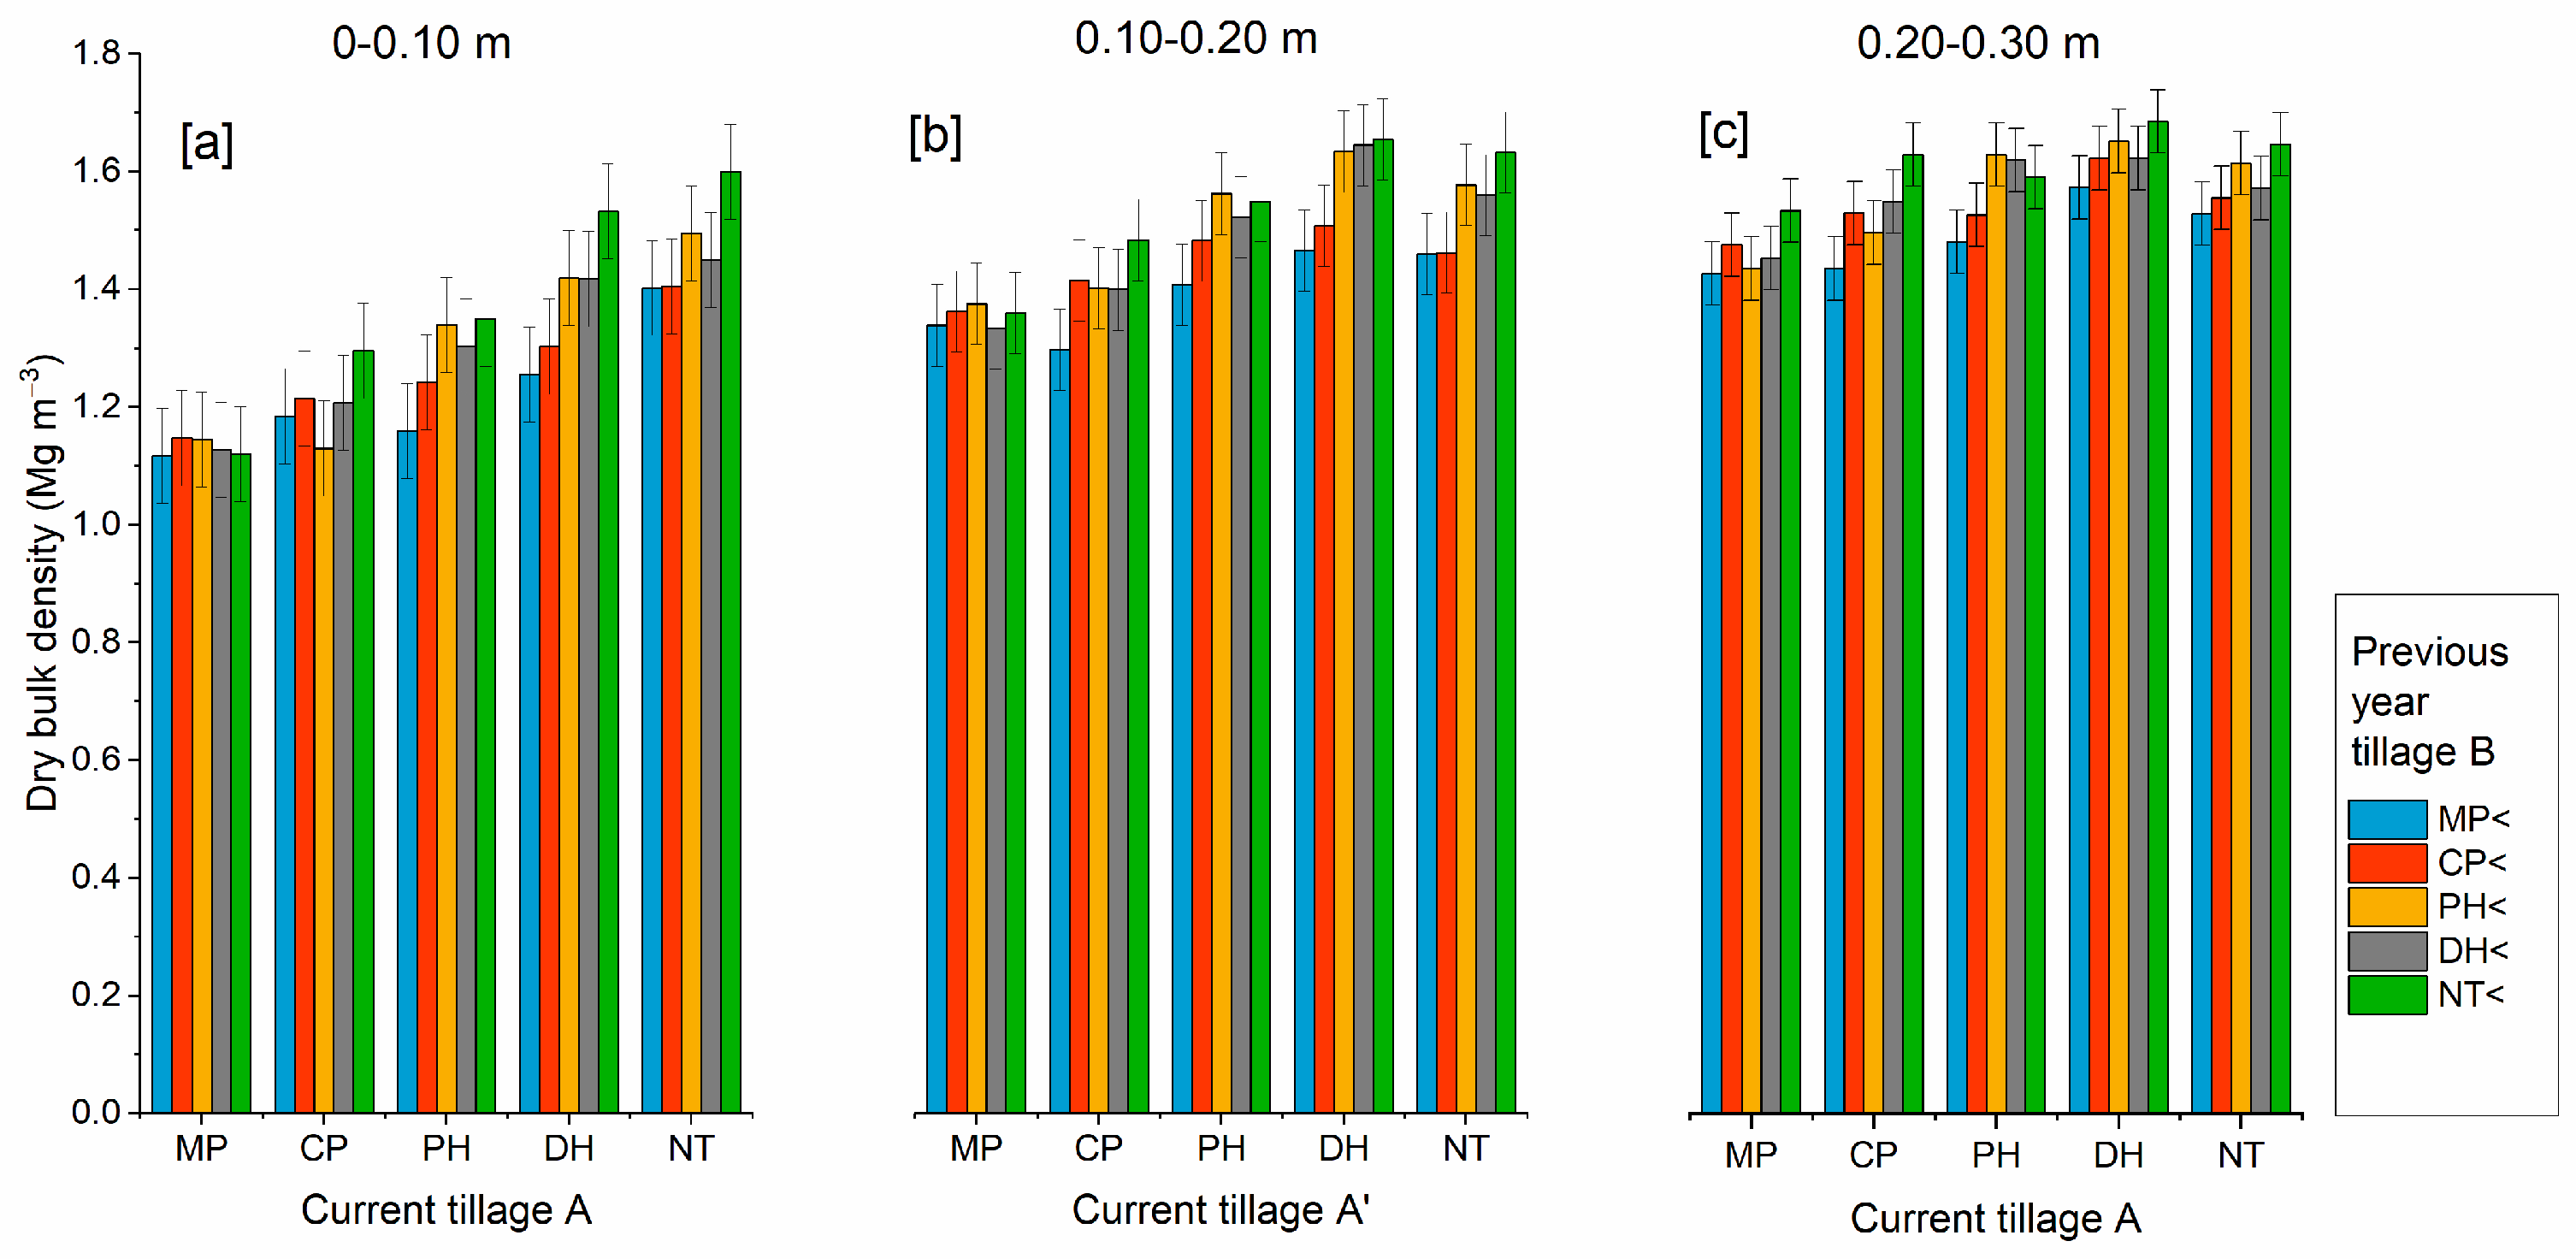
In the following year, rotations to the tillage treatments were introduced (Figure 9). The plots receiving the same tillage treatment for a fifth year continue to present the same behavior. MP had a DBD of 1.11 Mg∙m−3 at the 0–0.10 m sampling depth, which increased to 1.33 Mg∙m−3 at the 0.10–0.20 m depth and reached 1.42 Mg∙m−3 at a depth of 0.20–0.30 m. NT, on the other hand, presented an increased DBD of 1.60 Mg∙m−3, even from the topsoil layer that reached a peak of 1.64 Mg∙m−3 at the 0.20–0.30 m depth. Intermediate values were found for the rest of the tillage treatments. It is remarkable that the previous year’s tillage presented a considerable residual effect on soil compaction. Whenever a deep kind of tillage was performed during the previous year (including moldboard plowing or the use of a chisel plow), the soil compaction was lower. The effect was more profound at the less intensive methods of DH and NT. For instance, the DBD at the DH method for the 0–0.10 m layer was 1.41 Mg∙m−3 when the method was applied constantly, but dropped to 1.12 Mg∙m−3 if moldboard plowing had been performed during the previous year. At a greater depth of 0.10–0.20 m, DBD was 1.64 Mg∙m−3 and 1.33 Mg∙m−3, respectively. The same applied when no-tillage was performed after moldboard plowing. These differences were statistically significant (p-values < 0.001, Supplementary Materials Table S7).
In 2002, tillage direction was reverted to the initial direction, so combinations of the five currently applied methods and the methods employed in the previous year were formed again (Figure 10). The results follow a similar pattern with Figure 9, indicating that the most significant impact comes primarily from the recent tillage and secondly from the tillage performed in the previous year (see F-statistic in Table S7, Supplementary Materials). The permanent application of no-tillage increased DBD at around 1.57 Mg∙m−3 at the topsoil layer and at 1.64–1.66 Mg∙m−3 at greater depths. The increased soil compaction was relieved whenever a deep tillage operation was intervened. Plowing or chisel plowing, for instance, during the previous year kept the DBD of the soil at a 0–0.10 m depth below 1.40 Mg∙m−3. The benefits, however, are limited to greater depths. On the other hand, soil crumbling was easier whenever a more intensive tillage was applied in the previous year. For instance, the power harrow resulted in a DBD of 1.15 Mg∙m−3 when it was used after plowing, but raised to 1.38 Mg∙m−3 when it was used after no-tillage. The results again comply with the corresponding PR measurements.
3.3. Soil Organic Matter
The preliminary measurements from 1997 revealed an average SOM content of 2.27% at the topsoil (0–0.15 m) layer and 2.07% at the 0.15–0.30 m depth (Figure 11a,b). No statistical differences among the plots were detected during that time because the measurements were conducted prior to the introduction of the tillage treatments. The trend was similar for the two fields, although Field 1 had a slightly higher SOM at both depths (Supplementary Materials Table S8).
Five years later, in 2001, no-tillage significantly improved the SOM from 2.26% to 2.83% at the topsoil layer (Figure 11a and Supplementary Materials Table S9). DH also raised SOM from 2.22% to 2.50%. On the contrary, continuous moldboard plowing caused a significant reduction in SOM from 2.20% to 1.44%, while PH had an also negative, but weaker effect, reducing SOM from 2.31% to 2.16%. Finally, CP didn’t show any important impact at the topsoil SOM until 2001, but caused a 0.2% reduction in the next year. At a greater depth of 0.15–0.30 m (Figure 11b), all the methods that imposed a reduction in SOM from 1997 to 2001 remained stable or slightly increased in the following year, except for the conventional MP, where SOM continued to drop. The findings, however, were rather opposite compared to the topsoil. Permanent MP presented greater SOM than permanent NT. While NT retains all the plant residue on the soil surface, the moldboard plow causes soil inversion and mixing of the plant residue into deeper layers, where they decompose and enrich the organic deposits. The overall impacts at a 0–0.30 m arable layer were positive for NT, slightly negative for the reduced tillage methods of CP, DH, and PH, and strongly negative for the intensive MP method (Figure 11c). NT resulted in an increase in SOM from 1997 to 2002 of 0.09%, while MP caused a decrease of 0.61%.
Figure 12 and Figure 13 examine the combined effects of previous and current tillage treatments in 2001 and 2002, respectively. The results prove that soil disturbance enhances SOM decay. Most of the beneficial effects in SOM were inverted whenever a more intensive tillage system was introduced over a less intensive one. Plowing in 2001 after four years of no-tillage, for instance, significantly decreased SOM from 2.83% to 1.54% at the topsoil layer. Less intensive methods such as CP and PH were less destructive, decreasing SOM after NT by 0.43–0.45%, while DH had almost a null effect (Figure 12a). At a deeper depth, the impacts were less profound (Figure 12b) and less statically important (lower F-statistic, Table S9, Supplementary Materials). It is remarkable, nonetheless, that the greatest SOM content is found when plowing was performed after a four-year no-tillage period (MP/NT < combination). In that case, the enrichment in SOM was greater because all the enhanced organic matter built into the surface of NT was buried into deeper layers. Regarding the overall impacts at the 0–0.30 m layer (Figure 12c and Table S9, Supplementary Materials) it is found that continuous long-term no-tillage was the most beneficial in terms of gains in SOM. The difference was statistically significant with all the other treatments that involved another tillage method in the previous year. On the other hand, moldboard plowing had the most negative residual effect. The worst combination was the application of a power harrow after a four-year moldboard plowing period (PH/MP<).
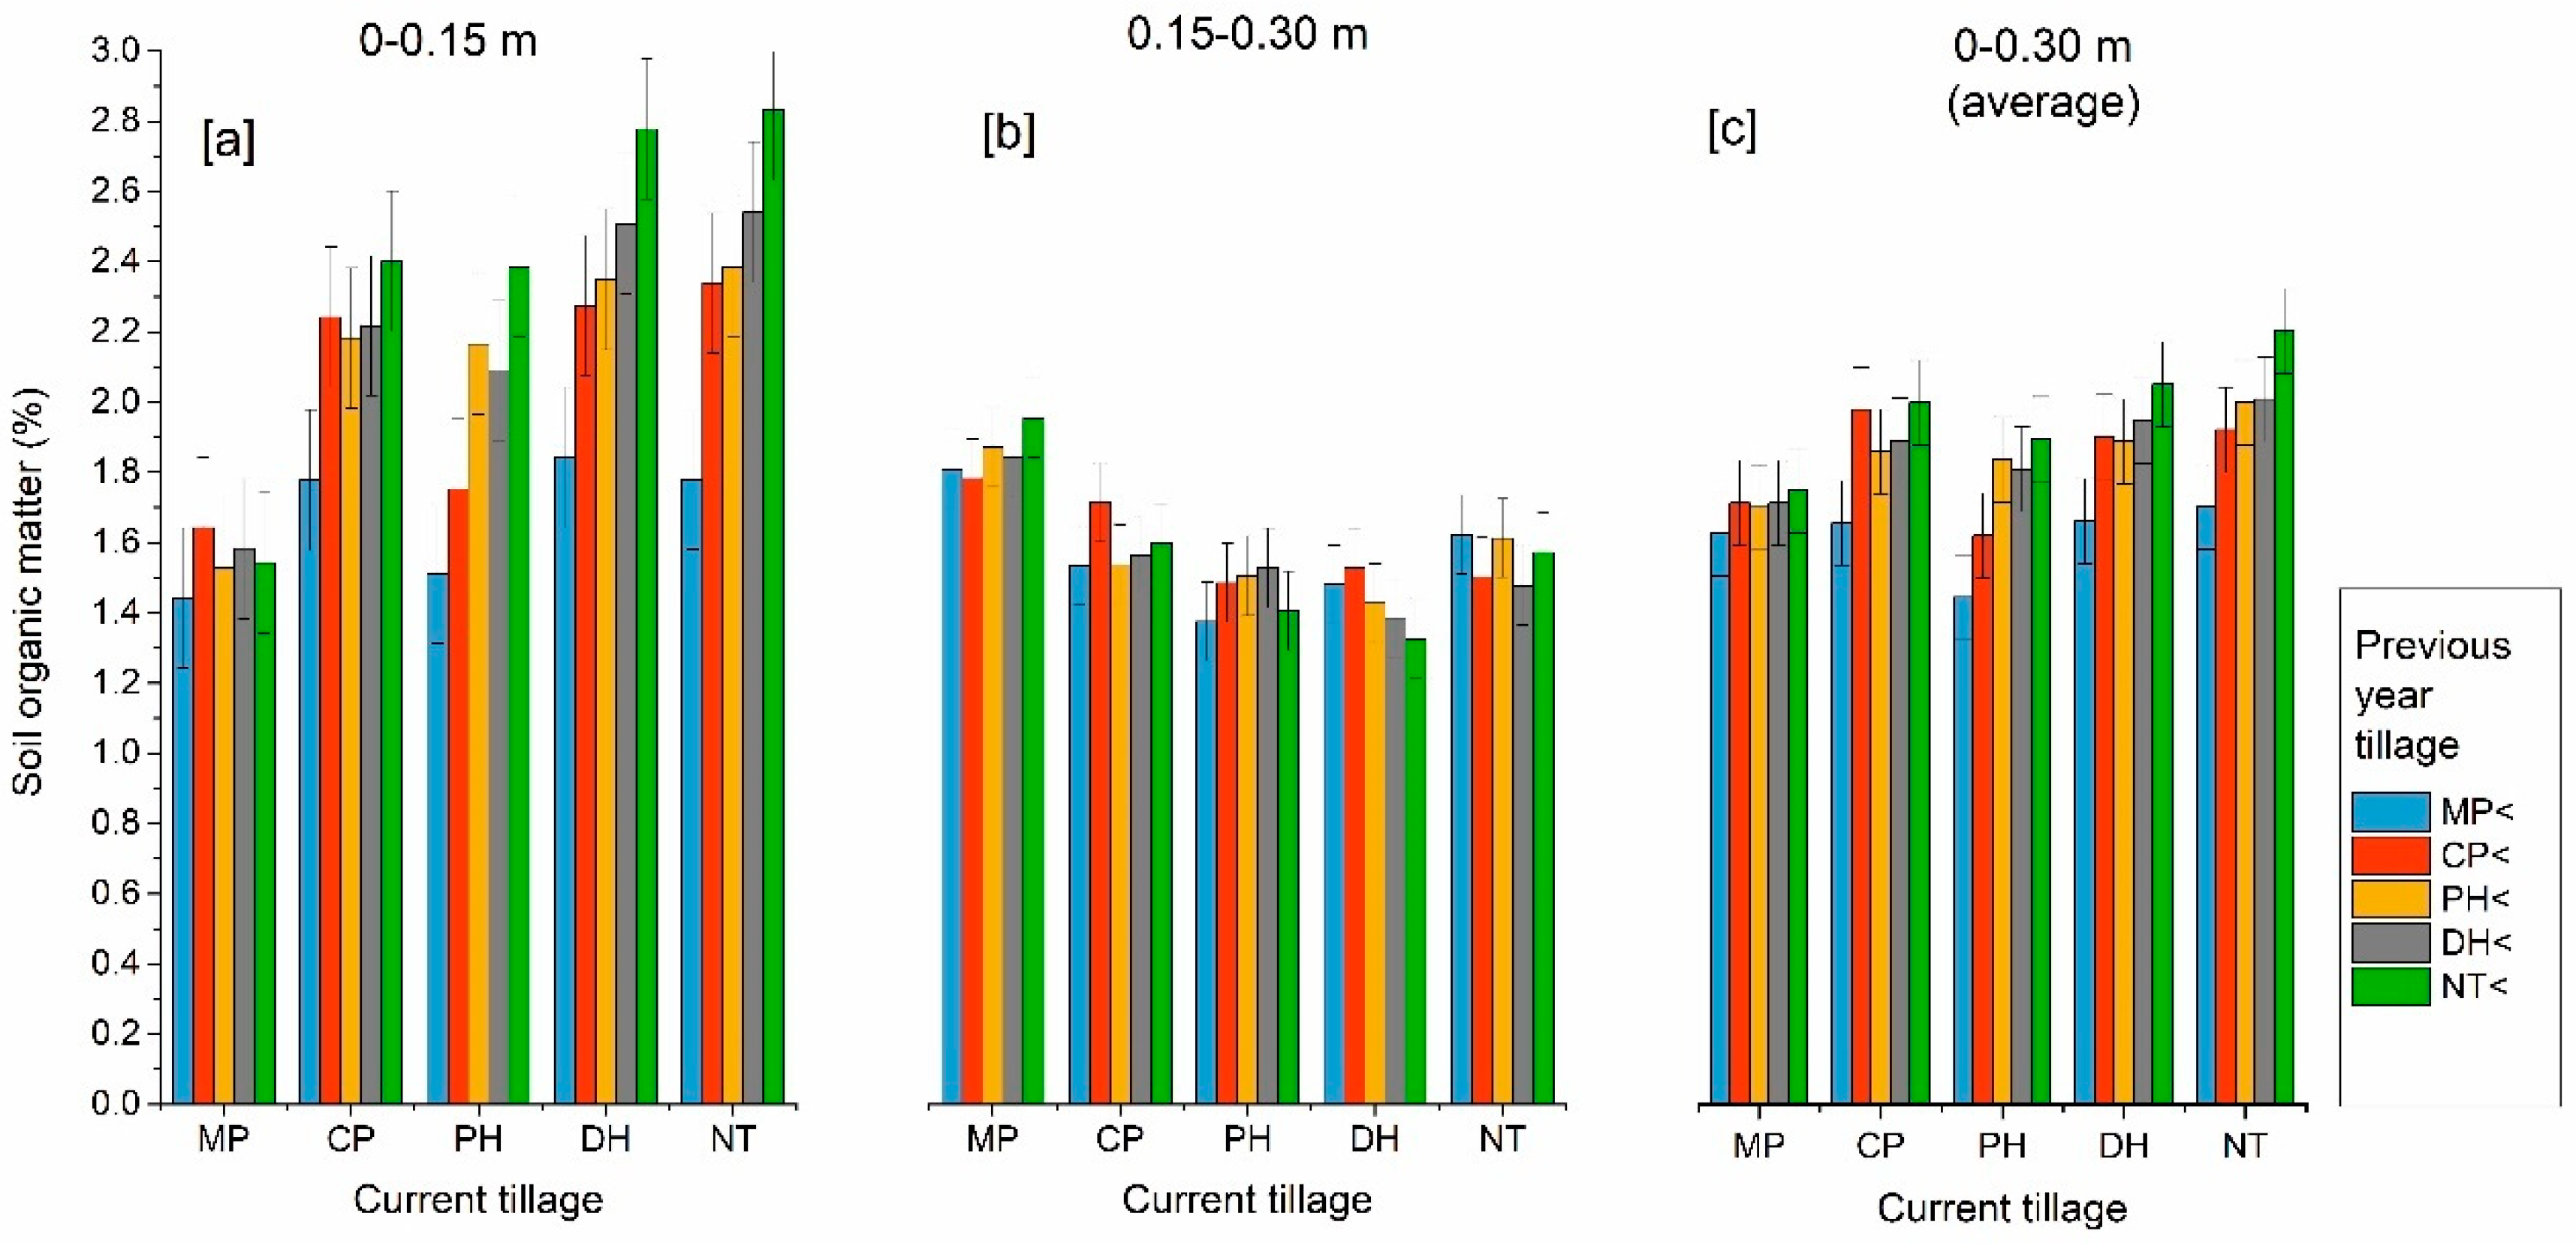
During the next year (2002), tillage was revered to the initial direction. That way, tillage rotations of the type 4MP-1CP-1MP, 4NT-1MP-1NT etc. were formed. As shown in Figure 13a, there is a much greater amount of SOM at the topsoil layer for the reduced and the no-tillage methods, either applied recently or during the previous year. On the other hand, one year of moldboard plowing was able to compensate for almost all the benefits obtained in the top layer from the continuous application of a conservation tillage system. For example, while six years of continuous NT raised the SOM at 2.90%, the intervention of moldboard plowing in the fifth year caused a significant reduction to 1.79%. Nevertheless, not all the fixed SOM was lost, but a part of it was reallocated at a greater depth, as shown in Figure 13b. At the 0.15–0.30 m depth, the NT/MP tillage rotation presented a SOM of 1.95% compared to 1.57% found on the permanent NT. The benefits apply not only for NT, but also for all the other reduced tillage methods that facilitate the accumulation of the SOM on the topsoil layer. Overall, at the 0–0.30 m layer, the greatest advantage was for the permanent NT that significantly increased the SOM at 2.24% compared to 1.87% for the NT/MP tillage rotation, or 1.54% for permanent MP (Figure 13c and Table S9, Supplementary Materials). It is also remarkable that the permanent CP facilitated both the increase in SOM and its uniform distribution on the soil profile. The permanent CP method presented an increased SOM content, both at the top and the deeper sampling depths (2.03% and 1.81%, respectively) (Figure 13a,b) that led to an increased total amount at the whole profile (1.92%) (Figure 13c and Table S9, Supplementary Materials).
4. Discussion
The results of the present study confirm the farmers’ concerns about soil compaction issues in no-till systems, particularly when applied to soils low in organic carbon content, as seen in southern Europe. Both penetration resistance (PR) and dry bulk density (DBD) measurements reveal that fact. The values increase as the tillage system becomes less intensive and is consistently practiced over a greater period. Similar findings were reported by other authors [67,68,69,70]. In our study, the PR exceeded the 2500 kPa after five years of constant NT and DH application, and dry bulk density reached 1.60 Mg∙m−3, even at the top 0–0.10 m soil layer. PR values greater than 2500 kPa are considered to hinder the elongation of the roots [70]. Increased PR for the conservation tillage treatments, however, may also imply enhanced soil aggregate stability [71]. On the other hand, avoiding soil disturbance led to an important improvement in the SOM content. While the introduction of soil inversion through moldboard plowing in the two fields that were previously at fallow caused a considerable loss in SOM of 0.79% in the topsoil (0–0.15 m) layer, the NT led to a further improvement of 0.64%. As a result, the two methods differed 1.43% in the topsoil after five years. Organic matter in the topsoil has a critical role in soil protection. It promotes the binding of inorganic soil particles, facilitating the formation of more stable soil aggregates that exhibit enhanced resistance to both soil erosion and compaction [70,71,72]. Furthermore, this topsoil organic matter serves as a vital resource for the soil biota that is predominantly concentrated in the uppermost soil layer [73]. Soil microorganisms transform the soil into a thriving ecosystem that fosters nutrient cycling and improves fertility [14,74,75,76]. Nonetheless, it is important to note that soil inversion induced by the plow did not result in a total loss of the fixed carbon. Instead, a portion of it underwent a redistribution into deeper soil layers, as evidenced by the measurements in the years 2001 and 2002. Plowing after four years of no-tillage, for instance, resulted in the highest amount of SOM for the lower, 0.15–0.30 m, layer. Subsequently, when returning to a no-tillage system in the consequent year, the benefits were even higher (SOM = 1.96% compared to 1.57% for permanent NT). Moreover, the plowing intervention had an additional advantage by relieving soil compaction in NT. The effects of this soil loosening persisted even after transitioning back to no-tillage in the subsequent year, and they could be detected for another two years.
Examining the overall impacts in the 0–0.30 m soil layer, the most beneficial method for fixing carbon into the soil was the permanent application of no-tillage. The SOM content after six years of continuous NT was 2.24%, the highest of any other tillage combination. In contrast, continuous MP resulted in a SOM of 1.54%. However, it could be raised to 1.87% if plowing was applied only once every four years to deal with soil compaction in a rotational NT/MP scheme. Besides, as shown in weed measurements during the 2001 period, deep plowing also provided benefits in weed suppression [77].
The CP method also showed interesting results. The chisel plow demonstrated a soil loosening capacity compatible with MP. It also facilitated both the increase of SOM and its uniform distribution on the soil profile. The occasional use of a chisel plow in a NT system and the permanent CP system provided similar results. Studies in Spain and China demonstrated also that the occasional use of tools with shanks, such as chisel plows or subsoilers, could serve as an alternative to the moldboard plow for relieving soil compaction in no-tillage without destroying its biochemical and biological benefits [46,47,63,69]. Occasional subsoiling in no-till systems have been also proved to improve water storage and facilitate higher crop yields [45]. Nevertheless, subsoiling is a high-cost operation requiring a lot of energy, while its effects decrease over time, making new subsoiling necessary after few years [44]. On the other hand, chisel plows require almost half the energy compared to conventional moldboard plowing and subsoilers, as depicted from tractor draft force measurements on the same trials [78]. The present study indicates that a chisel plow rotational system may provide substantial benefits in relieving soil compaction, at a considerably lower cost and lower soil carbon losses compared to moldboard plowing. The worst combination for fixing soil carbon was the application of a power harrow after moldboard plowing, while the worst combination for exacerbating soil compaction was the use of a disc harrow after a period of no-tillage.
Yield data from the same experiments concerning the 1997–2002 period are published in several articles [79,80,81,82,83] and demonstrate that crop yields in the permanent no-tillage and reduced tillage treatments were 4–37% lower compared to conventional plowing. The most negative effects were observed in permanent NT. Nevertheless, when a plowing operation was intervened in the previous year, the yield losses were considerably diminished, or even equaled MP [83].
The above findings suggest that adoption of rotational soil tillage schemes, which combine no-tillage and occasional plowing or no-tillage and chiseling, are effective alternatives that strike a balance between soil compaction and carbon sequestration. Constant chisel plowing is also another option. Despite providing approximately half the carbon credits compared to permanent no-tillage, these systems offer practical solutions for mitigating farmers’ concerns about soil compaction, which is a prominent obstacle to the realization of more sustainable farming practices in the context of southern Europe. Notably, a meta-analysis study published in 2020 [51] tracked down only two relevant studies in Europe (Spain) out of 68 worldwide.
Eventually, the appropriate implementation of regenerative agriculture practices encapsulating the principles of minimum soil disturbance, permanent soil coverage, and crop diversification is expected to optimize the system’s performance, but farmers certainly need well-informed advisory services and particular guidance to overcome all the buriers by increasing their resource-use efficiency and soil conserving ability [10,84].
5. Conclusions
Permanent no-tillage was the most effective method for sequestering soil carbon. Over a span of six continuous years of no-tillage application, the SOM content was increased by 0.70% compared to continuous plowing. Nevertheless, this accomplishment was obscured by emerging soil compaction identified from increased bulk density and soil penetration resistance measurements. When constant no-tillage was interrupted by a moldboard plowing or a chisel plowing operation in a rotational tillage scheme, the gains in SOM were 0.33–0.46%. Notably, plowing introduced a more uniform distribution of SOM into the soil profile compared to the accumulated carbon at the topsoil layer in no-tillage. Residual soil loosening effects were still noticeable for up to four years after plowing, with the most prominent effects observed within the initial two years. A permanent, chisel plow-based system had similar impacts with the rotational, no-tillage/moldboard plowing approach. The results indicate that carbon credits in carbon farming may be halved if periodic deep tillage operations should be introduced to counteract the consequences of extreme soil compaction.
Supplementary Materials
The following supporting information can be downloaded at: https://www.mdpi.com/article/10.3390/soilsystems7040090/s1, Table S1: Results from the statistical analysis for the 1997 penetration resistance measurements, Table S2: Results from the statistical analysis for the 1999 penetration resistance measurements, Table S3: Results from the statistical analysis for the 2001 penetration resistance measurements, Table S4: Results from the statistical analysis for the 2002 penetration resistance measurements, Table S5: Volumetric, average soil water content during the penetration resistance measurements, Table S6: Results from the statistical analysis for the 2000 soil dry bulk density measurements, Table S7: Results from the statistical analysis for 2001 and 2002 soil dry bulk density measurements, Table S8: Results from the statistical analysis for the preliminary (1997) soil organic matter measurements, Table S9: Results from the statistical analysis for 2001 and 2002 soil organic matter measurements.
Author Contributions
Conceptualization, C.C. and T.G.; methodology, C.C. and T.G.; formal analysis, C.C.; investigation, C.C. and C.K.; data curation, C.C. and C.K.; writing—original draft preparation, C.C.; writing—review and editing, C.C. and T.G.; visualization, C.C.; supervision, C.C. All authors have read and agreed to the published version of the manuscript.
Funding
This research received no external funding.
Institutional Review Board Statement
Not applicable.
Informed Consent Statement
Not applicable.
Data Availability Statement
Data are provided from the authors on demand.
Conflicts of Interest
The authors declare no conflict of interest.
References
- Claassen, R.; Bowman, M.; McFadden, J.; Smith, D.; Wallander, S. Tillage Intensity and Conservation Cropping in the United States; United States Department Agriculture USDA: Washington DC, USA, 2018; pp. 1–18.
- Kassam, A.; Friedrich, T.; Derpsch, R. Global spread of Conservation Agriculture. Int. J. Environ. Stud. 2019, 76, 29–51. [Google Scholar] [CrossRef]
- Kertész, Á.; Madarász, B. Conservation Agriculture in Europe. Int. Soil Water Conserv. Res. 2014, 2, 91–96. [Google Scholar] [CrossRef]
- Farooq, M.; Flower, K.C.; Jabran, K.; Wahid, A.; Siddique, K.H.M. Crop yield and weed management in rainfed conservation agriculture. Soil Tillage Res. 2011, 117, 172–183. [Google Scholar] [CrossRef]
- Derrouch, D.; Dessaint, F.; Fried, G.; Chauvel, B. Weed community diversity in conservation agriculture: Post-adoption changes. Agric. Ecosyst. Environ. 2021, 312, 107351. [Google Scholar] [CrossRef]
- Van den Putte, A.; Govers, G.; Diels, J.; Gillijns, K.; Demuzere, M. Assessing the effect of soil tillage on crop growth: A meta-regression analysis on European crop yields under conservation agriculture. Eur. J. Agron. 2010, 33, 231–241. [Google Scholar] [CrossRef]
- Soane, B.D.; Ball, B.C.; Arvidsson, J.; Basch, G.; Moreno, F.; Roger-Estrade, J. No-till in northern, western and south-western Europe: A review of problems and opportunities for crop production and the environment. Soil Tillage Res. 2012, 118, 66–87. [Google Scholar] [CrossRef]
- Landers, J.N.; de Freitas, P.L.; de Oliveira, M.C.; Neto, S.P.d.S.; Ralisch, R.; Kueneman, E.A. Next steps for conservation agriculture. Agronomy 2021, 11, 2496. [Google Scholar] [CrossRef]
- Khangura, R.; Ferris, D.; Wagg, C.; Bowyer, J. Regenerative Agriculture—A Literature Review on the Practices and Mechanisms Used to Improve Soil Health. Sustainability 2023, 15, 2338. [Google Scholar] [CrossRef]
- Sharma, M.; Kaushal, R.; Kaushik, P.; Ramakrishna, S. Carbon farming: Prospects and challenges. Sustainability 2021, 13, 11122. [Google Scholar] [CrossRef]
- Lal, R. Carbon farming by re-carbonization of agroecosystems. Pedosphere 2021, 33, 676–679. [Google Scholar] [CrossRef]
- Page, C.; Witt, B. A Leap of Faith: Regenerative Agriculture as a Contested Worldview Rather Than as a Practice Change Issue. Sustainability 2022, 14, 14803. [Google Scholar] [CrossRef]
- Li, Y.; Chang, S.X.; Tian, L.; Zhang, Q. Conservation agriculture practices increase soil microbial biomass carbon and nitrogen in agricultural soils: A global meta-analysis. Soil Biol. Biochem. 2018, 121, 50–58. [Google Scholar] [CrossRef]
- Roger-Estrade, J.; Anger, C.; Bertrand, M.; Richard, G. Tillage and soil ecology: Partners for sustainable agriculture. Soil Tillage Res. 2010, 111, 33–40. [Google Scholar] [CrossRef]
- Lou, Y.; Xu, M.; Chen, X.; He, X.; Zhao, K. Stratification of soil organic C, N and C:N ratio as affected by conservation tillage in two maize fields of China. Catena 2012, 95, 124–130. [Google Scholar] [CrossRef]
- López, M.V.; Blanco-Moure, N.; Limón, M.Á.; Gracia, R. No tillage in rainfed Aragon (NE Spain): Effect on organic carbon in the soil surface horizon. Soil Tillage Res. 2012, 118, 61–65. [Google Scholar] [CrossRef]
- Xue, J.F.; Qi, Z.W.; Chen, J.L.; Cui, W.H.; Lin, W.; Gao, Z.Q. Dynamic of Soil Porosity and Water Content under Tillage during Summer Fallow in the Dryland Wheat Fields of the Loess Plateau in China. Land 2023, 12, 230. [Google Scholar] [CrossRef]
- Eden, M.; Bachmann, J.; Cavalaris, C.; Kostopoulou, S.; Kozaiti, M.; Böttcher, J. Soil structure of a clay loam as affected by long-term tillage and residue management. Soil Tillage Res. 2020, 204, 104734. [Google Scholar] [CrossRef]
- Weidhuner, A.; Hanauer, A.; Krausz, R.; Crittenden, S.J.; Gage, K.; Sadeghpour, A. Tillage impacts on soil aggregation and aggregate-associated carbon and nitrogen after 49 years. Soil Tillage Res. 2021, 208, 104878. [Google Scholar] [CrossRef]
- Munkholm, L.J.; Heck, R.J.; Deen, B. Long-term rotation and tillage effects on soil structure and crop yield. Soil Tillage Res. 2013, 127, 85–91. [Google Scholar] [CrossRef]
- Bauer, T.; Strauss, P.; Grims, M.; Kamptner, E.; Mansberger, R.; Spiegel, H. Long-term agricultural management effects on surface roughness and consolidation of soils. Soil Tillage Res. 2015, 151, 28–38. [Google Scholar] [CrossRef]
- Kuhwald, M.; Dörnhöfer, K.; Oppelt, N.; Duttmann, R. Spatially explicit soil compaction risk assessment of arable soils at regional scale: The SaSCiA-Model. Sustainability 2018, 10, 1618. [Google Scholar] [CrossRef]
- Jamali, H.; Nachimuthu, G.; Palmer, B.; Hodgson, D.; Hundt, A.; Nunn, C.; Braunack, M. Soil compaction in a new light: Know the cost of doing nothing—A cotton case study. Soil Tillage Res. 2021, 213, 105158. [Google Scholar] [CrossRef]
- Lamandé, M.; Greve, M.H.; Schjønning, P. Risk assessment of soil compaction in Europe–Rubber tracks or wheels on machinery. Catena 2018, 167, 353–362. [Google Scholar] [CrossRef]
- Shahgholi, G.; Moinfar, A.; Khoramifar, A.; Maciej, S.; Szymanek, M. Investigating the Effect of Tractor’s Tire Parameters on Soil Compaction Using Statistical and Adaptive Neuro-Fuzzy Inference System (ANFIS) Methods. Agriculture 2023, 13, 259. [Google Scholar] [CrossRef]
- Kadžienž, G.; Munkholm, L.J.; Mutegi, J.K. Root growth conditions in the topsoil as affected by tillage intensity. Geoderma 2011, 166, 66–73. [Google Scholar] [CrossRef]
- Radford, B.J.; Yule, D.F.; McGarry, D.; Playford, C. Crop responses to applied soil compaction and to compaction repair treatments. Soil Tillage Res. 2001, 61, 157–166. [Google Scholar] [CrossRef]
- Anazodo, U.G.N.; Raghavan, G.S.V.; McKyes, E.; Norris, E.R. Physico-mechanical properties and yield of silage corn as affected by soil compaction and tillage methods. Soil Tillage Res. 1983, 3, 331–345. [Google Scholar] [CrossRef]
- Arvidsson, J.; Håkansson, I. Response of different crops to soil compaction-Short-term effects in Swedish field experiments. Soil Tillage Res. 2014, 138, 56–63. [Google Scholar] [CrossRef]
- Chinn, C.; Pillai, U.P.P. Self-repair of compacted Vertisols from Central Queensland, Australia. Geoderma 2008, 144, 491–501. [Google Scholar] [CrossRef]
- Wang, X.; Wang, C.; Wang, X.; Huo, Z. Response of soil compaction to the seasonal freezing-thawing process and the key controlling factors. Catena 2020, 184, 104247. [Google Scholar] [CrossRef]
- Sarmah, A.K.; Pillai-McGarry, U.; McGarry, D. Repair of the structure of a compacted Vertisol via wet/dry cycles. Soil Tillage Res. 1996, 38, 17–33. [Google Scholar] [CrossRef]
- Radford, B.J.; Yule, D.F.; McGarry, D.; Playford, C. Amelioration of soil compaction can take 5 years on a Vertisol under no till in the semi-arid subtropics. Soil Tillage Res. 2007, 97, 249–255. [Google Scholar] [CrossRef]
- Lopez-Bellido, R.J.; Muñoz-Romero, V.; Lopez-Bellido, F.J.; Guzman, C.; Lopez-Bellido, L. Crack formation in a mediterranean rainfed Vertisol: Effects of tillage and crop rotation. Geoderma 2016, 281, 127–132. [Google Scholar] [CrossRef]
- Barzegar, A.R.; Rengasamy, P.; Oades, J.M. Effects of clay type and rate of wetting on the mellowing of compacted soils. Geoderma 1995, 68, 39–49. [Google Scholar] [CrossRef]
- Parvin, N.; Sandin, M.; Larsbo, M. Seedbed consolidation and surface sealing for soils of different texture and soil organic carbon contents. Soil Tillage Res. 2021, 206, 104849. [Google Scholar] [CrossRef]
- Torres, J.L.R.; Leal Júnior, A.L.B.; Barreto, A.C.; Carvalho, F.J.; de Assis, R.L.; Loss, A.; Lemes, E.M.; da Silva Vieira, D.M. Mechanical and Biological Soil Decompaction for No-Tillage Maize Production. Agronomy 2022, 12, 2310. [Google Scholar] [CrossRef]
- Jabro, J.D.; Allen, B.L.; Rand, T.; Dangi, S.R.; Campbell, J.W. Effect of Previous Crop Roots on Soil Compaction in 2 Yr Rotations under a No-Tillage System. Land 2021, 10, 202. [Google Scholar] [CrossRef]
- Ferreira, C.J.B.; Tormena, C.A.; Severiano, E.d.C.; Nunes, M.R.; de Menezes, C.C.E.; Antille, D.L.; Preto, V.R.d.O. Effectiveness of narrow tyne and double-discs openers to overcome shallow compaction and improve soybean yield in long-term no-tillage soil. Soil Tillage Res. 2023, 227, 105622. [Google Scholar] [CrossRef]
- Peralta, G.; Alvarez, C.R.; Taboada, M.Á. Soil compaction alleviation by deep non-inversion tillage and crop yield responses in no tilled soils of the Pampas region of Argentina. A meta-analysis. Soil Tillage Res. 2021, 211, 105022. [Google Scholar] [CrossRef]
- Qiang, X.; Sun, J.; Ning, H. Impact of Subsoiling on Cultivated Horizon Construction and Grain Yield of Winter Wheat in the North China Plain. Agriculture 2022, 12, 236. [Google Scholar] [CrossRef]
- Tim Chamen, W.C.; Moxey, A.P.; Towers, W.; Balana, B.; Hallett, P.D. Mitigating arable soil compaction: A review and analysis of available cost and benefit data. Soil Tillage Res. 2015, 146, 10–25. [Google Scholar] [CrossRef]
- Botta, G.F.; Jorajuria, D.; Balbuena, R.; Ressia, M.; Ferrero, C.; Rosatto, H.; Tourn, M. Deep tillage and traffic effects on subsoil compaction and sunflower (Helianthus annus L.) yields. Soil Tillage Res. 2006, 91, 164–172. [Google Scholar] [CrossRef]
- Martínez, I.G.; Prat, C.; Ovalle, C.; del Pozo, A.; Stolpe, N.; Zagal, E. Subsoiling improves conservation tillage in cereal production of severely degraded Alfisols under Mediterranean climate. Geoderma 2012, 189–190, 10–17. [Google Scholar] [CrossRef]
- Qin, H.-L.; Gao, W.-S.; Ma, Y.-C.; Ma, L.; Yin, C.-M.; Chen, Z.; Chen, C. Effects of Subsoiling on Soil Moisture Under No-Tillage for Two Years. Agric. Sci. China 2008, 7, 88–95. [Google Scholar] [CrossRef]
- Wang, Q.; Lu, C.; Li, H.; He, J.; Sarker, K.K.; Rasaily, R.G.; Liang, Z.; Qiao, X.; Li, H.; Mchugh, A.D.J. The effects of no-tillage with subsoiling on soil properties and maize yield: 12-Year experiment on alkaline soils of Northeast China. Soil Tillage Res. 2014, 137, 43–49. [Google Scholar] [CrossRef]
- Wang, R.; Ma, L.; Lv, W.; Li, J. Rotational Tillage: A Sustainable Management Technique for Wheat Production in the Semiarid Loess Plateau. Agriculture 2022, 12, 1582. [Google Scholar] [CrossRef]
- Hou, X.; Li, R.; Jia, Z.; Han, Q.; Wang, W.; Yang, B. Effects of rotational tillage practices on soil properties, winter wheat yields and water-use efficiency in semi-arid areas of north-west China. Field Crops Res. 2012, 129, 7–13. [Google Scholar] [CrossRef]
- Hou, X.Q.; Li, R.; Jia, Z.K.; Han, Q.F. Effect of Rotational Tillage on Soil Aggregates, Organic Carbon and Nitrogen in the Loess Plateau Area of China. Pedosphere 2013, 23, 542–548. [Google Scholar] [CrossRef]
- Zhang, Y.; Tan, C.; Wang, R.; Li, J.; Wang, X. Conservation tillage rotation enhanced soil structure and soil nutrients in long-term dryland agriculture. Eur. J. Agron. 2021, 131, 126379. [Google Scholar] [CrossRef]
- Peixoto, D.S.; da Silva, L.D.C.M.; De Melo, L.B.B.; Azevedo, R.P.; Araújo, B.C.L.; De Carvalho, T.S.; Moreira, S.G.; Curi, N.; Silva, B.M. Occasional tillage in no-tillage systems: A global meta-analysis. Sci. Total Environ. 2020, 745, 140887. [Google Scholar] [CrossRef]
- Murindangabo, Y.T.; Kopecký, M.; Konvalina, P.; Ghorbani, M.; Perná, K.; Nguyen, T.G.; Bernas, J.; Baloch, S.B.; Hoang, T.N.; Eze, F.O.; et al. Quantitative Approaches in Assessing Soil Organic Matter Dynamics for Sustainable Management. Agronomy 2023, 13, 1776. [Google Scholar] [CrossRef]
- Gajda, A.M.; Czyż, E.A.; Klimkowicz-Pawlas, A. Effects of different tillage intensities on physicochemical and microbial properties of a eutric fluvisol soil. Agronomy 2021, 11, 1497. [Google Scholar] [CrossRef]
- Jakab, G.; Madarász, B.; Masoudi, M.; Karlik, M.; Király, C.; Zacháry, D.; Filep, T.; Dekemati, I.; Centeri, C.; Al-Graiti, T.; et al. Soil organic matter gain by reduced tillage intensity: Storage, pools, and chemical composition. Soil Tillage Res. 2023, 226, 105584. [Google Scholar] [CrossRef]
- Schwen, A.; Bodner, G.; Scholl, P.; Buchan, G.D.; Loiskandl, W. Temporal dynamics of soil hydraulic properties and the water-conducting porosity under different tillage. Soil Tillage Res. 2011, 113, 89–98. [Google Scholar] [CrossRef]
- Zuber, S.M.; Villamil, M.B. Meta-analysis approach to assess effect of tillage on microbial biomass and enzyme activities. Soil Biol. Biochem. 2016, 97, 176–187. [Google Scholar] [CrossRef]
- Franco-Luesma, S.; Cavero, J.; Plaza-Bonilla, D.; Cantero-Martínez, C.; Arrúe, J.L.; Álvaro-Fuentes, J. Tillage and irrigation system effects on soil carbon dioxide (CO2) and methane (CH4) emissions in a maize monoculture under Mediterranean conditions. Soil Tillage Res. 2020, 196, 104488. [Google Scholar] [CrossRef]
- Dachraoui, M.; Sombrero, A. Effect of tillage systems and different rates of nitrogen fertilisation on the carbon footprint of irrigated maize in a semiarid area of Castile and Leon, Spain. Soil Tillage Res. 2020, 196, 104472. [Google Scholar] [CrossRef]
- González-Sánchez, E.J.; Ordóñez-Fernández, R.; Carbonell-Bojollo, R.; Veroz-González, O.; Gil-Ribes, J.A. Meta-analysis on atmospheric carbon capture in Spain through the use of conservation agriculture. Soil Tillage Res. 2012, 122, 52–60. [Google Scholar] [CrossRef]
- Schwengbeck, L.; Hölting, L.; Witing, F. Modeling Climate Regulation of Arable Soils in Northern Saxony under the Influence of Climate Change and Management Practices. Sustainability 2023, 15, 11128. [Google Scholar] [CrossRef]
- Van Hoof, S. Climate Change Mitigation in Agriculture: Barriers to the Adoption of Carbon Farming Policies in the EU. Sustainability 2023, 15, 10452. [Google Scholar] [CrossRef]
- Dumbrell, N.P.; Kragt, M.E.; Gibson, F.L. What carbon farming activities are farmers likely to adopt? A best-worst scaling survey. Land Use Policy 2016, 54, 29–37. [Google Scholar] [CrossRef]
- Melero, S.; Panettieri, M.; Madejón, E.; Macpherson, H.G.; Moreno, F.; Murillo, J.M. Implementation of chiselling and mouldboard ploughing in soil after 8 years of no-till management in SW, Spain: Effect on soil quality. Soil Tillage Res. 2011, 112, 107–113. [Google Scholar] [CrossRef]
- López-Garrido, R.; Madejón, E.; Murillo, J.M.; Moreno, F. Soil quality alteration by mouldboard ploughing in a commercial farm devoted to no-tillage under Mediterranean conditions. Agric. Ecosyst. Environ. 2011, 140, 182–190. [Google Scholar] [CrossRef]
- ASABE Stand. S313.3. FEB1999; Soil Cone Penetrometer. ASABE, American Society of Agricultural Engineers: Saint Joseph, MI, USA, 1999.
- Walkley, A.; Black, I.A. An examination of the Degtjareff method for determining soil organic matter, and a proposed modification of the chromic acid titration method. Soil Sci. 1934, 37, 29–38. [Google Scholar] [CrossRef]
- Pöhlitz, J.; Rücknagel, J.; Koblenz, B.; Schlüter, S.; Vogel, H.J.; Christen, O. Computed tomography and soil physical measurements of compaction behaviour under strip tillage, mulch tillage and no tillage. Soil Tillage Res. 2018, 175, 205–216. [Google Scholar] [CrossRef]
- Cavalieri, K.M.V.; da Silva, A.P.; Tormena, C.A.; Leão, T.P.; Dexter, A.R.; Håkansson, I. Long-term effects of no-tillage on dynamic soil physical properties in a Rhodic Ferrasol in Paraná, Brazil. Soil Tillage Res. 2009, 103, 158–164. [Google Scholar] [CrossRef]
- López-Garrido, R.; Madejón, E.; León-Camacho, M.; Girón, I.; Moreno, F.; Murillo, J.M. Reduced tillage as an alternative to no-tillage under Mediterranean conditions: A case study. Soil Tillage Res. 2014, 140, 40–47. [Google Scholar] [CrossRef]
- Bogunovic, I.; Pereira, P.; Kisic, I.; Sajko, K.; Sraka, M. Tillage management impacts on soil compaction, erosion and crop yield in Stagnosols (Croatia). Catena 2018, 160, 376–384. [Google Scholar] [CrossRef]
- Fernández-Ugalde, O.; Virto, I.; Bescansa, P.; Imaz, M.J.; Enrique, A.; Karlen, D.L. No-tillage improvement of soil physical quality in calcareous, degradation-prone, semiarid soils. Soil Tillage Res. 2009, 106, 29–35. [Google Scholar] [CrossRef]
- da Silva, J.F.; Neto, M.M.G.; da Silva, G.F.; Borghi, E.; Calonego, J.C. Soil Organic Matter and Aggregate Stability in Soybean, Maize and Urochloa Production Systems in a Very Clayey Soil of the Brazilian Savanna. Agronomy 2022, 12, 1652. [Google Scholar] [CrossRef]
- Joschko, M.; Gebbers, R.; Barkusky, D.; Rogasik, J.; Höhn, W.; Hierold, W.; Fox, C.A.; Timmer, J. Location-dependency of earthworm response to reduced tillage on sandy soil. Soil Tillage Res. 2009, 102, 55–66. [Google Scholar] [CrossRef]
- Wright, A.L.; Hons, F.M.; Lemon, R.G.; McFarland, M.L.; Nichols, R.L. Stratification of nutrients in soil for different tillage regimes and cotton rotations. Soil Tillage Res. 2007, 96, 19–27. [Google Scholar] [CrossRef]
- Tang, X.; Qiu, J.; Xu, Y.; Li, J.; Chen, J.; Li, B.; Lu, Y. Responses of soil aggregate stability to organic C and total N as controlled by land-use type in a region of south China affected by sheet erosion. Catena 2022, 218, 106543. [Google Scholar] [CrossRef]
- Baumgartl, T.; Horn, R. Effect of aggregate stability on soil compaction. Soil Tillage Res. 1991, 19, 203–213. [Google Scholar] [CrossRef]
- Cavalaris, C.; Karamoutis, C.; Papamichail, D.; Gemtos, T.A. Soil tillage effect on weed infestation in a sugar beet crop. In Proceedings of the 4th National Conference of Agricultural Mechanization, Athens, Greece, 6–8 October 2005; pp. 151–158. (In Greek). [Google Scholar]
- Cavalaris, C.; Gemtos, T.A. Evaluation of tillage efficiency and energy requirements for five methods of soil preparation in the sugar beet crop. In Proceedings of the 2004 CIGR International Conference, Chinese Academy of Agricultural Mechanization Sciences, Benhing, Beijing China, 11–14 October 2004; pp. 97–101. [Google Scholar]
- Cavalaris, C.; Gemtos, T.A.; Georgiou, C. Use of low inputs methods for soil tillage in corn. In Proceedings of the 1st National Conference of Agricultural Mechanization, Athens, Greece, 11–12 December 1998; pp. 377–387. (In Greek).
- Gemtos, T.A.; Cavalaris, C. Soil tillage effect in the sugar beet crop. In Proceedings of the 1st World Congress on Conservation Agriculture, Madrid, Spain, 1–5 October 2001; pp. 539–543. [Google Scholar]
- Cavalaris, C.C.; Gemtos, T.A. Evaluation of four conservation tillage methods in the sugar beet crop. Agric. Eng. Int. (CIGR) E-J. 2002, IV. [Google Scholar]
- Gemtos, T.A.; Cavalaris, C.; Demis, V.; Pateras, D.; Tsidari, C. Effect of changing tillage practices after four years of continuous reduced tillage. In Proceedings of the 2002 ASABE Annual International Meeting/CIGR World Congress, Chicago, IL, USA, 28–31 July 2002; p. No 021135. [Google Scholar]
- Cavalaris, C.; Karamoutis, C.; Aggelopoulou, A.; Gentos, T.A. Effect of changing tillage on soil, plants and yield. In Proceedings of the 5th National Conference of Agricultural Mechanization, Larisa, Greece, 18–20 October 2007; pp. 127–134. (In Greek). [Google Scholar]
- Mattila, T.J.; Hagelberg, E.; Söderlund, S.; Joona, J. How farmers approach soil carbon sequestration? Lessons learned from 105 carbon-farming plans. Soil Tillage Res. 2022, 215, 105204. [Google Scholar] [CrossRef]
Figure 1.
Experimental design. (MP = conventional moldboard plow tillage, CP, chisel plow tillage, PH = power harrow tillage, DH = disk harrow tillage, NT = no-tillage). Blue shaded polygons indicate plots with an all-year constant tillage regime.
Figure 1.
Experimental design. (MP = conventional moldboard plow tillage, CP, chisel plow tillage, PH = power harrow tillage, DH = disk harrow tillage, NT = no-tillage). Blue shaded polygons indicate plots with an all-year constant tillage regime.

Figure 2.
The crop rotation that was followed during the first six years of the experiment.

Figure 3.
Soil sampling: (a) Tractor-powered metal cylinder inserting the soil; (b) the cylinder retracted from the soil; (c) removing the cylinder tip; (d) extracting the inner plastic tube; (e) the extracted plastic tube containing the soil core sample and core segmentation in the lab; (f) the plastic tube holding the soil core (up) and the empty tube with the predefined slots (down); (g) transferring the soil from the holding tube (left) to the slotted tube (right); (h) cutting the soil core with a knife at the predefined dimensions; (i) extracting the core segments from the tube; (j) the three main core segments (0.025–0.10 m, 0.10–0.20 m, and 0.20–0.275 m) and the two omitted pieces (left and right).

Figure 4.
Soil penetration resistance at the permanent tillage treatments (error bars indicate 95% confidence intervals range, numerical results from the statistical analysis are presented in Supplementary Materials Tables S1–S4). (a–d) indicate results from different years.
Figure 4.
Soil penetration resistance at the permanent tillage treatments (error bars indicate 95% confidence intervals range, numerical results from the statistical analysis are presented in Supplementary Materials Tables S1–S4). (a–d) indicate results from different years.

Figure 5.
Timeseries of soil compaction accessed through normalized penetration resistance measurements over a period of six years for the permanent tillage schemes (error bars indicate 95% confidence intervals range). (a–c) indicate normalized penetration resistance for different depths.
Figure 5.
Timeseries of soil compaction accessed through normalized penetration resistance measurements over a period of six years for the permanent tillage schemes (error bars indicate 95% confidence intervals range). (a–c) indicate normalized penetration resistance for different depths.

Figure 6.
Tillage rotation effects in soil penetration resistance in 2001 (error bars indicate 95% confidence intervals range, numerical results from the statistical analysis are presented in Supplementary Materials Table S3).
Figure 6.
Tillage rotation effects in soil penetration resistance in 2001 (error bars indicate 95% confidence intervals range, numerical results from the statistical analysis are presented in Supplementary Materials Table S3).

Figure 7.
Tillage rotation effects in soil penetration resistance in 2002 (error bars indicate 95% confidence intervals range, numerical results from the statistical analysis are presented in Supplementary Materials Table S4).
Figure 7.
Tillage rotation effects in soil penetration resistance in 2002 (error bars indicate 95% confidence intervals range, numerical results from the statistical analysis are presented in Supplementary Materials Table S4).

Figure 8.
Dry bulk density of the soil for the five permanent methods of tillage in 2000 error bars indicate 95% confidence intervals range, numerical results from the statistical analysis are presented in Supplementary Materials Table S6).
Figure 8.
Dry bulk density of the soil for the five permanent methods of tillage in 2000 error bars indicate 95% confidence intervals range, numerical results from the statistical analysis are presented in Supplementary Materials Table S6).

Figure 9.
Dry bulk density in permanent and rotational schemes of tillage for 2001 error bars indicate 95% confidence intervals range, numerical results from the statistical analysis are presented in Supplementary Materials Table S7.
Figure 9.
Dry bulk density in permanent and rotational schemes of tillage for 2001 error bars indicate 95% confidence intervals range, numerical results from the statistical analysis are presented in Supplementary Materials Table S7.

Figure 10.
Dry bulk density in permanent and rotational schemes of tillage for 2002 error bars indicate 95% confidence intervals range, numerical results from the statistical analysis are presented in Supplementary Materials Table S7).
Figure 10.
Dry bulk density in permanent and rotational schemes of tillage for 2002 error bars indicate 95% confidence intervals range, numerical results from the statistical analysis are presented in Supplementary Materials Table S7).

Figure 11.
Change in soil organic matter during a five-year period with permanent tillage treatments (error bars indicate 95% confidence intervals range). (a–c) indicate results from different depths.
Figure 11.
Change in soil organic matter during a five-year period with permanent tillage treatments (error bars indicate 95% confidence intervals range). (a–c) indicate results from different depths.

Figure 12.
Soil organic matter in permanent and rotational schemes of tillage in 2001 (error bars indicate 95% confidence intervals range, numerical results from the statistical analysis are presented in Supplementary Materials Table S9).
Figure 12.
Soil organic matter in permanent and rotational schemes of tillage in 2001 (error bars indicate 95% confidence intervals range, numerical results from the statistical analysis are presented in Supplementary Materials Table S9).

Figure 13.
Soil organic matter in permanent and rotational schemes of tillage in 2002 error bars indicate 95% confidence intervals range, numerical results from the statistical analysis are presented in Supplementary Materials Table S9).
Figure 13.
Soil organic matter in permanent and rotational schemes of tillage in 2002 error bars indicate 95% confidence intervals range, numerical results from the statistical analysis are presented in Supplementary Materials Table S9).


Table 1.
Tillage combinations formed on the fifth year of the experiment.
| Tillage A (Years 1–4 & 6): | MP | CP | PH | DH | NT |
|---|---|---|---|---|---|
| Tillage B (5th Year) | |||||
| MP | 5 * MP | 4CP + 1MP | 4PH + 1MP | 4DH + 1MP | 4NT + 1MP |
| CP | 4MP + 1CP | 5CP | 4PH + 1CP | 4DH + 1CP | 4NT + 1CP |
| PH | 4MP + 1PH | 4CP + 1PH | 5PH | 4DH + 1PH | 4NT + 1PH |
| DH | 4MP + 1DH | 4CP + 1DH | 4PH + 1DH | 5DH | 4NT + 1DH |
| NT | 4MP + 1NT | 4CP + 1NT | 4PH + 1NT | 4DH + 1NT | 5NT |
* The numbers indicate the years of applied tillage treatment.
Disclaimer/Publisher’s Note: The statements, opinions and data contained in all publications are solely those of the individual author(s) and contributor(s) and not of MDPI and/or the editor(s). MDPI and/or the editor(s) disclaim responsibility for any injury to people or property resulting from any ideas, methods, instructions or products referred to in the content. |
© 2023 by the authors. Licensee MDPI, Basel, Switzerland. This article is an open access article distributed under the terms and conditions of the Creative Commons Attribution (CC BY) license (https://creativecommons.org/licenses/by/4.0/).
Share and Cite
MDPI and ACS Style
Cavalaris, C.; Gemtos, T.; Karamoutis, C. Rotational Tillage Practices to Deal with Soil Compaction in Carbon Farming. Soil Syst. 2023, 7, 90. https://doi.org/10.3390/soilsystems7040090
AMA Style
Cavalaris C, Gemtos T, Karamoutis C. Rotational Tillage Practices to Deal with Soil Compaction in Carbon Farming. Soil Systems. 2023; 7(4):90. https://doi.org/10.3390/soilsystems7040090
Chicago/Turabian StyleCavalaris, Chris, Theofanis Gemtos, and Christos Karamoutis. 2023. "Rotational Tillage Practices to Deal with Soil Compaction in Carbon Farming" Soil Systems 7, no. 4: 90. https://doi.org/10.3390/soilsystems7040090