Article

Isolation and Characterization of Culturable Osmotolerant Microbiota in Hypersaline and Hypergypsic Soils as New Treatment for Osmotic Stress in Plants

by
Tatiana Gil
1,†,
Raquel Teixeira
1,†,
André Sousa
1,†,
Maria Alice d’Oliveira Palmeiro
1,
Alice Cruz Coimbra de Matos
1,
Marla Niza Costa
1,
María Victoria Ferrer
1,
Ana Sofía Rodrígues dos Santos
1,
Cristina Sequero López
2,
Inês Rebelo Romão
1 and
Juan Ignacio Vílchez
1,*
1
iPlantMicro Laboratory Oeiras, Instituto de Tecnologia Química e Biológica (ITQB)-NOVA, 2780-157 Lisboa, Portugal
2
GeoBioTec, Department of Earth Sciences, NOVA School of Sciences and Technology, Campus de Caparica, Universidade NOVA de Lisboa, 2829-516 Caparica, Portugal
*
Author to whom correspondence should be addressed.
These authors contributed equally to this work.
Soil Syst. 2023, 7(4), 86; https://doi.org/10.3390/soilsystems7040086
Submission received: 10 July 2023 / Revised: 11 October 2023 / Accepted: 12 October 2023 / Published: 16 October 2023

Abstract

:
Saline and gypsic soils impede or condition the establishment of farms in many regions worldwide. Stress caused by the accumulation of sodium or calcium ions in the soil drastically limits plant growth and is a limiting factor in the production of many crops. For this reason, saline and gypsic soils were preferentially exploited for mineral extraction. However, nowadays, they can be a source of new biotechnological tools to help in the osmotic stress to which some crops are exposed. In these environments, despite being traditionally characterized by their low biodiversity, we can find well-adapted microbiota that may be able to interact with plants to deal with different environmental stresses. These mechanisms may consist of a very important contribution to the development of new osmotic stress-dealing bioinoculants. The present study sought to elucidate the diversity of the cultivable population of such environments and use them as regulators of soil nutrients and stress-relieving symbionts in plants under osmotic stress. Among the candidate strains selected to cover more scenarios, we found that the strains Stutzerimonas stutzeri A38 and Bacillus pumilus A49 were able to increase root size under osmotic stress in Medicago sativa and Medicago polymorpha plants. Moreover, Peribacillus frigoritolerans A70 and Bacillus licheniformis A46 also enhanced the performance in M. polymorpha, showing interesting potential for a future use in wasteland use for production to livestock feeding or other relevant industries.

1. Introduction

Osmotic stress, arising from an imbalance between extracellular and intracellular fluid osmolarity and pressure, is more prevalent in arid or semi-arid climates [1,2,3]. These conditions, characterized by high temperatures and low rainfall, lead to rapid evaporation, resulting in the deposition of soluble ions such as chlorides (e.g., halites) and sulfates (e.g., gypsum, anhydrites) [4,5,6,7,8,9,10,11]. Among these, the accumulation of calcium chloride in salt soils has the most significant ecological impact [5,12]. Moreover, plants in these regions face constant high osmotic pressure, necessitating specific adaptations in order to keep obtaining nutrients and minimize the stress impact in their development [12,13]. Thus, a soil is deemed saline or salt-stressed when its electrical conductivity exceeds 4 dS/m, with values over 2 dS/m already compromising ecosystem diversity [14], which includes roughly 840 million hectares worldwide affected [15]. Apart from naturally saline areas, certain agricultural and water usage practices (aquifer over-extraction, irrigation with slightly saline water, and seawater intrusion) lead to soil salinization, jeopardizing the food supply for approximately 1.5 billion people, according to the Global Map of Salt-Affected Soils (GSAS map, v1.0.0; FAO—2021). Most salt-affected regions are concentrated in North, East, and Southern Africa, the Middle East, Central and Western China, Western United States, Central Asia, and Australia [14]. In Portugal and Spain, these regions are predominantly found in the Southeast and Mediterranean areas, Ebro basin, North Meseta, Tagus basin, as well as Alentejo and Algarve [12,16,17,18]. Both countries have particularly saline zones that serve as accumulation points for exploitable saline resources, such as salt flats or pans. Conversely, gypsic soils, which contain accumulations of gypsum (at least in secondary amounts), cover about 200 million hectares, primarily in very dry environments where evaporation and lack of rainfall lead to gypsum accumulation [9,19,20]. These gypsum-rich soils are widespread in North Africa, the Middle East, Central Asia, and Eastern Australia. In the Iberian Peninsula, the entire Mediterranean coast, especially the Ebro Basin, is rich in this type of soil [21].
Osmotic stress is becoming increasingly prevalent in ecosystems impacted by human activities and areas experiencing advancing desertification. This trend is causing significant annual production losses due to insufficient adaptation time for local plants and crops [2,6,22]. This situation is aggravating if we consider that most crop plants are not selected for their ability to resist osmotic stress, although there are cases of selected genotypes in regions exposed to these conditions. In many cases, domestication led to some species losing their ability to tolerate osmotic stress, exemplified by the contrast between Solanum pimpinellifolium, compared to the modern cultivar Solanum lycopersicum [23]. On the other hand, gypsic soils pose challenges for cultivating irrigated alfalfa, cotton, wheat, and apricots, according to FAO [11]. In particular, Medicago species, relevant forage crops for livestock, are especially interesting given their adaptability and low requirements, supposing an intriguing avenue for land reclamation or revitalizing salinized or depleted soils [24,25,26]. Nevertheless, different tolerance levels, and the combined impact of climatic and soil stressors often hamper production [22,24,27,28].
The impact of various osmotic stress types is contingent upon the attained intensity, with soil moisture content playing a pivotal role in ion concentration and osmotic equilibrium. Arid conditions heighten osmotic stress in both saline and gypsic soils. Plants under this stress experience detrimental effects from ion accumulation, impeding their growth and development. Systems crucial for nutrient absorption, cell membrane stability, and transport pathways are among the most affected [21,28]. Dysfunction in these systems leads to the buildup of reactive oxygen species and other secondary stressors. Additionally, saline and gypsic soils can induce mechanical issues through crust formation and compaction, negatively impacting root development, water absorption, and seed germination [9,10,21]. Furthermore, salt buildup in specific structures can result in tissue and organ death, though it serves as a prevalent mechanism for mitigating moderate osmotic pressure. With higher intensities, the mechanisms for accumulation and detoxification become more sophisticated, including selective isolation of excess ions or their transformation into less harmful forms. Most plants adapted to salt and gypsum (halotolerant, halophiles, and gypsophiles, respectively) can activate specific antioxidant systems or develop specialized root architectures to counter secondary effects. Another significant set of adaptive mechanisms involves the production of osmoprotectant compounds or compatible solutes [6,29,30,31].
Despite the substantial challenges posed by saline and gypsic soils, there is an initiation of evaluations regarding their potential for cultivating more adapted species [14]. Moreover, biotechnological strides, including the application of beneficial bacteria, hold promise for revitalizing and enhancing the productivity of these regions. Notably, certain osmoprotectant compounds such as proline and trehalose, which can be synthesized by bacteria, demonstrate the capacity to bolster their production when associated with plants. This serves to safeguard the host and even trigger the host’s own production of these compounds [31,32,33,34,35]. Microorganisms play also a crucial role in providing and regulating antioxidants to counteract the reactive oxygen species (ROS) induced in plants during osmotic stress [36,37,38]. Numerous studies underscored the protective role of bacteria in the formation of biofilms around plant roots. These structures act as a shield against the toxic effects of accumulated ions and enhance osmotic balance by retaining water at the root surface [37,38,39]. This protection enables sustained root development. However, certain bacterial strains can modulate root architecture to adopt different strategies against osmotic stress, including increasing the number of secondary roots, restricting their size, or promoting lateral expansion [34,40]. This regulatory process is intricately linked to the production of phytohormones such as auxins, gibberellins, cytokinins, and abscisic acid. Additionally, many strains exhibit the capacity to supply nutrients, including phosphorus, potassium, and metal ions, even under high osmotic pressure in the soil [34,41]. This contributes to improved plant homeostasis and aids in maintaining normal growth rates. Lastly, it is worth noting the production of the enzyme amino cyclopropane carboxylic acid deaminase (ACCd), which modulates ethylene levels [37,41]. This enzyme enables rhizosphere-associated bacteria to utilize ACC as a source of carbon and nitrogen, thereby regulating elevated levels of ethylene and avoiding root architecture deterioration and leaf splitting [36,42].
Hence, harnessing microbiota adapted to high-osmotic-pressure environments is an increasingly promising avenue. Such treatments hold potential for assisting crops in addressing the growing challenge of salinization in agricultural lands affected by factors such as irrigation or marine intrusion [36,37,40,41]. Furthermore, they present a viable approach for reclaiming lands impacted by gypsum accumulation due to evaporation amplified by climate change effects, including increased heat and drought [43,44]. The objective of this study was to pinpoint novel strain inducers of osmotic tolerance in severely stressed environments, including salt flats, salt marshes, and gypsum-rich areas. By screening their capabilities and subjecting various osmotic-sensitive Medicago species to tests, we aimed to take the initial steps toward developing new bioinoculants. These bioinoculants could serve to enhance the tolerance and productivity of crop plants in agricultural settings facing analogous osmotic stressors.

2. Materials and Methods

2.1. Sampling

Sampling locations were selected to be recognized as gypsum-rich (≥15% gypsum accumulated under wet conditions), salt-rich areas, with no previous agricultural use, and only used for minerals extraction in some cases. Climatically, excluding Alcochete, which has a moderated Mediterranean, all locations were emplaced as Mediterranean (mid-mountain or coastal). Three samples consisting of 30–50 g were collected in unvegetated areas by using a column collector at a depth of 0–10 cm from 14 locations (Table 1 and Figure 1). They were mixed in order to work with a single sample per location, and when visually present, saline/gypsum crusts were removed in the soil samples. All samples were collected during 2022 and 2023, and stored at 4 °C until processing. Soil samples were characterized based on their pH (as in Mclean, 1983 [15]), their salinity as electroconductivity (EC) by using a YIERYI EC-8801 (Shenzhen, China) device, and their percentage of water content (as in Li and Wang, 2014 [16]; by weight difference after 7 days of incubation at 60 °C).

2.2. Isolation, Identification and Analysis of the Culturable Bacteria Populations in Soil and Roots

Samples of soil (0.25 g) were processed and serially diluted in a sterile 0.45% NaCl solution to isolate culturable bacteria in LB plates (per liter: NaCl, 10 g; yeast extract, 5 g; tryptone, 10 g; and agar, 15 g). The colony-forming units (CFUs) for each sampling point were counted and normalized to the soil dry weight (in mg) of the original sample. Then, morphologically different colonies (following the indications of the American Society for Microbiology [45]) were selected, isolated, and purified. Pure cultures were preserved in 40% glycerol at −80 °C. Thereafter, the isolates were identified by amplification of the hypervariable V5-V8 region (~700 bp) or the full region (~1500 bp) of the bacterial 16S rRNA gene by using the pairs of universal primers 779F (5′-AACMGGATTAGATACCCKG-3′) and 1392R (5′-GGTTACCTTGTTACGACTT-3′), or 27F (5′-AGAGTTTGATCCTGGCTCAG-3′) and 1492R (5′-CTACGGCTACCTTGTTACGA-3′), respectively. Template DNA was extracted from individual colonies by heat shock method [46] and the quality was assessed by spectroscopy with a NanoDrop™ One (Thermo Scientific™, Waltham, MA, USA). PCR was carried out with NZYTaq II 2x Master Mix by Nzytech (Lisbon, Portugal), with this running configuration: initial denaturation phase at 95 °C (2 min); then 40 cycles of denaturation at 95 °C (3 s), annealing at 45 °C (30 s), and elongation at 72 °C (2 min); and a final extension phase 72 °C (7 min). The amplicon bands were assessed by 1% agarose gel electrophoresis by using a Mupid®-exU System (Tokyo, Japan) at 135 V, and by a transilluminator (UVIvue™, UVITEC Company, Cambridge, UK). Here, the sequences were sequenced by GENEWIZ (Leipzig, Germany), and the results were compared to the National Library of Medicine BLAST database to identify the strains (>98% similarity). Strains labeled as ‘Unidentified’ were not possible to identify (DNA not quality enough or impossible to amplify the fingerprinting genes) after several attempts.
In order to analyze the populations, we prepared a phylogenetic tree with the sequences of the identified strains, aligning with ClustalX2 (v2.1) and visualizing with the iTol drawing tool [47]. Moreover, we also included Shannon and Simpson biodiversity indexes, the index of similarity, the reciprocal index, and the evenness to better understand the diversity and distribution of each sample (Omni Calculator—www.omnicalculator.com/, accessed on 1 June 2023; Virtue—https://virtue.gmbl.se/, accessed on 1 June 2023; and Statology—https://www.statology.org/, accessed on 1 June 2023).

2.3. Strains Growth and Plant Growth-Promoting Traits Performance under Osmotic Stress

2.3.1. Strains Growth under High Osmotic Pressure

Isolated strains were tested under osmotic stress to ensure a proper performance. To do this, we performed a growth assay in a 96-well plate with LB medium for 24 h under continuous shaking (150 rpm) and at 28 °C. Each tested strain was inoculated at optical density (OD600nm) 0.05. The growth was measured using a microplate reader at 600 nm. This, coupled with following determinations, was performed by using 200 mM of NaCl, which was the concentration that we applied to the plant test as osmotic-stressing condition, according to different sensibility levels reported previously for different Medicago species [48,49]. This will ensure the performance of the different skills under saline stress. In this sense, to determinate the skill performance in our strains, we followed the dynamic semi-quantitative assessment in a solid medium screening, followed by a quantification in liquid medium for the best candidates, maintaining the conditions explained above.

2.3.2. Nitrogen Fixing Activity

The nitrogen fixation activity was assessed following the indications of Sulistiyani and Meliah, based on Bromothymol Blue (BTB) (100 mg/L) as the indicator [50]. In this assay, strains were grown in Jensen’s agar medium (per liter: 20 g of sucrose, 1 g of K2HPO4, 0.5 g of MgSO4, 0.5 g of NaCl, 0.1 g of Fe2S04, 0.005 g of Na2MoO4·2H2O, 2 g of CaCO3, and 15 g of agar) for 7 days. In positive isolates, the dark blue-colored halos were measured, and the relative nitrogen fixation ability was calculated with respect to the colony size to normalize the results. For quantification, strains were grown in liquid Jensen’s amended with BTB (150 rpm, 28 °C) for 3 days, and the absorbance was measured at 640 nm [51,52]. The nitrogen-equivalent standard curve was prepared with NH3.

2.3.3. Phosphate and Potassium Solubilization

Beginning with the phosphate-solubilizing performance in our strains, we followed Zheng and collaborators, with slight modifications [53]. Thus, a 10 µL drop of each culture was placed on NBRIP agar medium (per liter: 10 g of glucose, 5 g of Ca3(PO4)2, 5 g of MgCl2·6H2O, 0.25 g of MgSO4·7H2O, 0.2 g of KCl, 0.1 g of (NH4)2SO4 and 15 g of agar), and the plate was incubated for 5–7 days at 28 °C. Halos produced were measured. In the case of the evaluation of potassium solubilization, we employed Aleksandrov medium (per liter: 5.0 g of glucose, 0.5 g of MgSO4·7H2O, 0.1 g of CaCO3, 0.006 g of FeCl3, 1.5 g of K2HPO4, 1.5 g of KH2PO4, 3.0 g of potassium aluminum silicate (mica), and 15 g agar; pH 7.2), amended with BTB (100 mg/mL), according to Rajawat and collaborators [54]. For quantification, we incubated the strains in the respective media in liquid format for three days. In the case of the phosphate solubilization test, the plates were centrifuged (4000 rpm, 10 min) and the supernatant was mixed with 3,5:1 (v:v) vanadate-molybdate reagent. After incubation in the dark for 10 min, the absorbance was measured at 420 nm. A phosphate standard curve was constructed using anhydrous KH2PO4. For the potassium solubilization test, after the initial grow incubation, samples were measured at 430 nm. Standard curve was performed based on Rajawat formula.

2.3.4. Sulfur-Oxidizing Activity

The sulfur-oxidizing skill is going to be especially relevant for the strains isolated from gypsic soils. We prepared this test according to Hidayat, Saud, and Samsudin, with some modifications [55]. A drop of each cultured strain was placed on thiosulfate mineral medium (TSM) (per liter: 1.5 g of K2HPO4, 1.5 g of KH2PO4, 0.4 g of NH4Cl, 0.8 g of MgCl2·6H2O, 0.1 g of CaCl2·2H2O, 10 g of Na2S2O3·5H2O, and 15 g of agar; pH 7.5), with 0.01 g of bromocresol purple, and incubated for 14 days at 28 °C. After measuring the discoloration halos, the quantification was prepared in TSM liquid medium and grown for 14 days at 28 °C and 160 rpm. The centrifuged supernatant (4000 rpm, 10 min) was mixed 1:1 (v:v) with barium chloride (BaCl2) solution (10% w:v) and the absorbance of the resulting mix was measured at 480 nm. The standard curve was performed by dissolving potassium sulfate (K2SO4) in a BaCl2 solution.

2.3.5. Siderophores Production

The siderophore production was assessed following the indications of Arora and Verma, with minor modifications. In brief, a drop of each cultured strain was placed on blue agar chrome azurol sulfonate (CAS) plates [56,57]. A yellowish halo around the strain was considered as positive and measured. Then, a regular LB culture of each strain was centrifuged (4000 rpm, 10 min), and 100 µL of the supernatant was mixed with 100 µL of CAS reagent in a 96-well plate. After 20 min of incubation at room temperature, absorbance was recorded at 630 nm. Siderophore production was calculated as the percent siderophore unit (psu): psu = (absorbance control – absorbance sample) × 100 absorbance control.

2.3.6. Biofilm Production

Biofilm production was evaluated as in Coffey and Anderson [58], with slight modifications. Briefly, strains were inoculated in LB medium in a 96-well plate at 28 °C and 150 rpm. Then, planktonic structures were washed and only biofilm structures were stained with 200 µL of 0.2% crystal violet solution. After incubating for 20 min at room temperature, the excess crystal violet was washed and structures were solubilized with 30% glacial acetic acid solution for 20 min. Finally, the solution was measured at 550 nm. In this test, together with auxins and ACC deaminase production, we used Pseudomonas putida KT2440 values as reference (positive control).

2.3.7. Auxins Production

For auxin production, we followed the method described by Ambrosini and Passaglia [59]. Thus, 200 µL of LB medium supplemented with tryptophane (0.5 g/L) were inoculated with each strain and incubated for 48 h at 28 °C and 150 rpm. After centrifuge (4000 rpm, 30 min), 100 µL of supernatant were mixed with 100 µL of Salkowski reagent (0.5 M of FeCl3 and 35% HclO4). Finally, after a 30-minute incubation at room temperature in the dark, the absorbance was measured at 530 nm. The values were determined as indole-3-acetic acid (IAA) equivalents with respect to a calibration curve.

2.3.8. Production of 1-Aminocyclopropane-1-Carboxylate Deaminase (ACCd)

The production of 1-aminocyclopropane-1-carboxylate deaminase (ACCd) was evaluated by following the previously adapted methodology [60]. Briefly, using a 96-well plate, the strains grew in M9 medium (Merck) amended with 3 mM of ACC, and after 24 h at 28 °C and 150 rpm, the culture was measured at 600 nm in order to evaluate the culture growth and compare among the collection of strains. This measure gave us an indirect confirmation of the ACCd production by each strain.

2.3.9. Antioxidants Production

We began by detecting catalase activity following the indications of Reiner [61], which consisted of dropping 3% hydrogen peroxide over a fresh colony placed on a microscope. Bubble formation was considered as positive in catalase, and the quantification was performed by strictly following Hadwan protocol [62]. Then, for general antioxidants production, we followed the thiocyanate method, as described by Takao and collaborators [63]. In brief, 200 μL of centrifuged (8000 rpm, 5 min) overnight-cultured strain was mixed with 200 μL linoleic acid solution (25 mg/mL in pure ethanol), 400 μL of phosphate buffer (per liter: 20.214 g of Na2HPO4·7H2O, 3.394 g of NaH2PO4·H2O; pH 7.0), and 200 μL of double distilled water. The samples were incubated at 40 °C for 10 min in the dark. Subsequently, 100 μL were mixed with 3 mL of 75% ethanol, 100 μL of NH4SCN solution (0.3 g/mL in double distilled water), and 100 μL of ferrous chloride reagent (2.45 mg/mL of FeCl2 in 3.5% hydrochloric acid). Finally, after 3 min of incubation at the root temperature, absorbance was measured at 500 nm.

2.4. Plant Material: Medicago Species

To carry out plant tests of the candidate strains, we decided to use different species of Medicago. Within this genus, we can find species and varieties with diverse responses to osmotic stress. We selected species with different tolerance levels of M. sativa (sensitive) and M. polymorpha (mid-tolerant) as model plants. Seeds were commercially available (Cantueso Natural Seeds, Córdoba, Spain) or were collected from nature in different regions of Portugal and Spain during spring/summer 2022 [60].

2.5. Germination and In Vitro Colonization Tests under High Osmotic Preassure

The germination test was carried out following the method described in Niza and collaborators for M. sativa [60]. Briefly, 100 seeds per plant species were surface-sterilized (70% ethanol, 5 min; 3× sterile double distilled water (ddH2O) washing) and incubated in water 48 h at 4 °C to enhance the germination rate. Each set of seeds was then soaked in a bacterial culture in 0.45% NaCl solution (108 CFUs/mL) or in bacteria-free saline solution in the case of the mock set of seeds. Next, the seeds were placed in Magenta boxes over wet towel paper with or without 200 mM NaCl as a stressing factor. After 7 days of incubation in the dark, the germination rate (%) was calculated based on bacterial treatment and conditions. This experiment was repeated three times.
On the other hand, the in vitro colonization tests were prepared following the indications of Vilchez and collaborators, with slight modifications to cope with the type of plant and applied stress [64]. Hence, five seedlings per replica were surface-sterilized as indicated above and placed on Phyto agar plates (Duchefa Biochemie). After 7 days of incubation, the roots of the germinated seedlings were placed in 1.5 mL tubes with a bacterial solution (108 CFUs/mL) and incubated overnight with agitation (150 rpm) at 28 °C. An additional set of samples was prepared by increasing the osmolarity (200 mM of NaCl) as stressing treatment. Thereafter, the roots were surface sterilized in 70% ethanol and washed with sterile ddH2O before grinding and serial dilution. The dilutions were placed on LB plates and incubated for 24 h at 28 °C. Finally, CFUs were quantified and normalized to the root dry weight of the original sample. The differential rate of colonization between the treatments with and without osmotic stress was recorded for each bacterial treatment. Each treatment was repeated three times.

2.6. Evaluation Plant Osmotic-Tolerance Enhancement

For test in pots, seeds were initially surface sterilized as previously indicated. Once in magenta boxes, they were placed in darkness at 22 °C for 2–3 days. Then, the seedlings were transferred to 0.5 L pots full of a turf:natural soil:vermiculite (2:1:1, v:v) mix. Pots were maintained in the greenhouse one day for acclimation. Thereafter, the seedlings were grown for 7 days and then inoculated with 40 mL/pot of each selected candidate strain (108 CFUs/mL (OD600nm ≈ 1.0) in sterile 0.45% NaCl). For the control set (mock), seedlings were inoculated with 40 mL of bacteria-free, sterile 0.45% NaCl. After two days, a set of plants (25 plants per treatment) was irrigated with 200 mM NaCl saline solution as an osmotic-stressing factor. Fifteen days after treatment (DAT), the test was ended and the phenotype recorded. Here, we included the root length, shoot height, and total dry weight (DW). EZ-Root-VIS (v2.5.4.0) and ImajeJ (v1.54e) softwares were used to standardize and analyze the measures [65,66].

2.7. Statistics

The statistical analyses were performed in Prism (v9.0.0, GraphPad Software, Boston, MA, USA). Here, we used Student’s t-test or two-way ANOVA (with Tukey’s and Šidák tests). The significance level was set at p < 0.05 for biodiversity analyses. Moreover, we used online tools from Virtue (virtue.gmbl.se/english-content/biodiversity-calculator, Gothenburg Marine Biological Laboratory, Gothenburg, Sweden) for biodiversity indexes. For the PCA analyses, we used the Principal Component Analysis Calculator from Statistics Kingdom (statskingdom.com/pca-calculator.html, Melbourne, Australia). All the online tools were used in their versions for May 2023.

3. Results

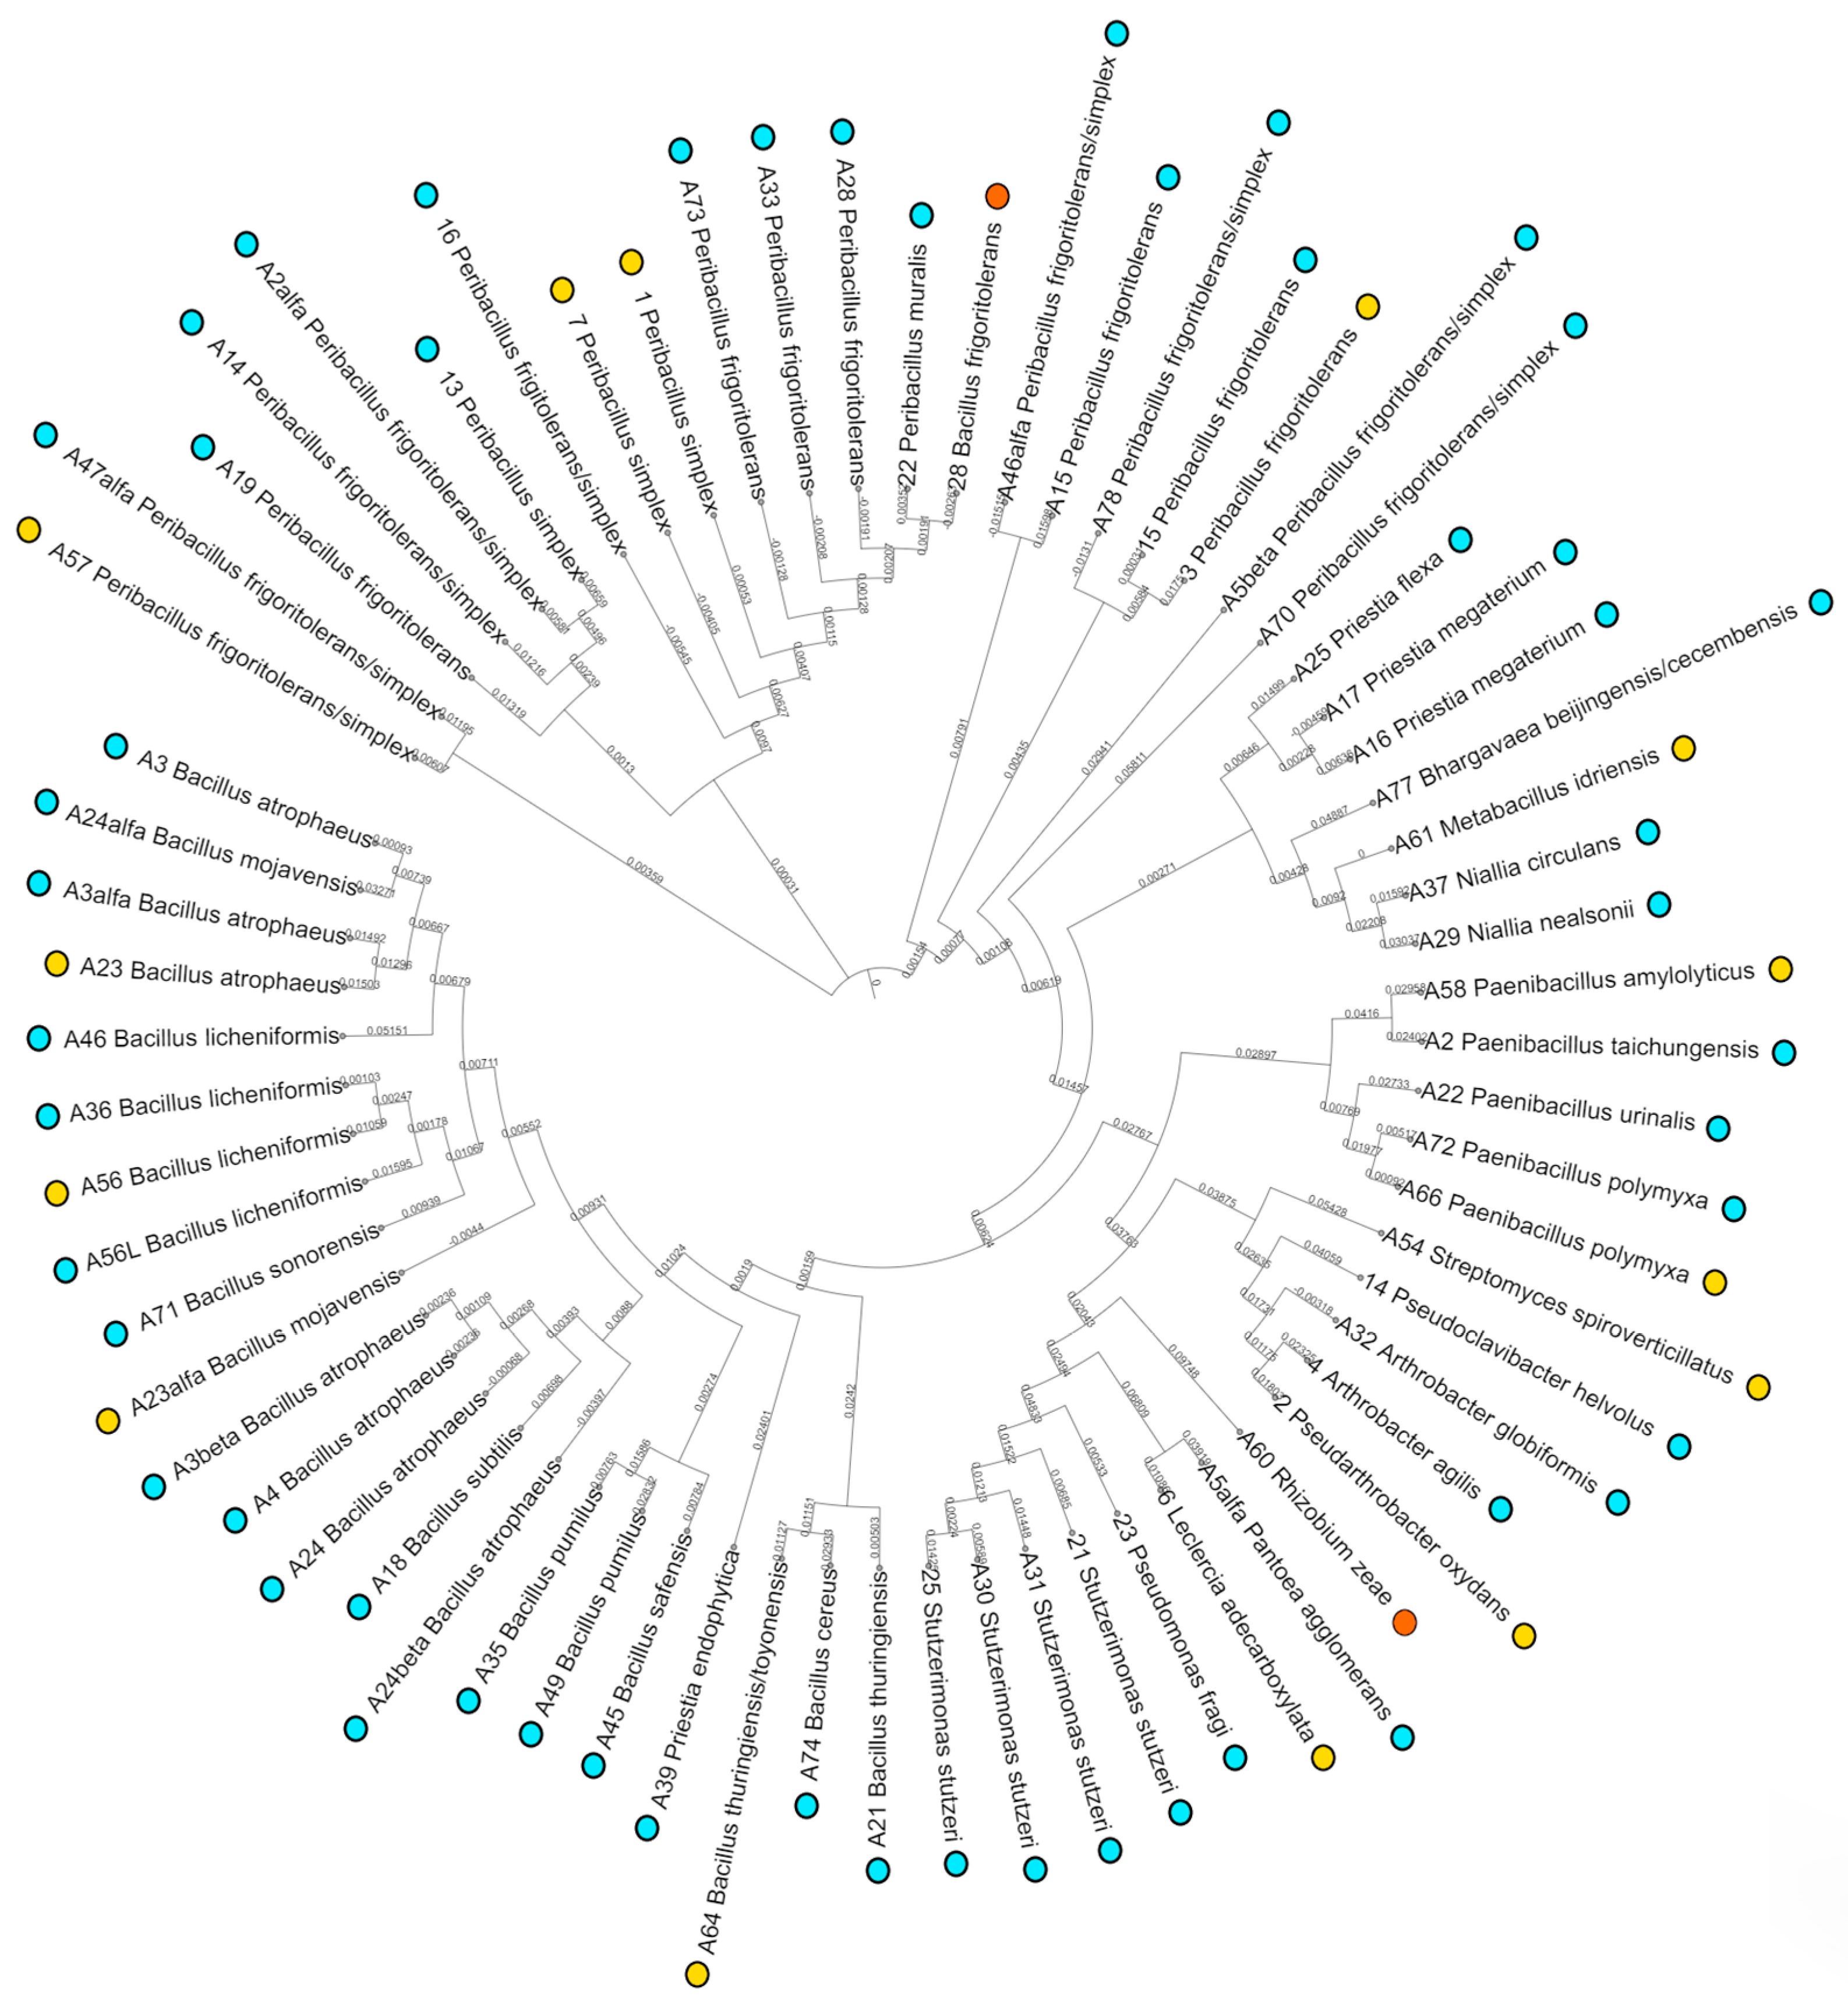
3.1. Population Analysis

A total of 104 strains were isolated from the 14 locations of gypsum-rich soils (1–5), and salt-rich soils (saltpans and salt flats; 6–14) (Table 2 and Figure 2). We were able to identify 74 strains, and all sequences were submitted and are accessible in GenBank through the accession number OQ971766-OQ971803. However, about 35% of the population in gypsum-rich soils on average, and less than 2% in the salt-rich ones, remained unidentified. The raw data and analysis of populations and screening tests presented here are openly available in FigShare [67]. The populations of the different samples, despite being quite variable as mentioned above, were similar in terms of average colony-forming units (CFUs) per mg of soil (dry weight), with populations around 2.06 × 10² and 2.12 × 10² in gypsum- and salt-rich soil samples, respectively. Considering the strains by origin, we can observe that 15 of them were uniquely isolated from gypsum-rich soils (14.4%), 69 uniquely from salt-rich soils (66.4%), and 20 strains were found in both environments (19.2%).
The predominant family within the collection was Bacillaceae (almost 3/4), being consistently the more prevalent in both sampling environments (Figure 2 and Figure 3). Most of the strains belong to the group of species Peribacillus frigoritolerans, P. simplex and P. muralis. These strains were more frequent and prevalent in salt-rich soils. The next species by presence was Bacillus atrophaeus, with six strains, being more relevant in salt-rich soils. Moreover, two genera gathered four strains each, Priestia and Paenibacillus. Finally, another 12 species were found belonging this family: B. licheniformis (4), Bacillus subtilis (2), B. thuringensis/toyonensis (3), B. pumilis (2), B. mojavensis (2), B. cereus (1), B. safensis (1), Bacillus sonorensis (1), Niallia nealsonii (1), N. circulans (1), Metilobacillus idriensis (1), and Bhargavaea beijingensis/cecembensis (1).
The next family in abundance was Pseudomonadaceae (about 12%), founding five strains identified as Stutzerimonas stutzeri (all of them in salt-rich soils), and four as Pseudomonas sp. (more prevalent in gypsum-rich soils). The family Micrococcaceae was represented with three species (Pseudoarthorbacter oxydans, Arthrobacter agilis, and A. globiformis), mostly found in salt-rich conditions. On the other hand, two strains, Leclercia adecarboxylata and Pantoea agglomerans, were the only representation of the order Enterobacterales. Finally, some other strains were identified, but were barely represented among the isolates (Pseudoclavibacter helvolus, Streptomyces spiroverticillatus, and Rhizobium zeae). The analyses of the biodiversity indexes did not show any significant differences between the values of the samples by origin.

3.2. Characterization and Selection of Candidate Strains

All the isolated strains were tested in order to characterize them as candidates for plant tests (results are openly available in FigShare [67]; (Supplementary Figure S1)).
Thus, we included tests to assess plant growth promotion and stress tolerance enhancement traits, which will be highly valuable in osmotic stress dealing. Hence, we analyzed the auxins production, where we found 25 strains able to produce above 25 µg/mL, highlighting the strains Stutzerimonas stutzeri 21 (51.32 µg/mL) and Peribacillus frigoritolerans A28 (58.415 µg/mL), isolated from salt-rich soils, but especially Pseudomonas sp. BABY−A48 (95.44 µg/mL), isolated from gypsum-rich soils. Here, more than 70% of the strains were only happening in salt environments. On the other hand, the production of ACC deaminase activity was indirectly assessed by growth with ACC as the sole N and C source. Thus, almost 70% of the strains showed a representative growth (71), with 14 growing above 0.8, as Bacillus licheniformis A46, Pseudomonas sp. BABY−48, and Bacillus cereus A74. These strains were again more present in salt-rich soils (65%) than in gypsum-rich ones (less than 14%). Another relevant ability considered here was the biofilm production. Here, almost 50% of the strains were able to produce above 0.54 units (P. putida KT2440 reference value). The strains Stutzerimonas stutzeri A38, Arthrobacter globiformis A32, Priestia flexa A25, Stutzerimonas stutzeri A30, Stutzerimonas stutzeri A31, and Bacillus thuringiensis/toyonensis A64 were the most remarkable in biofilm production. From the producers, 67% were only isolated from salt-rich soils and 12% from gypsum-rich soils. Finally, we evaluated the production of antioxidants, where 10 strains were able to produce above 6 mM of antioxidants equivalents (as Peribacillus simplex 13 or Bacillus pumilus A49). From the strains that were able to produce antioxidants, only 55% was present in salt-rich soils, and 29% was unique from gypsum-rich soils.
Following with nutrient related traits, some of them were more prevalent in strains isolated in salt-rich soils (as nitrogen fixation, P and K solubilization, sulfur oxidizing, and auxins and biofilm production). However, there were still many strains identified in both environments, so we decided to evaluate the prevalence after evaluating the clustering degree of the data in a principal component analysis (PCA) (Figure 4). All the analyzed groups showed high overlapping clustering, indicating no relevant differences among them. The dispersion of the results only allowed us to discern that most of the data aggregate around the traits analyzed. Among them, sulfur oxidizing, nitrogen fixation, and the solubilization of phosphorus and potassium were shown to be more correlated than the rest of the traits, indicating the common presence of these capabilities in most of the strains evaluated. On the other hand, ACCd, biofilm, and auxins formed a second group of abilities, inverse in respect to the previous one, but not that cohesive, indicating a less-regular appearance of these three skills at the same time and along the strains.

3.3. Strains Selected for Osmotic Stress Tolerance Treatment

Due to the high diversity of strains isolated, as well as their different performances under each test, we decided to evaluate a total of five strains. In this sense, the selected candidates were the identified strains with better performance for each of the tests, but in some cases, they were shown as top performers in more than one test. Thus, the strain Stutzerimonas stutzeri A38 was selected as a nitrogen fixator and sulfur oxidizer; Peribacillus frigoritolerans/simplex A70 as a P and K solubilizer and siderophores producer; Niallia circulans A37 as a biofilm and auxin producer; Bacillus licheniformis A46 as an ACC deaminase producer; and Bacillus pumilus A49 as an antioxidant producer. Each strain was then prepared as a different strategy or approach to evaluate as biotreatment in order to enhance plant tolerance to osmotic stress. Moreover, we performed a precise quantification of the performance of these strains in a 96-well high-throughput system, which allowed us to include osmotic stress as a treatment. The stress level was fixed to 200 mM of NaCl to cope with the stressing conditions that sensible plants will be exposed to in this case. This evaluation helps us to discern if they may significantly influence r the results obtained by the candidate strains (Figure 5).
Thus, starting with the effects of osmotic stress on the growth curve of the candidate strains, we observed that S. stutzeri A38 and P. frigoritolerans/simplex A70 did not show significant differences, whereas the growth of the remaining strains was reduced by approximately 30%. With this in mind, we made adjustments to the subsequent characterization tests. Under stressing conditions, the production of antioxidants was similar or even slightly higher, but not significant enough. In the case of the S. stutzeri A38 strain, it was the only strain that reduced antioxidant production by approximately 40%.
Regarding nitrogen fixation, strain S. stutzeri A38 produced 153 µg/mL NH3+ equivalents, and no significant change was detected when osmotic stress was included. For phosphate solubilization, strains B. licheniformis A46 and S. stutzeri A38 did not show any change, whereas strains A37, B. pumilus A49, and P. frigoritolerans/simplex A70 increased solubilization more than twice when osmotic stress was included. Strain P. frigoritolerans/simplex A70 was able to solubilize up to 466 µg/mL of PO43− equivalents. For potassium solubilization, no significant change was detected, except for strain P. frigoritolerans/simplex A70 (166 µg/mL of K+ equivalents), which decreased by approximately 2.5 times. When sulfur oxidation was evaluated, most strains obtained very similar or slightly higher values, but with no significant difference. Here, strains S. stutzeri A38 (5.61 µg/mL of SO42− equivalents) and B. pumilus A49 (2.65 µg/mL of SO42− equivalents) saw their values reduced by 25% and 80%, respectively, when osmotic stress conditions were included. Siderophore production was not affected by stressful conditions, except in strain P. frigoritolerans/simplex A70 (56.14 psu), where production was reduced by approximately 20%.
In the production of auxins, the N. circulans A37, S. stutzeri A38, and B. pumilus A49 strains maintained their production level under stress, but in the P. frigoritolerans/simplex A70 strain, it was reduced by 40%, while for B. licheniformis A46, this decrease even reached 2.5 times. Interestingly, the production of strain B. licheniformis A46 almost doubled under osmotic stress. Biofilm production was reduced for strains S. stutzeri A38 and N. circulans A37 more than 2- and 3-fold, respectively; however, for the B. pumilus A49 strain, biofilm production was multiplied by more than 26 times under stress conditions. Here, the B. licheniformis A46 strain did not undergo any significant changes. Finally, growth with ACC as the sole source of C and N, was not affected for the strains N. circulans A37 and P. frigoritolerans/simplex A70. However, this was limited when osmotic stress was included for strains S. stutzeri A38, B. pumilus A49, and B. licheniformis A46, falling by 40%, 3, and 10 times, respectively.

3.4. Evaluation of In Vitro Colonization and Germination Traits under Osmotic Stress Conditions

The colonization ratio of the candidate strains was evaluated in vitro under regular and osmotic-stressing conditions in Medicago sativa, M. polymorpha, and M. littoralis (Figure 6a–c). Moreover, their effects over the germination ratio were also assessed (Figure 6a,b). Starting with germination tests on M. sativa, we verified its high sensitivity to osmotic stress, as it was not able to germinate under these conditions. Regarding the treatments with bacterial solutions, germination increased when the seeds were treated with the strains B. pumilus A49 (15%), B. licheniformis A46 (20%), and N. circulans A37 (25%), whereas it was maintained or slightly decreased with P. frigoritolerans/simplex A70 and S. stutzeri A38. With osmotic stress treatment, all inoculants were capable of inducing germination, which was reduced by 25–35% compared to non-stressful conditions. Strain S. stutzeri A38 maintained similar levels of germination under both conditions.
In M. polymorpha, germination under control conditions reached 90%, reducing by only 30% due to the effect of osmotic stress. The bacterial treatments maintained similar levels of germination in the cases of P. frigoritolerans/simplex A70 and B. licheniformis A46, but germination fell between 25 and 50% when the seeds were treated with N. circulans A37, B. pumilus A49, or S. stutzeri A38. When osmotic stress was applied, the germination ratio was maintained for N. circulans A37, P. frigoritolerans/simplex A70, and A38, whereas it decreased between 25 and 50% for the treatments with B. pumilus A49 and B. licheniformis A46.
Finally, in M. littoralis, germination was approximately 50% under non-stressful conditions, which decreased to 40% when saline stress was applied. When they were treated with N. circulans A37, germination was reduced by 25%, while with P. frigoritolerans/simplex A70, B. pumilus A49, and S. stutzeri A38, it was reduced by almost half. However, when osmotic stress was applied, P. frigoritolerans/simplex A70 and B. pumilus A49 did not lose their germination rate, and the treatment with S. stutzeri A38 germinated almost twice as much. Particularly interesting is the case of the treatment with B. pumilus A49, whose germination fell by 85% under regular conditions but increased to almost double when the seeds were exposed to osmotic stress.
In general, the colonization ratios observed for the candidate strains were similar in both plant species (around 0.5–2.0 × 10³ CFU/mg of root), except in the case of the candidate strain P. frigoritolerans/simplex A70, which doubled and almost tripled the colonization ratios of other strains in M. sativa (4.2 × 10³ CFU/mg of root) and M. polymorpha (5.6 × 10³ CFU/mg of root), respectively, under regular experimental conditions. However, when osmotic stress conditions were applied in M. sativa, this was the only strain that significantly lost the colonization rate (43%). Interestingly, this did not occur in M. polymorpha, where no significant difference was observed in the colonization ratio. In addition, strain S. stutzeri A38 did not lose colonization rate when osmotic stress was applied, but strains N. circulans A37 and B. licheniformis A46 did it by 58% and 93%, respectively. Strain B. pumilus A49 was the only strain that increased its colonization rate, achieving 60% more. Unfortunately, evaluation of the colonization of the candidate strains in M. littoralis could not be carried out, as the radicles of the seedlings of this species did not reach the minimum size required for the test in the growth medium.

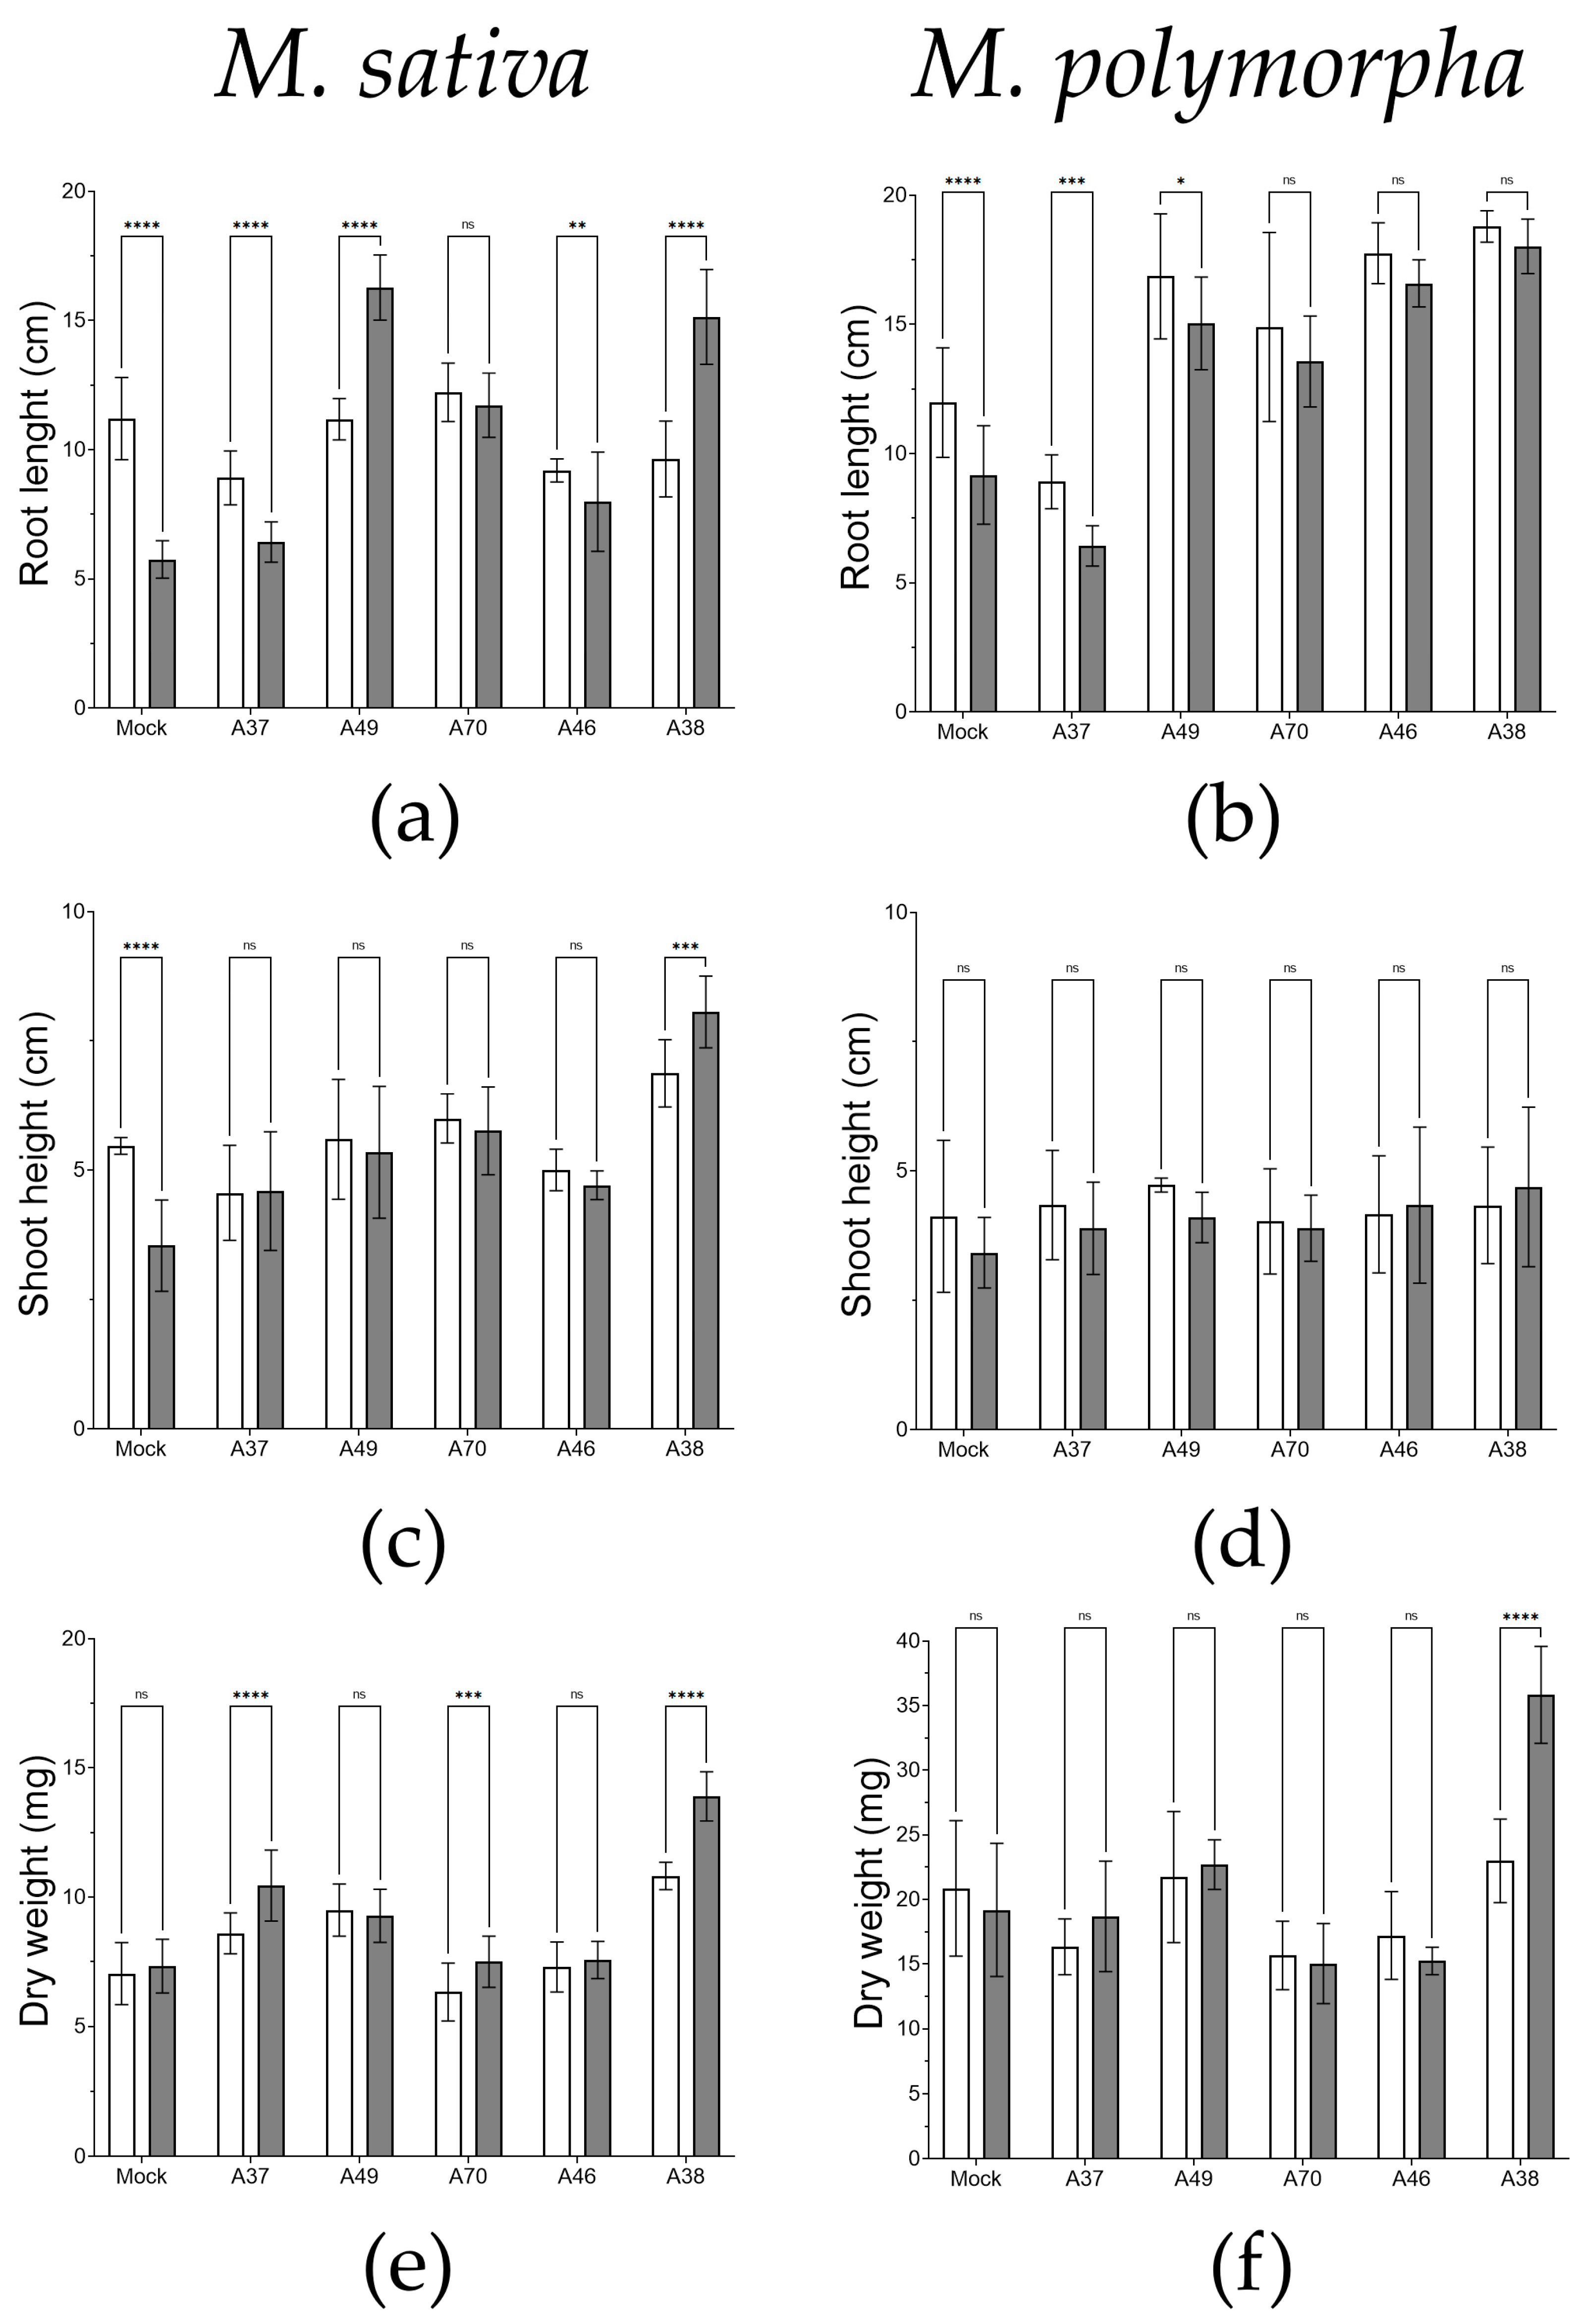
3.5. Biotreatment Tests

After the application of the candidate strains, each one assuming an alternative strategy or treatment, an osmotic stress was applied adjusting the irrigation to 200 mM with NaCl. This treatment had a visible effect on different sets of plants, as shown in Figure 7. Here, we recorded a clearer impact on root length than on plant height, both in Medicago sativa and Medicago polymorpha. Moreover, they showed a better root architecture (secondary roots, tertiary roots, and hairy roots); however, many radicles in both plant species were fragile and often broke during preparation, so we decided not to include this analysis to avoid biased results. Quantification of the parameters, length of the main root, height of the shoot, and total biomass (full-plant dry weight) allowed us to emphasize some of the main effects caused by the different treatments (Figure 8). Starting with the root of M. sativa (Figure 8a), we found that in the condition without bacterial treatment (mock), it reached approximately 11 cm, falling to practically half under osmotic stress conditions. Although no treatment with the candidate strains resulted in a larger average root size, some treatments showed remarkable effects. Thus, the seedlings treated with B. licheniformis A46 and N. circulans A37 showed shorter roots under osmotic stress conditions (15 and 39%, respectively), whereas those treated with P. frigoritolerans/simplex A70 maintained the same level under both conditions. In contrast, the seedlings treated with B. pumilus A49 and S. stutzeri A38 increased the average size of their roots between 46 and 57%. In the case of M. polymorpha (Figure 8b), the mock set (approximately 12 cm) lost only 30% of the average length of its roots when osmotic stress was applied. Here, the N. circulans A37 treatment showed a similar pattern to the mock set as well as after the P. frigoritolerans/simplex A70 treatment, but this set of plants did not lose root length when osmotic stress was applied. However, the seedlings treated with B. pumilus A49 were able to grow about a 57% more under conditions of osmotic stress, similarly as with the treatment of B. licheniformis A46 and S. stutzeri A38.
Analyzing the height of the shoot, the M. sativa seedlings of the mock set (approximately 5.5 cm) also lost slightly more than 50% of the value, as was already recorded in the root length (Figure 8c). In general, no treatment showed a significant difference, except in the set treated with S. stutzeri A38, where the average size of the seedlings increased by approximately 26%, losing only 17% of this value when stress conditions were applied. In M. polymorpha seedlings (Figure 8d), no significant difference was found between the bacterial treatments and the height reached by the mock set (approximately 4.2 cm); moreover, the application of osmotic stress did not seem to affect the height reached by any of the sets analyzed.
Finally, the total biomass reached in the control seedlings of M. sativa (approximately 7 mg dry weight) was maintained under stress conditions (Figure 8e). When the seedlings were treated with B. pumilus A49 or S. stutzeri A38, their weight increased by 35 and 54%, respectively. Under stress conditions, the dry weight of the sets treated with P. frigoritolerans/simplex A70, N. circulans A37, and S. stutzeri A38 increased by 18, 21%, and 30%, respectively. Following this, the M. polymorpha mock set (21 mg of dry weight) did not lose biomass when stressful conditions were applied (Figure 8f). Regarding the rest of the treatments, it is worth noting that the weight of seedlings treated with S. stutzeri A38 increased by approximately 56%. The rest of the conditions did not show significant differences.

4. Discussion

Most projections for the Mediterranean region, as well as many subtropical areas, anticipate a substantial decrease in precipitation levels coupled with a notable rise in average temperatures. This will lead to an overall increase in evapotranspiration rates. These climatic shifts can expedite processes such as desertification, soil salinization, gypsum concentration, and consequently, increase in the osmotic stress for plants [68,69]. The latter phenomena may be further exacerbated by a sea level rise. Already, a significant portion (18%) of growing areas in the Iberian Peninsula is under threat from these advancing conditions, casting doubt on the region’s future agricultural production capacity [70,71]. Furthermore, numerous farmlands are either overexploited, depleted, or abandoned due to their high ionic content. This suggests that their prospects for use or reclamation are dimming in the face of the progressing conditions mentioned above [71]. Consequently, agriculture confronts the imperative of identifying more sustainable management strategies that optimize water use and potentially rejuvenate unproductive land. This is crucial to meet the demands of a growing human population. Our proposition is rooted in the observation that within environments characterized by high ionic content, we can identify microorganisms best suited for enhancing crop yields under osmotic stress conditions. To evaluate this premise, we isolated bacteria from salt pans, salt flats, and soils with substantial gypsum accumulation, irrespective of their prior involvement in agricultural activities. Consequently, in addition to discovering highly adapted species from saline environments (such as Bacillus subtilis or Priestia megaterium), we encountered several commonplace species from other challenging environments (including Bacillus mojavensis, Bacillus thuringiensis, or Pantoea agglomerans). Furthermore, we identified both less common and more prevalent species from non-stressful environments, such as Niallia nealsonii or Stutzerimonas stutzeri [72,73,74,75,76]. The wide-ranging distribution of many of these species is noteworthy. Despite possessing mechanisms akin to those exhibited in non-stressful environments, these strains evolved to thrive in and adapt to these challenging habitats. This offers us a broader and more promising array of options for advancing future treatments. Considering our own samples, we conclude that, due to the amount recovered and the reproducibility, they can be a good representation of each environment. In this sense, about 12% and 65% of the strains were uniquely happening in gypsum-rich and salt-rich soils, respectively. The selection process focused our studies in salt-originated strains, probably showing how these environments are more restrictive in terms of osmotic stress.
One of our primary concerns in characterizing and assessing the most promising candidates for various strategies was validating their capabilities under stressful conditions. While most studies conduct in vitro screenings to efficiently gauge the general capacities of each strain, this approach does not guarantee similar effects on plants, especially in stressful conditions [72,73,74,77]. Therefore, we opted to incorporate osmotic stress into different trials as a distinguishing factor, aligning with a contextualizing trend emerging in the field [75,76].
This allowed us to ascertain whether the selected candidate strains could maintain, or even enhance, their performance levels observed in the selection trials conducted under regular conditions. In instances where results diminished, we gained insight into the anticipated level of impact. Additionally, the inclusion of plant-controlled trials ensured compatibility with prospective treatments [64]. It is noteworthy that none of the strains isolated from hypergypsic environments were chosen. This decision was based on the challenge of accurate identification, and for safety precautions, we opted not to proceed with them. Nevertheless, certain strains from this origin demonstrated sufficient promise to warrant further characterization and application studies in the future [78].
The selected strains demonstrated exceptional performance in one or more of the selection trials. Previous studies indicated that the production of antioxidants can mitigate osmotic stress [79,80]. With this in mind, we opted for the Bacillus pumilus A49 strain, which notably excelled in enhancing the root development of M. sativa and M. polymorpha. This effect was even more pronounced under conditions of osmotic stress in M. sativa. This improvement may be attributed to the regulation of reactive oxygen species (ROS) production within the plant, a process that is significantly heightened during osmotic stress. By modulating ROS levels, better root development is facilitated. Earlier reports also highlighted how antioxidants can foster and induce root development by alleviating the pressure of ROS generated during this process [81]. Bacillus pumilus A49 is renowned for its robust tolerance to stressful environments and was suggested as a potential treatment against osmotic stress [82,83]. In fact, Kumar and colleagues specifically noted that soils inoculated with Bacillus pumilus bacteria can stimulate plant growth, augment soil microbial counts, and enhance soil enzyme activity [82].
We also chose Niallia circulans A37 due to its notable biofilm formation and auxin production. The biofilms produced by many strains were recognized for their protective role against ionic toxicity and in alleviating osmotic pressure on roots [84,85]. Additionally, the auxin production by this strain can enhance the root architecture of treated plants under osmotic stress [34]. However, upon evaluating its effects, we observed only a slight improvement in the biomass of M. sativa under osmotic stress conditions. Although this outcome deviated from our initial expectations, it was evident that the treatment mitigated the loss of root length. Niallia circulans strain is acknowledged for its high auxin production and its role as a plant growth promoter [86,87], though it is not typically classified as a salt-protecting strain. Another intriguing strategy hinges on regulating ethylene levels during osmotic stress through the production of ACC deaminase [73,88]. Consequently, treatment with Bacillus licheniformis A46 strain led to enhanced root growth in M. polymorpha seedlings, maintaining similar levels even under osmotic stress conditions. In other parameters, we noted that this treatment effectively stabilized the metrics, potentially diluting any adverse effects induced by osmotic stress. While these results may not be highly representative, they are significant because they indicate that the plant can more effectively regulate stress and sustain its development. While this enzyme demonstrated growth-improving effects in other instances, numerous studies showed that its impact on ethylene production in plants is balanced under stress conditions [73,89]. This suggests that the plant is less stressed and better able to maintain its normal development. Bacillus licheniformis strain was previously identified as halotolerant and capable of promoting plant growth [90]. It was found to notably enhance germination rate, root length, and seedling dry weight by utilizing ACC as a nitrogen source, even under varying levels of salt osmotic stress [91].
Lastly, for strategies focusing on nutrient accessibility—an essential factor compromised under conditions of osmotic stress—we selected two strains: Stutzerimonas stutzeri A38 as the nitrogen fixator and sulfur oxidizer, and P. frigoritolerans/simplex A70 as the solubilizer of phosphorus (P) and potassium (K), as well as a producer of siderophores. In the case of Stutzerimonas stutzeri A38, known for its nitrogen-fixing abilities and as a biocontroller strain, treatment with this strain prompted notable root system growth in both plant species [92,93]. Both strains P. frigoritolerans and P. simplex were recognized as nematicides and biocontrollers, with some studies suggesting their potential as stress-alleviating strains [94,95]. When seedlings were treated with P. frigoritolerans/simplex A70, the most notable effect was the maintenance of values akin to those obtained under regular conditions even when osmotic stress was applied. Seedlings treated with this strain did not experience the negative impacts observed in the control sets. This could be attributed to the fact that, as indicated in other studies, enhanced accessibility to phosphorus and potassium can improve salt tolerance [96,97,98]. In summary, it is evident that all of these diverse approaches have the potential to enhance crop performance to some degree under osmotic stress conditions. The obtained results are particularly noteworthy in that all candidate strains significantly improved the germination rate of M. sativa under osmotic stress conditions [99,100]. Overcoming the challenge of germinating many genotypes of this species under stress is a pivotal factor in direct field sowing [100]. Previous studies demonstrated that certain inoculants can enhance this aspect, increasing the likelihood of successful development and future production [101,102]. Although M. polymorpha and M. littoralis exhibited lower sensitivity to salinity (albeit highly dependent on the genotype [29,103]), they also benefited from the application of strains P. frigoritolerans/simplex A70, Stutzerimonas stutzeri A38, and Niallia circulans A37, which led to improvements in their performance. However, in specific cases, such as P. frigoritolerans/simplex A70 for M. sativa, treatments may lead to a decrease in this ratio. Thus, it is imperative to conduct case-specific studies to prevent unintended effects. On a different note, all the treatments exhibited similar or, in many cases, higher values compared to the control group, both under normal conditions and in the presence of osmotic stress. This underscores that the selection process for growth promotion was further reinforced by evaluating these traits under osmotic stress conditions. Notably, strains Bacillus pumilus A49 and Bacillus licheniformis A46 demonstrated significant effects on the root system development of both M. sativa and M. polymorpha. While root development in many plant species is typically constrained under stress conditions, the influence of root-associated bacteria can enhance this process, helping to alleviate osmotic pressure and access less readily available water sources [41,104]. Furthermore, Stutzerimonas stutzeri A38 emerged as the most effective strain for biotreatment, showing improvements across all parameters under osmotic stress conditions in both plant species. Its results are more akin to those observed in treatments involving well-established bacteria known for alleviating osmotic stress in plants. This indicates a particularly promising potential for Stutzerimonas stutzeri A38 as a beneficial biotreatment [73,80,105,106].
Addressing the challenges posed by salinization demands a sustainable and safe alternative. We believe that this localized approach, utilizing regional resources, could be a valuable addition to the formulation of new inoculants that are better integrated into the environment and equipped to deploy diverse strategies [107]. Given the intricate nature of osmotic stress, it calls for approaches that are more nuanced than those solely focused on promoting growth. Some researchers started to recognize the necessity of enhancing the applicability and coherence of inoculants in soils and climates specific to affected regions [85,106,107,108]. However, further studies are needed in this area to facilitate the development of tailor-made tools. These might encompass the utilization of combined strategies (such as SynComs, communities, or synthetic consortia) or examining the critical periods for applying treatments that alleviate osmotic stress. Contextualizing new-generation inoculants within their ecological settings is an imperative step to enhance the efficacy of biotreatments in the future.

5. Conclusions

Salinization processes are exacerbating, leading to significant yield losses across various crops. This underscores the critical importance of delineating new treatments to enhance resilience to osmotic stress. While numerous studies advocate for the efficacy of diverse bacterial strains as potential treatments, our research emphasizes the imperative of establishing stringent performance criteria under stress conditions for the selection of novel inoculants. To this end, we integrated in vitro assays for growth promotion and osmotic stress mitigation, alongside assessments of crucial plant traits such as germination and colonization. This established a baseline quality threshold for progression to large-scale trials. Subsequently, we observed varying degrees of impact on different physiological processes and plant responses, discerning clear patterns of effect across different strategies. Notably, strains A38 (selected for nitrogen fixation and sulfur oxidation), A46 (chosen for ACC deaminase production), and A49 (identified as an antioxidant producer) emerged as the most promising candidates, exhibiting marked improvements in overall growth, root development, as well as germination and colonization traits. Future trials may encompass the formulation of consortia-comprising strains employing different strategies, long-term assessments, competition with local microfauna, and evaluations of productivity in diverse field crops to validate the potential of these promising candidates.

Supplementary Materials

The following supporting information can be downloaded at: https://www.mdpi.com/article/10.3390/soilsystems7040086/s1, Figure S1: Petri dish-based screening methods.

Author Contributions

Conceptualization, J.I.V.; methodology, J.I.V., R.T. and T.G.; software, T.G., I.R.R., A.S.R.d.S. and J.I.V.; validation, T.G., R.T., A.S., M.N.C., M.A.d.P., A.C.C.d.M. and J.I.V.; formal analysis, T.G., R.T., A.S., M.N.C., M.A.d.P., A.C.C.d.M. and J.I.V.; investigation, T.G., R.T., A.S., M.N.C., M.A.d.P., A.C.C.d.M. and C.S.L.; resources, J.I.V. and M.V.F.; data curation, T.G., M.N.C., I.R.R. and R.T.; writing—original draft preparation, J.I.V.; writing—review and editing, J.I.V.; supervision, J.I.V.; funding acquisition, J.I.V. All authors have read and agreed to the published version of the manuscript.

Funding

This work was as well supported by FCT—Fundação para a Ciência e a Tecnologia, I.P., through the R&D Unit “GREEN-IT—Bioresources for Sustainability” (UIDB/04551/2020 and UIDP/04551/2020), Portugal.

Institutional Review Board Statement

Not applicable.

Informed Consent Statement

Not applicable.

Data Availability Statement

Not applicable.

Acknowledgments

The authors want to thank for their support and advice to M. Margarida Oliveira and Jesús Giménez Cebrian (‘Chechu’). Research in the laboratory of plant-microbiome interactions (iPlantMicro Lab) headed by J.I.V., was supported by FCT—Fundação para a Ciência e a Tecnologia, I.P., through the R&D Unit “GREEN-IT—Bioresources for Sustainability” (UIDB/04551/2020 and UIDP/04551/2020), Portugal. Havia muitas colônias.

Conflicts of Interest

The authors declare that they have no conflict of interest. The funders had no role in the design of the study; in the collection, analyses, or interpretation of data; in the writing of the manuscript, or in the decision to publish the results.

References

  1. Xiong, L.; Zhu, J.-K. Molecular and genetic aspects of plant responses to osmotic stress. Plant Cell Environ. 2002, 25, 131–139. [Google Scholar] [CrossRef] [PubMed]
  2. Osakabe, Y.; Arinaga, N.; Umezawa, T.; Katsura, S.; Nagamachi, K.; Tanaka, H.; Ohiraki, H.; Yamada, K.; Seo, S.U.; Abo, M.; et al. Osmotic stress responses and plant growth controlled by potassium transporters in Arabidopsis. Plant Cell 2013, 25, 609–624. [Google Scholar] [CrossRef] [PubMed]
  3. Upadhyaya, H.; Sahoo, L.; Panda, S.K. Molecular Physiology of Osmotic Stress in Plants. In Molecular Stress Physiology of Plants; Rout, G.R., Das, A.B., Eds.; Springer: New Delhi, India, 2013; pp. 179–192. [Google Scholar]
  4. Ayangbenro, A.S.; Babalola, O.O. Reclamation of arid and semi-arid soils: The role of plant growth-promoting archaea and bacteria. Curr. Plant Biol. 2021, 25, 100173. [Google Scholar] [CrossRef]
  5. Sajid, H.; Muhammad, S.; Muhammad, A.; Chunquan, Z.; Qianyu, J.; Junhua, Z. Salinity Stress in Arid and Semi-Arid Climates: Effects and Management in Field Crops. In Climate Change and Agriculture; Saddam, H., Ed.; IntechOpen: Rijeka, Croatia, 2019; Chapter 12. [Google Scholar]
  6. Jorda, H.; Perelman, A.; Lazarovitch, N.; Vanderborght, J. Exploring Osmotic Stress and Differences between Soil–Root Interface and Bulk Salinities. Vadose Zone J. 2018, 17, 170029. [Google Scholar] [CrossRef]
  7. Canfora, L.; Vendramin, E.; Vittori Antisari, L.; Lo Papa, G.; Dazzi, C.; Benedetti, A.; Iavazzo, P.; Adamo, P.; Jungblut, A.D.; Pinzari, F. Compartmentalization of gypsum and halite associated with cyanobacteria in saline soil crusts. FEMS Microbiol. Ecol. 2016, 92, fiw080. [Google Scholar] [CrossRef] [PubMed]
  8. Eswaran, H.; Stoops, G.; Abtahi, A. SEM morphologies of halite (NaCl) in soils. J. Microsc. 1980, 120, 343–352. [Google Scholar] [CrossRef]
  9. Herrero, J.; Porta, J. The terminology and the concepts of gypsum-rich soils. Geoderma 2000, 96, 47–61. [Google Scholar] [CrossRef]
  10. Howari, F.M.; Goodell, P.C.; Miyamoto, S. Spectral properties of salt crusts formed on saline soils. J. Environ. Qual. 2002, 31, 1453–1461. [Google Scholar] [CrossRef]
  11. Van Alphen, J.; de los Ríos Romero, F. Gypsiferous Soils: Notes on Their Characteristics and Management; ILRI: Wageningen, The Netherlands, 1971. [Google Scholar]
  12. Ramos, T.B.; Castanheira, N.; Oliveira, A.R.; Paz, A.M.; Darouich, H.; Simionesei, L.; Farzamian, M.; Gonçalves, M.C. Soil salinity assessment using vegetation indices derived from Sentinel-2 multispectral data. application to Lezíria Grande, Portugal. Agric. Water Manag. 2020, 241, 106387. [Google Scholar] [CrossRef]
  13. Salwan, R.; Sharma, A.; Sharma, V. Microbes mediated plant stress tolerance in saline agricultural ecosystem. Plant Soil 2019, 442, 1–22. [Google Scholar] [CrossRef]
  14. Negacz, K.; Malek, Ž.; de Vos, A.; Vellinga, P. Saline soils worldwide: Identifying the most promising areas for saline agriculture. J. Arid Environ. 2022, 203, 104775. [Google Scholar] [CrossRef]
  15. Wicke, B.; Smeets, E.; Dornburg, V.; Vashev, B.; Gaiser, T.; Turkenburg, W.; Faaij, A. The global technical and economic potential of bioenergy from salt-affected soils. Energy Environ. Sci. 2011, 4, 2669–2681. [Google Scholar] [CrossRef]
  16. Sanchez Lopez, J.; Curt, M.; Fernandez, J. Approach to the potential production of giant reed in surplus saline lands of Spain. GCB Bioenergy 2015, 9, 105–108. [Google Scholar] [CrossRef]
  17. Herrero, J.; Castañeda, C.; Gómez-Báguena, R. A Heritage Agronomic Study as a Database for Monitoring the Soil Salinity of an Irrigated District in NE Spain. Agronomy 2022, 12, 126. [Google Scholar] [CrossRef]
  18. Ramos, T.B.; Darouich, H.; Šimůnek, J.; Gonçalves, M.C.; Martins, J.C. Soil salinization in very high-density olive orchards grown in southern Portugal: Current risks and possible trends. Agric. Water Manag. 2019, 217, 265–281. [Google Scholar] [CrossRef]
  19. Akpulat, H.A.; Celik, N. Flora of gypsum areas in Sivas in the eastern part of Cappadocia in Central Anatolia, Turkey. J. Arid Environ. 2005, 61, 27–46. [Google Scholar] [CrossRef]
  20. Álvarez, D.; Antúnez, M.; Porras, S.; Rodríguez-Ochoa, R.; Olarieta, J.R.; Poch, R.M. Quantification of Gypsum in Soils: Methodological Proposal. Span. J. Soil Sci. 2022, 12, 10669. [Google Scholar] [CrossRef]
  21. Escudero, A.; Palacio, S.; Maestre, F.; Luzuriaga, A. Plant life on gypsum: A review of its multiple facets. Biol. Rev. 2014, 90, 1–18. [Google Scholar] [CrossRef] [PubMed]
  22. Safarnejad, A. Morphological and biochemical response to osmotic stress in alfalfa (Medicago sativa L.). Pak. J. Bot. 2008, 40, 735–746. [Google Scholar]
  23. Sun, W.; Xu, X.; Zhu, H.; Liu, A.; Liu, L.; Li, J.; Hua, X. Comparative transcriptomic profiling of a salt-tolerant wild tomato species and a salt-sensitive tomato cultivar. Plant Cell Physiol. 2010, 51, 997–1006. [Google Scholar] [CrossRef]
  24. Feng, Y.; Shi, Y.; Zhao, M.; Shen, H.; Xu, L.; Luo, Y.; Liu, Y.; Xing, A.; Kang, J.; Jing, H.; et al. Yield and quality properties of alfalfa (Medicago sativa L.) and their influencing factors in China. Eur. J. Agron. 2022, 141, 126637. [Google Scholar] [CrossRef]
  25. Radovic, J.; Sokolović, D.; Marković, J. Alfalfa-most important perennial forage legume in animal husbandry. Biotechnol. Anim. Husb. 2009, 25, 465–475. [Google Scholar] [CrossRef]
  26. Yang, C.; Zhang, F.; Jiang, X.; Yang, X.; He, F.; Wang, Z.; Long, R.; Chen, L.; Yang, T.; Wang, C.; et al. Identification of Genetic Loci Associated with Crude Protein Content and Fiber Composition in Alfalfa (Medicago sativa L.) Using QTL Mapping. Front. Plant Sci. 2021, 12, 608940. [Google Scholar] [CrossRef] [PubMed]
  27. Suriyagoda, L.D.; Ryan, M.H.; Renton, M.; Lambers, H. Multiple adaptive responses of Australian native perennial legumes with pasture potential to grow in phosphorus-and moisture-limited environments. Ann. Bot. 2010, 105, 755–767. [Google Scholar] [CrossRef] [PubMed]
  28. Ashraf, M. Tolerance of some potential forage grasses from arid regions of Pakistan to salinity and drought. In Proceedings of the Biosaline Agriculture and Salinity Tolerance in Plants; Birkhäuser: Basel, Switzerland, 2006; pp. 15–27. [Google Scholar]
  29. Friesen, M.L.; von Wettberg, E.J.B.; Badri, M.; Moriuchi, K.S.; Barhoumi, F.; Chang, P.L.; Cuellar-Ortiz, S.; Cordeiro, M.A.; Vu, W.T.; Arraouadi, S.; et al. The ecological genomic basis of salinity adaptation in Tunisian Medicago truncatula. BMC Genom. 2014, 15, 1160. [Google Scholar] [CrossRef] [PubMed]
  30. Hayat, S.; Hayat, Q.; Alyemeni, M.N.; Wani, A.S.; Pichtel, J.; Ahmad, A. Role of proline under changing environments: A review. Plant Signal. Behav. 2012, 7, 1456–1466. [Google Scholar] [CrossRef]
  31. Kuhlmann, A.U.; Hoffmann, T.; Bursy, J.; Jebbar, M.; Bremer, E. Ectoine and hydroxyectoine as protectants against osmotic and cold stress: Uptake through the SigB-controlled betaine-choline-carnitine transporter-type carrier EctT from Virgibacillus pantothenticus. J. Bacteriol. 2011, 193, 4699–4708. [Google Scholar] [CrossRef]
  32. Vílchez, J.I.; García-Fontana, C.; Román-Naranjo, D.; González-López, J.; Manzanera, M. Plant Drought Tolerance Enhancement by Trehalose Production of Desiccation-Tolerant Microorganisms. Front. Microbiol. 2016, 7, 1577. [Google Scholar] [CrossRef]
  33. Orozco-Mosqueda, M.d.C.; Duan, J.; DiBernardo, M.; Zetter, E.; Campos-García, J.; Glick, B.R.; Santoyo, G. The Production of ACC Deaminase and Trehalose by the Plant Growth Promoting Bacterium Pseudomonas sp. UW4 Synergistically Protect Tomato Plants against Salt Stress. Front. Microbiol. 2019, 10, 1392. [Google Scholar] [CrossRef]
  34. Metoui Ben Mahmoud, O.; Hidri, R.; Talbi-Zribi, O.; Taamalli, W.; Abdelly, C.; Djébali, N. Auxin and proline producing rhizobacteria mitigate salt-induced growth inhibition of barley plants by enhancing water and nutrient status. S. Afr. J. Bot. 2020, 128, 209–217. [Google Scholar] [CrossRef]
  35. Amaresan, N.; Patel, K.; Jinal, H. Inoculation of Cucumber (Cucumis sativus L.) Seedlings with Salt-Tolerant Plant Growth Promoting Bacteria Improves Nutrient Uptake, Plant Attributes and Physiological Profiles. J. Plant Growth Regul. 2021, 40, 1728–1740. [Google Scholar] [CrossRef]
  36. Khan, M.A.; Sahile, A.A.; Jan, R.; Asaf, S.; Hamayun, M.; Imran, M.; Adhikari, A.; Kang, S.M.; Kim, K.M.; Lee, I.J. Halotolerant bacteria mitigate the effects of salinity stress on soybean growth by regulating secondary metabolites and molecular responses. BMC Plant Biol. 2021, 21, 176. [Google Scholar] [CrossRef]
  37. Kumawat, K.C.; Sharma, B.; Nagpal, S.; Kumar, A.; Tiwari, S.; Nair, R.M. Plant growth-promoting rhizobacteria: Salt stress alleviators to improve crop productivity for sustainable agriculture development. Front. Plant Sci. 2022, 13, 1101862. [Google Scholar] [CrossRef]
  38. Yasmeen, T.; Ahmad, A.; Arif, M.S.; Mubin, M.; Rehman, K.; Shahzad, S.M.; Iqbal, S.; Rizwan, M.; Ali, S.; Alyemeni, M.N.; et al. Biofilm forming rhizobacteria enhance growth and salt tolerance in sunflower plants by stimulating antioxidant enzymes activity. Plant Physiol. Biochem. 2020, 156, 242–256. [Google Scholar] [CrossRef] [PubMed]
  39. Haque, M.M.; Mosharaf, M.K.; Khatun, M.; Haque, M.A.; Biswas, M.S.; Islam, M.S.; Islam, M.M.; Shozib, H.B.; Miah, M.M.U.; Molla, A.H.; et al. Biofilm Producing Rhizobacteria with Multiple Plant Growth-Promoting Traits Promote Growth of Tomato Under Water-Deficit Stress. Front. Microbiol. 2020, 11, 542053. [Google Scholar] [CrossRef] [PubMed]
  40. Shah, G.; Jan, M.; Afreen, M.; Anees, M.; Rehman, S.; Daud, M.K.; Malook, I.; Jamil, M. Halophilic bacteria mediated phytoremediation of salt-affected soils cultivated with rice. J. Geochem. Explor. 2017, 174, 59–65. [Google Scholar] [CrossRef]
  41. Kumar, A.; Singh, S.; Gaurav, A.K.; Srivastava, S.; Verma, J.P. Plant Growth-Promoting Bacteria: Biological Tools for the Mitigation of Salinity Stress in Plants. Front. Microbiol. 2020, 11, 1216. [Google Scholar] [CrossRef] [PubMed]
  42. Shurigin, V.; Egamberdieva, D.; Li, L.; Davranov, K.; Panosyan, H.; Birkeland, N.-K.; Wirth, S.; Bellingrath-Kimura, S.D. Endophytic bacteria associated with halophyte Seidlitzia rosmarinus Ehrenb. ex Boiss. from saline soil of Uzbekistan and their plant beneficial traits. J. Arid Land 2020, 12, 730–740. [Google Scholar] [CrossRef]
  43. Azucena Gándara, L.; Marco Antonio Gutiérrez, C. Efecto de microorganismos promotores de crecimiento vegetal y yeso agrícola en el cultivo de higo. CIBA Rev. Iberoam. Cienc. Biol. Agropecu. 2023, 12, 1–21. [Google Scholar] [CrossRef]
  44. Chaudhary, A.; Chaudhary, P.; Upadhyay, A.; Kumar, A.; Rani, A. Effect of Gypsum on Plant Growth Promoting Rhizobacteria. Environ. Ecol. 2022, 39, 1248–1256. [Google Scholar]
  45. Breakwell, D.; Woolverton, C.; MacDonald, B.; Smith, K.; Robison, R. Colony Morphology Protocol. In Proceedings of the 14th American Society for Microbiology Conference for Undergraduate Educators (ASMCUE), Buffalo, NY, USA, 29 September 2007. [Google Scholar]
  46. Dashti, A.; Jadaon, M.; Abdulsamad, A.; Dashti, H. Heat Treatment of Bacteria: A Simple Method of DNA Extraction for Molecular Techniques. Kuwait Med. J. 2009, 41, 117–122. [Google Scholar]
  47. Letunic, I.; Bork, P. Interactive Tree Of Life (iTOL) v5: An online tool for phylogenetic tree display and annotation. Nucleic Acids Res. 2021, 49, W293–W296. [Google Scholar] [CrossRef] [PubMed]
  48. Cen, H.; Wang, T.; Liu, H.; Tian, D.; Zhang, Y. Melatonin Application Improves Salt Tolerance of Alfalfa (Medicago sativa L.) by Enhancing Antioxidant Capacity. Plants 2020, 9, 220. [Google Scholar] [CrossRef] [PubMed]
  49. Filippou, P.; Zarza, X.; Antoniou, C.; Obata, T.; Villarroel, C.; Ganopoulos, I.; Harokopos, V.; Gohari, G.; Aidinis, V.; Madesis, P.; et al. Systems biology reveals key tissue-specific metabolic and transcriptional signatures involved in the response of Medicago truncatula plant genotypes to salt stress. Comput. Struct. Biotechnol. J. 2021, 19, 2133–2147. [Google Scholar] [CrossRef]
  50. Sulistiyani, T.; Meliah, S. Isolation and Characterization of Nitrogen Fixing Endophytic Bacteria Associated with Sweet Sorghum (Sorghum bicolor). In Proceedings of the SATREPS Conference, Bogor City, Indonesia, 14 November 2017. [Google Scholar]
  51. Iwata, K.; Azlan, A.; Yamakawa, H.; Omori, T. Ammonia accumulation in culture broth by the novel nitrogen-fixing bacterium, Lysobacter sp. E4. J. Biosci. Bioeng. 2010, 110, 415–418. [Google Scholar] [CrossRef]
  52. Hartono, H.; Nurfitriani; Asnawati, F.; Citra, H.; Handayani, N.I.; Junda, M.; Ali, A.; Hala, Y.; Jumadi, O. Ability of ammonium excretion, indol acetic acid production, and phosphate solubilization of nitrogen-fixing bacteria isolated from crop rhizosphere and their effect on plant growth. ARPN J. Eng. Appl. Sci. 2016, 11, 11735–11741. [Google Scholar]
  53. Zheng, B.-X.; Ibrahim, M.; Zhang, D.-P.; Bi, Q.-F.; Li, H.-Z.; Zhou, G.-W.; Ding, K.; Peñuelas, J.; Zhu, Y.-G.; Yang, X.-R. Identification and characterization of inorganic-phosphate-solubilizing bacteria from agricultural fields with a rapid isolation method. AMB Express 2018, 8, 47. [Google Scholar] [CrossRef]
  54. Rajawat, M.V.S.; Singh, S.; Tyagi, S.P.; Saxena, A.K. A Modified Plate Assay for Rapid Screening of Potassium-Solubilizing Bacteria. Pedosphere 2016, 26, 768–773. [Google Scholar] [CrossRef]
  55. Mohd Yusof, H.; Halimi, M.; Samsudin, A.A. Isolation and Characterisation of Sulphur Oxidizing Bacteria Isolated from Hot Spring in Malaysia for Biological Deodorisation of Hydrogen Sulphide in Chicken Manure. Media Peternak. 2017, 40, 178–187. [Google Scholar] [CrossRef]
  56. Louden, B.C.; Haarmann, D.; Lynne, A.M. Use of Blue Agar CAS Assay for Siderophore Detection. J. Microbiol. Biol. Educ. 2011, 12, 51–53. [Google Scholar] [CrossRef]
  57. Arora, N.K.; Verma, M. Modified microplate method for rapid and efficient estimation of siderophore produced by bacteria. 3 Biotech 2017, 7, 381. [Google Scholar] [CrossRef]
  58. Coffey, B.M.; Anderson, G.G. Biofilm formation in the 96-well microtiter plate. In Pseudomonas Methods and Protocols; Methods in Molecular Biology; Humana: New York, NY, USA, 2014; Volume 1149, pp. 631–641. [Google Scholar] [CrossRef]
  59. Ambrosini, A.; Passaglia, L.M.P. Plant Growth–Promoting Bacteria (PGPB): Isolation and Screening of PGP Activities. Curr. Protoc. Plant Biol. 2017, 2, 190–209. [Google Scholar] [CrossRef]
  60. Niza-Costa, M.; Rodríguez-dos Santos, A.S.; Rebelo-Romão, I.; Ferrer, M.V.; Sequero López, C.; Vílchez, J.I. Geographically Disperse, Culturable Seed-Associated Microbiota in Forage Plants of Alfalfa (Medicago sativa L.) and Pitch Clover (Bituminaria bituminosa L.): Characterization of Beneficial Inherited Strains as Plant Stress-Tolerance Enhancers. Biology 2022, 11, 1838. [Google Scholar] [CrossRef]
  61. Reiner, K. Catalase Test Protocol; American Society for Microbiology: Washington, DC, USA, 2010. [Google Scholar]
  62. Hadwan, M.H. Simple spectrophotometric assay for measuring catalase activity in biological tissues. BMC Biochem. 2018, 19, 7. [Google Scholar] [CrossRef] [PubMed]
  63. Takao, T.; Kitatani, F.; Watanabe, N.; Yagi, A.; Sakata, K. A Simple Screening Method for Antioxidants and Isolation of Several Antioxidants Produced by Marine Bacteria from Fish and Shellfish. Biosci. Biotechnol. Biochem. 1994, 58, 1780–1783. [Google Scholar] [CrossRef]
  64. Vílchez, J.I.; Yang, Y.; Yi, D.; Zhang, H. Measurements of Root Colonized Bacteria Species. Bio-protocol 2021, 11, e3976. [Google Scholar] [CrossRef] [PubMed]
  65. Armengaud, P.; Zambaux, K.; Hills, A.; Sulpice, R.; Pattison, R.J.; Blatt, M.R.; Amtmann, A. EZ-Rhizo: Integrated software for the fast and accurate measurement of root system architecture. Plant J. 2009, 57, 945–956. [Google Scholar] [CrossRef]
  66. Schneider, C.A.; Rasband, W.S.; Eliceiri, K.W. NIH Image to ImageJ: 25 years of image analysis. Nat. Methods 2012, 9, 671–675. [Google Scholar] [CrossRef]
  67. Vilchez, J.I. Population and Screening Analysis of Salt/Gypsum Strains. 2023. Available online: https://figshare.com/articles/dataset/Population_and_screening_analysis_of_Salt_gypsum_strains/22927658 (accessed on 9 July 2023).
  68. Mastrocicco, M.; Colombani, N. The Issue of Groundwater Salinization in Coastal Areas of the Mediterranean Region: A Review. Water 2021, 13, 90. [Google Scholar] [CrossRef]
  69. Kharroubi, A.; Tlahigue, F.; Agoubi, B.; Azri, C.; Bouri, S. Hydrochemical and statistical studies of the groundwater salinization in Mediterranean arid zones: Case of the Jerba coastal aquifer in southeast Tunisia. Environ. Earth Sci. 2012, 67, 2089–2100. [Google Scholar] [CrossRef]
  70. Melendez-Pastor, I.; Hernández, E.; Navarro-Pedreño, J.; Gómez Lucas, I. Mapping Soil Salinization of Agricultural Coastal Areas in Southeast Spain. In Remote Sensing Applications; IntechOpen: London, UK, 2012; Volume 6. [Google Scholar]
  71. Günal, H.; Korucu, T.; Birkas, M.; Özgöz, E.; Halbac-Cotoara-Zamfir, R. Threats to Sustainability of Soil Functions in Central and Southeast Europe. Sustainability 2015, 7, 2161–2188. [Google Scholar] [CrossRef]
  72. Shrivastava, P.; Kumar, R. Soil salinity: A serious environmental issue and plant growth promoting bacteria as one of the tools for its alleviation. Saudi J. Biol. Sci. 2015, 22, 123–131. [Google Scholar] [CrossRef] [PubMed]
  73. Ahemad, M. Remediation of metalliferous soils through the heavy metal resistant plant growth promoting bacteria: Paradigms and prospects. Arab. J. Chem. 2019, 12, 1365–1377. [Google Scholar] [CrossRef]
  74. Rilling, J.I.; Acuña, J.J.; Nannipieri, P.; Cassan, F.; Maruyama, F.; Jorquera, M.A. Current opinion and perspectives on the methods for tracking and monitoring plant growth-promoting bacteria. Soil Biol. Biochem. 2019, 130, 205–219. [Google Scholar] [CrossRef]
  75. Verma, M.; Mishra, J.; Arora, N.K. Plant Growth-Promoting Rhizobacteria: Diversity and Applications. In Environmental Biotechnology: For Sustainable Future; Sobti, R.C., Arora, N.K., Kothari, R., Eds.; Springer: Singapore, 2019; pp. 129–173. [Google Scholar]
  76. Sharma, A.; Dev, K.; Sourirajan, A.; Choudhary, M. Isolation and characterization of salt-tolerant bacteria with plant growth-promoting activities from saline agricultural fields of Haryana, India. J. Genet. Eng. Biotechnol. 2021, 19, 99. [Google Scholar] [CrossRef]
  77. Kumawat, C.; Kumar, A.; Parshad, J.; Sharma, S.S.; Patra, A.; Dogra, P.; Yadav, G.K.; Dadhich, S.K.; Verma, R.; Kumawat, G.L. Microbial Diversity and Adaptation under Salt-Affected Soils: A Review. Sustainability 2022, 14, 9280. [Google Scholar] [CrossRef]
  78. Zhang, S.; Fan, C.; Wang, Y.; Xia, Y.; Xiao, W.; Cui, X. Salt-tolerant and plant-growth-promoting bacteria isolated from high-yield paddy soil. Can. J. Microbiol. 2018, 64, 968–978. [Google Scholar] [CrossRef] [PubMed]
  79. Siddikee, M.A.; Chauhan, P.S.; Anandham, R.; Han, G.H.; Sa, T. Isolation, characterization, and use for plant growth promotion under salt stress, of ACC deaminase-producing halotolerant bacteria derived from coastal soil. J. Microbiol. Biotechnol. 2010, 20, 1577–1584. [Google Scholar] [CrossRef] [PubMed]
  80. Orhan, F.; Demirci, A. Salt Stress Mitigating Potential of Halotolerant/Halophilic Plant Growth Promoting. Geomicrobiol. J. 2020, 37, 663–669. [Google Scholar] [CrossRef]
  81. Jhuma, T.A.; Rafeya, J.; Sultana, S.; Rahman, M.T.; Karim, M.M. Isolation of Endophytic Salt-Tolerant Plant Growth-Promoting Rhizobacteria from Oryza sativa and Evaluation of Their Plant Growth-Promoting Traits under Salinity Stress Condition. Front. Sustain. Food Syst. 2021, 5, 687531. [Google Scholar] [CrossRef]
  82. Orhan, F. Potential of Halophilic/Halotolerant Bacteria in Enhancing Plant Growth Under Salt Stress. Curr. Microbiol. 2021, 78, 3708–3719. [Google Scholar] [CrossRef]
  83. Rincón, A.; Arenal, F.; González, I.; Manrique, E.; Lucas, M.M.; Pueyo, J.J. Diversity of Rhizobial Bacteria Isolated from Nodules of the Gypsophyte Ononis tridentata L. Growing in Spanish Soils. Microb. Ecol. 2008, 56, 223–233. [Google Scholar] [CrossRef]
  84. Neshat, M.; Abbasi, A.; Hosseinzadeh, A.; Sarikhani, M.R.; Dadashi Chavan, D.; Rasoulnia, A. Plant growth promoting bacteria (PGPR) induce antioxidant tolerance against salinity stress through biochemical and physiological mechanisms. Physiol. Mol. Biol. Plants 2022, 28, 347–361. [Google Scholar] [CrossRef] [PubMed]
  85. Tahir, M.; Ahmad, I.; Shahid, M.; Shah, G.M.; Farooq, A.B.U.; Akram, M.; Tabassum, S.A.; Naeem, M.A.; Khalid, U.; Ahmad, S.; et al. Regulation of antioxidant production, ion uptake and productivity in potato (Solanum tuberosum L.) plant inoculated with growth promoting salt tolerant Bacillus strains. Ecotoxicol. Environ. Saf. 2019, 178, 33–42. [Google Scholar] [CrossRef]
  86. Kusale, S.P.; Attar, Y.C.; Sayyed, R.Z.; Malek, R.A.; Ilyas, N.; Suriani, N.L.; Khan, N.; El Enshasy, H.A. Production of Plant Beneficial and Antioxidants Metabolites by Klebsiella variicola under Salinity Stress. Molecules 2021, 26, 1894. [Google Scholar] [CrossRef] [PubMed]
  87. Kumar, A.; Singh, S.; Mukherjee, A.; Rastogi, R.P.; Verma, J.P. Salt-tolerant plant growth-promoting Bacillus pumilus strain JPVS11 to enhance plant growth attributes of rice and improve soil health under salinity stress. Microbiol. Res. 2021, 242, 126616. [Google Scholar] [CrossRef]
  88. Dobrzyński, J.; Jakubowska, Z.; Dybek, B. Potential of Bacillus pumilus to directly promote plant growth. Front. Microbiol. 2022, 13, 1069053. [Google Scholar] [CrossRef] [PubMed]
  89. Qurashi, A.W.; Sabri, A.N. Bacterial exopolysaccharide and biofilm formation stimulate chickpea growth and soil aggregation under salt stress. Braz. J. Microbiol. 2012, 43, 1183–1191. [Google Scholar] [CrossRef]
  90. Yin, W.; Wang, Y.; Liu, L.; He, J. Biofilms: The Microbial “Protective Clothing” in Extreme Environments. Int. J. Mol. Sci. 2019, 20, 3423. [Google Scholar] [CrossRef]
  91. Sarmiento-López, L.G.; López-Meyer, M.; Maldonado-Mendoza, I.E.; Quiroz-Figueroa, F.R.; Sepúlveda-Jiménez, G.; Rodríguez-Monroy, M. Production of indole-3-acetic acid by Bacillus circulans E9 in a low-cost medium in a bioreactor. J. Biosci. Bioeng. 2022, 134, 21–28. [Google Scholar] [CrossRef]
  92. Qin, L.; Tian, P.; Cui, Q.; Hu, S.; Jian, W.; Xie, C.; Yang, X.; Shen, H. Bacillus circulans GN03 Alters the Microbiota, Promotes Cotton Seedling Growth and Disease Resistance, and Increases the Expression of Phytohormone Synthesis and Disease Resistance-Related Genes. Front. Plant Sci. 2021, 12, 644597. [Google Scholar] [CrossRef]
  93. Orozco-Mosqueda, M.D.C.; Glick, B.R.; Santoyo, G. ACC deaminase in plant growth-promoting bacteria (PGPB): An efficient mechanism to counter salt stress in crops. Microbiol. Res. 2020, 235, 126439. [Google Scholar] [CrossRef] [PubMed]
  94. Seo, M.-S.; Song, H.-G. Growth promotion of tomato plant under drought conditions by treatment of rhizobacteria producing ACC deaminase and phytohormones. Korean J. Microbiol. 2013, 49, 46–50. [Google Scholar] [CrossRef]
  95. Bhutani, N.; Maheshwari, R.; Sharma, N.; Kumar, P.; Dang, A.S.; Suneja, P. Characterization of halo-tolerant plant growth promoting endophytic Bacillus licheniformis MHN 12. J. Genet. Eng. Biotechnol. 2022, 20, 113. [Google Scholar] [CrossRef] [PubMed]
  96. Qi, R.; Lin, W.; Gong, K.; Han, Z.; Ma, H.; Zhang, M.; Zhang, Q.; Gao, Y.; Li, J.; Zhang, X. Bacillus Co-Inoculation Alleviated Salt Stress in Seedlings Cucumber. Agronomy 2021, 11, 966. [Google Scholar] [CrossRef]
  97. Pham, V.T.K.; Rediers, H.; Ghequire, M.G.K.; Nguyen, H.H.; De Mot, R.; Vanderleyden, J.; Spaepen, S. The plant growth-promoting effect of the nitrogen-fixing endophyte Pseudomonas stutzeri A15. Arch. Microbiol. 2017, 199, 513–517. [Google Scholar] [CrossRef]
  98. Rojas-Solís, D.; Zetter-Salmón, E.; Contreras-Pérez, M.; Rocha-Granados, M.d.C.; Macías-Rodríguez, L.; Santoyo, G. Pseudomonas stutzeri E25 and Stenotrophomonas maltophilia CR71 endophytes produce antifungal volatile organic compounds and exhibit additive plant growth-promoting effects. Biocatal. Agric. Biotechnol. 2018, 13, 46–52. [Google Scholar] [CrossRef]
  99. Montecillo, J.A.V.; Bae, H. In silico analysis of koranimine, a cyclic imine compound from Peribacillus frigoritolerans reveals potential nematicidal activity. Sci. Rep. 2022, 12, 18883. [Google Scholar] [CrossRef]
  100. Sato, S.; Ichiyanagi, N.; Sugiyama, K.; Aburai, N.; Fujii, K. Production of polyglutamic acid-like mucilage protein by Peribacillus simplex strain 8h. Folia Microbiol. 2023, 68, 101–113. [Google Scholar] [CrossRef]
  101. Dey, G.; Banerjee, P.; Sharma, R.K.; Maity, J.P.; Etesami, H.; Shaw, A.K.; Huang, Y.-H.; Huang, H.-B.; Chen, C.-Y. Management of Phosphorus in Salinity-Stressed Agriculture for Sustainable Crop Production by Salt-Tolerant Phosphate-Solubilizing Bacteria—A Review. Agronomy 2021, 11, 1552. [Google Scholar] [CrossRef]
  102. Feng, K.; Cai, Z.; Ding, T.; Yan, H.; Liu, X.; Zhang, Z. Effects of potassium-solubulizing and photosynthetic bacteria on tolerance to salt stress in maize. J. Appl. Microbiol. 2019, 126, 1530–1540. [Google Scholar] [CrossRef]
  103. Muthuraja, R.; Muthukumar, T. Co-inoculation of halotolerant potassium solubilizing Bacillus licheniformis and Aspergillus violaceofuscus improves tomato growth and potassium uptake in different soil types under salinity. Chemosphere 2022, 294, 133718. [Google Scholar] [CrossRef] [PubMed]
  104. Yu, R.; Zuo, T.; Diao, P.; Fu, J.; Fan, Y.; Wang, Y.; Zhao, Q.; Ma, X.; Lu, W.; Li, A.; et al. Melatonin Enhances Seed Germination and Seedling Growth of Medicago sativa Under Salinity via a Putative Melatonin Receptor MsPMTR1. Front. Plant Sci. 2021, 12, 702875. [Google Scholar] [CrossRef] [PubMed]
  105. Zhanwu, G.; Hui, Z.; Jicai, G.; Chunwu, Y.; Chunsheng, M.; Deli, W. Germination responses of Alfalfa (Medicago sativa L.) seeds to various salt-alkaline mixed stress. Afr. J. Agric. Res. 2011, 6, 3793–3803. [Google Scholar]
  106. Ansari, M.; Shekari, F.; Mohammadi, M.H.; Juhos, K.; Végvári, G.; Biró, B. Salt-tolerant plant growth-promoting bacteria enhanced salinity tolerance of salt-tolerant alfalfa (Medicago sativa L.) cultivars at high salinity. Acta Physiol. Plant. 2019, 41, 195. [Google Scholar] [CrossRef]
  107. Alikooyi, M.; Surki, A.; Mobini-Dehkordi, M.; Kiyani, S. Effects of Plant Growth-Promoting Rhizobacteria on Germination and Early Growth of Alfalfa (Medicago sativa) under Salt Stress Conditions. Iran. J. Seed Res. 2020, 6, 1–14. [Google Scholar] [CrossRef]
  108. Cherifi, K.; Boufous, E.H.; Abdelhamid, E.M. Diversity of Salt Tolerance During Germination in Medicago ciliaris (L.) and Medicago polymorpha (L.). Atlas J. Plant Biol. 2017, 1, 6–12. [Google Scholar] [CrossRef]
Figure 1. Sampling locations. The map shows the locations selected for sampling (the numbers refer to the locations listed in Table 1) along the Iberian Peninsula. Location pins in yellow indicate samples collected in gypsic soils; red pins indicate samples collected in saline soils.
Soilsystems 07 00086 g001
Figure 2. Population distribution. The panels with pie charts represent the population distribution (relative abundance) in each sample point (numbers correspond to the one mentioned in Table 1) in gypsum-rich (a) and salt-rich (b) soils. The colors of the pie charts were selected in order to compile closely related species or taxa. Thus, the sector of the pie charts in light blue stands for the group of Peribacillus frigoritolerans, P. simplex and P. muralis; in dark blue, for the group of Bacillus subtilis, B. thuringensis, B. cereus, B. pumilis, and B. toyonensis; in yellow, for the strains identified as Bacillus atrophaeus; in red, for the strains from genus Paenibacillus; in brown, for the strains from the genus Priestia; in green, for the rest of the strains from the family Bacillaceae (B. mojavensis, Niallia nealsonii, N. circulans, B. licheniformis, Metilobacillus idriensis, B. safensis, Bhargavaea beijingensis/cecembensis); in pink, for the strains from the family Pseudomonadaceae (Pseudomonas and Stutzerimonas); in deep red, for the strains from family Micrococcaceae (Arthrobacter and Pseudarthobacter); and in purple, for the rest of the less represented strains (Leclercia, Pseudoclavibacter, Pantoea, Streptomyces, and Rhizobium). Moreover, the unidentified strains are represented in black-colored sectors when they showed fungi or yeast morphology, and in grey for other strains.
Soilsystems 07 00086 g002
Figure 3. Phylogenetic tree. The circular phylogenetic tree shows the proximity of the strains isolated in this study, indicated by branch length. The strains labeled in blue were exclusively isolated from hypersaline soils; the ones labeled in orange, exclusively from hypergypsic soils; meanwhile, the ones labeled in yellow, from both sources. Distances between strains are numerically indicated in the tree branches.
Soilsystems 07 00086 g003
Figure 4. Principal component analysis (PCA). The first two principal components from a principal component analysis using rlog transformed expression values. Principal component analysis (PCA) of strains isolated only in salt-rich soils (blue), only in gypsum-rich soils (yellow), and in both types of samples (orange). The first principal component (PC1, x-axis) explains 30.29% of the variation in the data, while the second principal component (PC2, y-axis) increases total explained variation to 21.39%. A confidence ellipsis at 99% is drawn for each group. Each trait evaluated was represented with a red vector in the graph. Each trait evaluated was represented with a red vector in the graph were ‘N’, corresponding to nitrogen fixation; ‘P’, to phosphorus solubilization; ‘K’, to potassium solubilization; ‘S’, to sulfur oxidizing; ‘Sid’ to siderophores production; ‘biofilm’, to biofilm production ‘ACCd’, to the growth in ACC deaminase medium; ‘B’, to biofilm production; ‘Aux’, to auxins production; and ‘AOx’, to antioxidants production.
Soilsystems 07 00086 g004
Figure 5. Performance of candidate strains under high osmotic conditions. The line graphs represent the growth curves of the candidate strains in regular conditions, and in osmotic stress caused by supplementation of 200 mM of NaCl in the growth medium (a). Likewise, the graph bars represent the performance of the candidate strains under such conditions (white for control, and grey for osmotic stress conditions) for antioxidant-equivalent production in mM (b), nitrogen fixation (in NH3+ equivalents) (c), phosphate solubilization (in PO43− equivalents) (d), potassium solubilization (in K+ equivalents) (e), sulfur oxydation (in SO42− equivalents) (f), production of siderophores (in percent siderophore units, psu) (g), auxin production (in indoleacetic (IAA) equivalents) (h), biofilm production (in optical density (OD) units) (i), and growth in ACC deaminase medium (in OD units) (j). Here, the label ‘A37′ stands for N. circulans A37; ‘A49′, for B. pumilus A49; ‘A70′, for P. frigoritolerans/simplex A70; ‘A46′, for B. licheniformis A46; and ‘A38′, for S. stutzeri A38. The columns in white represent the control treatments; meanwhile, the grey bars represent the osmotic stressing treatment. The asterisks represent a statistically significant difference at p < 0.05 *, p < 0.01, ** p < 0.001, ***, and p < 0.0001, ****; meanwhile, ns stands for sets with no statistical difference with respect to the control. Error bars represent s.d.
Soilsystems 07 00086 g005
Figure 6. Germination and in vitro colonization ratio. The graph bars represent the germination ratio recorded after treatment with the candidate strains in M. sativa (a), M. polymorpha (b) and M. littoralis (c), and the colonization ratio showed by the candidate strains in M. sativa (d) and M. polymorpha (e). Here, the label ‘Mock’ stands for mock treatment; ‘A37’, for N. circulans A37; ‘A49’, for B. pumilus A49; ‘A70’, for P. frigoritolerans/simplex A70; ‘A46’, for B. licheniformis A46; and ‘A38’, for S. stutzeri A38. The columns in white represent the control treatments, meanwhile the grey bars represent the osmotic stressing treatment. The sets of data (n = 25) were compared using a two-ways ANOVA, where the letters indicate same significance level; alternatively, the asterisks represent a statistically significant difference at p < 0.05 *, and p < 0.0001, ****; meanwhile ns stands for sets with no statistical difference respect to the control. Error bars represent s.d.
Soilsystems 07 00086 g006
Figure 7. Phenotype evaluation in full plants. The full plant pictures show the representative phenotype recorded in M. sativa and M. polymorpha after treatment with the candidate strains. Here, the label ‘Mock’ stands for mock treatment; ‘A37’, for N. circulans A37; ‘A49’, for B. pumilus A49; ‘A70’, for P. frigoritolerans/simplex A70; ‘A46’, for B. licheniformis A46; and ‘A38’, for S. stutzeri A38. Moreover, the labels ‘-’ indicate control condition without osmotic stress, and ‘+’, condition with osmotic stress.
Soilsystems 07 00086 g007
Figure 8. Phenotyping quantification. The graph bars represent the root length (a,b), shoot height (c,d), and full-plant dry weight biomass (e,f) recorded in M. sativa and M. polymorpha after treatment with the candidate strains. Here, the label ‘Mock’ stands for mock treatment; ‘A37’, for N. circulans A37; ‘A49’, for B. pumilus A49; ‘A70’, for P. frigoritolerans/simplex A70; ‘A46’, for B. licheniformis A46; and ‘A38’, for S. stutzeri A38. The columns in white represent the control treatments; meanwhile, the grey bars represent the osmotic stressing treatment. The sets of data (n = 25) were compared using a two-way ANOVA, where the asterisks represent a statistically significant difference at p < 0.05 *, p < 0.01, **, p < 0.001 ***, and p < 0.0001, ****; meanwhile, ns stands for sets with no statistical difference with respect to the control. Error bars represent s.d.
Soilsystems 07 00086 g008
Table 1. Sampling locations. Samples were collected in different locations of the Iberian Peninsula, defined by numbers on the map (Figure 1) and their own name (with sample acronym in parenthesis). The locations were situated in Spain (SP) and Portugal (PT). Samples were collected in saline and gypsic soils in a 0–15 cm depth. GPS coordinates (World Geodetic System 1984, WGS84) and altitude (meters above mean sea level, mamsl) are approximated. Geologic context, soil type, and soil variables (pH, electro-conductivity) are determined as factors conditioning the microbiota.
No.TypeNameLocationGPSAltitude (Mamsl)Main Basal Lithology aType of Soil bpH cEC c,d
1GypsumArroyo Salado (AR)La Malahá, Granada (SP)37°06′25.3″ N 3°43′14.7″ W726Dolomites and dolomitic marblesCambic calcisol8.020.31
2GypsumRambla de la Mojonera (RM)Sorbas, Almería (SP)37°05′59.5″ N 2°08′08.7″ W395Sands and gravelsCambic calcisol9.790.06
3GypsumHoya de Baza (HB)Baza, Granada (SP)37°30′50.4″ N 2°45′34.5″ W792Clays with pebblesCalcaric fluvisol8.520.4
4GypsumQuinto (GQ)Quinto, Zaragoza (SP)41°26′51.8″ N 0°32′15.5″ W195Gypsum, marlstones limestonesHaplic calcisol8.460.52
5GypsumZuera (GZ)Zuera, Zaragoza (SP)41°52′56.7″ N 0°47′21.6″ W335Gypsum and claysHaplic gypsisol8.560.18
6SaltSalina de San José (SJ)Torredonjimeno, Jaén (SP)37°45′26.8″ N 4°00′12.1″ W451Marlstones and marly siltstonesCambic calcisol8.662.08
7SaltSalinas de las Escuelas (SE)Baeza, Jaén (SP)37°52′15.9″ N 3°31′18.1″ W479DolomitesCambic calcisol9.582.16
8SaltSalinas de Las Cañadas (SC)Montejícar, Jaén (SP)37°36′31.9″ N 3°30′19.9″ W1028Conglomerates, sandstones, claysCambic calcisol8.642.18
9SaltLaguna Roja (LR)Torrevieja, Alicante (SP)37°59′46.8″ N 0°42′11.8″ W−2SiltstonesCalcaric leptosol9.242.68
10SaltSaladas de Sástago (SB)Bujaraloz, Zaragoza (SP)41°25′15.6″ N 0°11′39.6″ W322Clays and silstonesCalcaric fluvisol8.222.42
11SaltSaladar del Baíco (EB)El Baíco, Granada (SP)37°32′28.5″ N 2°43′57.1″ W711Marls, conglomerates, limestones, sandstonesCambic calcisol8.975.37
12SaltSalinas do Samouco (SS)Alcochete, Setúbal (PT)38°44′11.6″ N 9°00′01.7″ W0Sandstones and conglomeratesEutric regosol6.882.23
13SaltBarranco de las Salinas (BS)Gádor, Almería (SP)37°01′01.9″ N 2°26′51.7″ W263Marls, sandstones and siltstonesCambic calcisol9.381.94
14SaltRambla de Librilla (RL)Librilla, Murcia (SP)37°54′23.7″ N 1°22′15.8″ W205Conglomerates and sandstonesCambic calcisol9.213.78
a Source for “Litology of basement” in Spain (SP): Instituto Geológico y Minero de España (IGME), MAGNA escala 1:50.000 (year of the geological cartography between 1973 and 1992); in Portugal (PT): Carta dos solos do Portugal (1971) escala 1:1.000.000, Secretaria de Estado da Agricultura, Serviço de Reconhecimento e de Ordenamento Agrário; b Source for “Type of soil”: Atlas Nacional de España, Instituto Geográfico Nacional (based on European Soil Data Centre (ESDAC). Eurpean Commission, 2001). ‘Undif.’ abreviation stands for undifferentiated geological context; c, values of samples collected in the 0–10 cm-deep fraction; d, ‘EC’ stands for electric conductivity measurement.
Table 2. Strains collection. This table shows the strains isolated and identified in the 14 locations covered by this study. Some species were isolated in different locations, so each location number where we found them is included here.
Species IsolatedLocation
Rhizobium zeae2
Pseudarthrobacter oxydans1, 6
Arthrobacter globiformis11
Arthrobacter agilis6
Pseudomonas sp.1, 2, 6
Pseudomonas fragi6
Pseudoclavibacter helvolus6, 7, 8
Stutzerimonas stutzeri6, 7, 11
Pantoea agglomerans10
Leclercia adecarboxylata1, 6, 8
Bhargavaea beijingensis/cecembensis14
Streptomyces spiroverticillatus3, 9
Niallia circulans11
Niallia nealsonii11
Bacillus cereus13
Bacillus pumilus9, 11, 13
Bacillus subtilis5, 10
Bacillus thuringiensis/toyonensis2, 14
Bacillus thuringiensis10
Bacillus atrophaeus2, 9, 10, 11, 13, 14
Bacillus mojavensis3, 11
Bacillus safensis9
Bacillus sonorensis13
Bacillus licheniformis2, 9, 11, 13, 14
Peribacillus frigoritolerans/simplex1, 2, 4, 5, 6, 8, 9, 10, 11, 12, 13, 14
Peribacillus muralis6
Paenibacillus amylolyticus2, 14
Paenibacillus taichungensis10,12
Paenibacillus urinalis11
Paenibacillus polymyxa2, 13, 14
Priestia endophytica11
Priestia megaterium12
Priestia flexa11
Metabacillus idriensis2, 14
Disclaimer/Publisher’s Note: The statements, opinions and data contained in all publications are solely those of the individual author(s) and contributor(s) and not of MDPI and/or the editor(s). MDPI and/or the editor(s) disclaim responsibility for any injury to people or property resulting from any ideas, methods, instructions or products referred to in the content.

