Article

Effects of Land Use on Soil Physical-Hydric Attributes in Two Watersheds in the Southern Amazon, Brazil

by
Francielli Aloisio Moratelli
1,
Marco Aurélio Barbosa Alves
2,
Daniela Roberta Borella
1,3,
Aline Kraeski
1,
Frederico Terra de Almeida
1,4,
Cornélio Alberto Zolin
5,
Aaron Kinyu Hoshide
6,7 and
Adilson Pacheco de Souza
1,3,4,*
1
Postgraduate Program in Environmental Sciences, Federal University of Mato Grosso, Sinop 78550-728, Mato Grosso, Brazil
2
Postgraduate Program in Agronomy-Soil Sciences, Federal Rural University of Rio de Janeiro, Seropédica 23897-045, Rio de Janeiro, Brazil
3
Postgraduate Program in Environmental Physics, Federal University of Mato Grosso, Cuiabá 78060-900, Mato Grosso, Brazil
4
Institute of Agrarian and Environmental Sciences, Federal University of Mato Grosso, Avenue Alexandre Ferronato, 1200, Sinop 78550-728, Mato Grosso, Brazil
5
EMBRAPA Agrossilvipastoril, Brazilian Agricultural Research Corporation, Sinop 78550-970, Mato Grosso, Brazil
6
College of Natural Sciences, Forestry and Agriculture, The University of Maine, Orono, ME 04469, USA
7
AgriSciences, Institute of Agrarian and Environmental Sciences, Federal University of Mato Grosso, Sinop 78555-267, Mato Grosso, Brazil
*
Author to whom correspondence should be addressed.
Soil Syst. 2023, 7(4), 103; https://doi.org/10.3390/soilsystems7040103
Submission received: 19 May 2023 / Revised: 2 September 2023 / Accepted: 9 November 2023 / Published: 14 November 2023
(This article belongs to the Special Issue Land Use and Management on Soil Properties and Processes)

Abstract

:
Changes in land use can cause degradation of soil physical quality with negative effects on the environment and agricultural production. The effects of different land uses on soil physical-hydric attributes were studied in the Renato River and Caiabi River watersheds in the southern Brazilian Amazon. Three conditions of land use were evaluated: native forest, crops, and pasture in the headwater, middle, and mouth of each watershed. Particle size, particle density, bulk density, total porosity, macroporosity, microporosity, water contents at field capacity and permanent wilting point, and available water capacity in soil were evaluated in three soil layers down to 0.4 m. Data collected were subjected to the Kruskal–Wallis nonparametric test and Pearson’s correlations. Multivariate analyses were also performed using the principal component method. In the Renato watershed, in comparison with native forest, conventional management of pasture and crops caused soil physical degradation, increasing soil density in the surface layer and reducing macroporosity and total porosity. In the Caiabi watershed, converting native forest areas into pasture and crops altered water quality, influencing the water dynamics in the soil, by reducing soil water conductivity. Soil attributes varied by watershed, with texture variations between the headwater and mouth, indicating that changes in soil properties result from both management and the granulometric composition of the soil in different regions of the same watershed. Adoption of crop and pasture conservation practices can improve soil physical attributes in regions bordering agricultural areas in the southern Amazon.

1. Introduction

The Cerrado-Amazonian ecotone occupies 4.85% of Brazil. This ecotone and the Midwest region of Brazil are among Brazil’s major grain-, fiber-, and beef-producing regions [1]. Here, the conversion of native vegetation into pastures and agricultural areas has been intense in recent decades [2]. Changes in land use and the intensification of agricultural activity can impair natural resources such as soil, water, and biodiversity and are associated with deforestation and the seasonal scarcity of water resources in the Amazon region [3]. Removal of native vegetation can cause high rates of carbon dioxide emissions, loss of biodiversity, erosion, and interruption of hydrological cycles [4,5,6].
In addition to environmental impacts, significant changes in land use/land cover, resulting from the conversion of native vegetation to pasture and agricultural areas, can cause negative impacts on the physical attributes of the soil itself [7,8]. Areas of poorly managed pastures and intensively managed conventional agricultural plantings of monoculture annual crops such as soybean, maize, and cotton may result in compaction and erosion, which can cause soil degradation [9,10,11]. To overcome negative impacts on soil and water resources, it is essential to know the physical-hydric properties of the soil to enable efficient decision-making and agricultural management [12]. In addition to environmental analyses, it is important to consider these soil properties and their possible variations on larger spatial scales, such as in river basins. These areas are sensitive to land use changes and may respond differently to soil and water losses depending on longer time scales and the drainage area [13]. According to Ou et al. [14], understanding variations in soil properties between land uses will help clarify the impacts of human activities on soil quality and health, soil and water conservation, ecological degradation, and environmental restoration, especially in watersheds.
Recent studies have shown that, in general, soil physical and chemical properties are highly affected by changes in land use/land cover (LULC) in watersheds [15,16,17,18,19]. These changes, in turn, play a fundamental role in soil development due to their influence on nutrient cycling, hydrological processes, and soil erosion. Changes in LULC can also influence the ability of the soil to support plants and other organisms as well as the productivity of natural ecosystems or managed agricultural systems [6,15,20].
Therefore, monitoring soil, water, and biodiversity losses in watersheds is essential. Initially, it is necessary to characterize the physical-hydric attributes of the soil, as these are responsible for short-term changes that can compromise the quality of the ecosystem [21]. This allows for a better understanding of the existing relationships in the soil–plant–atmosphere system and to assess soil variability and quality, aeration, hydraulic conductivity, water redistribution, storage capacity, water availability for plants, and root growth [22]. Among the various physical-hydric attributes that can be considered indicators of soil physical quality, due to the simplicity of field sampling and laboratory analyses, we have focused on soil density, particle density, porosity, saturation hydraulic conductivity, and water capacity of available soil water [23,24,25].
There is a need for such measurements in agricultural frontiers such as the state of Mato Grosso, Brazil. Here, the Cerrado and the Amazon biomes are considered global hotspots where grain and beef production have increased through the expansion of agriculture and livestock farming [26,27]. There is a great need for physical diagnoses of soils under different agricultural uses compared to areas of native vegetation (e.g., forests, savannah).
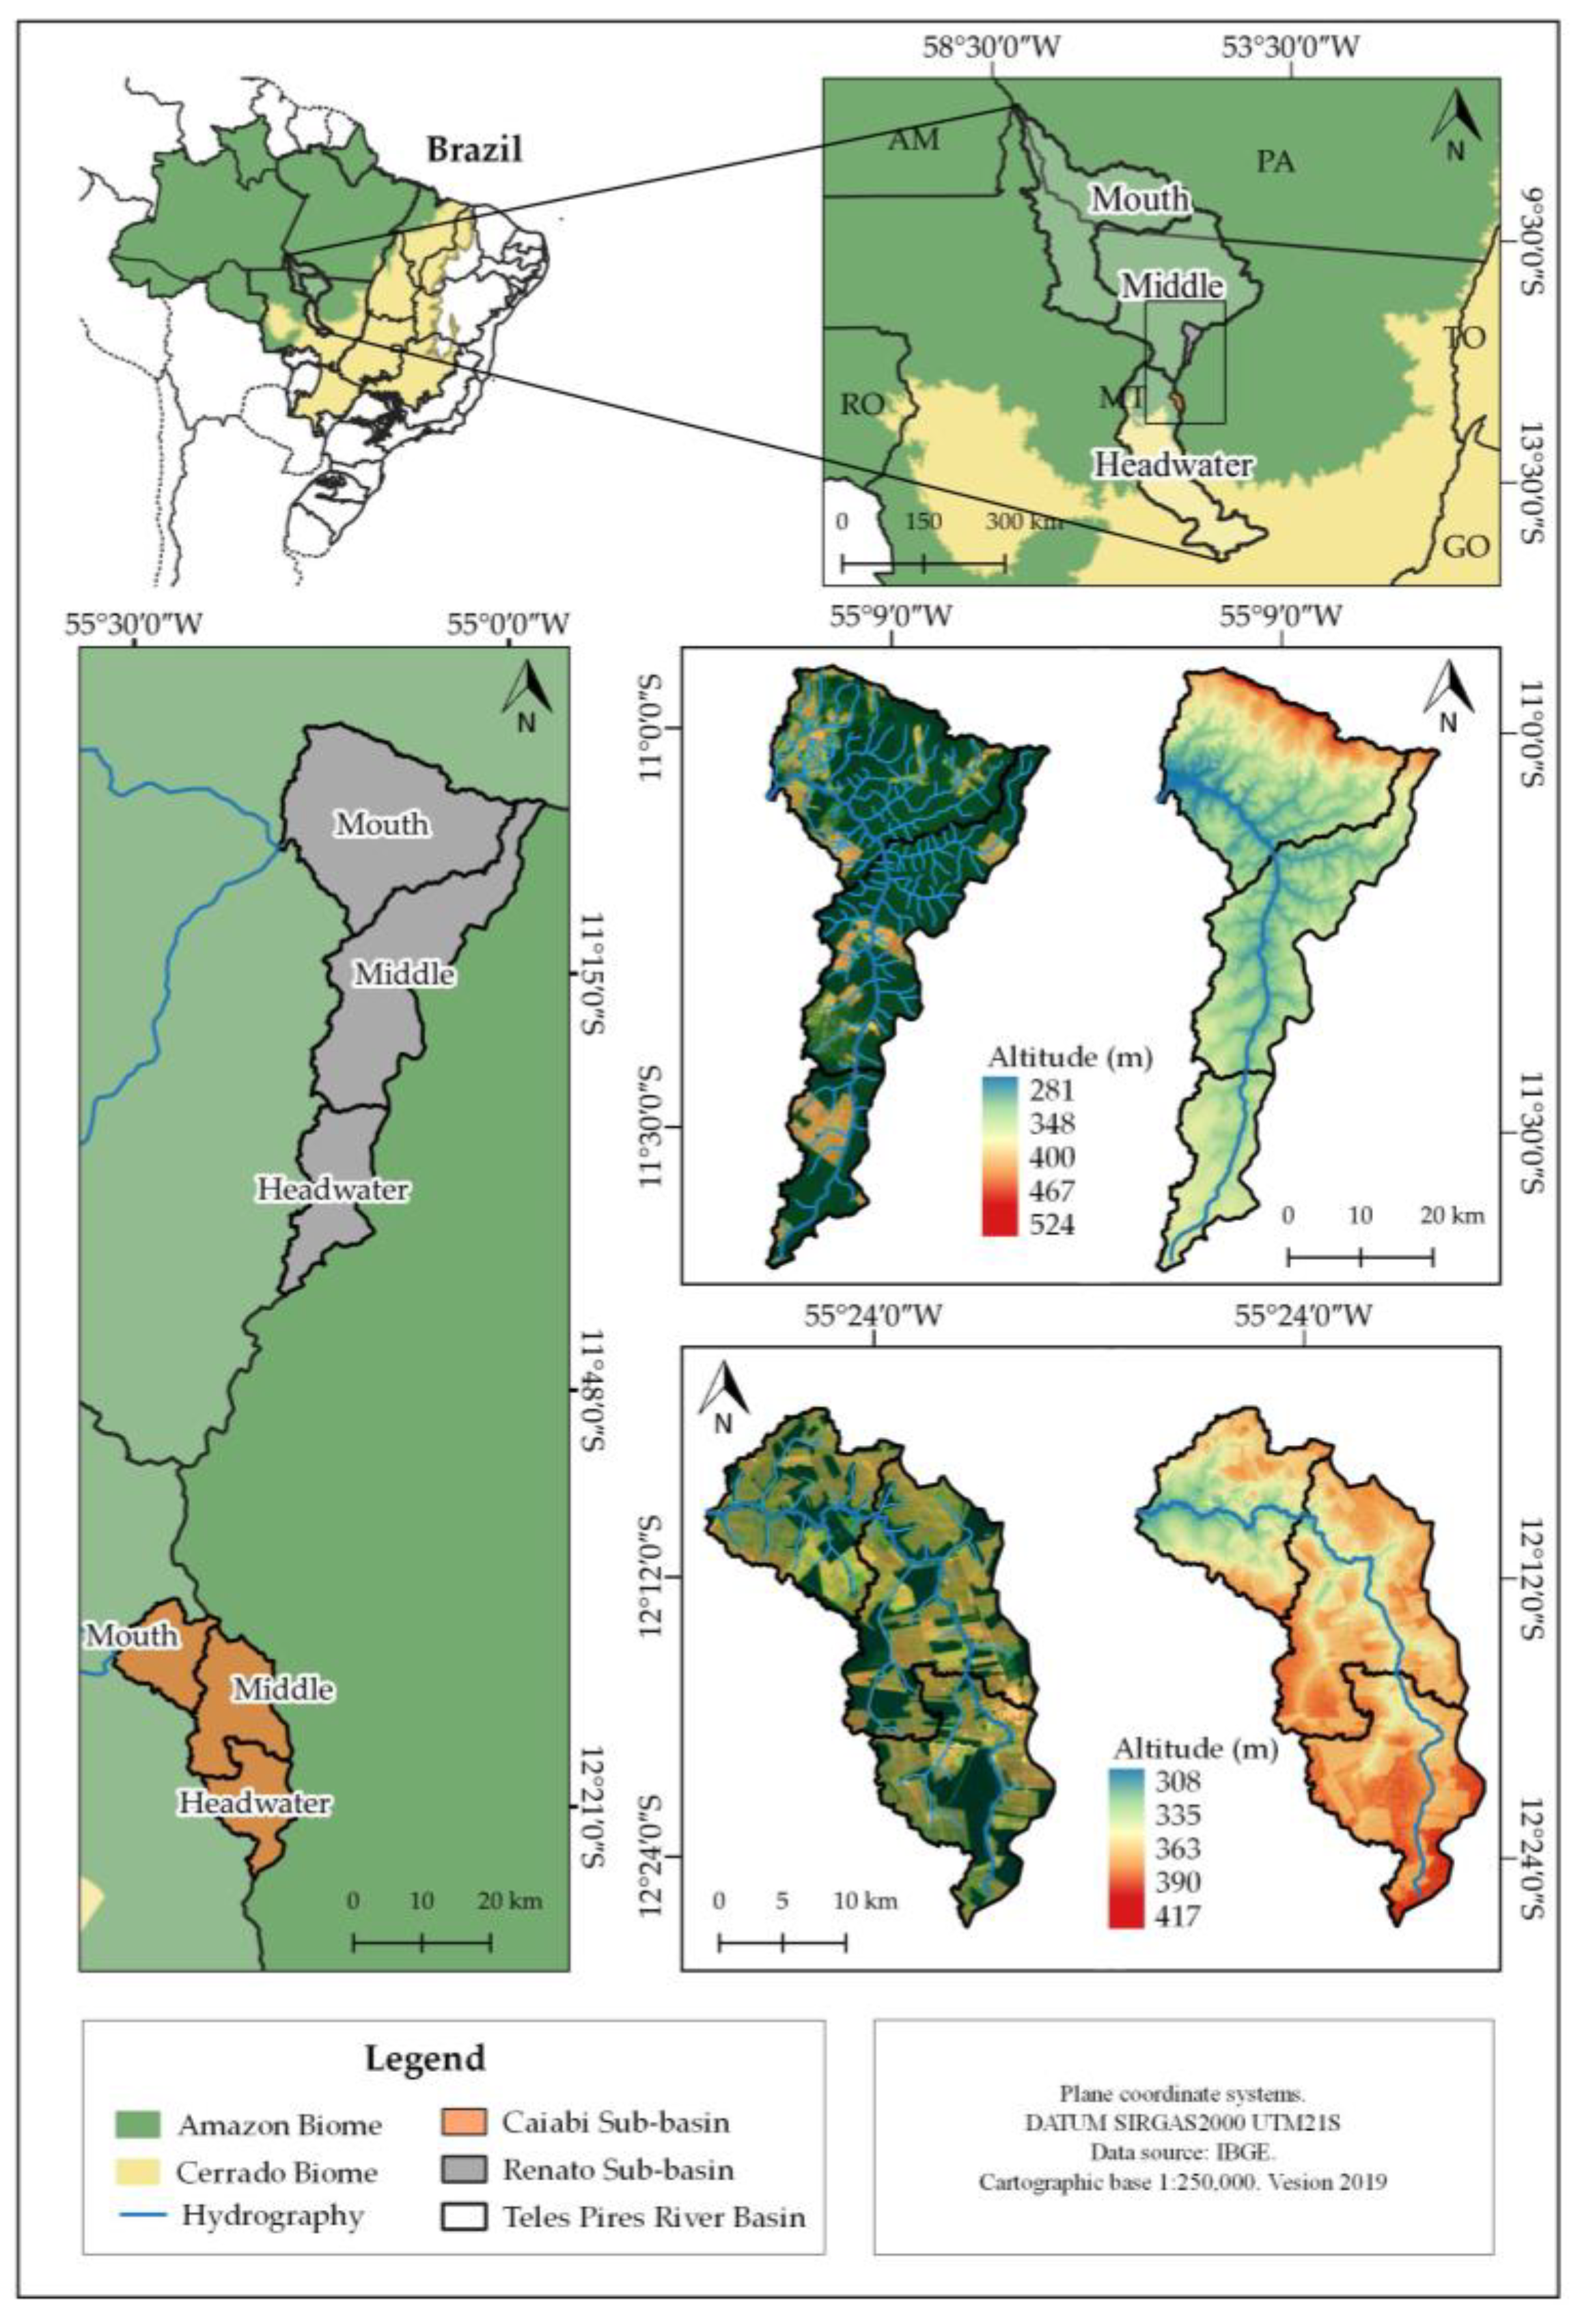
The Renato and Caiabi Rivers are both tributaries of the Teles Pires River in the Southern Amazon region of Brazil. Given the importance of characterizing soil physical attributes to help in better water and soil management and conservation, our goal was to verify if there are variations in soil physical-hydric attributes in two watersheds with different land uses in the Cerrado-Amazonian ecotone region. The specific objectives of this study were to (1) evaluate the effect of land use on soil physical-hydric attributes in different regions of the Renato River and Caiabi River watersheds and to (2) identify the possible relationships between the soil physical-hydric attributes of these soils.

2. Materials and Methods

2.1. Study Areas

This study was conducted in the Renato River and Caiabi River watersheds, located in the Amazon biome and the Cerrado–Amazon transition area, respectively. Both watersheds are located in the Middle-North region of Mato Grosso state in the southern Amazon (Figure 1). These two watersheds have significant regional importance. They are located upstream and downstream of the first regional hydroelectric plant on the Teles Pires River near the city of Sinop, with a flood area of 342 km2. Predominant vegetation and human development differ in these two areas. The Caiabi River watershed area predominantly has monoculture annual crops (soybean–maize succession), while the Renato River watershed has more pastures and native forests. According to Köppen’s classification, the climate of the region is Aw (tropical climate with dry winter), with two well-defined seasons: dry (between May and September) and rainy (October to April), with an average annual temperature of 25.6 °C and annual rainfall of 1934 mm [28].
The Renato River watershed is located between the municipalities of Itaúba and Cláudia, Mato Grosso state, Brazil, between latitudes 11°40′37.60′′ and 10°55′17.84′′ S and longitudes 54°57′2.24″ and 55°18′25.06” W, with minimum and maximum altitudes of 273 meters (m) and 524 m, respectively (Figure 1). The Renato River watershed has an area of 1336.8 km2, an axial length of 65.9 km (km), and a drainage network of 553.5 km. This watershed is located in the Middle region of the Teles Pires River basin in the Amazon biome. The Caiabi River basin is located between the municipalities of Vera and Sinop, in Mato Grosso state, Brazil, between latitudes 12°27′0.18″ and 12°04′44.10′′ S and longitudes 55°16′1.46″ and 55°31′14.40″ W, with altitude ranging from 208 to 417 m. The Caiabi River is a Teles Pires River tributary located in a transition area between the Cerrado savannah and the Amazon Forest (Figure 1). The Caiabi River basin has a drainage area of 489.3 km2, with an axial length of 38.9 km and a drainage network of 155.9 km.
Considering dominant hydro-morphological conditions and relief, the two hydrographic basins were divided into three regions (Figure 2). For the Renato River watershed, the regions are defined as the Headwater, Middle, and Mouth, making up 16.49%, 38.60%, and 44.91% of the area of the watershed at 220.47, 516.01, and 600.28 km2, respectively. In the Caiabi River watershed, these same three regions are 150.9, 196.56, and 141.85 km2 or 30.84%, 40.17%, and 28.99% of the watershed area, respectively.
Field collections in native, tropical forests were carried out in preserved areas of natural vegetation adjacent to crops and pasture, depending on the access routes used (Figure 2). Crop areas were a successive cultivation of soybean and maize from fall 2019 to spring 2020, while permanent pasture areas consisted of Brachiaria brizantha (Palisade signal grass) for cattle grazing. In the two watersheds, soil samples were collected in areas with at least five years of the same land use and in different regions of the watersheds.
The Renato River watershed is occupied predominantly by areas of native forest (69.51%), followed by pasture (15.94%) and crops (13.41%). About 65% of the area of the Caiabi River watershed is crops and pastures, with the rest occupied by forests and urban areas. Soil collections were performed under land use conditions that best represented the forms of land use in both watersheds (Table 1).
According to the Brazilian Soil Classification System [30,31], the Renato River watershed has most soils classified as Latossolo Vermelho distrófico (LVd) [Oxisol] and Latossolo Vermelho Amarelo distrófico (LVAd). Some regions in the headwater and the mouth of the Renato River basin have flat to strongly undulating relief (0% to 29% slope). The predominant soil in the Caiabi River watershed is also Latossolo Vermelho-Amarelo distrófico (LVAd), with mainly flat to wavy relief (0% to 15% slope). According to USDA-NRCS (2014) [32], this soil is classified as a Typic Hapludox.

2.2. Soil Sampling and Laboratory Analysis

Soil samples were collected between November 2019 and May 2020, with sampling points distributed in the three regions of each watershed (Figure 2) at depths of 0 to 0.1 m, 0.1 to 0.2 m, and 0.2 to 0.4 m. The collections were carried out in areas occupied by native forests, pastures and crops in both watersheds. Due to the large number of samples, the collections occurred with different crops. In the Caiabi River watershed, the collections occurred with the soybean crop between the stages of vegetative development V4 to V8 (0.35 to 0.50 m height). In the Renato River watershed, the crop areas were maize in the vegetative phase (between 8 and 10 leaves) and height varying from 0.60 to 1.0 m. In the Renato River area, samples were collected at 27 points, with 9 points for each watershed region and 3 points for each land use class (in each basin region). In the Caiabi River watershed, samples were collected at 18 points, with 6 points for each watershed region and 2 points per land use class in each region.
To determine the soil bulk density and soil porosity, undisturbed soil samples were collected in the center of the soil layers, in volumetric rings of approximate diameter and height of 0.05 × 0.05 m, equivalent to around 0.0000982 cubic meters (m3). To determine the hydraulic conductivity of the saturated soil (Ksat), the undisturbed samples were collected in volumetric rings with approximate dimensions of 0.07 × 0.07 m (diameter and height) equivalent to around 0.000269 m3. Regardless of the size of the sampling ring, each ring was identified and its dimensions were obtained with a digital caliper with a resolution of 0.001, to obtain its specific volume. Deformed and homogeneous soil samples weighing around 3.0 kg were collected to determine other physical-hydric attributes.
In both watersheds, all replicated soil samples were collected in trenches spaced a maximum of 30 m apart. Each replicate had five samples. The Renato River had 3 watershed regions, 3 soil depths, 3 land use classes, and 3 replications (5 samples each) = 405 samples (135 samples per watershed region; 45 samples per land use class and watershed region). For the Caiabi River, sampling was different due to the logistics and unavailability of access in some areas. Here, there were 3 watershed regions, 3 soil depths, 3 land use classes, and 2 replications (5 samples each) = 270 samples (90 samples per watershed region; 30 samples per land use class and watershed region). Samples were collected using each ring size mentioned above. As for the deformed samples (homogenized soil), the following were collected: (i) for the Renato River: 27 points × 3 depths × 3 repetitions = 243 samples and (ii) for the Caiabi River: 27 points × 3 depths × 2 repetitions = 162 samples.
The analyses of the physical attributes of soil samples followed the methodology described by Embrapa [33]. The undisturbed samples were saturated for 24 h and placed on a tension table set at −0.01 MPa until water was drained from the macropores. Microporosity was measured as volumetric moisture at field capacity. Total porosity was determined using the indirect method, relating bulk and particle densities. Macroporosity was measured as the difference between total porosity and microporosity. Bulk density was measured as the ratio between the soil mass dried at 105 °C and the volume sampled with the volumetric ring [33].
Disturbed soil samples were air dried and passed through a 2 mm mesh sieve to determine particle size and water content at the permanent wilting point. Particle size was obtained via the pipette method, with 1 mol liter−1 sodium hydroxide (NaOH) solution used as the dispersing agent and shaken for 16 h at 50 rpm. Particle size was obtained with the volumetric flask method [33]. At the same time, the permanent wilting point was measured using samples of air-dried fine earth placed in PVC cylinders, saturated with water, and put into Richards’ pressure chamber with a tension of −1.5 MPa. Available water capacity in the soil (AWC), defined as the soil water content at field capacity (FC) and the soil water content at the permanent wilting point (PWP), both measured in m3 m−3, was calculated using
A W C = i = i n ( F C i P W P i ) × B d × z i
where FC and PWP are field capacity and permanent wilting point (m3 m−3), Bd is bulk density (kg m−3), z is the soil depth (mm), and n is the number of soil layers.
The undisturbed soil samples were collected in the 0.07 × 0.07 m volumetric rings and were saturated for 24 h. The saturated hydraulic conductivity (Ksat) measured in millimeters per hour was determined in the laboratory, based on Darcy’s Law, in a constant load permeameter [26], with values calculated using
Ksat = (V × L)/(A × H × t)
where V is percolate volume (cm3), which is the value of the last reading when there is no variation between the previous values, or the average of the two readings when there is some variation. Here, L is the height of the block from the ground (cm), H is the height of the soil block and water column (cm), A is the area of the cylinder (cm2), and t is the percolation time (h). The collections of the volume of water percolated in the sample were obtained across time intervals of 10 min, during a period of 1 h.
The pipette method was used for soil texture analysis with 1 mol L−1 sodium hydroxide solution (NaOH) used as a dispersing agent during slow agitation (50 rpm) for 16 h. The particle density was calculated using the volumetric flask method. The soil density was measured using the volumetric ring method, which estimates this as the ratio of the soil mass dried in an oven at 105 °C over the volume of the cylinder [33].

2.3. Statistical Analysis

The data were subjected to the Kruskal–Wallis nonparametric test at a 5% probability level, using Statistica software version 6.0 [34]. The variables studied were also subjected to Pearson’s correlation analysis and multivariate principal component analysis (PCA). The multivariate PCA of soil physical attributes was performed after standardizing the original values with mean equal to 0 and variance equal to 1 [35]. The number of components was selected based on eigenvalues above one and an accumulated variance above 70% [36]. Thus, using PCA, it was possible to verify the relationships between soil attributes and which attributes were more influential in contributing to the variability of the results from this study.
Principal component analysis is a multivariate technique for modeling the covariance structure, which linearly transforms a set of original variables, initially correlated with each other, into a substantially smaller set of uncorrelated variables that contain most of the information in the original set. This technique is associated with reducing the mass of data, generating a set of variables of the same dimension called principal components. The principal components have important properties. Each principal component is a linear combination of all the original variables. They are independent of each other and estimated to retain, in order of estimation, the maximum amount of information in terms of the total variation contained in the data [36].

3. Results

3.1. Renato River Watershed

The three regions of the Renato River watershed have distinct particle sizes (Table 2) due to the different textures along the basin, where sandy clay loam soils are found in the headwater region, loamy sand is found in the middle region, and sandy loam is found at the river’s mouth. Smaller particle sizes were observed in the soil surface layer (0 to 0.1 m) (Table 3), which contains higher organic matter content and lower mineral fractions [37]. The Renato River basin region also had lower values for soil particle size in the headwater region (2.47 to 2.62 metric tons or Mg m−3), regardless of land use. During sampling, higher root contents and dark color were observed in the soils in the headwater region, even in soils already converted to crops and pasture. On the other hand, in the middle and mouth of the river basin, there may have been greater deposition of heavy minerals such as quartz as both colluvium and alluvium [37], leading to higher particle densities (2.67 to 2.77 Mg m−3). Soils with higher clay content tend to retain more carbon due to forming more stable aggregates [38].
Soil bulk density did not differ significantly by land use in the headwater region. However, for the surface and intermediate layers (0 to 0.1 m and 0.1 to 0.2 m) in the middle and mouth regions of the Renato River for both pasture and crops, there was an increase in bulk density compared to native forest (Table 3). Soil bulk density (BD) values ranged from 1.05 Mg m−3 at the headwater to 1.62 Mg m−3 at the mouth. BD values were similar to those observed by Lange et al. (2019) [39] at 1.2 to 1.6 Mg m−3, who evaluated soil cultivated with pasture for 10 and 20 years without corrections and forest areas in the Amazon region. These researchers found an increase in BD in the surface layer during the conversion of native forest to pasture. The lowest BD values were observed in the headwater region, which has higher clay content compared to the middle and mouth regions, which have sandy soils.
Macroporosity varied between 0.09 and 0.28 m3 m−3 and, in general, the highest volumes of macropores were found in areas of native forest, differing significantly from crops and pasture in the headwater, and in the surface layer of the middle and mouth regions (Table 4). Considering plant development has been associated with a minimum microporosity of 0.1 m3 m−3 [40], the soils of the river basin have good aeration conditions, except for the surface layer of the pasture at the mouth of the Renato River. Under conditions below this limit of 0.1 m3 m−3, oxygen diffusion can be negatively impacted for root development.
Microporosity occupies a high percentage of the porous space of soils (22% to 47%) (Table 4). In the headwater region, higher microporosity was observed during the conversion of native forest to crops at all depths and for pasture, in the deepest layer. At the Renato River’s mouth, there was a higher volume of micropores in the surface layer, corroborating the findings of Azevedo and Sverzuto (2007) [41]. When evaluating physical and chemical attributes of the soil in pasture in southwestern Mato Grosso state, these researchers observed higher microporosity values in pasture areas compared with native forests.
The results of the ANOVA using the non-parametric Kruskal–Wallis test comparing means at 5% probability for saturated hydraulic conductivity (Ksat) showed significant differences for values based on soil depth, land use, and for the Renato watershed region (Table 5). The highest values were observed in native forest areas, regardless of soil depth. This suggests that pasture and crops reduce water movement in the soil after conversion from forests. For soil water property analyses, Freire et al. (2003) [42] classified Ksat (cm hour−1) as very slow: <1.25; slow: 1.25–5; moderately slow: 5–20; moderate: 20–62.5; moderately fast: 62.5–125; fast: 125–250; and very fast: >250. In this case, the Ksat values obtained in areas with native forest were classified as “moderate or moderately fast”, whereas Ksat ranged from “moderate” to “slow” in areas occupied with crops and pasture.
Soils occupied with native forests have a higher incidence of macropores on the surface, as well as the presence of large and thin roots. This condition indicates Ksat because it presents great variability in Amazonian soils. However, collecting samples in large cylinders or direct field determination minimizes the negative influences that small samples exert in determining this parameter. In this work, we found Ksat ranging from 19.84 to 75.12 cm h−1, which is consistent with higher values in the surface layers of soils in native forests. Other researchers also found high Ksat values in Amazonian soils with native vegetation (forests) at different levels of anthropization [43,44,45], thus corroborating the results obtained in the present study. In addition, the results from areas with crops and pastures, for the types of soils in these two watersheds, were also corroborated by results from Gupta et al. (2021) [46] and Ferreira et al. (2022) [47].
The volumetric moisture contents at the permanent wilting point (PWP) and field capacity (FC) were also related to clay and sand contents along the Renato River basin (Table 6). Regardless of the tension, the highest levels of volumetric moisture were obtained in the headwater region, due to higher clay and microporosity contents. The available water capacity in the soil in the 0 to 0.4 m profile ranged from 58.81 to 109.33 mm (Figure 3). The soil’s physical-hydric behavior depends on its structure and a better pore diameter distribution [48]. The decreased available water content is related to reduced FC and increased PWP [49]. In studies with clay soil textures, Rosa et al. (2020) [50] and Souza et al. (2020) [51] observed higher values of FC and PWP, ranging from 0.20 to 0.36 m3 m−3 and from 0.35 to 0.50 m3 m−3, respectively.

3.2. Caiabi River Watershed

Using granulometry and the Embrapa simplified method [33], the soils in the three regions and at the three evaluated depths were classified as clayey loam texture soils for the headwater and middle regions, and loam textured soils at the Caiabi River’s mouth with higher sand content (Table 7). The lowest soil particle density averages were observed in the spring region and the surface layers of the soil (Table 8). There was a significant increase in soil density in areas with crops and pasture. In the surface soil layer for crops, soil density increased by 15% to 33% compared to native forest (Table 3). This was also observed in the same soil layer for pasture, where soil density was 18% to 31% higher compared to native forest. Higher soil density values were observed in the region at the mouth of the watershed.
The highest soil macroporosity was observed in native forests for all watershed depths and regions (Table 9). Soil microporosity ranged from 0.30 to 0.49 m3 m−3 in the headwater region, from 0.28 to 0.44 m3 m−3 in the middle region, and from 0.20 to 0.34 m3 m−3 at the mouth of the Caiabi River. The highest microporosity values were observed in pasture and crops, which also coincided with the lowest macroporosity. Soils in the native forest showed higher total porosity, differing significantly from crops and pasture, except for the 0.2 to 0.4 m soil layer in the headwater and mouth regions, where native forest did not differ significantly from pasture. The lowest total porosity values in the pasture were observed at the watershed’s mouth.
Soil saturated hydraulic conductivity (Ksat) was significantly higher for native forests when compared to other land uses (Table 10). The basin regions only differ significantly for soils in native forests. In the central region of the watershed, higher values of hydraulic conductivity were observed for native forests (98.71 cm h−1). Using the classification proposed by Freire et al. (2003) [42], Ksat values for native forests are between moderate and fast, while in areas occupied with crops and pasture, Ksat ranges from slow to moderately slow. These Ksat values represent the most critical areas for agricultural management of crops and are associated with soil compaction. The basin area is characterized predominantly by low hydraulic conductivity, with few dispersed samples with high values. Soil textural class and agricultural cultivation can also contribute to high soil heterogeneity [50,51].
Furthermore, soil management also influences natural soil heterogeneity, promoting variations in organic material accumulation, water movement, compaction, and water erosion. The value of Ksat can vary according to the use of soil as follows: native forested areas > no-tillage > conventional tillage [52]. However, there is a consensus that undisturbed soil sampling over time also affects Ksat variability, which may explain differences in Ksat compared to other research in soils with similar textures [45].
The lowest values for volumetric moisture at the permanent wilting point (θPMP) were observed for native forests at all soil depths in the middle region and in the surface layer in the headwater of the hydrographic basin. The lowest θPMP was observed at the mouth of pasture and native forest for the two shallowest soil layers (Table 11). Higher volumetric moisture levels at field capacity (θCC) were observed for pasture for all soil depths at the source, and under crops and pasture in the surface layer at the Caiabi River watershed’s middle and mouth. These differed significantly from native forests, except for the crops’ surface layer at the mouth, where native forest did not differ from pasture. Generally, the lowest field capacities were observed at the mouth of the basin and for the soil under the pasture. The three regions differed significantly for the intermediate and deepest soil layers. The land uses of crops and native forests did not show significant differences in the available soil water capacity (AWC). Still, AWC was significantly lower for pasture at the headwater and mouth (Figure 4). In the middle region, there was no significant difference between land uses.

3.3. Pearson’s Correlations

Pearson’s correlation analysis between soil physical attributes for different depths is presented in Table 12. The correlations between soil attributes occurred similarly for all depths, except for the intermediate and deeper soil layers. In these deeper soil layers, there were higher correlations for available water capacity for the Renato and Caiabi River watersheds. Highlights can be considered the high correlations between the soil structure fractions (sand, silt, and clay) and the attributes of field capacity, permanent wilting point, and total porosity in the Renato River watershed, regardless of the evaluated depth. Another important highlight is the absence or low significant correlations between saturated hydraulic conductivity and the other physical-hydric attributes evaluated in the soils, regardless of the hydrographic basin and the evaluated soil depth.

3.4. Principal Components Analysis

The two-component analysis effectively represents the mean grouping of 12 soil physical attributes with accumulated variance greater than 75%. This is regardless of the hydrographic basin and the soil layer evaluated (Figure 5). Only the principal component PC1 represents nine soil physical attributes in this case.
For the Renato River watershed, the PCA for the surface soil layer had three factors extracted, explaining 87.43% of the total variability of the data (Table 13). In the 0.0 to 0.10 m depth, the first principal component, PC1, retained 58.73% of the explained variance. It was positively correlated with microporosity, total porosity, permanent wilting point, field capacity, and clay and silt contents, while being negatively correlated with particle density, bulk density, and sand content.
The second principal component, PC2, retained 19.3% of the data variability and was negatively correlated with microporosity and Ksat. This component represented the attributes most susceptible to soil compaction processes in managed agricultural systems. Regardless of the evaluated depth, PC4 accounted for up to 6.61% of the total variance, and PC3 represented all 12 attributes.
Figure 5 represents the distribution of variables in the principal component analysis. The arrangement of soil attributes was similar at all depths, with available water capacity and microporosity being in opposite positions relative to microporosity, reinforcing the high negative correlation between these factors. Macropores are responsible for soil aeration and significantly affect water flow and solutes, while smaller pores encourage retention [53]. Thus, the storage and redistribution of water are associated with the porous space of the soil and the size distribution of its pores, which, in turn, are directly influenced by soil texture and structure [54].
Similarly, in the Caiabi River watershed for PCA, using only three components accounts for more than 80% of the accumulated variance for the 12 evaluated soil attributes (Table 14). This is also represented in the biplots in Figure 6. They show that for the watershed and the twelve evaluated attributes, using two PCA factors reduces the dimensionality of the original variables with a loss of explanation of less than 25%. In the top soil layer, PC1 is positively correlated with the other eight soil attributes and PC2 is correlated with attributes linked to soil texture. PC3 presents a significant, positive correlation for Ksat in the superficial soil layers. Furthermore, in the layer 0.20 to 0.40 m, PD presents a correlation of 0.8415 with PC4 (which has an Eigenvalue of 0.8873 and represents 7.3939% of the attributes). Considering PC4 in this soil depth, it accumulates 95.61% of the total variance of the evaluated attributes.

4. Discussion

Previous studies in both watersheds [11,23] generated a spatialized database of soil attributes at different sampling points and with different objectives than the present study. In general, the sand fraction increased from the headwater to the middle region, followed by the mouth in both watersheds, with a consequent reduction in the clay fraction. The highest concentrations of clay and silt were observed in the headwater region, in soil with sandy clay loam texture. According to Rizzardi et al. (2014) [55], soil texture influences soil physical-hydric behavior. Therefore, its evaluation is of great importance for using and managing agricultural soils. Sandy soils have higher macroporosity and lower total porosity, facilitating water movement. Meanwhile, clay soils have higher microporosity and total porosity, allowing for better water retention in the soil [56].
Characterization of the particle size composition of soils in different regions of the watersheds is still important, especially in biomes and transitions with high potential for converting native forests to crops/pastures. In both watersheds’ middle and mouth regions, soils are typically more fragile from an environmental point of view for agricultural use. Therefore, it is necessary to use conservation practices [57].
In pasture areas at the mouth of the basin, animal trampling caused changes in soil physical quality, with increased bulk density and consequent reduction in macroporosity. This compromises water infiltration into the soil, which can favor surface runoff, change the natural characteristics of soil drainage, and cause erosion [58,59]. When evaluating the soil attributes of a Latossolo (Oxisol) under different uses in the Amazon rainforest, Valladares et al. (2011) [60] observed that in pasture areas, animal trampling caused an increase in bulk density and a reduction in macropore volume. Polanía-Hincapié et al. (2021) [61] obtained similar results, with a decrease in macroporosity in pasture areas compared to the native vegetation of the Bolivian Amazon. Therefore, reducing macroporosity can lead to poor drainage, low root aeration, and soil degradation [62].
The macroporosity in the middle region of watersheds increased due to increased sand content. In general, soils with higher sand content are more porous with greater macroporosity when compared to soils with higher clay content. In both watersheds’ middle and mouth regions, microporosity values ranged from 0.20 to 0.32 m3 m−3, below 0.33 m3 m−3, which Lima et al. (2007) considered to be an ideal minimum value [63]. However, as the soils of the river basin regions have different textures (Table 2 and Table 7), being loamy sand and sandy loam for the middle and mouth regions, respectively, low microporosity values are explained by the high concentrations of sand. Microporosity is highly influenced by texture since soils with higher clay contents favor greater microporosity due to the micro aggregates of clay particles, while sandy soils, having larger particles, show a porous space consisting of pores of larger diameters (macropores), and thus also have lower total porosity [64].
The effect of land use on total porosity was observed only in the surface layer of the middle and mouth regions of the Renato River, with higher values in the areas with native forest than for either crops or pasture. The total porosity of 0.50 m3 m−3 is ideal for well-structured soil with satisfactory physical conditions for plant development [63]. However, lower values were observed for crops and pasture for the middle and mouth watershed regions. Production systems associated with intense soil management reduce total porosity (TP) compared to native vegetation areas [9]. Lower TP can reduce the capacity of soils to provide ecosystem services, compromising water resources and limiting agricultural production [6]. On the other hand, the highest values of TP for crop and pasture areas were observed in the headwater regions, which is consistent with the highest clay contents (Table 2 and Table 7). Soil TP is mainly related to soil structure and texture, and sandier soils tend to have higher macroporosity, while clay soils tend to have higher microporosity and TP [65].
Reichert et al. (2003) [65] established critical limits for bulk density (BD) of 1.55 and 1.65 Mg m−3 for soils with medium texture (20% to 55% clay) and sandy texture (<20% clay), respectively. Values higher than these can restrict root development. Although BD did not show values above the critical limit, BD in the surface layer increased by up to 20% in crop areas in the middle region and 27% and 37% for pasture and crops, respectively, in the mouth region compared to native forests. This effect may be associated with reduced macroporosity caused by animal grazing and intensive use of agricultural machinery, which can cause compaction [66,67]. Poorly managed pasture and crop areas can induce soil compaction and surface sealing (especially in clay soils), resulting in low water infiltration and increased surface runoff. Accelerated erosion can increase soil losses, organic matter, and nutrients. This can also cause silting of river and stream beds, compromising local biodiversity [61,67].
Although land use and occupation affect bulk density, this attribute is also related to texture and organic matter content [68]. Soils under native vegetation, as they were not subjected to machine traffic and animal trampling, generally had higher macroporosity values and lower bulk density values [68]. The best soil physical conditions in native forest areas are promoted by the increase in organic matter from the decomposition of leaves, branches, and roots, which, in turn, causes a reduction in bulk density due to better structuring of the soil and formation of biopores by edaphic macrofauna [69,70].
Permanent wiling point (PWP) values were homogeneous across land use, regardless of watershed region, except for the surface layer of the headwater, where the PWP was higher for crops. According to Jin et al. (2018) [71], the PWP is an important soil hydraulic attribute for agricultural production and has been widely used in determining water availability. However, the amount of water at the PWP is seldom influenced by management and is fundamentally determined by clay content [72].
Field capacity values ranged from 0.22 to 0.47 m3 m−3, with lower values in both watersheds’ middle and mouth regions. These were influenced by variations in sand concentration. An inverse relationship was observed in the behavior of field capacity in crops and pasture when compared with native forests in the headwater and mouth regions. According to Reynolds et al. (2002) [72], the water content at field capacity is determined by the complex relationship between clay, bulk density, and organic matter, attributes that soil management alters.
There was a significant increase in available water capacity for crops (109.33 mm), followed by pasture (91.86 mm), in the headwater region of the Renato River watershed. These values may be related to the higher organic matter content under these land uses in this region, being consistent with lower particle density, bulk density similar to that found in native forest, and the occurrence of higher soil microporosity in this region, which may have contributed to improved water storage in the soil promoted by crops and pasture in this region. Cruz et al. (2014) [73] observed that the conversion of native forests to fertilized pastures led to an increase in soil organic matter, which favored better available water capacity (AWC). When evaluating soil water retention in two types of Latossolo (Oxisol) under different uses, Beutler et al. (2022) [74] observed that microporosity and greater aggregation are the main factors that influence AWC because they allow greater infiltration and retention of water in the soil.
In the Renato River watershed, in the top soil layer, AWC was positively correlated with microporosity and negatively correlated with macroporosity. Andrade et al. (2020) [75] observed a better correlation of microporosity with AWC. Thus, soils with a predominance of micropores tend to store more water [76]. On the other hand, in the two deeper soil layers between 0.1 and 0.4 m, in addition to the correlations observed in the surface layer, AWC was also directly correlated with total porosity, PWP, and clay and inversely correlated with bulk density (BD) and sand content. According to Costa et al. (2016) [77], water storage in the soil is influenced by its texture, structure, pore distribution, and soil management. Thus, inadequate management that increases BD from soil compaction causes porous space to decrease, reducing the potential for water storage in the soil.
PWP was positively correlated with field capacity, microporosity, total porosity, clay, and silt and negatively correlated with sand content and BD. The same correlations were observed for field capacity (FC), negatively correlated with macroporosity and positively correlated with AWC. Similar results were observed by Ghanbarian-Alavijeh and Millán (2009) [78], who reported a positive correlation between clay and PWP. Andrade et al. (2020) [75] observed a correlation between clay and BD in the variability of FC. Kirkham (2014) [79] found that variations in water retention at FC and PWP are explained by soil texture and compaction.
Higher values of BD influence the quantity and size of pores, given the very strong negative correlation between microporosity and total porosity (TP). These correlations are justifiable since TP is inversely related to BD, and soil compaction reduces pore volume and increases BD [80]. In addition, BD was negatively correlated with clay and positively correlated with sand content, thus justifying the highest values of BD in the middle and mouth regions of watersheds, which had sandy texture (<20% clay). Similar results were also observed by Tanveera et al. (2016) [81], who found that sand content was positively correlated with BD, while clay content and TP were negatively correlated with BD.
Regarding soil texture, silt and clay contents are strongly associated with PWP. Anaba et al. (2020) [76] observed that the relationship between the physical-hydric attributes could explain this behavior since the finer fractions (silt and clay) of the soil have greater participation in water retention at high potentials due to larger specific surfaces. Other soil attributes, such as BD and particle density (PD), were also related to particle size fractions, mainly associated with sand content. BD and PD are directly related to soil texture and organic matter, which, in turn, depend on minerals related to the origin of the soil. In this case, minerals such as quartz and feldspars in the sand are denser than clay minerals [82]. However, in addition to mineralogy, management influences BD, unlike PD.
Studies conducted by Rocha Junior et al. (2020) [83] corroborate the results obtained in this study. When evaluating the physical and chemical attributes of a Latossolo Vermelho-Amarelo (Oxisol) under different uses and landscapes, these researchers observed that the conversion of forest to coffee cultivation and pasture areas reduced soil quality, decreasing the capacity of these areas to provide ecosystem services. In this context, better soil physical conditions in areas of forest or native vegetation may be associated with the absence of agricultural activities, such as tillage and exposure of the soil, which can accelerate erosion [84].
In a common scientific sense, the distribution of soil attributes in different watershed regions is influenced by several factors, such as climate, geomorphology, and vegetation cover. Generally, the source region, usually located in mountainous or hilly areas (steep terrain) that generate rapid water flows and sedimentation, is expected to be relatively weak, resulting in the predominance of sandy soils. The soil in the upstream region can be rich in minerals such as quartz and feldspar, which are eroded and transported downstream by long-term hydraulic action. In the intermediate regions of watersheds, reliefs are normally gently undulating and the slower flow of water leads to sedimentation, resulting in greater amounts of silt and clay in the soil. In turn, the river mouth regions are found in plains or estuarine areas, with relatively flat terrain, and the slower flow of water in this region increases sedimentation, leading to the prevalence of clayey soils. The soil in the downstream area contains a higher concentration of clay particles due to the slower flow of water, causing suspended particles to settle more easily. However, we emphasize that in the two hydrographic basins studied, there is an inversion of this common knowledge, with a predominance of more clayey and more sandy areas in the regions of headwaters and the mouth, respectively. In this case, there is a mineralogical dependence on the formation of regional soils [30], which, associated with low variations in relief, indicate proportionality of water flows with the increase in drainage area, not entailing significant differences between the concentrations of sediments in suspension transported between source and mouth [85]. We also highlight that in the case of the Renato River, the regions with higher altitudes (Figure 1) in the north of the watershed currently do not contribute directly to the river since the Colider hydroelectric power plant (on the river Teles Pires) has caused the region at the mouth of the Renato River to remain permanently flooded since 2015.
The main causes of erosive processes are intrinsically related to changes in land use, especially following the conversion of native forests to poorly managed pastures and resulting from poorly conducted tillage of agricultural soils, which causes compaction and hinders the natural dynamics of water in the soil, promoting surface runoff and increasing soil susceptibility to erosion [86]. Therefore, evaluating the physical-hydric quality of the soil is important to assess the potential of its use to ensure both food productivity as well as the sustainability of agroecosystems. Physical-hydric surveys are necessary to provide information on soil management, ensure decision-making for better use of this resource [86,87], and maintain water quality and sustainability in river basins [88]. Changes in land use can alter ecosystem services provided by the soil. Land use change should be carried out cautiously, respecting current legislation, especially in cases such as that of the Renato River watershed, which still has areas mostly occupied by native Amazonian forests.
This study contributes valuable information about the impact of changes in land use on soil properties in the southern Amazon region. However, it is emphasized that changes in soil properties depend on complex processes, which require a longer observation period to capture broader trends and variations. In this context, recognizing the limitations resulting from the short-term nature of the study, we emphasize that this study presents a characterization of the physical and water properties in the same hydrological year, aiming to minimize the effects of seasonal variations in temperature and precipitation. Furthermore, we recommend the development of long-term investigations based on the attributes that showed significant differences and that are considered more representative of the effects of changes in land use (BD, TP, AWC, and Ksat), for evaluation of the influences of seasonal variations on the physical-hydric behavior of soils in the region.

5. Conclusions

Physical attributes of the soil show spatial variability along the Renato River and Caiabi River watersheds. These alterations result from the conversion of native forests to pastures and crops. Areas occupied with native forests have better physical soil conditions. Conventional crops and pastures promote an increase in bulk density and, consequently, a reduction in macroporosity and total porosity in the downstream regions of watersheds. Agricultural land use involving crops and pasture in areas with higher clay content in river basins tends to increase the volume of micropores, resulting in increased available water capacity of the soil. It is necessary to implement conservation systems of agricultural production that contribute to increased productivity of crops and pasture while also indirectly improving soil physical attributes. This can reduce environmental impacts, especially those related to soil, water, and biodiversity, in regions along agricultural frontiers in the southern Amazon and around the world.

Author Contributions

Data collection, writing, methodology, formal analysis, and figures, F.A.M.; data collection and laboratory analysis, M.A.B.A., D.R.B. and A.K.; supervision and laboratory analysis, C.A.Z.; data collection, review, editing, supervision, and financial support, A.P.d.S. and F.T.d.A.; review, editing, supervision, and financial support, A.K.H. All authors have read and agreed to the published version of the manuscript.

Funding

This study was financed by the Coordenação de Aperfeiçoamento de Pessoal de Nível Superior—Brazil (CAPES) and the Agência Nacional de Águas e Saneamento Básico (ANA), Finance Code 001 and Process 88887.144957/2017-00. The authors wish to thank the Conselho Nacional de Desenvolvimento Científico e Tecnológico (CNPq) for its support with scientific initiation grants and a productivity grant.

Institutional Review Board Statement

Not applicable.

Informed Consent Statement

Not applicable.

Data Availability Statement

Study data can be obtained upon request to the corresponding author, the second author, via email. The data are unavailable on the website as the research project is still under development.

Acknowledgments

We thank the Federal University of Mato Grosso, the PPGCAM, and the PPGFA. The authors also thank all the students and professors of the Tecnologia em Recursos Hídricos no Centro-Oeste research group (dgp.cnpq.br/dgp/espelhogrupo/2399343537529589, accessed on 15 December 2022). The authors would also like to thank the owners of the farms that allowed and supported the collection of samples, with the following highlights: (i) in Vera-MT: Fazenda Vó Maria, Agropecuária Taguá, Fazenda São José and Fazenda Jaboticabal; (ii) in Claúdia-MT: Fazenda Continental, Fazenda Aremisa III, and Agropecuária Bedin.

Conflicts of Interest

The authors declare no conflict of interest.

References

  1. Zaiatz, A.P.S.R.; Zolin, C.A.; Vendrusculo, L.G.; Lopes, T.R.; Paulino, J. Agricultural land use and cover change in the Cerrado/Amazon ecotone: A case study of the upper Teles Pires river basin. Acta Amazon. 2017, 48, 168–177. [Google Scholar] [CrossRef]
  2. Levy, M.C.; Lopes, A.V.L.; Cohn, A.; Larsen, L.G.; Thompson, S.E. Land use change increases streamflow across the Arc of Deforestation in Brazil. Geophys. Res. Lett. 2018, 45, 3520–3530. [Google Scholar] [CrossRef]
  3. Arvor, D.; Tritsch, I.; Barcellos, C.; Jégou, N.; Dubreuil, V. Land use sustainability on the South-Eastern Amazon agricultural frontier: Recent progress and the challenges ahead. Appl. Geogr. 2017, 80, 86–97. [Google Scholar] [CrossRef]
  4. De Sy, V.; Herold, M.; Achard, F.; Beuchle, R.; Clevers, J.G.P.W.; Lindquist, E.; Verchot, L. Land use patterns and related carbon losses following deforestation in South America. Environ. Res. Lett. 2015, 10, e124004. [Google Scholar] [CrossRef]
  5. Oliveira, V.A.; Mello, C.R.; Viola, M.R.; Srinivasan, R. Land-use change impacts on the hydrology of the Upper Grande River Basin, Brazil. Cerne 2018, 24, 334–343. [Google Scholar] [CrossRef]
  6. Singh, V.P. Hydrologic modeling: Progress and future directions. Geosci. Lett. 2018, 15, 2–18. [Google Scholar] [CrossRef]
  7. Carvalho, J.L.N.; Raucci, G.S.; Cerri, C.E.P.; Bernoux, M.; Feigl, B.J.; Wruck, F.J.; Cerri, C.C. Impact of pasture, agriculture and crop-livestock systems on soil C stocks in Brazil. Soil Till. Res. 2010, 110, 175–186. [Google Scholar] [CrossRef]
  8. Celentano, D.; Rousseau, G.X.; Muniz, F.H.; Varga, I.D.; Martinez, C.; Carneiro, M.S.; Miranda, M.V.C.; Barros, M.N.R.; Freitas, L.; Narvaes, I.S.; et al. Towards zero deforestation and forest restoration in the Amazon region of Maranhão state, Brazil. Land Use Policy 2017, 68, 692–698. [Google Scholar] [CrossRef]
  9. Oliveira, D.M.S.; Lima, R.P.; Verburg, E.E.J. Physical quality of soil under different tillage systems and pig slurry application. Rev. Bras. Eng. Agrí. E Ambient. 2015, 19, 280–285. [Google Scholar] [CrossRef]
  10. Anache, J.A.A.; Flanagan, D.C.; Srivastava, A.; Wendland, E.C. Land use and climate change impacts on runoff and soil erosion at the hillslope scale in the Brazilian Cerrado. Sci. Total Environ. 2018, 622–623, 140–151. [Google Scholar] [CrossRef] [PubMed]
  11. Alves, M.A.B.; Souza, A.P.; Almeida, F.T.; Hoshide, A.K.; Araújo, H.B.; Silva, A.F.; Carvalho, D.F. Effects of land use and cropping on soil erosion in agricultural frontier areas in the Cerrado-Amazon Ecotone, Brazil, using a rainfall simulator experiment. Sustainability 2023, 15, 4954. [Google Scholar] [CrossRef]
  12. Santos, G.O.; Hernandez, F.B.; Ferraudo, A.S.; Vanzela, L.S.; Santos, D.J.O. A study of the impact of land use and occupation on basin water quality through multivariate statistics. Eng. Agríc. 2017, 37, 453–462. [Google Scholar] [CrossRef]
  13. Aliyari, F.; Bailey, R.T.; Tasdighi, A.; Dozier, A.; Arabi, M.; Zeiler, K. Coupled SWAT-MODFLOW model for large-scale mixed agro-urban river basins. Environ. Model. Softw. 2019, 115, 200–210. [Google Scholar] [CrossRef]
  14. Ou, Y.; Quiñónez-Barraza, G.; Wang, C. Effects of land-use types on topsoil physicochemical properties in a Tropical Coastal Ecologically Fragile Zone of South China. Sustainability 2023, 15, 5484. [Google Scholar] [CrossRef]
  15. Li, H.; Chang, L.; Wei, Y.; Li, Y. Interacting effects of land use type, soil attributes, and environmental factors on aggregate stability. Land 2023, 12, 1286. [Google Scholar] [CrossRef]
  16. Buraka, T.; Elias, E.; Lelago, A. Effects of land-use-cover-changes on selected soil physicochemical properties alon slope position, Coka watershed, Southern Ethiopia. Heliyon 2023, 9, 16142. [Google Scholar] [CrossRef]
  17. Buruso, F.H.; Adimassu, Z.; Sibali, L.L. Effects of land use/land cover changes on soil properties in Rib watershed, Ethiopai. Catena 2023, 224, 106977. [Google Scholar] [CrossRef]
  18. Asmare, T.K.; Abayneh, B.; Yigzaw, M.; Birhan, T.A. The effect of land use type on selected soil physicochemical properties in Shihatig watershed, Dabat district, Northwest Ethiopia. Heliyon 2023, 9, 16038. [Google Scholar] [CrossRef]
  19. Hernández-Atencia, Y.; Peña, L.E.; Muñoz-Ramos, J.; Rojas, I.; Álvarez, A. Use of soil infiltration capacity and stream flow velocity to estimate physical flood vulnerability under land-use change scenarios. Water 2023, 15, 1214. [Google Scholar] [CrossRef]
  20. Abu-hashim, M.; Lilienthal, H.; Schnug, E.; Lasaponara, R.; Mohamed, E.S. Can a change in agriculture management practice improve soil physical properties. Sustainability 2023, 15, 3573. [Google Scholar] [CrossRef]
  21. Castioni, G.A.; Cherubin, M.R.; Menandro, L.M.S.; Sanches, G.M.; Bordonal, R.O.; Barbosa, L.C.; Franco, H.C.J.; Carvalho, J.L.N. Soil physical quality response to sugarcane straw removal in Brazil: A multi-approach assessment. Soil Till. Res. 2018, 184, 301–309. [Google Scholar] [CrossRef]
  22. Viana, J.L.; de Souza, J.L.M.; Auler, A.C.; de Oliveira, R.A.; Araújo, R.M.; Hoshide, A.K.; de Abreu, D.C.; da Silva, W.M. Water dynamics and hydraulic functions in sandy soils: Limitations to sugarcane cultivation in Southern Brazil. Sustainability 2023, 15, 7456. [Google Scholar] [CrossRef]
  23. Soares, M.D.R.; Campos, M.C.C.; Oliveira, I.A.; Cunha, J.M.; Santos, L.A.C.; Fonseca, J.S.; Souza, Z.M. Soil physical properties in areas under different land uses systems in the Manicoré region, Amazonas State, Brazil. Amazon. J. Agric. Environ. Sci. 2016, 59, 9–15. [Google Scholar] [CrossRef]
  24. Fu, Y.; Tian, Z.; Amoozegar, A.; Heitman, J. Measuring dynamic changes of soil porosity during compaction. Soil Till. Res. 2019, 193, 114–121. [Google Scholar] [CrossRef]
  25. Hervé-Fernández, P.; Muñoz-Arriagada, R.; Glucevic-Almonacid, C.; Bahamonde-Vidal, L.; Radic-Schilling, S. Influence of Rangeland land cover on infiltration rates, field-satured hydraulic conductivity and soil water repellency in Southern Patagonia. Rangel. Ecol. Manag. 2023, 90, 92–100. [Google Scholar] [CrossRef]
  26. Arvor, D.; Meirelles, M.; Dubreuil, V.; Bégué, A.; Shimabukuro, Y.E. Analyzing the agricultural transition in Mato Grosso, Brazil, using satellite-derived indices. Appl. Geogr. 2012, 32, 702–713. [Google Scholar] [CrossRef]
  27. Garrett, R.D.; Koh, I.; Lambin, E.F.; Waroux, Y.P.; Hastens, J.H.; Brown, J.C. Intensification in agriculture-forest frontiers: Land use responses to development and conservation policies in Brazil. Glob. Environ. Change 2018, 53, 233–243. [Google Scholar] [CrossRef]
  28. Souza, A.P.; Lima, L.; Zamadei, T.; Martim, C.C.; Almeida, F.T.; Paulino, J. Climate classification and climatic water balance in Mato Grosso State, Brazil. Nativa 2013, 1, 34–43. [Google Scholar] [CrossRef]
  29. MapBiomas. MapBiomas Collection 6.0: Land Cover and Land Use Maps. 2020. Available online: https://mapbiomas.org/colecoes-mapbiomas-1?cama_set_language=pt-BR (accessed on 7 July 2022).
  30. Alves, M.A.B.; Borella, D.R.; Luz, C.C.S.; Castagna, D.; Silva, W.C.; Silva, A.F.; Almeida, F.T.; Souza, A.P. Soil classes in the Caiabi and Renato river basins, tributaries of the Teles Pires river in the south of the Amazon. Nativa 2022, 10, 431–448. [Google Scholar] [CrossRef]
  31. Santos, H.G.; Jacomine, P.K.T.; Anjos, L.H.C.; Oliveira, V.A.; Lumbreras, J.F.; Coelho, M.R.; Almeida, J.A.; Araujo Filho, J.C.; Oliveira, J.B.; Cunha, T.J.F. Brazilian System of Soil Classification, 5th ed.; rev./ampl; Embrapa: Brasília, Brasil, 2018; pp. 1–356. Available online: https://www.embrapa.br/solos/busca-de-publicacoes/-/publicacao/1094003/sistema-brasileiro-de-classificacao-de-solos (accessed on 5 April 2023).
  32. Soil Survey Staff. Keys to Soil Taxonomy, 12th ed.; USDA-NRCS: Washington, DC, USA, 2014; pp. 1–603. Available online: https://www.iec.cat/mapasols/DocuInteres/PDF/Llibre50.pdf (accessed on 5 April 2023).
  33. Teixeira, P.C.; Donagemma, G.K.; Fontana, A.; Teixeira, W.G. Manual of Soil Analysis Methods, 3rd ed.; Embrapa Solos: Rio de Janeiro, Brazil, 2017; pp. 1–573. Available online: https://www.infoteca.cnptia.embrapa.br/handle/doc/1085209 (accessed on 5 April 2023).
  34. Statsoft, I. TIBCO Statistica for Window, Release 14.0; StatSoft Inc.: Tulsa, UK, 2023; Available online: https://docs.tibco.com/pub/stat/14.0.0/doc/html/UsersGuide/GUID-058F49FC-F4EF-4341-96FB-A785C2FA76E9-homepage.html (accessed on 5 April 2023).
  35. Hongyu, K.; Sandanielo, V.L.M.; Oliveira Junior, G.J. Principal component analysis: Theory, interpretations and applications. Eng. Sci. 2015, 5, 83–90. [Google Scholar]
  36. Hair, J.F., Jr.; Babin, B.J.; Anderson, R.E.; Black, W.C. Multivariate Data Analysis, 8th ed.; Cengage: New Delhi, India, 2018; pp. 1–609. [Google Scholar]
  37. Ruehlmann, J. Soil particle density as affected by soil texture and soil organic matter: 1. Partitioning of SOM in conceptional fractions and derivation of a variable SOC to SOM conversion factor. Geoderma 2020, 375, e114542. [Google Scholar] [CrossRef]
  38. Chavez, L.F.; Amado, T.J.C.; Bayer, C.; La Scala, N.J.; Escobar, L.F.; Fiorin, J.E.; Campos, B.-H.C. Carbon dioxide efflux in a rhodic hapludox as affected by tillage systems in southern Brazil. Rev. Bras. Ciênc. Solo 2009, 33, 325–334. [Google Scholar] [CrossRef]
  39. Lange, A.; Dantas, J.; Freddi, O.d.S.; Buratto, W.; Spaziani, C.; Caione, G. Soil degradation by the extensive livestock in the southern amazon of Mato Grosso. Nativa 2019, 7, 642–648. [Google Scholar] [CrossRef]
  40. Vizioli, B.; Cavalieri-Polizeli, K.M.V.; Barth, G. Influence of ryegrass managements on the physical properties of a Haplohumox. Pesqui. Agropecu. Bras. 2018, 53, 952–960. [Google Scholar] [CrossRef]
  41. Azevedo, E.C.; Sverzuto, C.B. Changes in physical and chemical attributes of soil under pasture in the southwest of the state of Mato Grosso. Rev. Agric. Trop. 2007, 9, 1–17. [Google Scholar]
  42. Freire, M.B.G.d.S.; Ruiz, H.A.; Ribeiro, M.R.; Ferreira, P.A.; Freire, F.J. Hydraulic conductivity of soils from Pernambuco in response to electrical conductivity and SAR of irrigation water. Rev. Bras. Eng. Agríc. E Ambient. 2003, 7, 45–52. [Google Scholar] [CrossRef]
  43. Marques, J.D.O.; Teixeira, W.G.; Reis, A.M.; Cruz Junior, O.F.; Martins, G.C. Evaluation of the saturated hydraulic conductivity using two laboratory methods in a topos-sequence with different vegetation cover in the lower Amazon. Acta Amaz. 2008, 38, 193–206. [Google Scholar] [CrossRef]
  44. Elsenbeer, H.; Cassel, K.; Castro, J. Spatial analysis of soil hydraulic conductivity in a Tropical Rain Forest Catchment. Water Resour. Res. 1992, 28, 3201–3214. [Google Scholar] [CrossRef]
  45. Scheffler, R.; Neill, C.; Krusche, A.V.; Elsenbeer, H. Soil hydraulic response to land-use change associated with the recent soybean expansion at the Amazon agricultural frontier. Agric. Ecosyst. Environ. 2011, 144, 281–289. [Google Scholar] [CrossRef]
  46. Gupta, S.; Hengl, T.; Lehmann, P.; Bonetti, S.; Or, D. SoilKsatDB: Global database of soil saturated hydraulic conductivity measurements for geoscience applications. Earth Syst. Sci. Data 2021, 13, 1593–1612. [Google Scholar] [CrossRef]
  47. Ferreira, E.A.; Maia, J.C.S.; Bianchini, A.; Vaz, B.K.M.; Kerkhoff, P.H.A. Hydraulic conductivity of a Latosol in different soil use and management systems. Res. Soc. Dev. 2022, 11, 384111638010. [Google Scholar] [CrossRef]
  48. Carducci, C.E.; Oliveira, G.C.; Zeviani, W.M.; Lima, V.M.P.; Serafim, M.E. Bimodal pore distribution on soils under conservation management system for coffee crop. Eng. Agríc. 2013, 33, 291–302. [Google Scholar] [CrossRef]
  49. Soares, M.B.; Tavanti, R.F.R.; Rigotti, A.R.; Lima, J.P.; Freddi, O.S.; Petter, F.A. Use of cover crops in the southern Amazon region: What is the impact on soil physical quality? Geoderma 2021, 384, e114796. [Google Scholar] [CrossRef]
  50. Rosa, S.L.K.; Souza, J.L.M.; Tsukahara, R.Y. Performance of the AquaCrop model for the wheat crop in the subtropical zone in Southern Brazil. Pesqui. Agropecu. Bras. 2020, 55, 1–12. [Google Scholar] [CrossRef]
  51. Souza, J.L.M.; Oliveira, C.T.; Rosa, S.L.K.; Tsukahara, R.Y. Calibration and validation of the AquaCrop model to estimate maize production in Campos Gerais, Paraná State, Brazil. Rev. Bras. Meteorol. 2020, 35, 243–253. [Google Scholar] [CrossRef]
  52. Deb, S.K.; Shukla, M.K. Variability of hydraulic conductivity due to multiple factors. Am. J. Environ. Sci. 2012, 8, 489–502. [Google Scholar] [CrossRef]
  53. Parahyba, R.B.V.; Araújo, M.S.B.; Almeida, B.G.; Rolim Neto, F.C.; Sampaio, E.V.S.B.; Caldas, A.M. Water retention capacity in arenosols and ferralsols in a semiarid area in the state of Bahia, Brazil. An. Acad. Bras. Ciênc. 2019, 91, 1–20. [Google Scholar] [CrossRef]
  54. O’Geen, A.T. Soil Water Dynamics. Nat. Educ. Knowl. 2013, 4, e9. Available online: https://www.nature.com/scitable/knowledge/library/soil-water-dynamics-103089121/ (accessed on 5 April 2023).
  55. Rizzardi, A.S.; Righes, A.A.; Kemerich, P.D.C.; Silva, R.F.; Santos, S.A.; Borba, W.F. Physical properties and water flow in soils of river basin Vacacaí-Mirim-RS. Rev. Monogr. Ambient. 2014, 13, 3690–3701. [Google Scholar] [CrossRef]
  56. Indoria, A.K.; Sharma, K.L.; Reddy, K.S. Hydraulic properties of soil under warming climate. In Climate Change and Soil Interactions; Prasad, M.N.V., Pietrzykowski, M., Eds.; Elsevier: Amsterdam, The Netherlands, 2020; pp. 473–508. ISBN 978-0-12-818032-7. [Google Scholar]
  57. Salviano, A.M.; Cunha, T.J.F.; Olszevski, N.; Oliveira Neto, M.B.; Giongo, V.; Queiroz, A.F.; Menezes, F.J.S. Potentialities and limitations for the agricultural use of sandy soils in the semiarid region of Bahia. Magistra 2016, 28, 137–148. [Google Scholar]
  58. Kurz, I.; O’Reilly, C.D.; Tunney, H. Impact of cattle on soil physical properties and nutrient concentrations in overland flow from pasture in Ireland. Agric. Ecosyst. Environ. 2006, 113, 378–390. [Google Scholar] [CrossRef]
  59. Herbin, T.; Hennessy, D.; Richards, K.G.; Piwowarczyk, A.; Murphy, J.J.; Holden, N.M. The effects of dairy cow weight on selected soil physical properties indicative of compaction. Soil Use Manag. 2011, 27, 36–44. [Google Scholar] [CrossRef]
  60. Valladares, G.S.; Batistella, M.; Pereira, M.G. Changes prometed by management in Oxisol, Rondõnia, Brazilian Amazon. Bragantia 2011, 70, 631–637. [Google Scholar] [CrossRef]
  61. Polanía-Hincapié, K.L.; Olaya-Montes, A.; Cherubin, M.R.; Herrera-Valencia, W.; Ortiz-Morea, F.A.; Silva-Olaya, A.M. Soil physical quality responses to silvopastoral implementation in Colombian Amazon. Geoderma 2021, 386, e114900. [Google Scholar] [CrossRef]
  62. Stolf, F.; Thurler, A.M.; Bacchi, O.O.S.; Reichardt, K. Method to estimate soil macroporosity and microporosity based on sand content and bulk density. Rev. Bras. Ciênc. Solo 2011, 35, 447–459. [Google Scholar] [CrossRef]
  63. Lima, C.G.R.; Carvalho, M.P.; Mello, L.M.M.; Lima, R.C. Linear and spatial correlations between forage yield, total porosity and bulk density in Pereira Barreto, Brazil. Rev. Bras. Ciênc. Solo 2007, 31, 1233–1244. [Google Scholar] [CrossRef]
  64. Resende, T.M.; Moraes, E.R.; Franco, F.O.; Arruda, E.M.; Araújo, J.R.; Santos, D.S.; Borges, E.N.; Ribeiro, B.T. Evaluation of physical soil under different uses in áreas with added animal waste in the Cerrado. Biosci. J. 2012, 28, 179–184. [Google Scholar]
  65. Reichert, J.M.; Reinert, D.J.; Braida, J.A. Soil quality and sustainability of agricultural systems. Ciênc. Ambient. 2003, 27, 30–48. [Google Scholar]
  66. Bonetti, J.A.; Anghinoni, I.; Moraes, M.T.; Fink, J.R. Resilience of soils with different texture, mineralogy and organic matter under long-term conservation systems. Soil Till. Res. 2017, 174, 104–112. [Google Scholar] [CrossRef]
  67. Holthusen, D.; Brandt, A.A.; Reichert, J.M.; Horn, R. Soil porosity, permeability and static and dynamic strength parameters under native forest/grassland compared to no-tillage cropping. Soil Till. Res. 2018, 177, 113–124. [Google Scholar] [CrossRef]
  68. Akinde, B.P.; Olakayode, A.O.; Oyedele, D.J. Selected physical and chemical properties of soil under different agricultural land-use types in Ile-Ife, Nigeria. Heliyon 2020, 6, e05090. [Google Scholar] [CrossRef] [PubMed]
  69. Calonego, J.C.; Rosolem, C.A. Soybean root growth and yield in rotation with cover crops under chiseling and no-till. Eur. J. Agron. 2010, 33, 242–249. [Google Scholar] [CrossRef]
  70. Hao, M.; Zhang, J.; Meng, M.; Chen, H.Y.H.; Guo, X.; Liu, S.; Ye, L. Impacts of changes in vegetation on saturated hydraulic conductivity of soil in subtropical forests. Sci. Rep. 2019, 9, e8372. [Google Scholar] [CrossRef] [PubMed]
  71. Jin, X.; Wang, S.; Yu, N.; Zou, H.; An, J.; Zhang, Y.; Wang, J.; Zhang, Y. Spatial predictions of the permanent wilting point in arid and semi-arid regions of Northeast China. J. Hydrol. 2018, 564, 367–375. [Google Scholar] [CrossRef]
  72. Reynolds, W.D.; Bowman, B.T.; Drury, C.F.; Tan, C.S.; Lu, X. Indicators of good soil physical quality: Density and storage parameters. Geoderma 2002, 110, 131–146. [Google Scholar] [CrossRef]
  73. Cruz, D.L.S.; Vale Junior, J.F.; Cruz, P.L.S.; Cruz, A.B.S.; Nascimento, P.P.R.R. Physical and water properties of an Ultisol under natural forest and savanna and planted to pasture in Roraima, Brazil. Rev. Bras. Ciênc. Solo 2014, 38, 307–314. [Google Scholar] [CrossRef]
  74. Beutler, A.N.; Centurion, J.F.; Souza, Z.M.; Andrioli, I.; Roque, C.G. Water retention in two oxisols under different uses. Rev. Bras. Ciênc. Solo 2022, 26, 829–834. [Google Scholar] [CrossRef]
  75. Andrade, F.H.N.; Almeida, C.D.G.C.; Almeida, B.G.; Albuquerque Filho, J.A.C.; Mantovanelli, B.C.; Araujo Filho, J.C. Soil physical-hydric properties by pedotransfer function in soils of coastal plains of Pernambuco. Irriga 2020, 25, 69–86. [Google Scholar] [CrossRef]
  76. Anaba, B.D.; Yemefack, M.; Abossolo-Angue, M.; Ntsomboh-Ntsefong, G.; Bilong, E.G.; Ebongue, G.F.N.; Bell, J.M. Soil texture and watering impact on pot recovery of soil-stripped oil palm (Elaeis guineensis Jacq.) seedlings. Heliyon 2020, 6, e05310. [Google Scholar] [CrossRef]
  77. Costa, C.D.d.O.; Alves, M.C.; Sousa, A.D.P. Water storage in two soils under different uses and management. Rev. Ciênc. Ambient. 2016, 10, 55–65. [Google Scholar]
  78. Ghanbarian-Alavijeh, B.; Millán, H. The relationship between surface fractal dimension and soil water content at permanent wilting point. Geoderma 2009, 151, 224–232. [Google Scholar] [CrossRef]
  79. Kirkham, M.B. Field capacity, wilting point, available water, and the nonlimiting water range. Princ. Soil Plant Water Relat. 2014, 2, 153–170. [Google Scholar] [CrossRef]
  80. Cunha, E.d.Q.; Stone, L.F.; Ferreira, E.P.B.; Didonet, A.D.; Moreira, J.A.A.; Leandro, W.M. Soil tillage systems and cover crops in organic production of common bean and corn: II—Soil biological properties. Rev. Bras. Ciênc. Solo 2011, 35, 589–602. [Google Scholar] [CrossRef]
  81. Tanveera, A.; Tasawoor, A.T.; Parvaiz, A.T.; Mehrajuddin, N. Relation of soil bulk density with texture, total organic matter content and porosity in the soils of Kandi Area of Kashmir valley, India. Int. Res. J. Earth Sci. 2016, 4, 1–6. Available online: http://www.isca.in/EARTH_SCI/Archive/v4/i1/1.ISCA-IRJES-2015-015.pdf (accessed on 17 May 2023).
  82. Costa, R.X.; Frazao, J.J.; Machado, R.L.; Pereira, D.R.M.; Nascimento, L.M.; Oliveira, A.P.S.; Marques, V.S. Land-Use changes the chemical and physical properties of an oxisol in the Brazilian Cerrado. J. Agric. Sci. 2020, 12, 181–191. [Google Scholar] [CrossRef]
  83. Rocha Junior, P.R.; Sturião, W.P.; Nogueira, N.O.; Passos, R.R.; Donagemma, G.K.; Rangel, O.J.P.; Bhattarai, R. Soil quality indicators to evaluate environmental services at different landscape positions and land uses in the Atlantic Forest biome. Environ. Sustain. Indic. 2020, 7, e100047. [Google Scholar] [CrossRef]
  84. Panagos, P.; Borelli, P.; Poesen, J.; Ballabio, C.; Lugato, E.; Meusburger, K.; Montanarella, L.; Alewell, C. The new assessment of soil loss by water erosion in Europe. Environ. Sci. Policy 2015, 54, 438–447. [Google Scholar] [CrossRef]
  85. Borella, D.R.; de Souza, A.P.; de Almeida, F.T.; de Abreu, D.C.; Hoshide, A.K.; Carvalho, G.A.; Pereira, R.R.; da Silva, A.F. Dynamics of sediment transport in the Teles Pires River basin in the Cerrado-Amazon, Brazil. Sustainability 2022, 14, 16050. [Google Scholar] [CrossRef]
  86. Borrelli, P.; Robinson, D.A.; Fleischer, L.R.; Lugato, E.; Ballabio, C.; Alewell, C.; Meusburger, K.; Modugno, S.; Schütt, B.; Ferro, B.; et al. An assessment of the global impact of 21st century land use change on soil erosion. Nat. Commun. 2017, 8, 1–13. [Google Scholar] [CrossRef]
  87. Jardini, D.C.; Amorim, R.S.S. Use of s index in the evaluation of the physical-hydric quality in soil samples from the Cerrado in Mato Grosso state. Eng. Agric. 2017, 25, 107–115. [Google Scholar] [CrossRef]
  88. Marcatto, F.S.; Silveira, H. Relation between the soil’s hydrophysical attributes and the land use as a subsidy to the use and management of soil and water in the Pirapó river drainage basin. Rev. Bras. Geogr. Física 2016, 9, 1769–1783. [Google Scholar] [CrossRef]
Figure 1. Location map of the Renato River and Caiabi River watersheds, in the Cerrado–Amazon transition zone, Mato Grosso state, Brazil. Evaluated land uses include crops, pasture, and native forest. The drainage network used was the Brazilian Institute of Geography and Statistics, scale 1:250,000 (available at: https://www.ibge.gov.br/geociencias/downloads-geociencias.html) (accessed on 1 September 2023). The river basins were delimited using the digital elevation model with data from the Shuttle Radar Topography Mission of the Project Brasil em Relevo of Embrapa.
Soilsystems 07 00103 g001
Figure 2. Land use and occupation of the Renato River and Caiabi River watersheds of the Teles Pires River in 2020 [21]. Evaluated land uses were (A) crops (e.g., soybeans), (B) native forest, and (C) pasture. Data source: Land uses of MapBiomas [29].
Soilsystems 07 00103 g002
Figure 3. Available water capacity of the soil (0 to 0.4 m depth) for different land uses (CR: crop; NF: native forest; PA: pasture) for regions in the Renato River watershed, Mato Grosso state, Brazil, 2020. Equal uppercase letters for the same region do not differ significantly from each other in the Kruskal–Wallis nonparametric test (p < 0.05). Equal lowercase letters for the same land use do not differ significantly from each other in the Kruskal–Wallis nonparametric test (p < 0.05).
Soilsystems 07 00103 g003
Figure 4. Available water capacity of the soil (0 to 0.4 m depth) for different land uses and regions in the Caiabi River watershed, Mato Grosso state, Brazil, 2020. Equal uppercase letters for the same region do not differ significantly from each other in the Kruskal–Wallis nonparametric test (p < 0.05). Equal lowercase letters for the same land use do not differ significantly from each other in the Kruskal–Wallis nonparametric test (p < 0.05).
Soilsystems 07 00103 g004
Figure 5. Biplot representation of the PCA between the soil attributes in the Renato watershed, at depths of (A) 0 m to 0.1 m, (B) 0.1 to 0.2 m, and (C) 0.2 to 0.4 m, where Ma: macroporosity, Mi: microporosity, TP: total porosity, PD: particle density, BD: bulk density, PWP: soil water content at permanent wilting point, FC: soil water content at field capacity, AWC: available water capacity.
Soilsystems 07 00103 g005aSoilsystems 07 00103 g005b
Figure 6. Biplot representation of the PCA between the soil attributes in the Caiabi River watershed, at different depths. Abbreviations are Ma: macroporosity, Mi: microporosity, TP: total porosity, PD: particle density, BD: bulk density, PWP: soil water content at permanent wilting point, FC: soil water content at field capacity, AWC: available water capacity.
Soilsystems 07 00103 g006aSoilsystems 07 00103 g006b
Table 1. Land occupation classification in the Renato River and Caiabi River watersheds, located in the Cerrado–Amazon transition zone, Mato Grosso state, Brazil, in 2020.
ClassRenatoCaiabi
Area (km2)Area PercentageArea (km2)Area Percentage
Water2.800.211.360.28
Native Forest934.4169.91151.6230.98
Pasture213.1015.9430.636.26
Crop179.2213.41289.8859.24
Urban area7.030.5315.823.23
Total1336.56100.00489.31100.00
Source: Land uses based on MapBiomas [21].
Table 2. Particle size distribution and textural soil classification at different depths and regions in the Renato River watershed, Mato Grosso state, Brazil, 2020.
UseHeadwaterMiddleMouth
ClaySiltSandClaySiltSandClaySiltSand
g kg−1
0 m to 0.1 m
Crops222 ABa137 Aa641 ABb61 Ab61 Ab878 Aa95 Ab85 Ab820 Aa
Pasture288 Aa117 Aa595 Bb37 Ab41 Ab922 Aa98 Ab102 Aa800 Ab
Native forest163 Ba118 Aa719 Ab63 Ab81 Aa856 Aa148 Aa82 Aa770 Aab
0.1 to 0.2 m
Crops220 ABa126 Aa654 Ab63 Ab87 Aa850 Aa104 Bb89 Aa807 Aa
Pasture239 Aa120 Aa641 Ac58 Ab47 Ab895 Aa124 ABb90 Aab786 Ab
Native forest162 Bab124 Aa714 Ab90 Ab79 Aab831 Aa183 Aa70 Ab747 Aab
0.2 to 0.4 m
Crops223 Aa137 Aa640 Ab97 Ab90 Aa813 Aa100 Bb105 Aa795 Aa
Pasture294 Aa144 Aa562 Ab94 Ac78 Ab828 Aa171 ABb69 Ab760 ABb
Native forest250 Aa135 Aa615 Ab79 Ab112 Aa809 Aa221 Aa115 Aa664 Ba
TextureSandy clay loamLoamy sandSandy loam
Land use classes for crops, pasture, and native forest. Equal uppercase letters in a column (for the same region and depth) do not differ significantly from each other in the Kruskal–Wallis nonparametric test (p < 0.05). Equal lowercase letters in a row (for the same fraction, land use, and depth) do not differ significantly from each other in the Kruskal–Wallis nonparametric test (p < 0.05).
Table 3. Particle density and bulk density (Mg m−3) for soils at different depths, land uses, and regions in the Renato River watershed, Mato Grosso state, Brazil, 2020.
AttributeDepth (m)UseRegion
HeadwaterMiddleMouth
Particle Density (Mg m−3)0 to 0.1 mCrops2.49 ABb2.70 Aa2.75 Aa
Pasture2.59 Ab2.67 Aab2.69 Aa
Native forest2.47 Bb2.70 Aa2.69 Aa
0.1 to 0.2 mCrops2.62 Ab2.74 Aa2.73 Aa
Pasture2.62 Ab2.76 Aa2.71 Aab
Native forest2.62 Aa2.64 Ba2.68 Aa
0.2 to 0.4 mCrops2.61 Ab2.77 Aa2.76 Aa
Pasture2.66 Aa2.69 Aa2.76 Aa
Native forest2.60 Ab2.71 Aa2.77 Aa
Bulk Density (Mg m−3)0 to 0.1 mCrops1.10 Ab1.53 Aa1.62 Aa
Pasture1.17 Ab1.39 ABab1.50 Aa
Native forest1.05 Aa1.26 Ba1.18 Ba
0.1 to 0.2 mCrops1.07 Ab1.58 Aa1.55 Aa
Pasture1.24 Ab1.47 ABab1.54 Aa
Native forest1.17 Aa1.32 Ba1.39 Ba
0.20 to 0.40 mCrops1.07 Ab1.51 Aa1.52 Aa
Pasture1.17 Ab1.47 Aa1.49 Aa
Native forest1.19 Aa1.32 Aa1.39 Aa
Equal uppercase letters in a column (for the same region and depth) do not differ significantly from each other in the Kruskal–Wallis nonparametric test (p < 0.05). Equal lowercase letters in a row (for the same land use and depth) do not differ significantly from each other in the Kruskal–Wallis nonparametric test (p < 0.05).
Table 4. Macroporosity, microporosity, and total porosity (m3 m−3) for different depths, land uses, and regions in the Renato River watershed, Mato Grosso state, Brazil, 2020.
AttributeDepthUseRegion
HeadwaterMiddleMouth
Macroporosity0 to 0.10 mCrops0.11 Bb0.21 Ba0.15 Bb
Pasture0.15 Ba0.20 Ba0.09 Cb
Native forest0.22 Ab0.28 Aa0.24 Aab
0.1 to 0.2 mCrops0.12 Bb0.20 Aa0.20 Aa
Pasture0.14 Bb0.23 Aa0.13 Bb
Native forest0.20 Aab0.25 Aa0.15 ABb
0.2 to 0.4 mCrops0.14 Bb0.21 Aa0.21 Aa
Pasture0.15 Bb0.21 Aa0.18 Aab
Native forest0.21 Aa0.24 Aa0.19 Aa
Microporosity0 to 0.1 mCrops0.45 Aa0.22 Ab0.26 Bb
Pasture0.40 ABa0.28 Ab0.35 Aab
Native forest0.35 Ba0.25 Ab0.32 ABab
0.1 to 0.2 mCrops0.47 Aa0.22 Ab0.23 Bb
Pasture0.39 Ba0.24 Ab0.30 ABb
Native forest0.35 Ba0.25 Ab0.33 Aa
0.2 to 0.4 mCrops0.45 Aa0.24 Ab0.24 Ab
Pasture0.41 Aa0.24 Ab0.28 Ab
Native forest0.33 Ba0.27 Aa0.31 Aa
Total Porosity (TP)0 to 0.1 mCrops0.56 Aa0.43 Bb0.41 Bb
Pasture0.55 Aa0.48 ABab0.44 Bb
Native forest0.57 Aa0.53 Aa0.56 Aa
0.1 to 0.2 mCrops0.59 Aa0.42 Ab0.43 Ab
Pasture0.53 Aa0.47 Aab0.43 Ab
Native forest0.55 Aa0.50 Aa0.48 Aa
0.2 to 0.4 mCrops0.59 Aa0.45 Ab0.45 Ab
Pasture0.56 Aa0.45 Ab0.46 Ab
Native forest0.54 Aa0.51 Aa0.50 Aa
Equal uppercase letters in a column (for the same region and depth) do not differ significantly from each other in the Kruskal–Wallis nonparametric test (p < 0.05). Equal lowercase letters in a row (for the same land use and depth) do not differ significantly from each other in the Kruskal–Wallis nonparametric test (p < 0.05).
Table 5. Saturated hydraulic conductivity (Ksat cm hour−1) for different depths, land uses, and regions in the Renato River watershed, Mato Grosso state, Brazil, 2020.
DepthUseRegion
HeadwaterMiddleMouth
0.0 to 0.10 mCrops2.72 Ba4.81 Ba7.03 Ba
Pasture3.24 Ba6.12 Ba6.16 Ba
Native forest50.69 Ab57.03 Ab75.12 Aa
0.10 to 0.20 mCrops6.60 Ba5.89 Ba9.06 Ba
Pasture8.50 Ba8.15 Ba3.27 Ba
Native forest50.68 Aa49.10 Aa42.30 Aa
0.20 to 0.40 mCrops2.43 Bb11.38 Ba13.57 Ba
Pasture2.96 Bb13.81 Ba11.55 Ba
Native forest19.84 Ab71.48 Aa63.26 Aa
Equal uppercase letters in a column (for the same region and depth) do not differ significantly from each other in the Kruskal–Wallis nonparametric test (p < 0.05). Equal lowercase letters in a row (for the same land use and depth) do not differ significantly from each other in the Kruskal–Wallis nonparametric test (p < 0.05).
Table 6. Volumetric moisture at the permanent wilting point and field capacity (m3 m−3) for different depths, land uses, and regions in the Renato River watershed, Mato Grosso state, Brazil, 2020.
AttributeDepthUseRegion
HeadwaterMiddleMouth
Volumetric Moisture at
Permanent Wilting Point
(m3 m−3)
0 to 0.1 mCrops0.20 Aa0.07 Ab0.10 Ab
Pasture0.17 ABa0.09 Ab0.12 Ab
Native forest0.14 Ba0.08 Ab0.10 Ab
0.1 to 0.2 mCrops0.18 Aa0.07 Ab0.10 Ab
Pasture0.17 Aa0.07 Ab0.08 Ab
Native forest0.15 Aa0.08 Ab0.11 Aab
0.2 to 0.4 mCrops0.17 Aa0.09 Ab0.09 Ab
Pasture0.17 Aa0.08 Ab0.08 Ab
Native forest0.17 Aa0.09 Ab0.11 Ab
Volumetric Moisture
at Field Capacity (m3 m−3)
0 to 0.1 mCrops0.45 Aa0.22 Ab0.26 Bb
Pasture0.40 ABa0.28 Ab0.35 Aab
Native forest0.35 Ba0.25 Ab0.32 ABab
0.1 to 0.2 mCrops0.47 Aa0.22 Ab0.23 Bb
Pasture0.39 Ba0.24 Ab0.30 ABb
Native forest0.35 Ba0.25 Ab0.33 Aa
0.2 to 0.4 mCrops0.45 Aa0.24 Ab0.24 Ab
Pasture0.41 Aa0.24 Ab0.28 Ab
Native forest0.33 Ba0.27 Aa0.31 Aa
Equal uppercase letters in a column (for the same region and depth) do not differ significantly from each other in the Kruskal–Wallis nonparametric test (p < 0.05). Equal lowercase letters in a row (for the same land use and depth) do not differ significantly from each other in the Kruskal–Wallis nonparametric test (p < 0.05).
Table 7. Particle size distribution and textural soil classification at different depths and in different regions in the Caiabi River watershed, Mato Grosso state, Brazil, 2020.
UseHeadwaterMiddleMouth
ClaySiltSandClaySiltSandClaySiltSand
g kg−1
0 to 0.1 m
Crops36 Aa15 Ba 49 Ab30 Aa22 Aa48 Ab16 Ab6 Ab78 Aa
Pasture36 Aa12 Ba52 Ab38 Aa12 Ba50 Ab15 Ab5 Aa80 Aa
Native forest23 Bb32 Aa45 Ab40 Aa18 ABb42 Ab11 Ac5 Ac84 Aa
0.1 to 0.2 m
Crops49 Aa6 Bab45 Ab44 Aa12 Aa44 Ab18 Ab5 Ab77 Aa
Pasture45 ABa10 Bab45 Ab39 Aa13 Aa48 Ab15 Ab6 Ab79 Aa
Native forest34 Bb19 Aa47 Ab50 Aa11 Ab39 Ab12 Ac5 Ab83 Aa
0.2 to 0.4 m
Crops52 Aa6 Aa42 Ab53 ABa8 Aa39 Ab20 Ab6 Aa74 Aa
Pasture52 Aa7 Aa41 Ab42 Ba11 Aa47 Ab18 Ab6 Aa76 Aa
Native forest49 Aa10 Aa41 Ab55 Aa8 Ab37 Ab13 Ab5 Aa82 Aa
TextureClay loamClay loamClay loam
Equal uppercase letters in a column (for the same region and depth) do not differ significantly from each other in the Kruskal–Wallis nonparametric test (p < 0.05). Equal lowercase letters in a row (for the same fraction, land use, and depth) do not differ significantly from each other in the Kruskal–Wallis nonparametric test (p < 0.05).
Table 8. Particle density and bulk density (Mg m−3) for different depths, land uses, and regions in the Caiabi River watershed, Mato Grosso state, Brazil, 2020.
AttributeDepthUseRegion
HeadwaterMiddleMouth
Particle Density (Mg m−3)0 to 0.1 mCrops2.56 Aa2.60 Aa2.62 Aa
Pasture2.53 Ab2.59 Aab2.62 Aa
Native forest2.46 Bb2.60 Aa2.64 Aa
0.1 to 0.2 mCrops2.58 Ab2.66 Aa2.65 Aa
Pasture2.58 Aa2.64 Aa2.61 Aa
Native forest2.60 Ab2.66 Aa2.66 Aa
0.2 to 0.4 mCrops2.57 Ab2.66 ABa2.68 Aa
Pasture2.58 Ab2.62 Bab2.67 Aa
Native forest2.61 Ab2.69 Aa2.67 Aab
Bulk Density (Mg m−3)0 to 0.1 mCrops1.10 Ab1.12 Bb1.58 Aa
Pasture0.87 Bb0.97 Cb1.19 Ba
Native forest1.03 Ac1.27 Ab1.55 Aa
0.1 to 0.2 mCrops1.40 Ab1.36 Ab1.60 Aa
Pasture1.00 Cb1.06 Bb1.21 Ba
Native forest1.14 Bc1.32 Ab1.50 Aa
0.2 to 0.4 mCrops1.36 Ab1.28 Ab1.55 Aa
Pasture1.04 Bb1.10 Bb1.26 Ba
Native forest1.13 Bb1.25 Ab1.54 Aa
Equal uppercase letters in a column (for the same region and depth) do not differ significantly from each other in the Kruskal–Wallis nonparametric test (p < 0.05). Equal lowercase letters in a row (for the same land use and depth) do not differ significantly from each other in the Kruskal–Wallis nonparametric test (p < 0.05).
Table 9. Macroporosity, microporosity, and total porosity (m3 m−3) for different depths, land uses, and regions in the Caiabi River watershed, Mato Grosso state, Brazil, 2020.
AttributeDepthUseRegion
HeadwaterMiddleMouth
Macroporosity (Ma)0 to 0.1 mCrops0.22 Ba0.13 Bb0.12 Bb
Pasture0.36 Aa0.35 Aa0.35 Aa
Native forest0.10 Ca0.10 Ba0.07 Ba
0.1 to 0.2 mCrops0.11 Ba0.11 Ba0.14 Ba
Pasture0.24 Ab0.27 Aab0.34 Aa
Native forest0.07 Bb0.14 Bab0.17 Ba
0.2 to 0.4 mCrops0.11 Ba0.13 Ba0.17 Ba
Pasture0.21 Ab0.24 Aab0.31 Aa
Native forest0.09 Bb0.19 ABa0.17 Ba
Microporosity (Mi)0 to 0.1 mCrops0.35 Bb0.44 Aa0.28 ABb
Pasture0.30 Ba0.28 Bab0.20 Bb
Native forest0.48 Aa0.41 Aab0.34 Ab
0.1 to 0.2 mCrops0.35 Ba0.38 Aa0.26 Ab
Pasture0.37 Ba0.33 Aa0.20 Ab
Native forest0.49 Aa0.36 Ab0.27 Ac
0.2 to 0.4 mCrops0.36 Ba0.39 Aa0.25 Ab
Pasture0.39 Ba0.34 Aa0.22 Ab
Native forest0.48 Aa0.35 Ab0.25 Ac
Total Porosity (TP)0 to 0.1 mCrops0.57 Ba0.57 Ba0.40 Bb
Pasture0.66 Aa0.63 Aa0.55 Ab
Native forest0.58 Ba0.51 Cb0.41 Bc
0.1 to 0.2 mCrops0.46 Ba0.49 Ba0.40 Bb
Pasture0.61 Aa0.60 Aa0.54 Ab
Native forest0.56 Ba0.50 Bb0.44 Bc
0.2 to 0.4 mCrops0.47 Bab0.52 Ba0.42 Bb
Pasture0.60 Aa0.58 Aab0.53 Ab
Native forest0.57 Aa0.54 ABa0.42 Bb
Equal uppercase letters in a column (for the same region and depth) do not differ significantly from each other in the Kruskal–Wallis nonparametric test (p < 0.05). Equal lowercase letters in a row (for the same land use and depth) do not differ significantly from each other in the Kruskal–Wallis nonparametric test (p < 0.05).
Table 10. Soil saturated hydraulic conductivity (Ksat cm h−1) for different depths, land uses, and regions in the Caiabi River watershed, Mato Grosso state, Brazil, 2020.
DepthUseRegion
HeadwaterMiddleMouth
0 to 0.10 mCrops5.44 Ba4.76 Ba4.83 Ba
Pasture3.17 Bb6.83 Bab9.47 Ba
Native forest67.56 Aa98.71 Aa73.61 Ab
0.10 to 0.20 mCrops4.92 Bb8.37 Bab9.64 Ba
Pasture6.74 Ba7.57 Ba10.72 Ba
Native forest52.29 Ab96.58 Aa79.34 Aa
0.20 to 0.40 mCrops5.98 Ba9.61 Ba10.91 Aa
Pasture9.83 Bb14.41 Bab16.82 Ba
Native forest54.09 Ab85.53 Aa92.88 Aa
Equal uppercase letters in a column (for the same region and depth) do not differ significantly from each other in the Kruskal–Wallis nonparametric test (p < 0.05). Equal lowercase letters in a row (for the same land use and depth) do not differ significantly from each other in the Kruskal–Wallis nonparametric test (p < 0.05).
Table 11. Volumetric moisture at the permanent wilting point and field capacity (m3 m−3) for different depths, land uses, and regions in the Caiabi River watershed, Mato Grosso state, Brazil, 2020.
AttributeDepthUseRegion
HeadwaterMiddleMouth
Permanent Wilting Point
(m3 m−3)
0.0 to 0.10 mCrops0.19 Aa0.20 Aa0.12 Ab
Pasture0.14 Ba0.14 Ba0.09 ABb
Native forest0.20 Aa0.22 Aa0.08 Bb
0.10 to 0.20 mCrops0.22 Aa0.23 Aa0.11 Ab
Pasture0.19 Aa0.16 Ba0.09 Ab
Native forest0.19 Aa0.22 Aa0.07 Ab
0.20 to 0.40 mCrops0.24 Aa0.22 Aa0.13 Ab
Pasture0.20 ABa0.17 Ba0.10 ABb
Native forest0.18 Bb0.23 Aa0.08 Bc
Field Capacity
(m3 m−3)
0.0 to 0.10 mCrops0.35 Bb0.44 Aa0.28 ABb
Pasture0.30 Ba0.28 Bab0.20 Bb
Native forest0.48 Aa0.41 Aab0.34 Ab
0.10 to 0.20 mCrops0.35 Ba0.38 Aa0.26 Ab
Pasture0.37 Ba0.33 Aa0.20 Ab
Native forest0.49 Aa0.36 Ab0.27 Ac
0.20 to 0.40 mCrops0.36 Ba0.39 Aa0.25 Ab
Pasture0.39 Ba0.34 Aa0.22 Ab
Native forest0.48 Aa0.35 Ab0.25 Ac
Equal uppercase letters in a column (for the same region and depth) do not differ significantly from each other in the Kruskal–Wallis nonparametric test (p < 0.05). Equal lowercase letters in a row (for the same land use and depth) do not differ significantly from each other in the Kruskal–Wallis nonparametric test (p < 0.05).
Table 12. Pearson’s correlation analysis between soil attributes at depths of 0 to 0.1, 0.1 to 0.2, and 0.2 to 0.4 m in the Renato River and Caiabi River watersheds, Mato Grosso state, Brazil, 2020.
PDMicroMacroTPBDPWPFCClaySiltSandAWCKsat
0.0 to 0.10 m
Particle Density1.00−0.590.20−0.390.60−0.63−0.59−0.58−0.510.62−0.27−0.02
Microporosity0.051.00−0.380.62−0.680.861.000.750.65−0.800.73−0.15
Macroporosity−0.46−0.671.000.49−0.38−0.22−0.38−0.14−0.010.10−0.420.65
Total Porosity−0.430.600.191.00−0.970.630.620.590.61−0.670.330.37
Bulk Density0.53−0.56−0.23−0.991.00−0.69−0.68−0.65−0.640.73−0.36−0.34
Perm.Wilt.Point−0.46−0.671.000.19−0.231.000.860.820.80−0.910.28−0.15
Field Capacity−0.39−0.380.750.31−0.340.751.000.750.65−0.800.73−0.15
Clay−0.34−0.550.720.05−0.090.720.161.000.54−0.940.310.01
Silt0.010.67−0.330.54−0.51−0.33−0.20−0.311.00−0.790.15−0.04
Sand−0.230.040.390.48−0.480.390.73−0.150.301.00−0.290.02
Avail.Water Cap.−0.59−0.290.800.48−0.520.800.670.54−0.150.251.00−0.01
Sat.Hyd.Cnd.(Ksat)0.320.320.330.320.310.320.32−0.01−0.030.15−0.261.00
0.10 to 0.20 m
Particle Density1.00−0.570.10−0.540.67−0.65−0.57−0.65−0.480.67−0.34−0.29
Microporosity0.131.00−0.420.80−0.810.851.000.750.64−0.800.88−0.01
Macroporosity−0.26−0.701.000.21−0.17−0.16−0.42−0.17−0.010.13−0.550.21
Total Porosity−0.180.370.401.00−0.990.810.800.700.68−0.770.590.14
Bulk Density0.32−0.34−0.42−0.991.00−0.84−0.81−0.73−0.680.80−0.58−0.20
Perm.Wilt.Point−0.26−0.701.000.40−0.421.000.850.860.75−0.920.490.04
Field Capacity−0.17−0.510.770.34−0.360.771.000.750.64−0.800.88−0.01
Clay−0.26−0.390.650.35−0.370.650.081.000.54−0.950.450.01
Silt−0.010.75−0.370.48−0.47−0.37−0.32−0.171.00−0.760.370.02
Sand−0.25−0.390.710.41−0.440.710.940.03−0.181.00−0.48−0.01
Avail.Water Cap.−0.10−0.280.740.61−0.610.740.530.570.010.431.00−0.03
Sat.Hyd.Cnd.(Ksat)0.29−0.010.210.14−0.190.03−0.010.010.01−0.01−0.261.00
0.20 to 0.40 m
Particle Density1.00−0.620.11−0.570.68−0.62−0.62−0.35−0.520.49−0.430.33
Microporosity0.331.00−0.350.83−0.840.821.000.690.61−0.790.86−0.12
Macroporosity−0.44−0.721.000.23−0.19−0.02−0.35−0.120.190.01−0.530.25
Total Porosity−0.220.180.551.00−0.990.830.830.650.74−0.820.580.02
Bulk Density0.38−0.11−0.60−0.991.00−0.85−0.84−0.65−0.750.82−0.580.03
Perm.Wilt.Point−0.44−0.721.000.55−0.601.000.820.760.71−0.880.41−0.21
Field Capacity−0.34−0.480.670.38−0.430.671.000.690.61−0.790.86−0.12
Clay−0.29−0.560.760.41−0.430.760.031.000.35−0.910.43−0.07
Silt0.020.69−0.370.30−0.29−0.37−0.31−0.231.00−0.700.33−0.04
Sand−0.42−0.480.830.60−0.640.830.930.30−0.261.00−0.470.06
Avail.Water Cap.−0.11−0.050.540.72−0.700.540.380.410.210.521.00−0.01
Sat.Hyd.Cnd.(Ksat)−0.010.75−0.340.42−0.41−0.340.32−0.180.240.21−0.201.00
Cells in blue and green colors correspond to the Renato and Caiabi watersheds, respectively. Numbers in red and black indicate significance and absence of significance at a 5% probability level in the “t-test”, respectively.
Table 13. Summary of the principal components for soil physical attributes under different land uses and occupations in the Renato River watershed, Mato Grosso state, Brazil, 2020.
Principal Component0.0 to 0.10 m0.10 to 0.20 m0.20 to 0.40 m
PC 1PC 2PC 3PC 1PC 2PC 3PC 1PC2PC 3
Eigenvalue7.052.321.127.601.710.987.491.701.13
Variation %58.7319.309.4163.3714.238.17 62.4214.199.44
AttributeCorrelation 1
Particle Density−0.7227 *−0.08590.1354−0.6891 *0.2412−0.3289−0.7029 *−0.07970.4180
Microporosity0.9441 *0.23630.19830.9535 *0.24320.06890.9554 *0.23780.1311
Macroporosity−0.0442−0.9640 *−0.0119−0.2457−0.8858 *−0.3122−0.1207−0.9523 *−0.1174
Total Porosity0.7996 *−0.52920.16590.8839 *−0.3188−0.13080.9211 *−0.30430.0681
Bulk Density−0.8665 *0.4476−0.1237−0.9085 *0.33630.0414−0.9402 *0.26380.0054
Perm.Wilt.Point0.9269 *0.1053−0.28830.9397 *−0.0470−0.10940.9170 *−0.0963−0.1819
Field Capacity0.9441 *0.23630.19830.9535 *0.24320.06890.9554 *0.23780.1311
Clay0.8569 *0.0630−0.18110.8547 *−0.0078−0.07550.7759 *−0.01010.0739
Silt0.8175 *−0.0560−0.2990.7584 *−0.1533−0.25320.7825 *−0.3278−0.1069
Sand−0.9359 *−0.02390.2470−0.9244 *0.06240.1502−0.9069 *0.1474−0.0089
Avail.Water Cap.0.46080.30610.8237 *0.7714 *0.43890.20550.7277 *0.46290.3671
Sat.Hyd.Cnd.(Ksat)0.0112−0.8213 *0.20890.0752−0.55590.7744 *−0.1301−0.40270.8491 *
1,* indicates a significant correlation in the principal component analysis.
Table 14. Summary of the principal components for soil physical attributes under different land uses and occupations in the Caiabi River watershed, Mato Grosso state, Brazil, 2020.
Principal Component0.0 to 0.10 m0.10 to 0.20 m0.20 to 0.40 m
PC 1PC 2PC 3PC 1PC 2PC 3PC 1PC2PC 3
Eigenvalue8.292.280.899.292.281.56.642.631.31
Variation %69.1318.987.4269.1418.9812.50 55.3621.9510.9
AttributeCorrelation 1
Particle Density0.9944 *0.0888−0.0385−0.6892 *0.2397−0.3186−0.4998−0.0622−0.0326
Microporosity0.9956 *0.0761−0.03880.9532 *0.24460.0699−0.5592−0.7941−0.1696
Macroporosity0.9951 *0.0817−0.0345−0.2442−0.8892 *−0.29990.9586 *0.19360.1871
Total Porosity0.9956 *0.0765−0.03530.8840 *−0.3199−0.12160.6985 *−0.68040.0635
Bulk Density0.9931 *0.0968−0.0457−0.9086 *0.33690.0350−0.7465 *0.6369−0.0605
Perm.Wilt.Point0.9954 *0.0769−0.03850.9396 *−0.0489−0.11160.9586 *0.19360.1871
Field Capacity0.9956 *0.0761−0.03880.9532 *0.24460.06990.7778 *0.1746−0.5927
Clay0.0348−0.9141 *0.06080.8543 *−0.0079−0.07120.61310.10840.7776 *
Silt0.0937−0.8572 *−0.02040.7564 *−0.1576−0.26290.9263 *0.0449−0.3576
Sand−0.58190.8091 *−0.0108−0.9245 *0.06430.15110.6571 *−0.45940.1047
Avail.Water Cap.0.9465 *−0.0131−0.06720.7698 *0.44250.2091−0.9428 *0.01410.3203
Sat.Hyd.Cnd.(Ksat)0.34890.0730.9335 *0.0716−0.54030.7866 *−0.1963−0.8949 *0.0543
1,* indicates a significant correlation in the principal component analysis.
Disclaimer/Publisher’s Note: The statements, opinions and data contained in all publications are solely those of the individual author(s) and contributor(s) and not of MDPI and/or the editor(s). MDPI and/or the editor(s) disclaim responsibility for any injury to people or property resulting from any ideas, methods, instructions or products referred to in the content.

