Effect of Biochar on Soil Greenhouse Gas Emissions at the Laboratory and Field Scales


1
Department of Soil, Water and Environmental Science, The University of Arizona, Tucson, AZ 85721, USA
2
Department of Agronomy, Iowa State University, Ames, IA 50011, USA
3
USDA-ARS, 1015 N University Blvd, Ames, IA 50011, USA
*
Author to whom correspondence should be addressed.
Soil Syst. 2019, 3(1), 8; https://doi.org/10.3390/soilsystems3010008
Submission received: 14 October 2018
/
Revised: 20 November 2018
/
Accepted: 24 December 2018
/
Published: 11 January 2019
(This article belongs to the Special Issue Formation and Fluxes of Soil Trace Gases)
Abstract
:Biochar application to soil has been proposed as a means for reducing soil greenhouse gas emissions and mitigating climate change. The effects, however, of interactions between biochar, moisture and temperature on soil CO2 and N2O emissions, remain poorly understood. Furthermore, the applicability of lab-scale observations to field conditions in diverse agroecosystems remains uncertain. Here we investigate the impact of a mixed wood gasification biochar on CO2 and N2O emissions from loess-derived soils using: (1) controlled laboratory incubations at three moisture (27, 31 and 35%) and three temperature (10, 20 and 30 °C) levels and (2) a field study with four cropping systems (continuous corn, switchgrass, low diversity grass mix and high diversity grass-forb mix). Biochar reduced N2O emissions under specific temperatures and moistures in the laboratory and in the continuous corn cropping system in the field. However, the effect of biochar on N2O emissions was only significant in the field and no effect on cumulative CO2 emissions was observed. Cropping system also had a significant effect in the field study, with soils in grass and grass-forb cropping systems emitting more CO2 and less N2O than corn cropping systems. Observed biochar effects were consistent with previous studies showing that biochar amendments can reduce soil N2O emissions under specific but not all, conditions. The disparity in N2O emission responses at the lab and field scales suggests that laboratory incubation experiments may not reliably predict the impact of biochar at the field scale.
Keywords:
biochar; greenhouse gas emissions; incubation; soil; corn; switchgrass; CO2; N2O; cropping system; diversity1. Introduction
The production and application of biochar—a carbon-rich material produced during the pyrolysis of biomass—to soil has been proposed as a means for mitigating anthropogenic greenhouse gas (GHG) emissions [1]. The Pyrolysis-Biochar Bioenergy Platform (PBBP) has the potential to mitigate GHG emissions through three primary pathways. First, bioenergy produced by PBBP will offset GHG emissions from the burning of fossil fuels and by converting photosynthetic biomass carbon (C) into recalcitrant biochar C. Indeed, pyrolysis converts 10–50% of the original biomass C into biochar C, which persists in soils for hundreds to thousands of years [1,2,3,4]. Second, biochar amendments increase soil quality, potentially increasing net primary productivity and thereby reducing economic pressure to convert native lands to agricultural production [5]. Although negative crop yield responses to biochar applications have been observed [6,7], under most circumstances biochar either increases or has no impact on crop biomass production [8,9]. Third, soil biochar applications may directly reduce GHG emissions from soils. This direct effect, however, is highly variable and difficult to model, due to: (1) the complexity of soil biogeochemical processes and interactions involving biochar amendments with soil types and soil temperature and moisture, (2) lack of knowledge regarding biochar weathering or aging in the field and (3) poor understanding of the relationship between GHG emissions measured at the lab and field scales [10,11,12]. In the United States, where upland agriculture dominates, CO2 and N2O emissions are the soil GHGs of primary concern. Thus, further examination of biochars’ impacts on upland soil CO2 and N2O emissions—especially under variable moisture and temperature conditions found in agricultural fields—is critical for modeling the potential of the PBBP to help mitigate climate change [9,11,13].
Most studies examining CO2 emissions from biochar-amended soils report either no significant effect or an increase in CO2 emissions due to biochar amendments—typically equivalent to <3% of biochar C [14]. Meta-analyses by Song et al. [15], Liu et al. [16] and He et al. [17] all report positive average effects of biochar amendments on soil CO2 emissions but the magnitude of the effects differed [15,16,17]. Both He et al. [17] and Song et al. [15] reported significant increases in CO2 emissions (19 and 22%, respectively); by contrast, Liu et al. found no significant impact of biochar on soil CO2 emissions. Differences in CO2 response likely arose from differences in the number and/or types of studies chosen. For example, Song et al., Liu et al. and He et al. [15,16,17] used 77, 167 and 402 total observations, respectively; of these, only 31, 69 and 17 were from field studies. All three meta-analyses report higher CO2 emissions from biochar-amended soils in laboratory incubations than in the field. He et al. noted an interaction between fertilizer application and study type: biochar amendment significantly increased CO2 emissions from unfertilized soil and decreased CO2 emissions from fertilized soil in the lab, whereas in the field there was no significant effect of biochar on CO2 emissions. In addition to study type effects, the meta-analyses found significant impacts of other variables including study duration, soil texture, soil pH, biochar pH, biochar feedstock and biochar application rate. Short-term CO2 emissions (<1 yr) have been shown to be influenced by both inorganic C and labile organic C in biochar [18,19], whereas there is a lack of consensus regarding long-term (>2 yr) impacts on CO2 emissions [20,21,22,23,24,25,26,27,28,29]. Explanations for long-term impacts of biochar on soil CO2 emissions include alteration of the microbial community through changes in physical habitat structure and chemical and/or physical protection of native soil organic matter by biochar [15,16,17,18,19,20,21,22,23,24,25,26,27,28,29]. Some studies suggest decreased albedo of biochar-amended soil as a mechanism for increasing CO2 emissions in field conditions but such an effect can be reduced or eliminated by crop canopies and/or residue cover [30]. Thus, while biochars appear to pose minimal risk of exacerbating soil CO2 emissions in the long term, more studies examining both field and lab results are needed to ascertain whether CO2 responses to biochar amendment observed in the lab can be used to predict CO2 responses in the field—and to accurately predict long-term CO2 emissions of biochar amended soils at the field scale.
In general, most studies have found biochar amendments to either decrease or not significantly affect soil N2O emissions; however, some reports have found increased N2O emissions following biochar amendments. A meta-analysis of biochars’ effect on N2O emissions, which included both long and short-term studies, reported that biochars reduced soil N2O emissions by 54 ± 3% at the lab scale and by 28 ± 16% at the field scale [31]. The higher variability of the field scale estimate likely reflects both lower biochar application rates as well as effects of variable climate and cropping systems in the field-scale studies compared with higher biochar application rates and controlled conditions in the lab studies. The lower magnitude of the effect of biochar on N2O emissions in the field relative to the lab studies may reflect lower rates of biochar application used in the field studies. Only ten field studies reported significant reductions in N2O emissions, five reported no significant impact and one reported a significant increase. Furthermore, all but two of the studies reporting significant changes in N2O emissions measured ≤12 months after biochar application and all studies focused on only one cropping system [32,33,34,35,36,37,38,39,40,41,42]. Recent evidence suggests that biochars’ impacts on N2O emissions may change over time as biochar ages, highlighting the need for studies comparing fresh and aged biochar, especially at the field scale [43]. In one of the few studies incorporating parallel field and laboratory experiments, Keith et al. [44] found that fresh biochar suppressed N2O emissions in the laboratory and also reduced N2O emissions in the field by a similar magnitude three years following biochar amendment to a sunflower cropping system—thereby contradicting the findings of Spokas (2013) [43]. Explanations for continued long-term suppression of N2O emissions in biochar-amended soils include alterations in microbial communities due to physical habitat changes, physical and/or chemical protection of organic C and/or N by biochar and alteration of micro-scale soil redox status due to electrochemical properties of biochars. Thus, despite numerous studies, the direction and magnitude of soil N2O emissions responses to biochar amendments remains difficult to predict at the field scale for specific cropping systems and over time.
Much research into biochar’s effects on soil CO2 and N2O emissions at the lab and field scales is challenged by confounding variables. Both soil CO2 and N2O emissions are known to be especially sensitive to soil moisture and temperature [45,46,47,48] and both biochar and soil properties also influence GHG emissions [11,17]. Indeed, He et al. found that N fertilization, soil texture, biochar pH, biochar application rate and latitude all significantly influenced CO2 emissions response ratios [17]. Similarly, multiple meta-analyses show that N2O emissions are sensitive to biochar feedstock, pyrolysis conditions, biochar C:N and H:C ratios, biochar application rate, soil pH and soil texture [11,17,31]. The impact of soil texture was additionally shown to be moisture-dependent: under low moisture conditions (<80% WFPS), biochar reduced N2O emissions from coarse to medium-textured soils, while under high moisture conditions (>80% WFPS) biochar reduced emissions from medium to fine-textured soils [11].
Published biochar literature inconsistently addresses interactions between biochar amendments and cropping systems on N2O emissions. Of the 16 field studies examined by Cayuela et al., (2015), only four examined biochar effects in multiple cropping systems [31]. Of these, three reported consistent suppression of N2O in biochar-amended maize, rice and wheat systems, whereas one reported decreased N2O emissions with biochar for two crops (broccoli and kabocha) and increased N2O emissions for one crop (bok choy) [49]. More recently, Bass et al. [50] observed reduced N2O emissions with biochar amendment in a papaya cropping system—but not in a banana cropping system. These observations clearly show the potential for cropping system factors to interact with biochar factors influencing GHG emissions but do not systematically examine what environmental or management aspects of the cropping system affect biochar-by-cropping system interactions.
The aforementioned studies do not document a consistent magnitude or direction of GHG emission responses to biochar amendment. Furthermore, a clear pattern explaining differences in responses has yet to emerge. To explain why biochar induces different GHG responses in different contexts, studies must systematically compare GHG responses to biochar amendment under multiple environmental conditions using the same soils and biochars. Currently there is in particular a lack of experiments examining the effects of biochar on soil GHG emissions impacts at the laboratory and field scales and these studies have not incorporated potentially key variables such as moisture, temperature, biochar aging and cropping system diversity. Therefore, here we analyze the impact of a mixed wood gasification biochar on soil CO2 and N2O emissions from Midwestern agricultural soil in (a) a controlled laboratory incubation at three moistures and temperatures and (b) a field study under four cropping systems. We hypothesize that (1) biochar’s impact on CO2 and N2O emissions will depend on soil moisture, temperature and cropping system, (2) biochar suppression of N2O emissions will be greater in cropping systems with higher average N2O emissions and (3) biochar amendment will have a similar effect on N2O emissions at the laboratory and field scales.
2. Materials and Methods
2.1. Biochar
The biochar used in both the field and laboratory incubation studies was from a mixture of hardwood and soft wood feedstocks (primarily Quercus, Ulmus and Carya spp. woodchips with particle sizes 0.1–20 mm) in an auger bed gasifier at 550–650 °C (ICM, Inc., Colwich, KS, USA). The biochar had a pH of 8.8 and was comprised of 55% fixed carbon, 16% volatile matter and 29% ash, with H:C and C:N molar ratios of 0.35 and 150, respectively [51]. Further information concerning this biochar, including soil impacts and chemical properties, can be found in Fidel et al. (2017a) [51].
2.2. Field Site
The field site used for this study was located at the Iowa State University Armstrong Research and Demonstration Farm in southwest Iowa. The soils at this site were loess-derived Mollisols (Ackmore-Colo-Judson, Clarinda, Exira and Marshall) and varied widely with respect to drainage class and slope. Four cropping systems were established in 50 × 68 m plots the spring of 2012 [52]: no-till continuous corn (CC), switchgrass (SG), low-diversity grass mix (LD) and high-diversity grass and forb mix (HD). The cropping systems were chosen to compare grain-based and perennial species based cellulosic bioenergy feedstocks production systems [52]. Plots were arranged in a completely randomized split plot design with four replicates for each cropping system (sixteen plots total). A split plot design was used wherein half of each plot received no biochar (control) and the other half received 9.3 Mg ha−1 (dry weight equivalent) biochar amendment of moist (~50% water by mass) biochar in the fall of 2011, which was incorporated to a depth of 15 cm (equivalent to 0.5% on an oven dry weight basis). Since the application of the biochar, the plots have been in perennial biomass crops or managed for continuous no-till maize production. Because 2012 was a drought year, the switchgrass plots failed to establish and needed to be re-planted in the spring of 2013. Thus the 2014 growing season can be considered two years after the establishment of the grass mixes (LD and HD) and one year after the establishment of SG. In 2014, fertilizer was applied to corn plots (CC) at 224 kg N ha−1 as urea ammonium nitrate (knife application in every row) on May 4th and to grass and grass-forb plots (SG, LD and HD) at 56 kg N ha−1 as urea (broadcasted application) on May 2nd; corn was planted in 76 cm rows on May 8th.
2.3. Incubation Study
The laboratory incubation study was conducted to examine the effects of biochar on CO2 and N2O emissions at three different moistures and temperatures for comparison with field study results. Soil for the incubation study was collected from the top 5 cm of the control (biochar-unamended) portion of a continuous corn (CC) plot at the Armstrong study site (Exira soil with 15% sand, 80% silt and 5% clay) prior to fertilization in the spring (2014) and frozen for 6 months. Soil was incubated with and without biochar at three soil moistures (−1, −1/3 and −1/10 bar matric potential-equivalent) and temperatures (10, 20 and 30 °C) for a total of 140 days in a full factorial design with five replicates. Prior to use, soil was thawed and sieved to <4 mm. Gravimetric moisture content was determined by oven-drying (10 g of soil for 2 hrs at 105 °C), biochar was amended at a 0.5% (wt%/wt) rate and all samples were stirred thoroughly. Moisture contents of control and biochar-amended soil at −1, −1/3 and −1/10 bar pressure were determined using a pressure plate prior to the initiation of the study and it was found that the biochar did not significantly affect soil moisture at these matric potentials. For the incubations, 10 g (dry weight equivalent) of sieved (<0.4 mm) field-moist soil was weighed into 150 mL glass serum vials. Bias may occur when using such static chamber methods but when used consistently they provide reliable relative estimates of GHG fluxes [53].
Control and biochar-amended samples were equilibrated during a pre-fertilization period for 60 days, followed by the addition of corn stover and fertilizer and then incubated for an additional 80 days. During the first two weeks of the pre-fertilization period, soil moistures were gradually adjusted from field moisture levels to the target −1, −1/3 and −1/10 bar matric potential levels (equivalent to 27, 31 and 35% wt%/wt moisture). During this pre-fertilization period, CO2 and N2O emissions were quantified on days 0, 2, 6, 9, 20, 23, 30, 36 and 56. After 60 days, corn stover was mixed in at 0.5% (wt%/wt) and fertilizer was added as NH4NO3 and K2HPO4 at a rate equivalent to 72, 42 and 54 mg/kg of N, P and K, respectively. Soils were incubated for an additional 80 days following fertilization, during which time emissions were quantified on days 0, 1, 2, 3, 7, 10, 16, 38, 52, 62 and 80. For each gas flux rate measurement, serum vials containing soil and biochar were sealed with grey butyl septa and crimp caps and 11.5 mL gas samples were collected from these serum vials using a syringe three times over the course of 16 to 48 h, with longer gas accumulation times used when flux rates were low (includes a time zero measurement). Serum vials were left uncapped for 15–20 min prior to each flux rate measurement to allow for gas circulation; vials were capped at all other times to minimize moisture loss.
2.4. Field Study
Emission rates of CO2 and N2O from soil under four cropping systems with and without biochar were quantified during the 2014 growing season at the Armstrong field site. Prior to fertilization and corn planting, two stainless steel pans (49 × 29 cm; 10 cm high and 10 cm deep) were installed in each split plot (4 per plot). Pans were designed and installed based on the GRACEnet Protocol [53] and included insulation as well as a small vent hole [54]. The bottom of each pan was cut out to allow upward gas flow from soil below. Pans within each split plot were 17 m apart and pans in opposite split plots were 26.4 m apart (each was 13.2 m from the boundary between split plots). Pans in CC plots were removed prior to fertilization and planting and re-installed afterwards; care was taken to avoid installing pans in disturbed soil. Following fertilizer application, all pans in CC plots were placed along the fertilized band, such that the longer edge of each pan was parallel to the strip of fertilized soil located within the pan. This orientation allowed each pan to have the same number of corn stalk stumps from the previous growing season. To minimize the effect of root respiration and root exudates, soil within each pan and in a 50 cm radius around each pan was kept free of plants using a combination of gentle hand-weeding and hand-spraying with both pre-and post-emergent herbicides. Care was taken not to disturb soil within the pans. Following pan installation, greenhouse gas emissions were measured regularly from April 21st to September 16th (days 0, 14, 22, 29, 38, 45, 50, 60, 72, 79, 86, 93, 109, 120 and 148). These dates reflect more frequent measurements during periods of expected high GHG emission rates directly following fertilizer application and rainfall. Gas sampling dates were chosen so as to capture post-rainfall fluxes while avoiding saturated soil conditions. Plots—arranged spatially at random—were organized into four temporal blocks, with one plot of each cropping system in each block and gas samples from every plot within a block were taken within one hour of each other to minimize diurnal temperature variability within each block. Soil moisture (% by volume) and temperature (°C) were measured at each pan location at 5 cm depth concurrently with gas sampling (using a Delta ML3 ThetaProbe with 1% accuracy and a digital soil thermometer, respectively). To quantify emission rates, pans were covered with an insulated pan lid and clamped down to form an airtight seal, then gas samples were collected at four times with a syringe through a grey butyl septum installed in the lid of the pan and average gas accumulation time was 30–90 min (longer times were used on days with lower expected emission rates). Gas samples were stored and analyzed in the same manner as in the incubation study (see above). At the conclusion of the field study, soil was destructively harvested from within the GHG sampling pans (0–5 cm depth) and analyzed for total C and N (Vario Microcube).
2.5. Gas Sample Analysis
All gas samples collected in the lab and field were stored in helium-flushed and evacuated airtight 6 mL Exetainer vials and then analyzed for CO2 and N2O using a gas chromatograph equipped with a Methanizer flame ionization detector and an electron capture detector (SRI Instruments, Torrance, CA 90503, USA; Model 8610C). Concentrations were measured in volume ppm units and converted to mass ppm units using the ideal gas law. Following termination of the incubation, soil samples were oven dried and analyzed for total C and total N using a combustion analyzer (Vario Microcube, Elementar).
2.6. Calculations and Statistical Analyses
Gas fluxes were calculated from the slope of the linear increase in gas concentrations over time [55] and any slopes with r2 <0.5 were assumed to be zero [56]. Additionally, a limit of detection was calculated based on Parkin et al. (2012) and any fluxes lower than the limit of detection were also assumed to be zero [57]. Among each set of replicates, outliers (identified using a Q test) were furthermore deleted. Cumulative emissions were calculated by interpolating linearly between daily fluxes (“trapezoidal interpolation”). All statistical analyses were conducted using SAS (v. 9.2). Daily gas fluxes (field and laboratory), soil moistures (field only) and soil temperatures (field only) were compared using repeated measures (ante-dependence and compound symmetry models, as appropriate). For the statistical analysis of field data, plots were divided into four blocks (one of each crop treatment per block) based on in-field sampling times to reduce variance due to diurnal temperature fluctuations. Tests of effects contrasts were performed using proc mixed (differences of least squares means, slice = day). Accumulated gas fluxes measured over the entire season or incubation period were compared using ANOVA. Significance was evaluated at p = 0.05.
3. Results
3.1. Soil Laboratory Incubation
Daily emission rates for CO2 during the 60-day pre-fertilization period varied over time and were generally higher at higher temperatures and moistures (Figure S1a). On most days, higher moisture treatments within each temperature had higher emission rates. The effect of biochar over time was inconsistent, such that biochar-amended soils had higher emissions some days, whereas controls has higher emissions on other days. Cumulative total emissions during this period increased with increasing moisture and temperature (Table S1). However, the effect of biochar was less consistent: biochar-amended soils had higher CO2 emissions than controls for 7 out of 9 moisture×temperature combinations; emissions were lower for biochar-amended soils at 20 °C with 27% moisture and at 30 °C with 30% moisture.
Over the course of the 80-day post-fertilization incubation, daily CO2 emissions increased significantly (p < 0.05) with increasing temperature (10 °C < 20 °C < 30 °C) and this effect was consistent over time and among different moisture and biochar treatments (Table 1, Figure 1). By contrast, the effects of soil moisture treatments on CO2 emissions were variable post-fertilization. While the main effect of moisture was significant (p < 0.05, Table S4), on some days emissions increased with increasing moisture while on other days they decreased (Figure 1, Table S1). Furthermore, the response to moisture was inconsistent across temperature and biochar treatments. The lack of a consistent moisture response may have been in part due to the small difference in percent moisture (8%) between the highest and lowest moisture treatments. In spite of the variability in daily emissions, both temperature and moisture had positive effects on cumulative CO2 emissions and the temperature*moisture interaction was significant (Table S4). However, the main effect of biochar and interaction effects including biochar (biochar*moisture, biochar*temperature, etc.), had no significant effect on cumulative post-fertilization CO2 emissions.
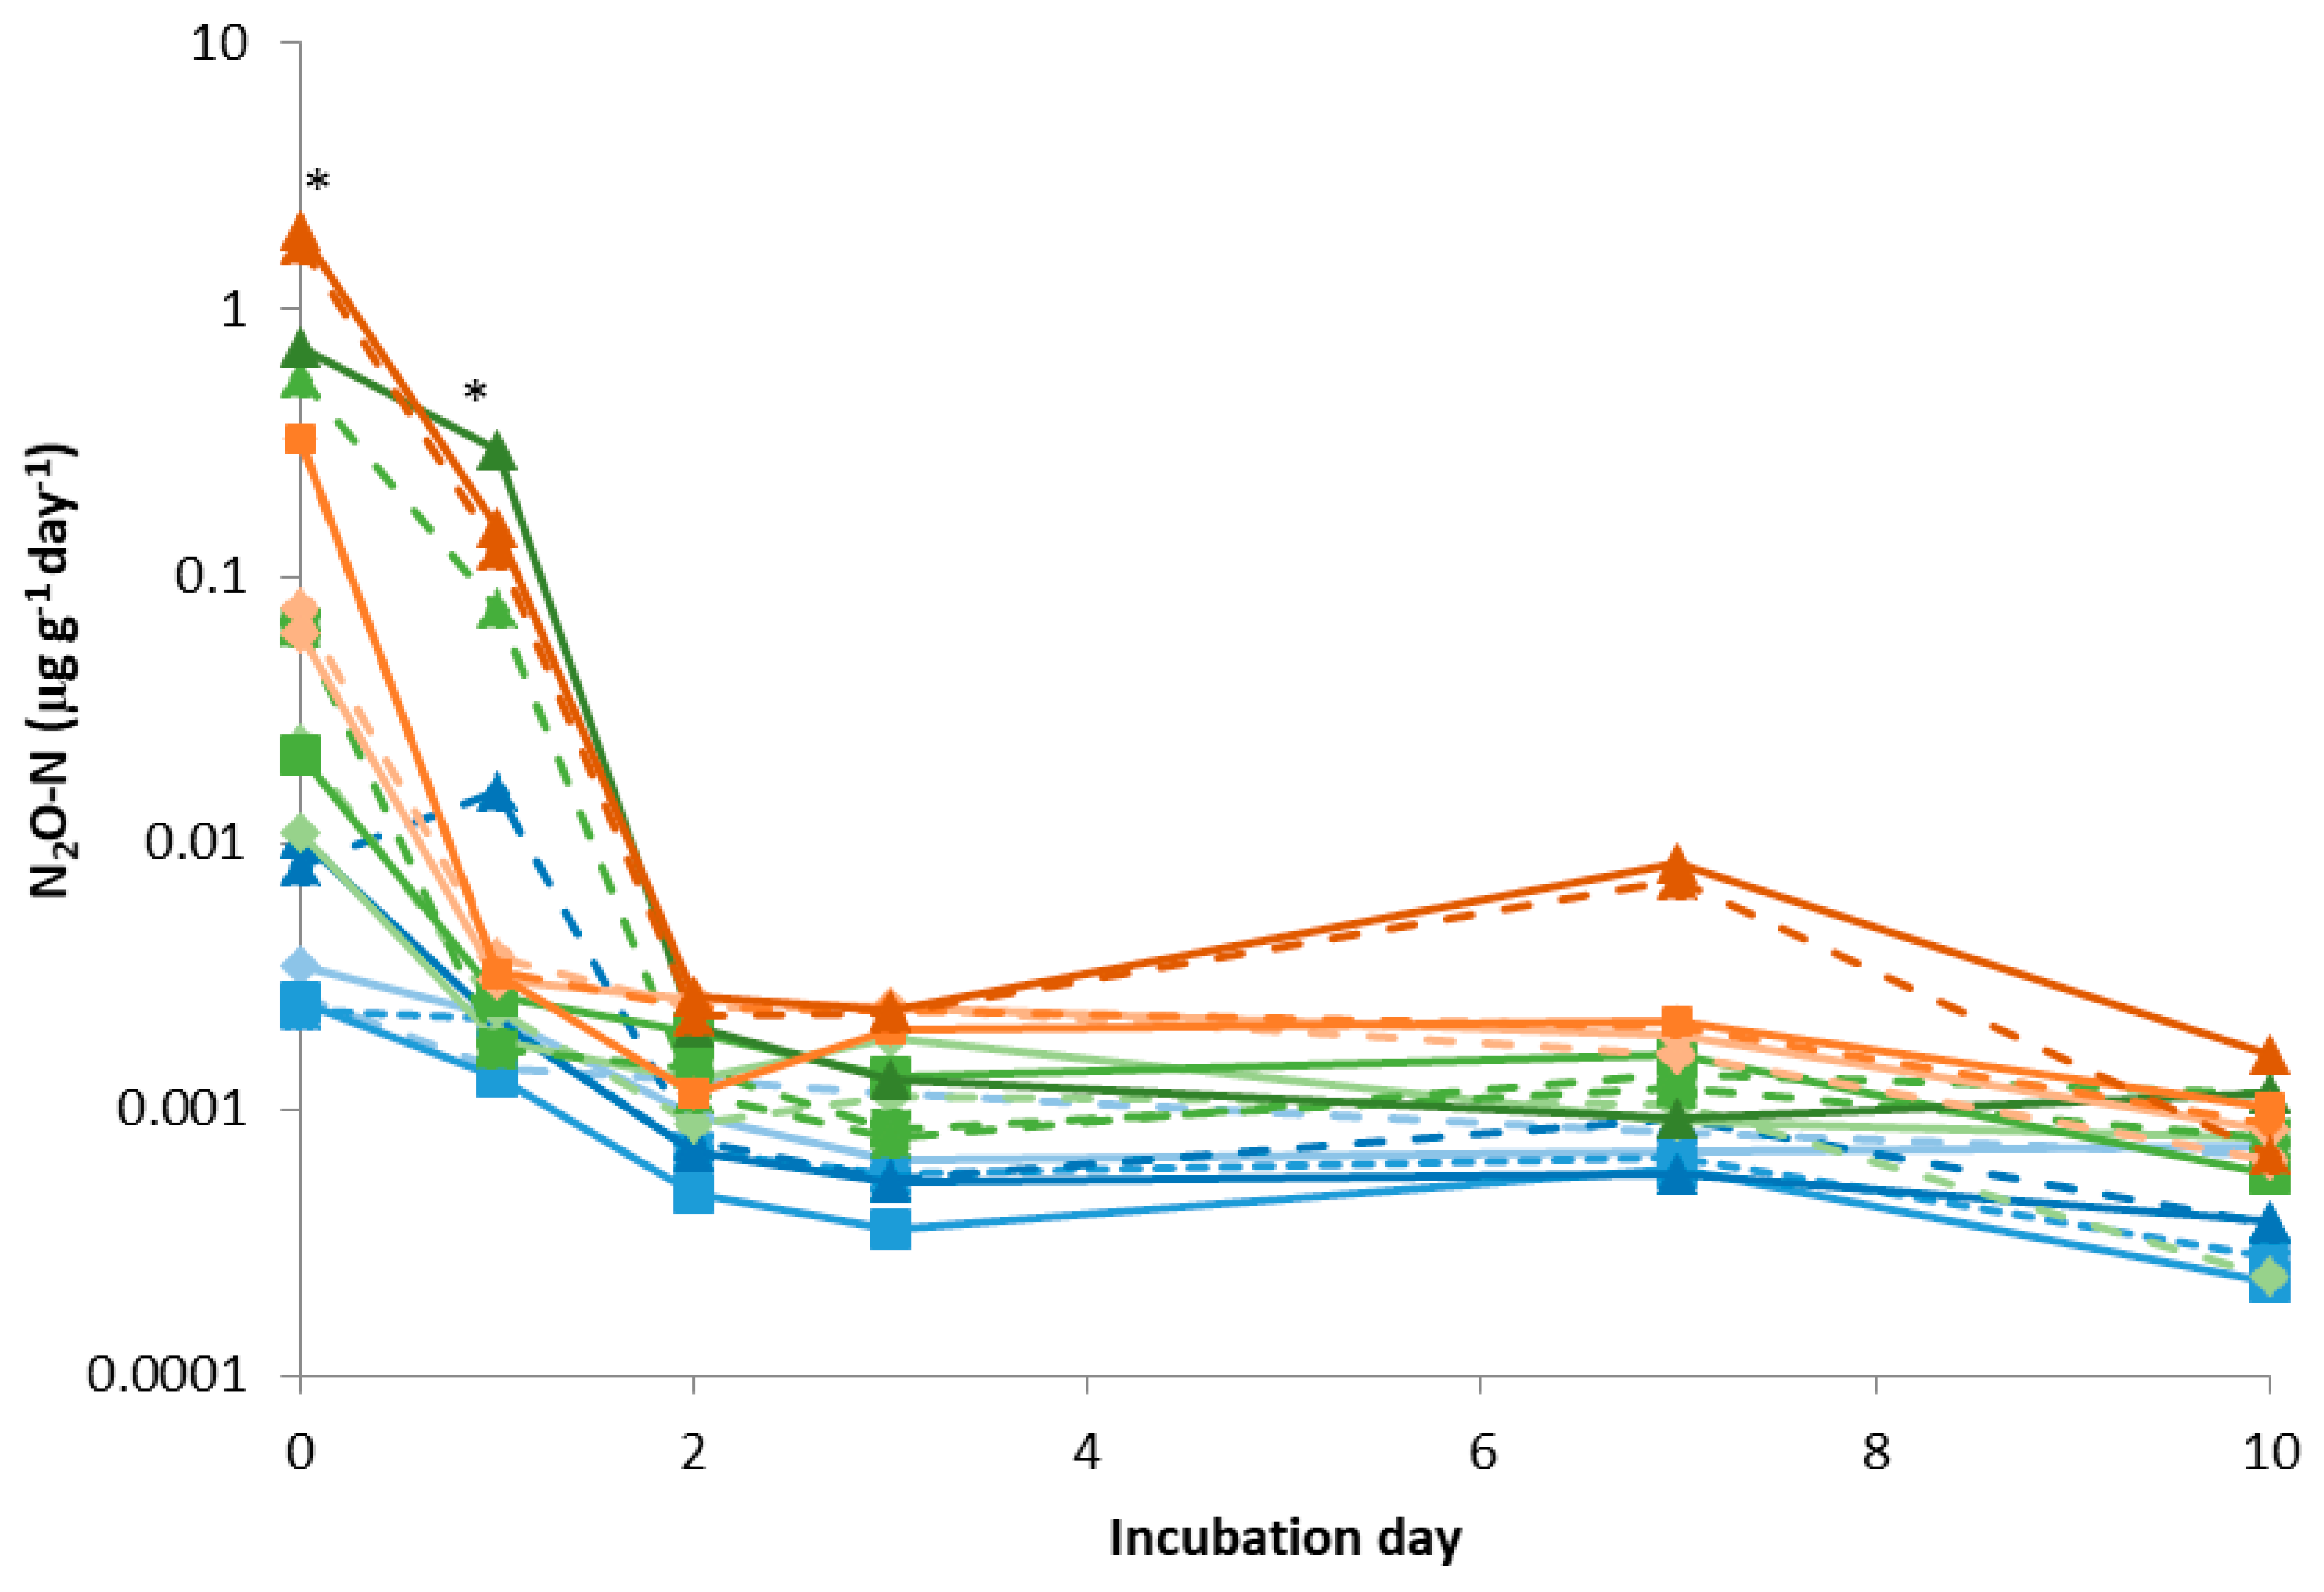
The majority of soil sample N2O emissions were negligible (within one standard deviation of zero) during the pre-equilibration period (Figure S1b, Table S3), then became greater than zero during the first 10 days of the incubation after fertilization; however, N2O emissions fell below the pre-fertilization emission rates after day 10. Hence, only emissions during the first 10 days following fertilization are presented in Figure 2 and considered in the statistical analysis of N2O emissions shown in Table S4. Temperature, moisture and day significantly affected daily N2O emissions following fertilization but biochar amendment did not have a significant impact. Similar to daily emissions, the main effects of temperature and moisture as well as the temperature*moisture interaction on N2O accumulated over the first 10 days were all significant and the main effect of biochar was not significant (p > 0.05; Table 1, Table S4). The biochar*temperature*moisture, biochar×temperature and biochar×moisture interactions were also not significant. Although the biochar effect was not significant, biochar amendment did reduce total N2O emissions by 50% at 20 °C and 31% moisture, a result consistent with a previous study using the same biochar and soil [51]. Thus, both moisture and temperature significantly affected CO2 and N2O emissions; overall results suggest that biochar amendment presents a minimum potential for increasing CO2 and N2O emissions and may reduce N2O emissions under specific contexts including moderate temperatures and moistures.
Average total C and N of soil collected from within the GHG sampling pans (5 cm depth) are shown in Table 2. Biochar consistently increased total C but did not affect total N. Cropping system also had a minimal impact on total C and N, although the soil from switchgrass (SG) plots did have slightly higher total C than soil from continuous corn (CC) plots.
Total rainfall for the study period was 726 mm (Figure 3). Total rainfall from April through September was 949 mm, higher than the 624 mm 30-year average rainfall of the field site for this period. Major rainfall events (>40 mm) occurred on days 21, 44, 129 and 142.
The main effects of crop, day and block (representing plot location and sampling time group) on 5 cm soil temperatures were all significant (5 cm depth) but the effect of biochar was not significant (Figure S4; Table S8). Average soil temperatures were highest in the high diversity (HD) plots, followed by low diversity (LD), SG and CC plots. The differences in soil temperatures among cropping systems likely resulted from differences in canopy cover. Grass and grass-forb plots had less average canopy cover over the growing season because grasses were slower-growing than corn and the LD and HD plots contained weedy areas with less canopy cover near the gas sampling pans (visual observation). In addition, the HD plots were mowed on day 120 to minimize weed proliferation, which further decreased canopy cover. By contrast, the average difference in temperature between the biochar-amended and unamended soils was negligible (<0.1 °C). Thus cropping system had a dominant effect on soil temperature, which likely plays a role in cropping systems’ influence on soil GHG emissions.
The main effects of crop, biochar, day and block on moisture were all significant (5 cm depth) (p < 0.05) (Figure 3; Table S8). The crop*biochar*day interaction was significant on eight out of 15 measurement days. Soil moisture tended to be highest in SG plots and lowest in HD plots but the effect of cropping system was somewhat variable over time. The LD plots exhibited the greatest increase in moisture with biochar amendment, followed by SG, CC and HD; when moistures were averaged over all measurement dates, biochar increased average moisture by 1–3% within each cropping system. Differences in soil moisture between biochar-amended and control soils within each cropping system were generally greater on days with lower average soil moisture; biochar increased soil moisture for at least three out of four cropping systems when control soils had ≤30% moisture on average. Biochar was especially effective at increasing soil moisture during a dry period occurring from mid-July through mid-August (days 72–93). Thus, the results show that biochar consistently increased average soil moisture (at 5 cm depth) and was generally most effective at increasing soil moisture in plots with higher grass density (LD and SG) and during soil drying cycles.
3.2. Field Study: CO2 Emissions
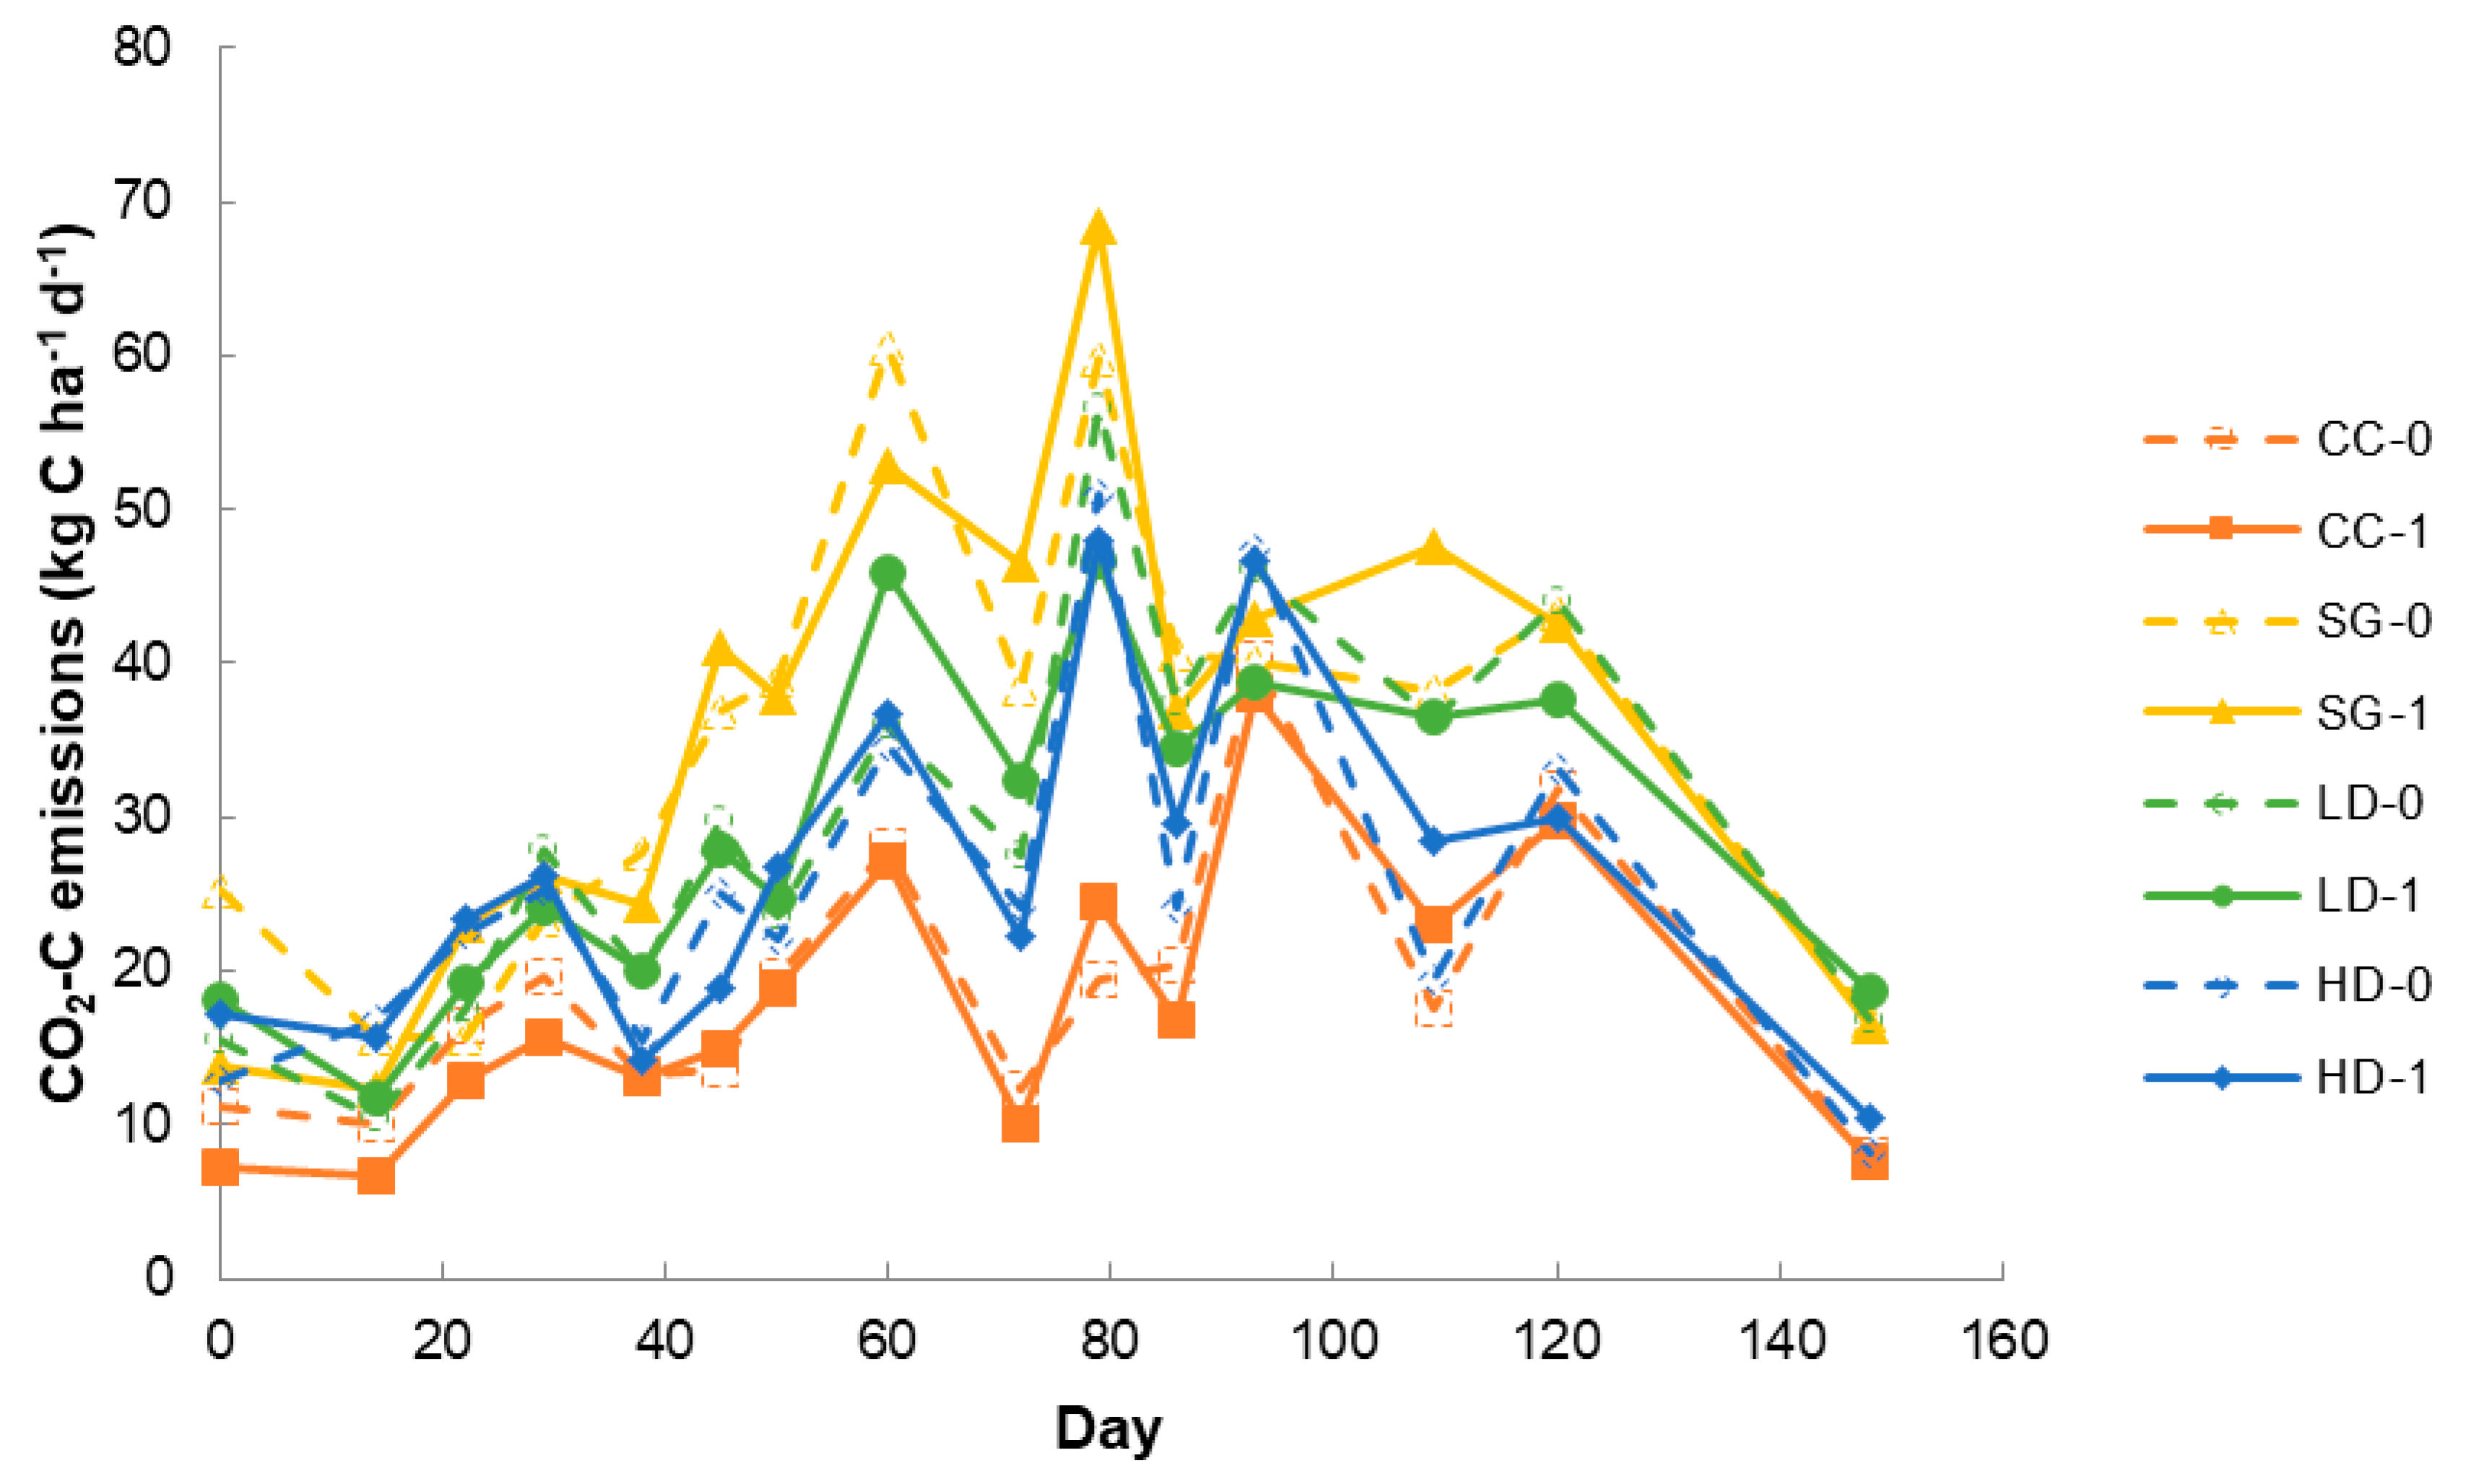
Daily soil CO2 emissions were significantly affected by day, crop and block (spatial and diurnal variability) but not by biochar (Figure 4; Table S6). Transient significant differences were observed between biochar-amended and control soils within the SG and LD cropping systems but these effects were inconsistent. Compared with controls, significantly higher CO2 emissions were measured from biochar-amended soils on some days and on other days emissions from biochar-amended soils were lower than controls. On average, daily CO2 emissions increased in the order CC < HD~LD < SG (Figure 4) and this trend was reflected in the cumulative total CO2 emissions (Figure 5).
Similar to daily emissions, the effect of crop on cumulative total CO2 emissions over the 148-day gas monitoring period was significant but the effect of biochar and the crop*biochar interaction were not significant (Table S7). Differences in CO2 emissions among cropping systems were likely due to differences in root or biomass density and resultant differences in labile soil organic carbon. Additionally, differences in fertilizer application rates and canopy cover might also have influenced CO2 emissions. Thus, overall, CO2 emissions were significantly affected by cropping system as well as spatial (block) and temporal (block and day) variables but not by biochar.
3.3. Field Study: N2O Emissions
While the main effect of biochar on daily soil N2O emissions was not significant, the crop*block*day and block*biochar*day interactions were significant (Figure 6, Table S6). The main effects of day, crop and block were also significant (“block” encompasses spatial and diurnal variability; see methods). Emission rates from CC soils were highest directly following fertilizer application (day 22) and decreased rapidly thereafter, whereas emissions from grass system soils were elevated for a longer period (days 38-60). Differences in observed fertilizer response time are likely due to respective differences in fertilizer type (UAN vs. urea) and/or application rate (224 vs. 50 kg N ha−1). For select measurements made during the first six weeks following fertilization (days 22, 29 and 60), biochar-amended CC soils had significantly lower N2O emissions (0.04–0.06 kg N2O ha−1) than control CC soils (0.06–0.1 kg N2O ha−1). Similarly, biochar-amended SG soils had significantly lower N2O emissions than control SG soils on days when emissions from SG plots were elevated (0.04–0.06 kg N2O ha−1). The ~40% suppression of N2O emissions from biochar-amended CC soils observed when emissions were elevated often occurred despite higher soil moistures in biochar-amended soils relative to control soils (days 22–38 and 60). Daily N2O emissions also tended to increase in the order HD<LD<SG<CC prior to day 80 but after day 100, SG soils tended to emit more N2O than CC soils. Overall, biochar amendment consistently suppressed short-term N2O emissions from CC cropping systems and less consistently suppressed emissions from SG cropping systems.
With regards to total N2O emissions accumulated over the 148-day emission monitoring period, the main effects of crop and block were significant (Figure 7, Table S7). Total N2O emissions increased with increasing biomass production and increasing fertilizer application rate (HD ≤ LD < SG ≤ CC). Biochar reduced N2O emissions from CC soils by 27%. To summarize, biochar did not significantly affect total N2O emissions but did temporarily suppress emissions in the treatment receiving the most fertilizer (CC) during the first month following fertilization.
4. Discussion
Among the laboratory-incubated soils and field-scale cropping system soils investigated here, biochar had no significant effect on cumulative soil CO2 emissions but did reduce N2O emissions for a no-till continuous corn cropping system (it should be noted that emissions during the 60-day pre-fertilization period are excluded from this discussion as they reflect short-term trends only, likely arising from mineralization and hydrolysis of labile biochar C [58-59]). Post-fertilization incubation data support previous research showing that long-term (>2 months) soil CO2 emissions measured in the lab are often unaffected by biochar amendments [10,18,58]. The lack of effect of biochar on soil CO2 emissions here measured 3 years after the biochar amendment in the field likewise supports previous observations that the impact of biochar on field soil CO2 emissions is predominately restricted to the short term (<2 months) in the field [51,59]. Also consistent with previous laboratory results, biochar reduced N2O emissions at 20 °C with 27% and 31% moisture. Although non-significant, the magnitude of reduction (38–56%) was in agreement with literature values [31]. In the field study, biochar reduced N2O emissions from soils under continuous corn by an average of 27%; this magnitude of suppression was consistent with average reduction of 28% reported for field studies by Cayuela et al., (2015) [31].
Despite 27% suppression of N2O emissions in biochar-amended CC soil at the field scale, the emissions measured at the laboratory scale were not consistently suppressed for the three temperature and moisture levels studied. Apparent differences in N2O emissions results between lab-scale and field-scale studies may have arisen from slight differences in study design between the lab and field, such as (a) environmental factors present in the field only, including temperature and moisture fluctuations and biological inputs, (b) differences in fertilizer type and distribution in the soil between the lab and field experiments, (c) differences in physical or biochemical properties between the soil stored and sieved in the lab for incubation and the field soils and (d) differences in properties between the fresh biochar added in the incubation compared with the aged biochar present in the field study (since plant roots were excluded from field study pans and no plants were grown in the incubation, the influence of plants on result differences should have been minimal). The first factor includes wetting and drying cycles as well as a wider range of moistures which were not imposed in the laboratory. For example, soil moisture in the field following rainfall often exceeded the 35% moisture imposed in the lab. The third factor (soil properties) encompasses natural variability in soil properties present at the field scale—namely, that emissions results at the field scale were averaged across four plots per crop, whereas soil for the incubation was collected from a single plot. Furthermore, due to the inherent variability of N2O emissions, the possibility that type II statistical errors obscured significant differences in the incubation study cannot be excluded. Moreover, Cayuela et al. (2013) found that, in studies using biochar application rates of <1% and NH4NO3 fertilizer, biochar was less likely to significantly suppress N2O emissions compared with studies using other fertilizers and/or higher biochar application rates (here NH4NO3 was used in the lab and UAN was used in the field corn plots) [12]. Lastly but perhaps most importantly, the biochar in the field study had been weathering in the soil for 2.5 years before the study began. Generally, biochar aging in soils or other aqueous environments is associated with an increase in oxygen functional groups and a decrease in soluble biochar components such as salts, carbonates and low molecular weight organic compounds. Moreover, Spokas (2013) found that fresh biochar reduced soil N2O emissions, whereas field-aged biochar did not [43]. Indeed, the experimental design of this study compares aged biochar in the field with fresh biochar in the lab and demonstrates the need for further field and lab research using aged and fresh biochars. Thus, apparent scaling effects on emissions may be attributed to spatial variability, environmental factors, experimental design differences, and/or aging of biochar.
Cumulative cropping system N2O emissions were, as expected, highest for continuous corn and tended to decrease with increasing plant species diversity and decreasing fertilizer application rate (HD≤LD<SG≤CC). Grass-based cropping systems tended to have lower N2O emissions than continuous corn cropping systems, most likely due to the lower fertilizer application rate (56 kg N ha−1) for the grass and grass-forb plots (SG, HD and LD) compared with the corn plots (224 kg N ha−1). Lower emissions in the grass mix plots (LD and HD) compared with switchgrass may have been a result of mixed grasses and forbs taking up N over a broader range of the growing season than switchgrass alone. Alternatively, lower labile organic carbon inputs to the soil (due to lower crop biomass production) in the LD and HD plots may have decreased the supply of carbon to N2O-producing microbes [60]. Lastly, lower N2O emissions from grass system soils might have been influenced by lateral movement of inorganic nitrogen from within the gas measurement pans to the roots of plants growing >50 cm away from the pans but this possibility cannot be confirmed with the available data.
Biochar either reduced or did not affect soil N2O emissions at the field scale in spite of the increased soil moisture of biochar-amended soils. Compared with controls, soil moisture averaged over the whole growing season was consistently 1–3% higher in biochar-amended soils for all cropping systems and this finding supported previous laboratory and field-scale evidence for biochar increasing soil moisture [60,61,62,63]. Increased soil moisture is known to contribute to elevated soil N2O emissions [48,64] and increased N2O emissions with increasing soil moisture was also observed in the laboratory incubation conducted here. Biochar may have reduced N2O emissions in part by reducing the moisture sensitivity of soil N2O production—the degree to which emissions increase with increasing moisture. Indeed, Deng et al., (2015) observed that biochar amendment reduced the moisture sensitivity of soil N2O emissions and posited that reduced moisture sensitivity arises from the synergistic impact of multiple soil properties influenced by biochar. For example, biochar may have decreased soil bulk density and increased the absorption capacity for organic molecules and nutrients, thereby simultaneously increasing oxygen availability and decreasing the availability of substrates to nitrate and nitrite-reducing microbes—two conditions that could reduce the sensitivity of N2O emissions to changes in soil moisture.
In summation, while the results did not indicate an effect of biochar on long-term (>60 days) soil CO2 emissions, they did support our hypotheses that biochar would affect N2O emissions and that biochar’s suppression of N2O emissions would be greatest in continuous corn cropping systems. Results also supported the hypothesis that soil moisture and temperature would influence CO2 and N2O emissions. However, the results did not support the hypothesis that laboratory studies using fresh biochar could predict the impact of aged biochar on field-scale soil N2O emissions. Furthermore, although substantial in magnitude (27%) for the entire growing season, N2O emissions suppression in the field was only significant in the short term following fertilization. These findings also support previous observations of reduced moisture sensitivity of N2O emissions in biochar-amended soil and of differing effects of aged versus fresh biochars [43,65]. More research is needed to determine the mechanism(s) by which biochar reduced N2O emissions under field and laboratory conditions and how or if emissions impacts depend on additional contextual factors not examined here.
Supplementary Materials
The following are available online at https://www.mdpi.com/2571-8789/3/1/8/s1, Figure S1: Daily soil emissions from laboratory incubation, Figure S2: Cumulative N2O emissions from laboratory incubation; Figure S3: Final NH4+ and NO3− concentrations; Table S1: Accumulated total CO2 emissions during pre-fertilization period; Table S2 Table S2 Daily post-fertilization CO2 emissions (same data as Figure 1); Table S3 Daily post-fertilization N2O emissions (same data as Figure 2); Table S4: Repeated measures statistical results from soil incubation; Table S5: ANOVA statistical results from soil incubation; Table S6: Repeated measures statistical results from daily field emissions data; Table S7: ANOVA statistical results from cumulative field emissions data; Table S8: Repeated measures statistical results from analysis of daily soil moisture and temperature data measured in the field.
Author Contributions
All authors conceived and designed the experiment; R.B.F performed the experiment and analyzed data; R.B.F. wrote the paper with input from all co-authors.
Funding
Funding for this research was provided by Global Climate and Energy Project, Stanford Subaward Agreement No. 640 60413992-112883-A and by the USDA National Institute of Food and Agriculture under Agriculture and Food Research Initiative Competitive Grant No. 2013-67011-21156 and under CenUSA Competitive Grant no. 2011-68005-30411.
Acknowledgments
We acknowledge Samuel Rathke for assistance with laboratory and field work, as well as Michael Castellano, Larry Halverson, Michael Thompson and Javed Iqbal for their insights and suggestions. We furthermore thank Ken Moore for assistance with statistical analysis.
Conflicts of Interest
The authors declare no conflict of interest.
References
- Lehmann, J.; Gaunt, J.; Rondon, M. Bio-Char Sequestration in Terrestrial Ecosystems—A Review. Mitig. Adapt. Strateg. Glob. Chang. 2006, 11, 395–419. [Google Scholar] [CrossRef]
- Lehmann, J. A Handful of Carbon. Nature 2007, 447, 143–144. [Google Scholar] [CrossRef] [PubMed]
- Laird, D.A. The Charcoal Vision: A Win–win–win Scenario for Simultaneously Producing Bioenergy, Permanently Sequestering Carbon, while Improving Soil and Water Quality. Agron. J. 2008, 100, 178. [Google Scholar] [CrossRef]
- Roberts, K.G.; Gloy, B.A.; Joseph, S.; Scott, N.R.; Lehmann, J. Life Cycle Assessment of Biochar Systems: Estimating the Energetic, Economic, and Climate Change Potential. Environ. Sci. Technol. 2010, 44, 827–833. [Google Scholar] [CrossRef] [PubMed]
- Kauffman, N.; Dumortier, J.; Hayes, D.J.; Brown, R.C.; Laird, D.A. Producing Energy While Sequestering Carbon? The Relationship between Biochar and Agricultural Productivity. Biomass Bioenergy 2014, 63, 167–176. [Google Scholar] [CrossRef]
- Jeffery, S.; Abalos, D.; Spokas, K.A.; Verheijen, F.G.A. Biochar Effects on Crop Yield. In Biochar for Environmental Management: Science, Technology and Implementation; Routledge: Abingdon, UK, 2015; pp. 301–326. [Google Scholar]
- Crane-Droesch, A.; Abiven, S.; Jeffery, S.; Torn, M.S. Heterogeneous Global Crop Yield Response to Biochar: A Meta-Regression Analysis. Environ. Res. Lett. 2013, 8, 044049. [Google Scholar] [CrossRef]
- Biederman, L.A.; Harpole, W.S. Biochar and Its Effects on Plant Productivity and Nutrient Cycling: A Meta-Analysis. GCB Bioenergy 2013, 5, 202–214. [Google Scholar] [CrossRef]
- Woolf, D.; Amonette, J.E.; Street-Perrott, F.A.; Lehmann, J.; Joseph, S. Sustainable Biochar to Mitigate Global Climate Change. Nat. Commun. 2010, 1, 1–9. [Google Scholar] [CrossRef]
- Spokas, K.A.; Reicosky, D.C. Impacts of Sixteen Different Biochars on Soil Greenhouse Gas Production. Ann. Environ. Sci. 2009, 3, 179–193. [Google Scholar]
- Cayuela, M.L.; van Zwieten, L.; Singh, B.P.; Jeffery, S.; Roig, A.; Sánchez-Monedero, M.A. Biochar’s Role in Mitigating Soil Nitrous Oxide Emissions: A Review and Meta-Analysis. Agric. Ecosyst. Environ. 2014, 191, 5–16. [Google Scholar] [CrossRef]
- Cayuela, M.L.; Sánchez-Monedero, M.A.; Roig, A.; Hanley, K.; Enders, A.; Lehmann, J. Biochar and Denitrification in Soils: When, How Much and Why Does Biochar Reduce N2O Emissions? Sci. Rep. 2013, 3, 1–7. [Google Scholar] [CrossRef] [PubMed]
- Archontoulis, S.V.; Huber, I.; Miguez, F.E.; Thorburn, P.J.; Rogovska, N.; Laird, D.A. A Model for Mechanistic and System Assessments of Biochar Effects on Soils and Crops and Trade-Offs. GCB Bioenergy 2016, 8, 1–18. [Google Scholar] [CrossRef]
- Saarnio, S. Impacts of Biochar Amendment on Greenhouse Gas Emissions from Agricultural Soils. In Agricultural and Environmental Applications of Biochar: Advances and Barriers; Soil Science Society of America, Inc.: Madison, WI, USA, 2015; pp. 1–36. [Google Scholar]
- Song, X.; Pan, G.; Zhang, C.; Zhang, L.; Wang, H. Effects of Biochar Application on Fluxes of Three Biogenic Greenhouse Gases: A Meta-Analysis. Ecosyst. Heal. Sustain. 2016, 2, e01202. [Google Scholar] [CrossRef]
- Liu, S.; Zhang, Y.; Zong, Y.; Hu, Z.; Wu, S.; Zhou, J.; Jin, Y.; Zou, J. Response of Soil Carbon Dioxide Fluxes, Soil Organic Carbon and Microbial Biomass Carbon to Biochar Amendment: A Meta-Analysis. GCB Bioenergy 2016, 8, 392–406. [Google Scholar] [CrossRef]
- He, Y.; Zhou, X.; Jiang, L.; Li, M.; Du, Z.; Zhou, G.; Shao, J.; Wang, X.; Xu, Z.; Hosseini Bai, S.; et al. Effects of Biochar Application on Soil Greenhouse Gas Fluxes: A Meta-Analysis. GCB Bioenergy 2016, 1–13. [Google Scholar] [CrossRef]
- Jones, D.L.; Murphy, D.V.; Khalid, M.; Ahmad, W.; Edwards-Jones, G.; DeLuca, T.H. Short-Term Biochar-Induced Increase in Soil CO2 Release Is Both Biotically and Abiotically Mediated. Soil Biol. Biochem. 2011, 43, 1723–1731. [Google Scholar] [CrossRef]
- Cross, A.; Sohi, S.P. The Priming Potential of Biochar Products in Relation to Labile Carbon Contents and Soil Organic Matter Status. Soil Biol. Biochem. 2011, 43, 2127–2134. [Google Scholar] [CrossRef]
- Bruun, S.; Clauson-Kaas, S.; Bobuľská, L.; Thomsen, I.K. Carbon Dioxide Emissions from Biochar in Soil: Role of Clay, Microorganisms and Carbonates. Eur. J. Soil Sci. 2014, 65, 52–59. [Google Scholar] [CrossRef]
- Farrell, M.; Kuhn, T.K.; Macdonald, L.M.; Maddern, T.M.; Murphy, D.V.; Hall, P.A.; Singh, B.P.; Baumann, K.; Krull, E.S.; Baldock, J.A. Microbial Utilisation of Biochar-Derived Carbon. Sci. Total Environ. 2013, 465, 288–297. [Google Scholar] [CrossRef]
- Fang, Y.; Singh, B.; Singh, B.P.; Krull, E. Biochar Carbon Stability in Four Contrasting Soils. Eur. J. Soil Sci. 2014, 65, 60–71. [Google Scholar] [CrossRef]
- Lin, X.W.; Xie, Z.B.; Zheng, J.Y.; Liu, Q.; Bei, Q.C.; Zhu, J.G. Effects of Biochar Application on Greenhouse Gas Emissions, Carbon Sequestration and Crop Growth in Coastal Saline Soil. Eur. J. Soil Sci. 2015, 66, 329–338. [Google Scholar] [CrossRef]
- Lu, W.; Ding, W.; Zhang, J.; Li, Y.; Luo, J.; Bolan, N.; Xie, Z. Biochar Suppressed the Decomposition of Organic Carbon in a Cultivated Sandy Loam Soil: A Negative Priming Effect. Soil Biol. Biochem. 2014, 76, 12–21. [Google Scholar] [CrossRef]
- Smith, J.L.; Collins, H.P.; Bailey, V.L. The Effect of Young Biochar on Soil Respiration. Soil Biol. Biochem. 2010, 42, 2345–2347. [Google Scholar] [CrossRef]
- Zimmerman, A.R.; Gao, B.; Ahn, M.-Y. Positive and Negative Carbon Mineralization Priming Effects among a Variety of Biochar-Amended Soils. Soil Biol. Biochem. 2011, 43, 1169–1179. [Google Scholar] [CrossRef]
- Whitman, T.; Enders, A.; Lehmann, J. Pyrogenic Carbon Additions to Soil Counteract Positive Priming of Soil Carbon Mineralization by Plants. Soil Biol. Biochem. 2014, 73, 33–41. [Google Scholar] [CrossRef]
- Keith, A.; Singh, B.; Singh, B.P. Interactive Priming of Biochar and Labile Organic Matter Mineralization in a Smectite-Rich Soil. Environ. Sci. Technol. 2011, 45, 9611–9618. [Google Scholar] [CrossRef] [PubMed]
- Watzinger, A.; Feichtmair, S.; Kitzler, B.; Zehetner, F.; Kloss, S.; Wimmer, B.; Zechmeister-Boltenstern, S.; Soja, G. Soil Microbial Communities Responded to Biochar Application in Temperate Soils and Slowly Metabolized 13C-Labelled Biochar as Revealed by 13C PLFA Analyses: Results from a Short-Term Incubation and Pot Experiment. Eur. J. Soil Sci. 2014, 65, 40–51. [Google Scholar] [CrossRef]
- Zhang, Y.; Hu, X.; Zou, J.; Zhang, D.; Chen, W.; Liu, Y.; Chen, Y.; Wang, X. Response of surface albedo and soil carbon dioxide fluxes to biochar amendment in farmland. J. Soils Sediments 2018, 18, 1590–1601. [Google Scholar] [CrossRef]
- Cayuela, M.L.; Jeffery, S.; van Zwieten, L. The Molar H:Corg Ratio of Biochar Is a Key Factor in Mitigating N2O Emissions from Soil. Agric. Ecosyst. Environ. 2015, 202, 135–138. [Google Scholar] [CrossRef]
- Zhang, A.; Cui, L.; Pan, G.; Li, L.; Hussain, Q.; Zhang, X.; Zheng, J.; Crowley, D. Effect of Biochar Amendment on Yield and Methane and Nitrous Oxide Emissions from a Rice Paddy from Tai Lake Plain, China. Agric. Ecosyst. Environ. 2010, 139, 469–475. [Google Scholar] [CrossRef]
- Zhang, A.; Liu, Y.; Pan, G.; Hussain, Q.; Li, L.; Zheng, J.; Zhang, X. Effect of Biochar Amendment on Maize Yield and Greenhouse Gas Emissions from a Soil Organic Carbon Poor Calcareous Loamy Soil from Central China Plain. Plant Soil 2012, 351, 263–275. [Google Scholar] [CrossRef]
- Case, S.D.C.; McNamara, N.P.; Reay, D.S.; Whitaker, J. Can Biochar Reduce Soil Greenhouse Gas Emissions from a Miscanthus Bioenergy Crop? GCB Bioenergy 2014, 6, 76–89. [Google Scholar] [CrossRef]
- Zhang, A.; Bian, R.; Hussain, Q.; Li, L.; Pan, G.; Zheng, J.; Zhang, X.; Zheng, J. Change in Net Global Warming Potential of a Rice–wheat Cropping System with Biochar Soil Amendment in a Rice Paddy from China. Agric. Ecosyst. Environ. 2013, 173, 37–45. [Google Scholar] [CrossRef]
- Scheer, C.; Grace, P.R.; Rowlings, D.W.; Kimber, S.; Van Zwieten, L. Effect of Biochar Amendment on the Soil-Atmosphere Exchange of Greenhouse Gases from an Intensive Subtropical Pasture in Northern New South Wales, Australia. Plant Soil 2011, 345, 47–58. [Google Scholar] [CrossRef]
- Liu, X.; Qu, J.; Li, L.; Zhang, A.; Jufeng, Z.; Zheng, J.; Pan, G. Can Biochar Amendment Be an Ecological Engineering Technology to Depress N2O Emission in Rice Paddies?—A Cross Site Field Experiment from South China. Ecol. Eng. 2012, 42, 168–173. [Google Scholar] [CrossRef]
- Bian, R.; Zhang, A.; Li, L.; Pan, G.; Zheng, J.; Zhang, X.; Zheng, J.; Joseph, S.; Chang, A. Effect of Municipal Biowaste Biochar on Greenhouse Gas Emissions and Metal Bioaccumulation in a Slightly Acidic Clay Rice Paddy. BioResources 2014, 9, 685–703. [Google Scholar] [CrossRef]
- Felber, R.; Leifeld, J.; Horák, J.; Neftel, A. Nitrous Oxide Emission Reduction with Greenwaste Biochar: Comparison of Laboratory and Field Experiments. Eur. J. Soil Sci. 2014, 65, 128–138. [Google Scholar] [CrossRef]
- Pandey, A.; Mai, V.T.; Vu, D.Q.; Bui, T.P.L.; Mai, T.L.A.; Jensen, L.S.; de Neergaard, A. Organic Matter and Water Management Strategies to Reduce Methane and Nitrous Oxide Emissions from Rice Paddies in Vietnam. Agric. Ecosyst. Environ. 2014, 196, 137–146. [Google Scholar] [CrossRef]
- Shen, J.; Tang, H.; Liu, J.; Wang, C.; Li, Y.; Ge, T.; Jones, D.L.; Wu, J. Contrasting Effects of Straw and Straw-Derived Biochar Amendments on Greenhouse Gas Emissions within Double Rice Cropping Systems. Agric. Ecosyst. Environ. 2014, 188, 264–274. [Google Scholar] [CrossRef]
- Van Zwieten, L.; Singh, B.P.; Kimber, S.W.L.; Murphy, D.V.; Macdonald, L.M.; Rust, J.; Morris, S. An Incubation Study Investigating the Mechanisms That Impact N2O Flux from Soil Following Biochar Application. Agric. Ecosyst. Environ. 2014, 191, 53–62. [Google Scholar] [CrossRef]
- Spokas, K.A. Impact of Biochar Field Aging on Laboratory Greenhouse Gas Production Potentials. GCB Bioenergy 2013, 5, 165–176. [Google Scholar] [CrossRef]
- Keith, A.; Singh, B.; Dijkstra, F.A.; van Ogtrop, F. Biochar Field Study: Greenhouse Gas Emissions, Productivity, and Nutrients in Two Soils. Agron. J. 2016, 0, 0. [Google Scholar] [CrossRef]
- Luo, G.J.; Kiese, R.; Wolf, B.; Butterbach-Bahl, K. Effects of Soil Temperature and Moisture on Methane Uptake and Nitrous Oxide Emissions across Three Different Ecosystem Types. Biogeosciences 2013, 10, 3205–3219. [Google Scholar] [CrossRef]
- Smith, K.A.; Thomson, P.E.; Clayton, H.; McTaggart, I.P.; Conen, F. Effects of Temperature, Water Content and Nitrogen Fertilisation on Emissions of Nitrous Oxide by Soils. Atmos. Environ. 1998, 32, 3301–3309. [Google Scholar] [CrossRef]
- Castellano, M.J.; Schmidt, J.P.; Kaye, J.P.; Walker, C.; Graham, C.B.; Lin, H.; Dell, C. Hydrological Controls on Heterotrophic Soil Respiration across an Agricultural Landscape. Geoderma 2011, 162, 273–280. [Google Scholar] [CrossRef]
- Castellano, M.J.; Schmidt, J.P.; Kaye, J.P.; Walker, C.; Graham, C.B.; Lin, H.; Dell, C.J. Hydrological and Biogeochemical Controls on the Timing and Magnitude of Nitrous Oxide Flux across an Agricultural Landscape. Glob. Chang. Biol. 2010, 16, 2711–2720. [Google Scholar] [CrossRef]
- Watanabe, A.; Ikeya, K.; Kanazaki, N.; Makabe, S.; Sugiura, Y.; Shibata, A. Five Crop Seasons’ Records of Greenhouse Gas Fluxes from Upland Fields with Repetitive Applications of Biochar and Cattle Manure. J. Environ. Manag. 2014, 144, 168–175. [Google Scholar] [CrossRef] [PubMed]
- Bass, A.M.; Bird, M.I.; Kay, G.; Muirhead, B. Soil Properties, Greenhouse Gas Emissions and Crop Yield under Compost, Biochar and Co-Composted Biochar in Two Tropical Agronomic Systems. Sci. Total Environ. 2016, 550, 459–470. [Google Scholar] [CrossRef]
- Fidel, R.B.; Laird, D.A.; Parkin, T.B. Impact of Six Lignocellulosic Biochars on C and N Dynamics of Two Contrasting Soils. GCB Bioenergy 2017, 9, 1279–1291. [Google Scholar] [CrossRef]
- Bonin, C.L.; Fidel, R.B.; Banik, C.; Laird, D.A.; Mitchell, R.; Heaton, E.A. Perennial Biomass Crop Establishment, Community Characteristics, and Productivity in the Upper US Midwest: Effects of Cropping Systems Seed Mixtures and Biochar Applications. Eur. J. Agron. 2018, 101, 121–128. [Google Scholar] [CrossRef]
- Parkin, T.B.; Venterea, R.T. Chamber-Based Trace Gas Flux Measurements. In Sampling Protocols; Follett, R.F., Ed.; USDA-ARS: Washington, DC, USA, 2010. [Google Scholar]
- Rochette, P.; Eriksen-Hamel, N.S. Chamber measurements of soil nitrous oxide flux: Are absolute values reliable? Soil Sci. Soc. Am. J. 2008, 72, 331–342. [Google Scholar] [CrossRef]
- Iqbal, J.; Castellano, M.J.; Parkin, T.B. Evaluation of Photoacoustic Infrared Spectroscopy for Simultaneous Measurement of N2O and CO2 Gas Concentrations and Fluxes at the Soil Surface. Glob. Chang. Biol. 2013, 19, 327–336. [Google Scholar] [CrossRef] [PubMed]
- Danevčič, T.; Mandic-Mulec, I.; Stres, B.; Stopar, D.; Hacin, J. Emissions of CO2, CH4 and N2O from Southern European peatlands. Soil Biol. Biochem. 2010, 42, 1437–1446. [Google Scholar] [CrossRef]
- Parkin, T.B.; Venterea, R.T.; Hargreaves, S.K. Calculating the Detection Limits of Chamber-based Soil Greenhouse Gas Flux Measurements. J. Environ. Qual. 2012, 41, 705–715. [Google Scholar] [CrossRef] [PubMed]
- Thomazini, A.; Spokas, K.; Hall, K.; Ippolito, J.; Lentz, R.; Novak, J. GHG Impacts of Biochar: Predictability for the Same Biochar. Agric. Ecosyst. Environ. 2015, 207, 183–191. [Google Scholar] [CrossRef]
- Fidel, R.B.; Laird, D.A.; Parkin, T.B. Impact of Biochar Organic and Inorganic C on Soil CO2 and N2O Emissions. J. Environ. Qual. 2017, 46, 505–513. [Google Scholar] [CrossRef] [PubMed]
- Velthof, G.L.; Kuikman, P.J.; Oenema, O. Nitrous Oxide Emission from Soils Amended with Crop Residues. Nutr. Cycl. Agroecosyst. 2002, 62, 249–261. [Google Scholar] [CrossRef]
- Novak, J.M.; Busscher, W.J.; Watts, D.W.; Amonette, J.E.; Ippolito, J.A.; Lima, I.M.; Gaskin, J.; Das, K.C.; Steiner, C.; Ahmedna, M.; et al. Biochars Impact on Soil-Moisture Storage in an Ultisol and Two Aridisols. Soil Sci. 2012, 177, 310–320. [Google Scholar] [CrossRef] [Green Version]
- Ulyett, J.; Sakrabani, R.; Kibblewhite, M.; Hann, M. Impact of Biochar Addition on Water Retention, Nitrification and Carbon Dioxide Evolution from Two Sandy Loam Soils. Eur. J. Soil Sci. 2014, 65, 96–104. [Google Scholar] [CrossRef]
- Karhu, K.; Mattila, T.; Bergström, I.; Regina, K. Biochar Addition to Agricultural Soil Increased CH4 Uptake and Water Holding Capacity—Results from a Short-Term Pilot Field Study. Agric. Ecosyst. Environ. 2011, 140, 309–313. [Google Scholar] [CrossRef]
- Bateman, E.J.; Baggs, E.M. Contributions of Nitrification and Denitrification to N2O Emissions from Soils at Different Water-Filled Pore Space. Biol. Fertil. Soils 2005, 41, 379–388. [Google Scholar] [CrossRef]
- Deng, Q.; Hui, D.; Wang, J.; Iwuozo, S.; Yu, C.-L.; Jima, T.; Smart, D.; Reddy, C.; Dennis, S. Corn Yield and Soil Nitrous Oxide Emission under Different Fertilizer and Soil Management: A Three-Year Field Experiment in Middle Tennessee. PLoS ONE 2015, 10, e0125406. [Google Scholar] [CrossRef] [PubMed]
Figure 1.
Daily post-fertilization CO2-C emissions, in mg of CO2-C per gram of soil per day (5 replicates). (blue = 10 °C, green = 20 °C, orange = 30 °C; diamonds = 27%, squares = 31% and triangles = 35% moisture; dashes = controls, solid lines = biochar).
Figure 1.
Daily post-fertilization CO2-C emissions, in mg of CO2-C per gram of soil per day (5 replicates). (blue = 10 °C, green = 20 °C, orange = 30 °C; diamonds = 27%, squares = 31% and triangles = 35% moisture; dashes = controls, solid lines = biochar).
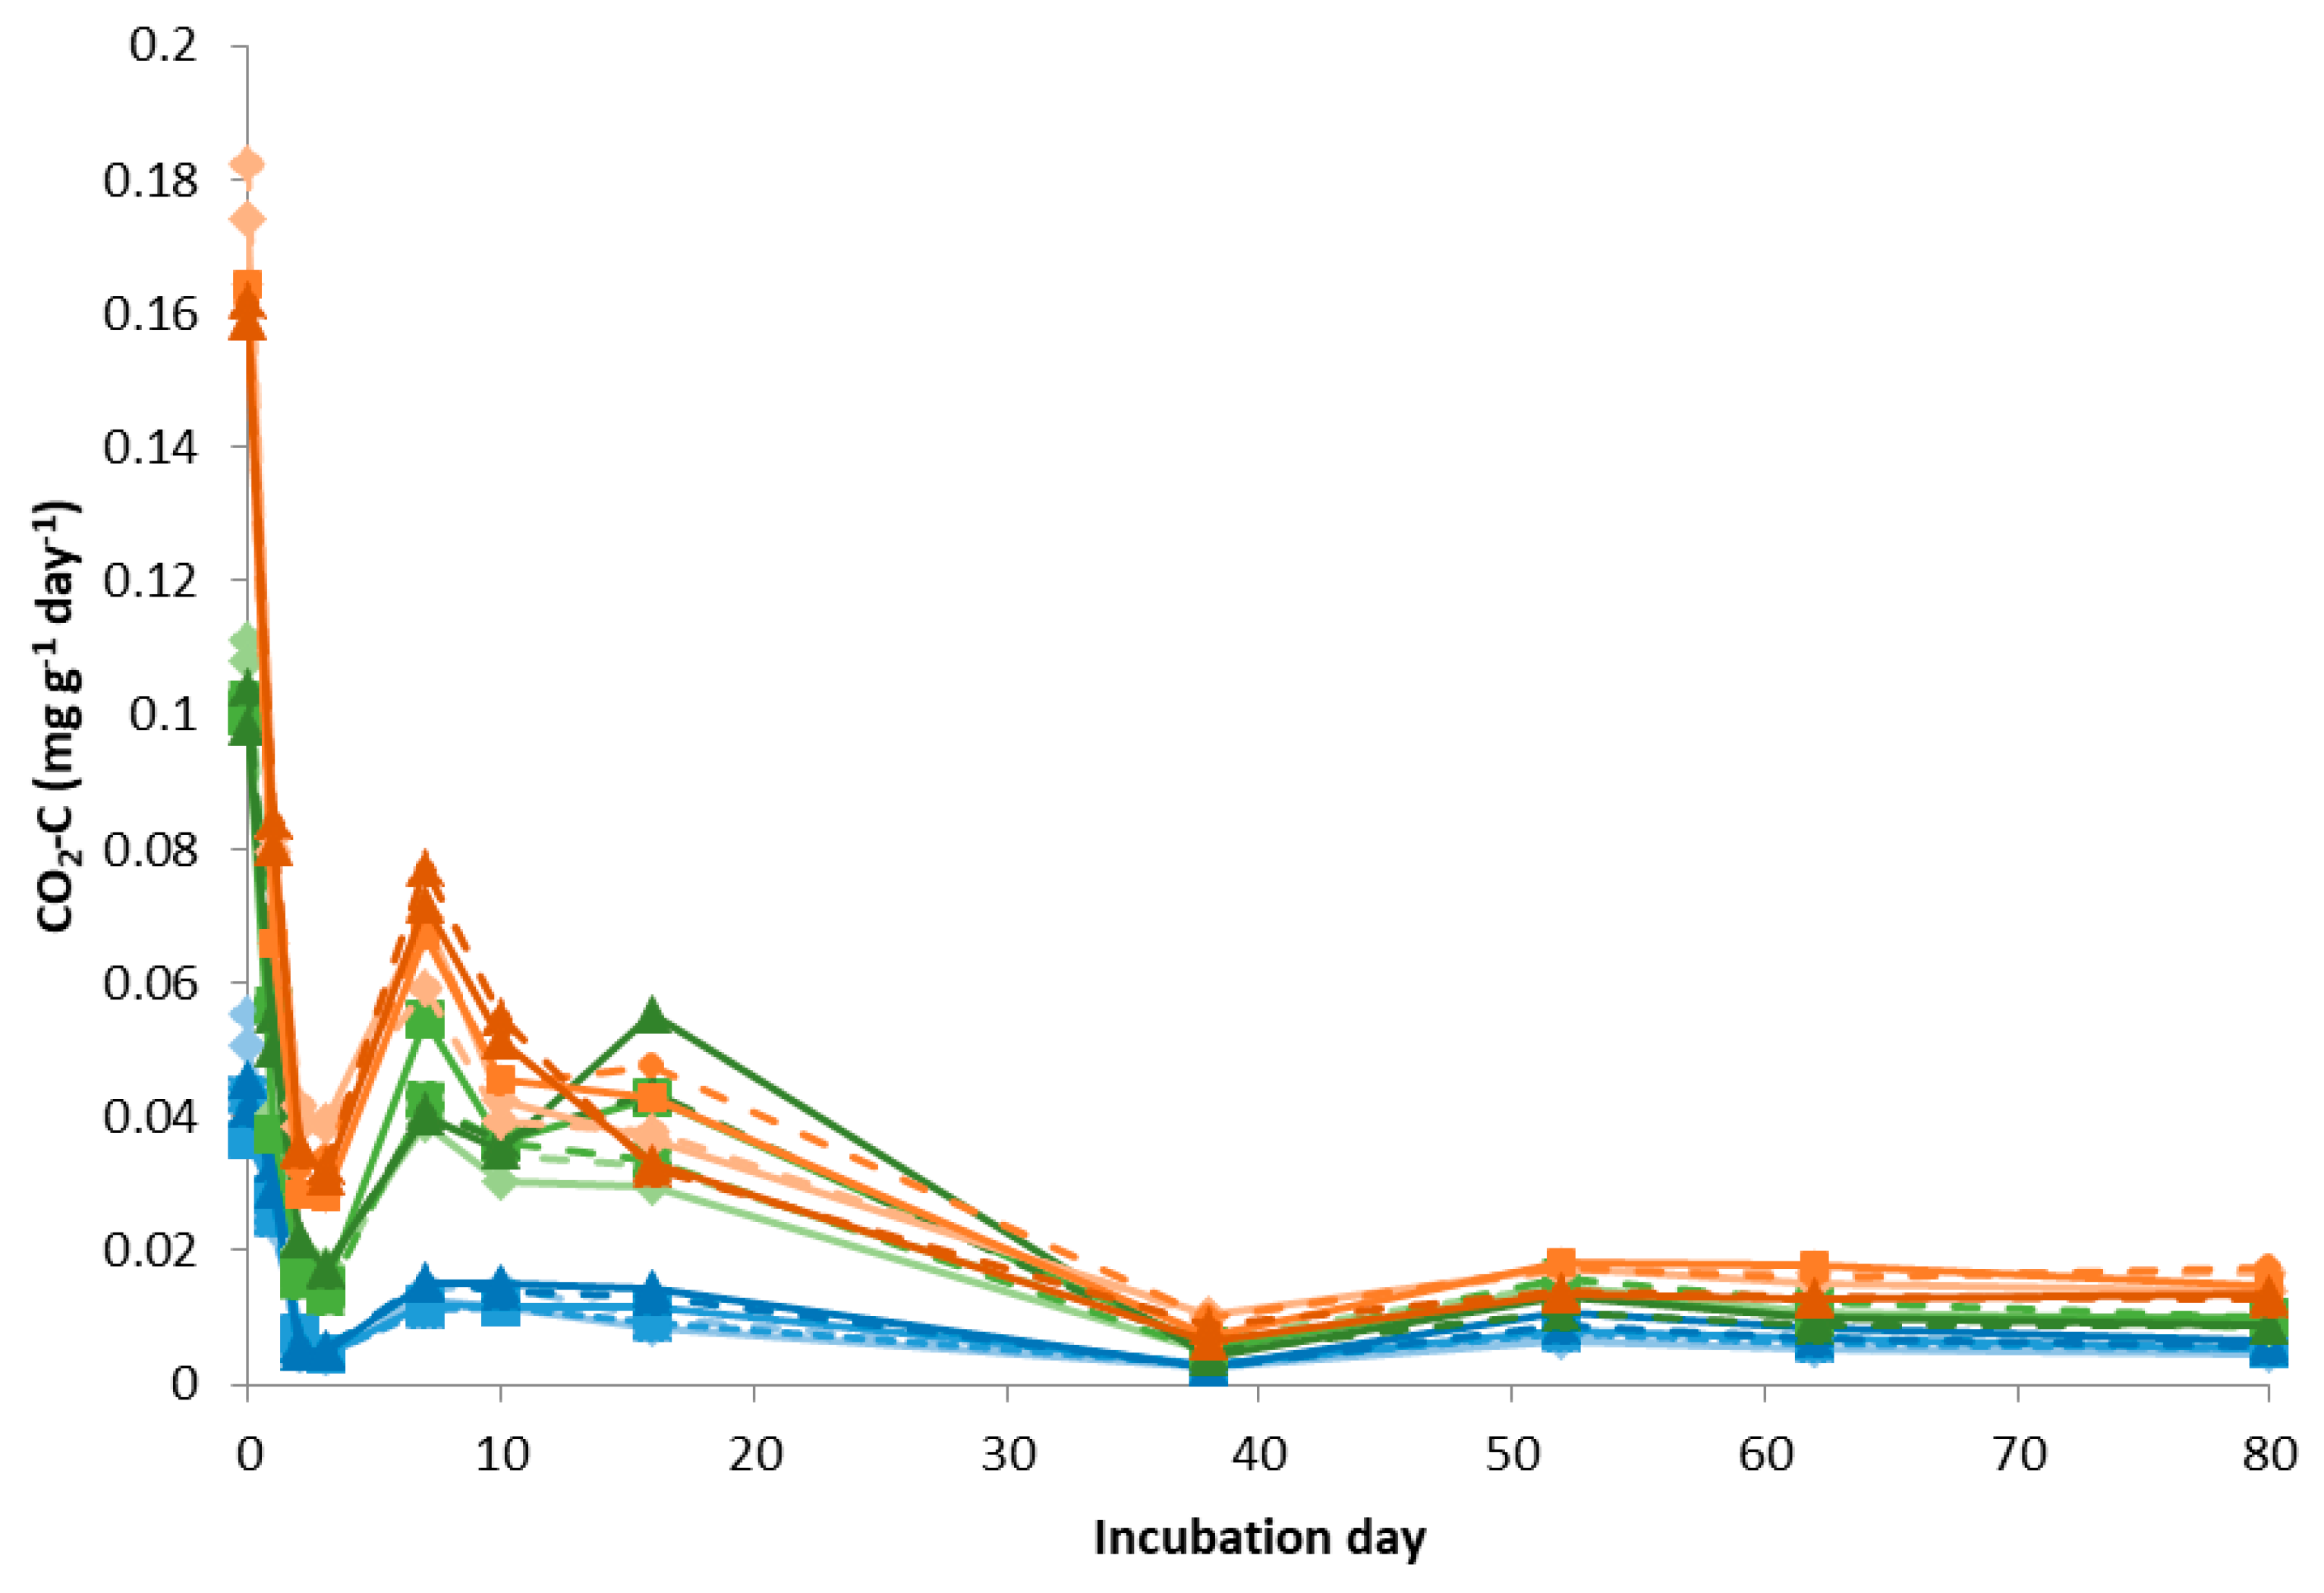
Figure 2.
Daily N2O-N emissions during the first 10 days of the post-fertilization period, in µg of N2O-N per gram of soil per day (emissions below detection limit after day 10). Note logarithmic scale. (5 replicates) (blue = 10 °C, green = 20 °C, orange = 30 °C; diamonds = 27%, squares = 31% and triangles = 35% moisture; dashes = controls, solid lines = biochar). * interaction of biochar×moisture×temperature×day significant (p < 0.05)
Figure 3.
(a) Daily precipitation in mm of rainfall per day during the 148 day field experiment (21st April—September 16th), where the beginning of the experiment (April 21st) is defined as day 0. (b) Average soil moistures measured from each cropping system, with biochar and without biochar (n = 8) on each day that GHG emissions were measured (CC = continuous corn, SG = switchgrass, LD = low diversity grass mix, HD = high diversity grass and forb mix; 0 = control, 1 = biochar-amended). *significant effect of biochar on soil moisture within at least one cropping system (p < 0.05)
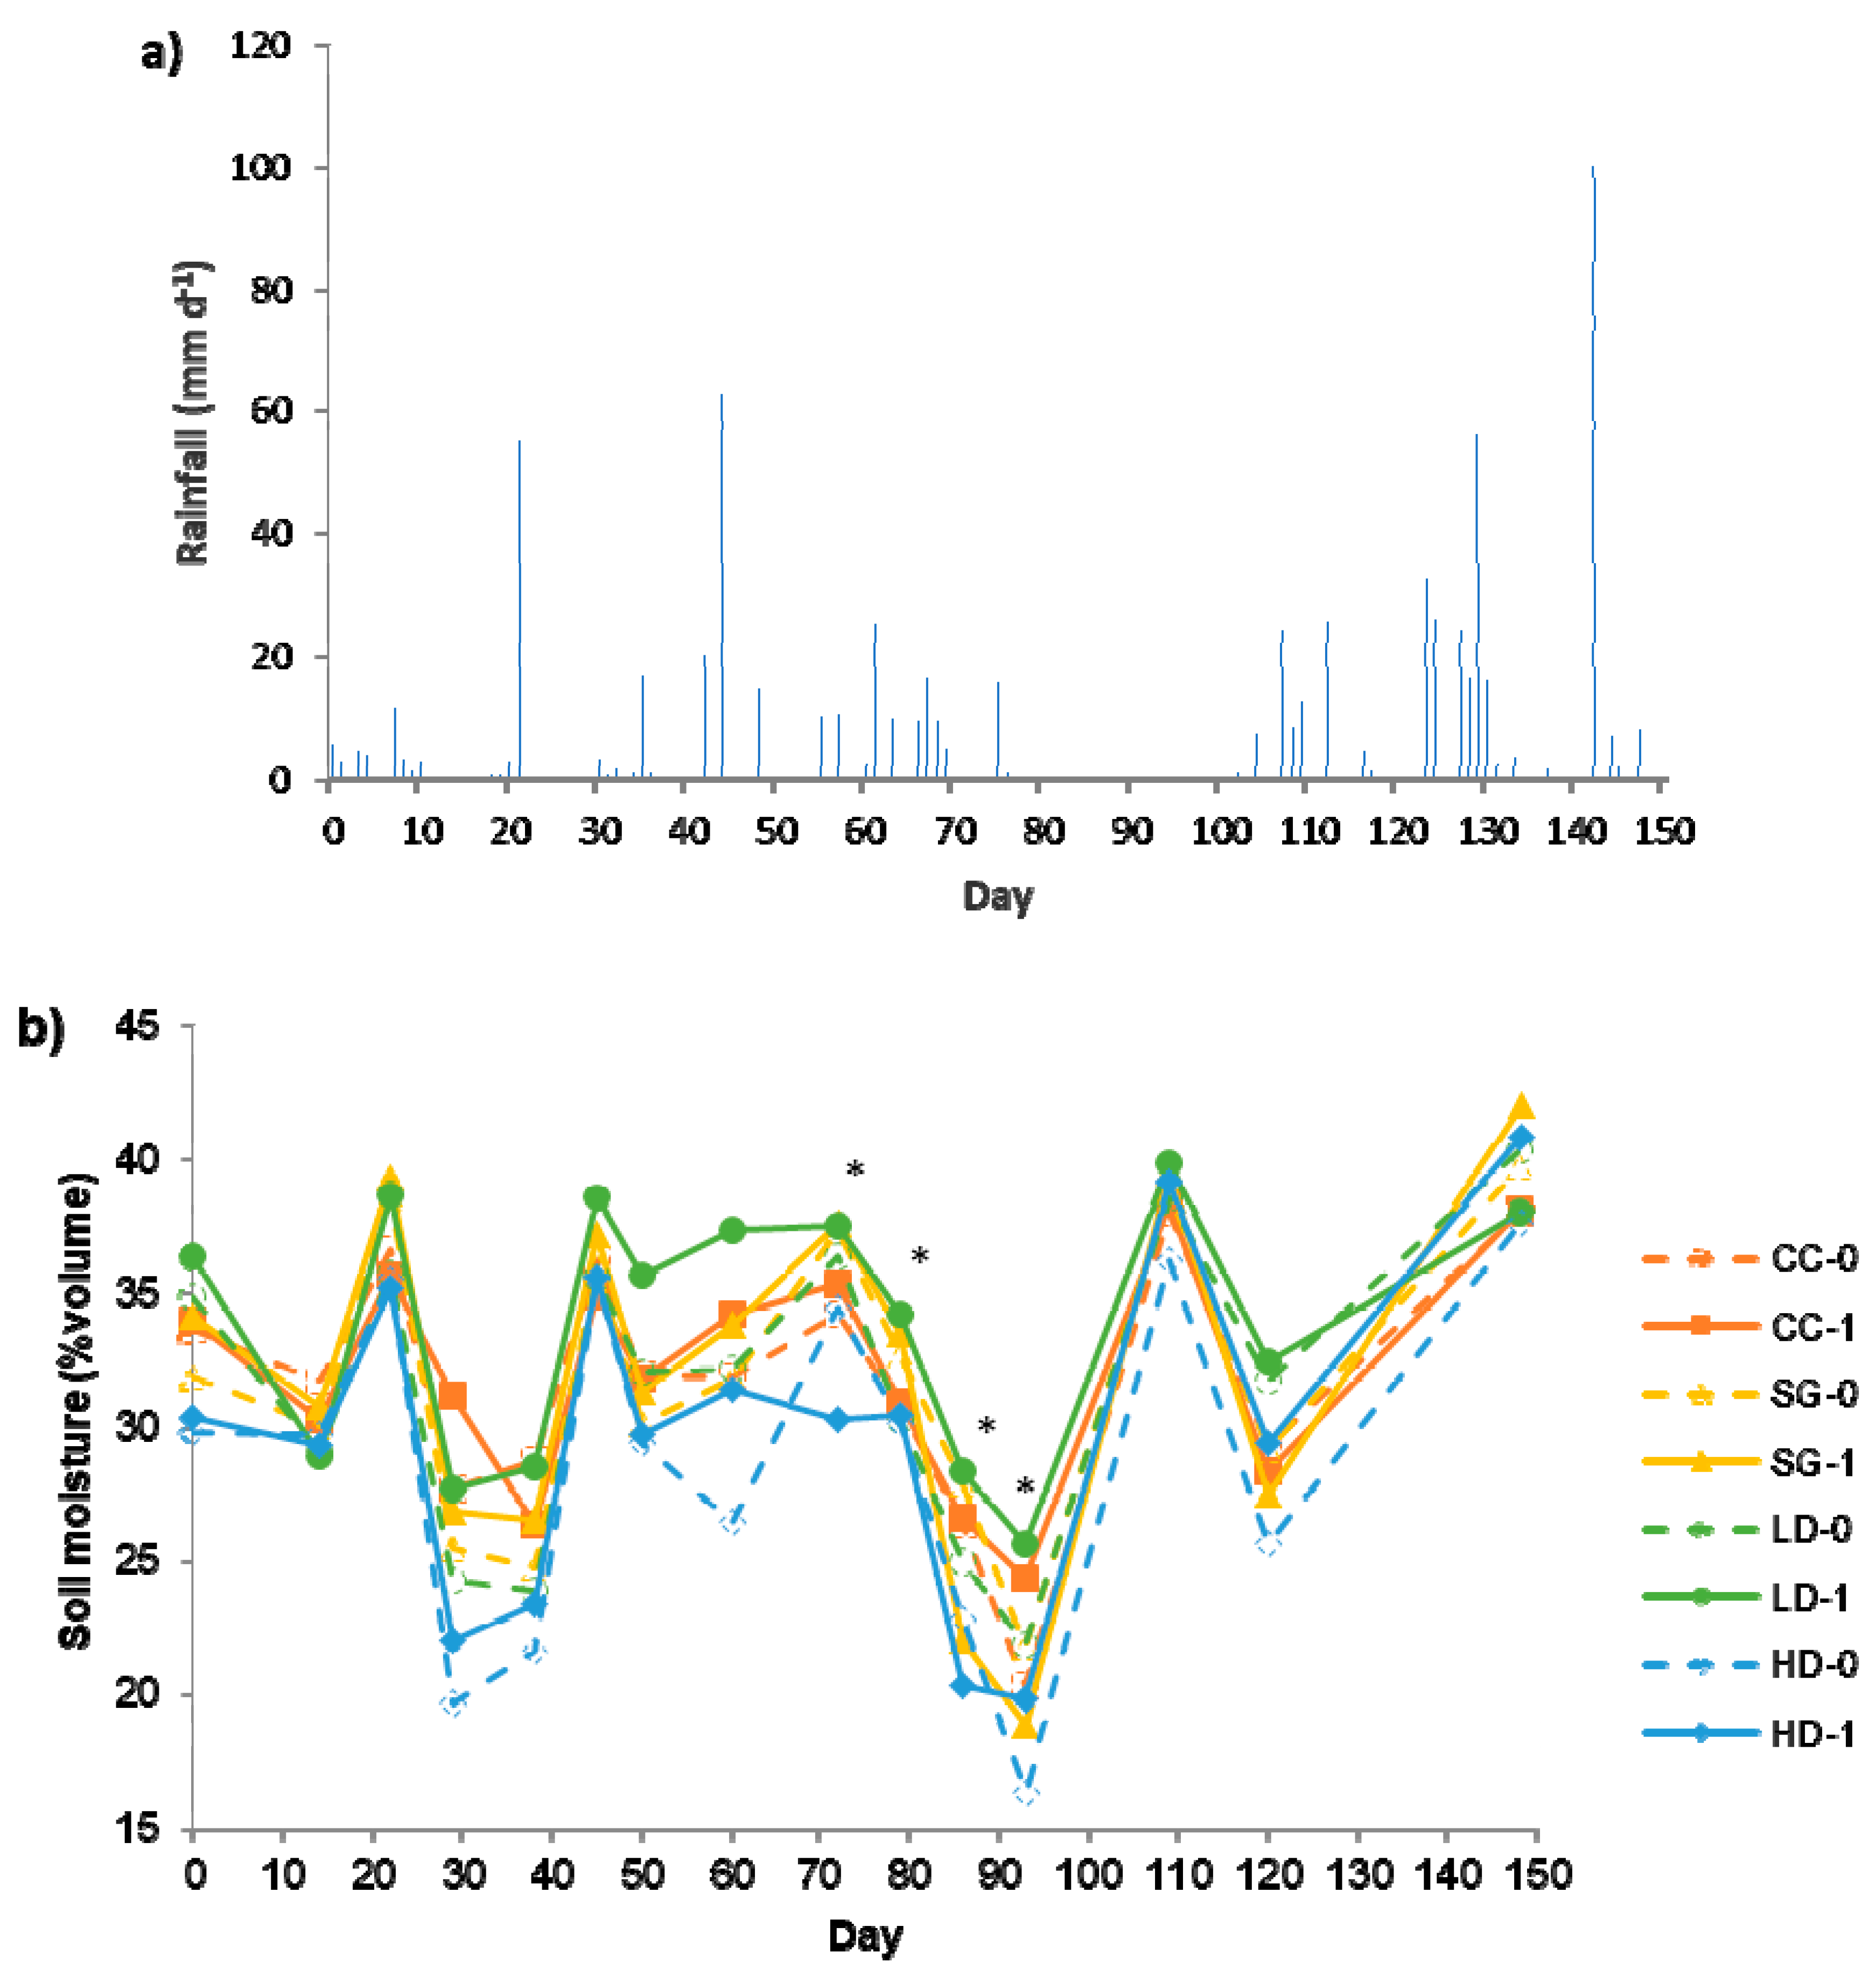
Figure 4.
Average daily soil CO2-C emissions measured for each treatment (CC = continuous corn, SG = switchgrass, LD = low diversity grass mix, HD = high diversity grass and forb mix; 0 = control, 1 = biochar-amended).
Figure 4.
Average daily soil CO2-C emissions measured for each treatment (CC = continuous corn, SG = switchgrass, LD = low diversity grass mix, HD = high diversity grass and forb mix; 0 = control, 1 = biochar-amended).
Figure 5.
Accumulated total soil CO2-C emissions from the four cropping systems, with and without biochar (CC = continuous corn, SG = switchgrass, LD = low diversity grass mix, HD = high diversity grass and forb mix; 0 = control, 1 = biochar-amended). (effect of biochar not significant).
Figure 5.
Accumulated total soil CO2-C emissions from the four cropping systems, with and without biochar (CC = continuous corn, SG = switchgrass, LD = low diversity grass mix, HD = high diversity grass and forb mix; 0 = control, 1 = biochar-amended). (effect of biochar not significant).
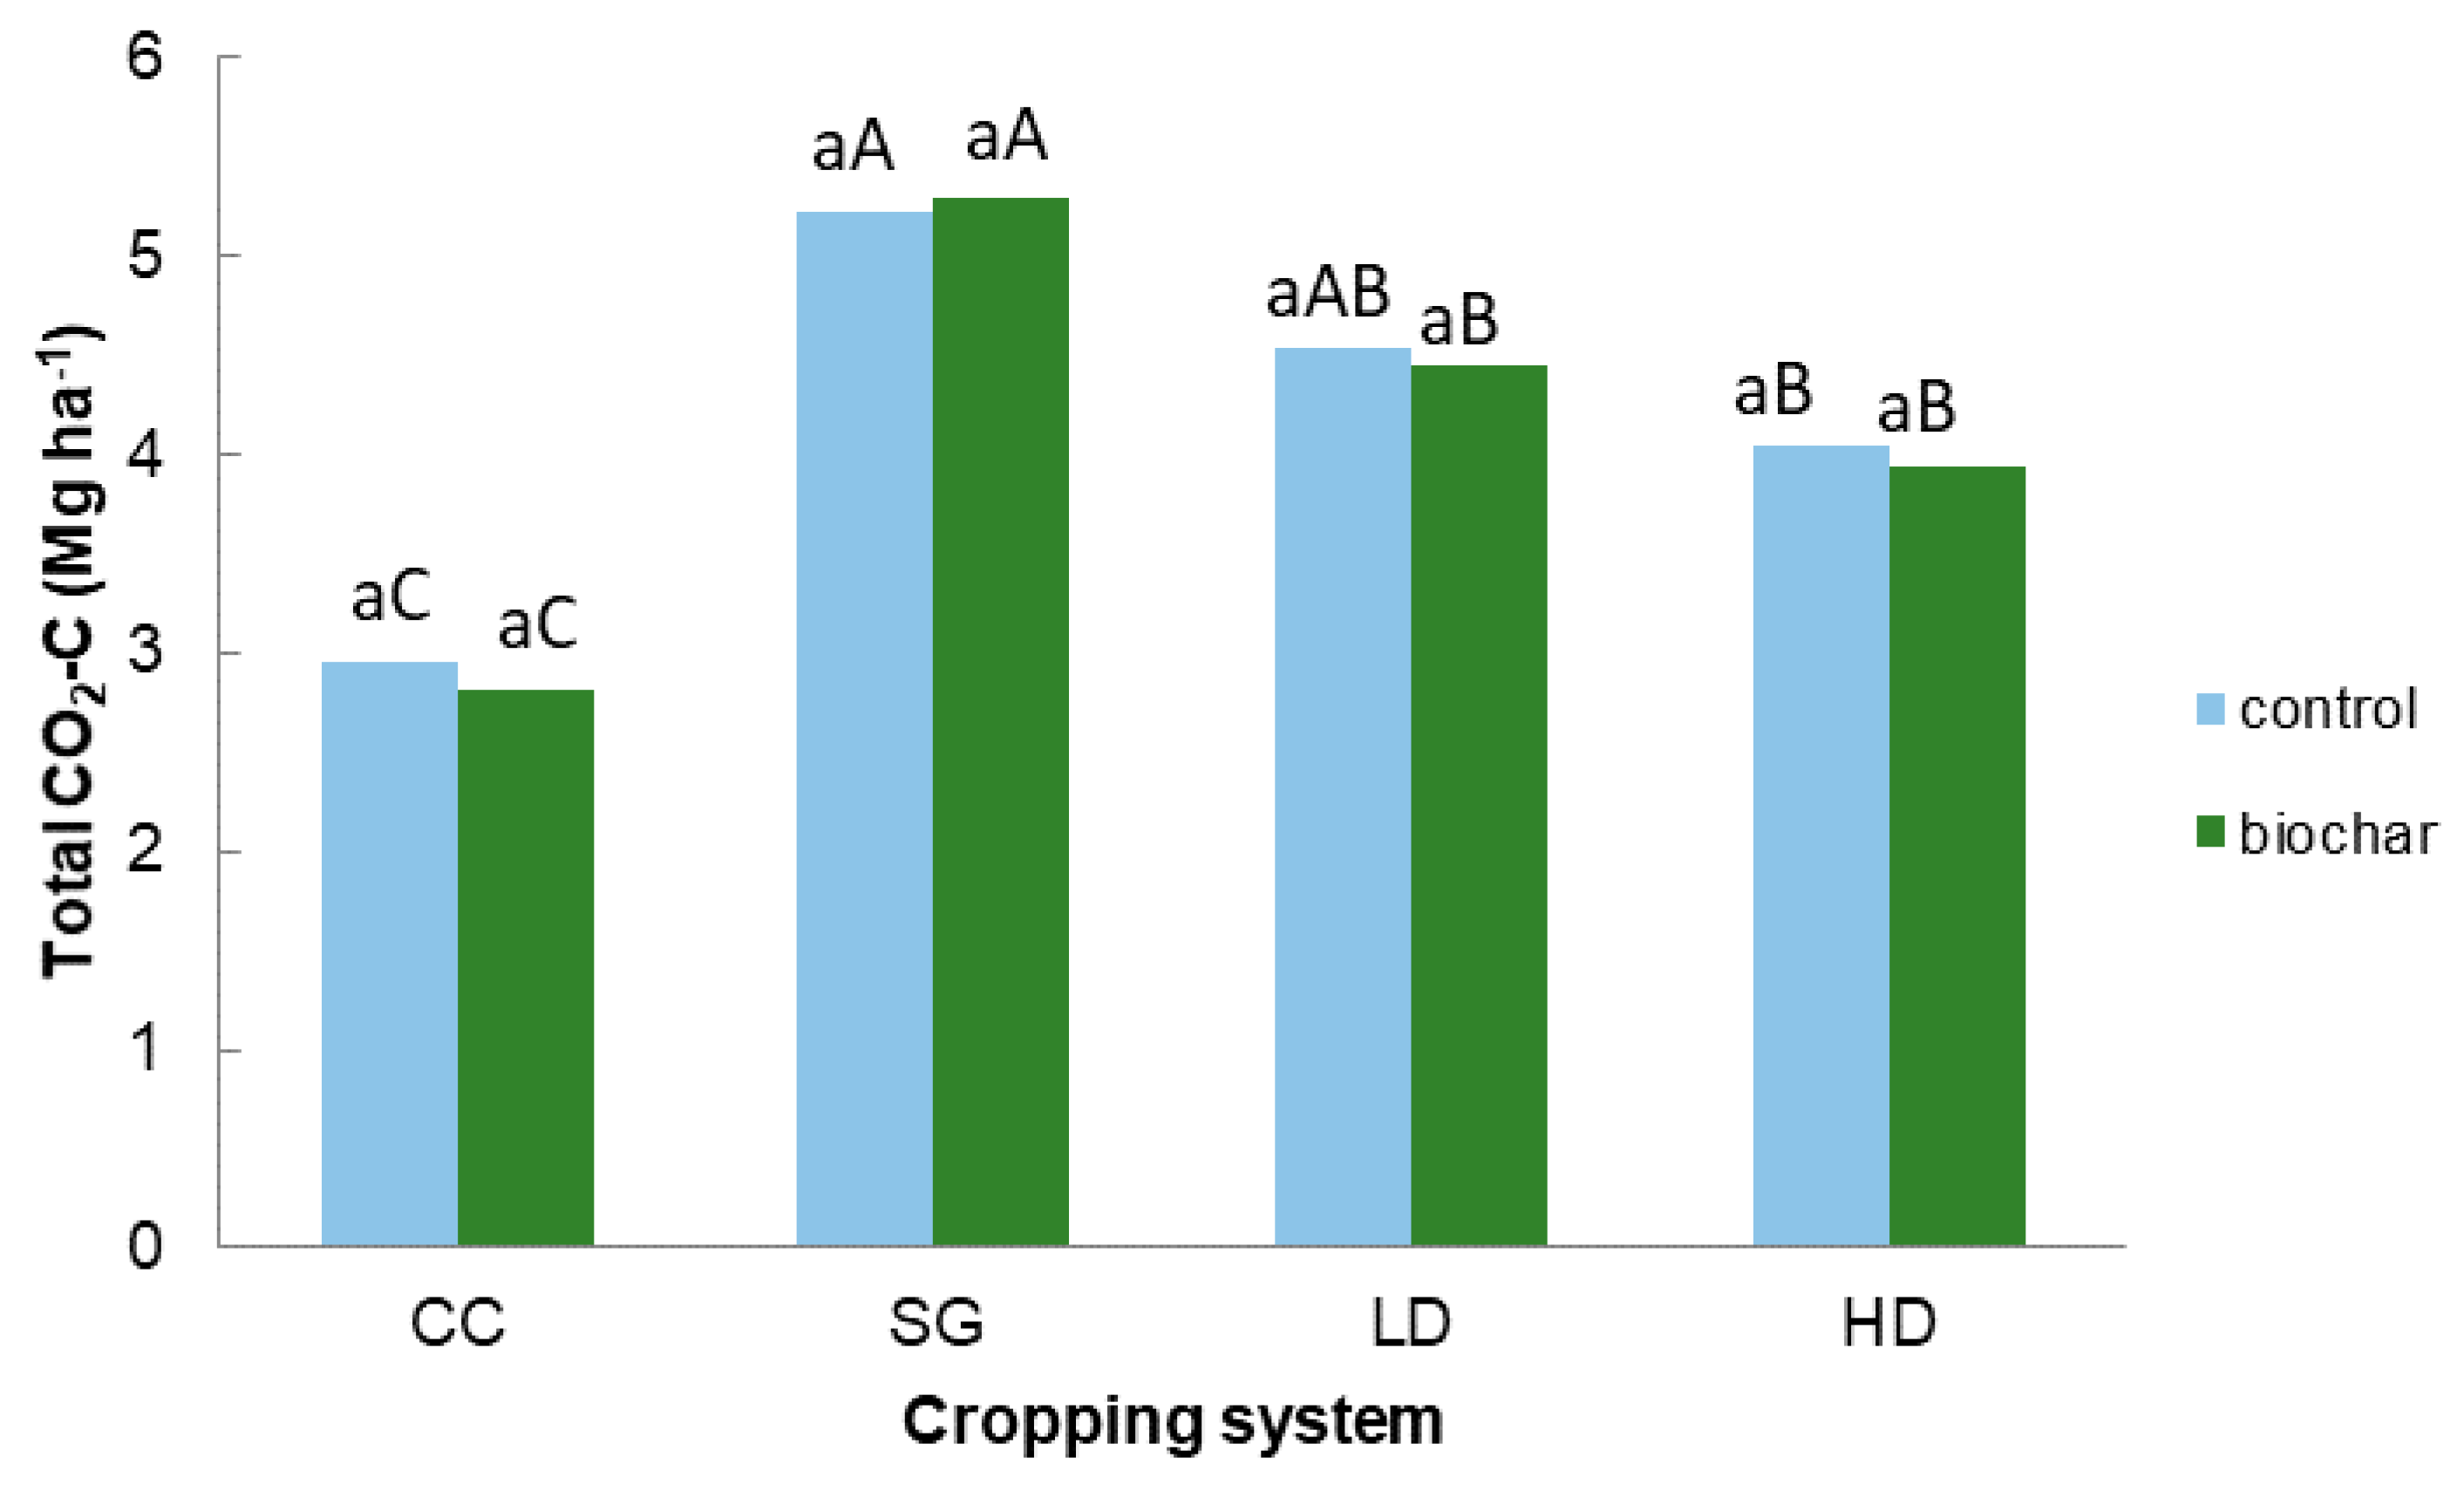
Figure 6.
Average daily soil N2O-N emissions measured for each treatment (CC = continuous corn, SG = switchgrass, LD = low diversity grass mix, HD = high diversity grass and forb mix; 0 = control, 1 = biochar-amended). * significant effect of biochar within at least one cropping system (p < 0.05).
Figure 6.
Average daily soil N2O-N emissions measured for each treatment (CC = continuous corn, SG = switchgrass, LD = low diversity grass mix, HD = high diversity grass and forb mix; 0 = control, 1 = biochar-amended). * significant effect of biochar within at least one cropping system (p < 0.05).
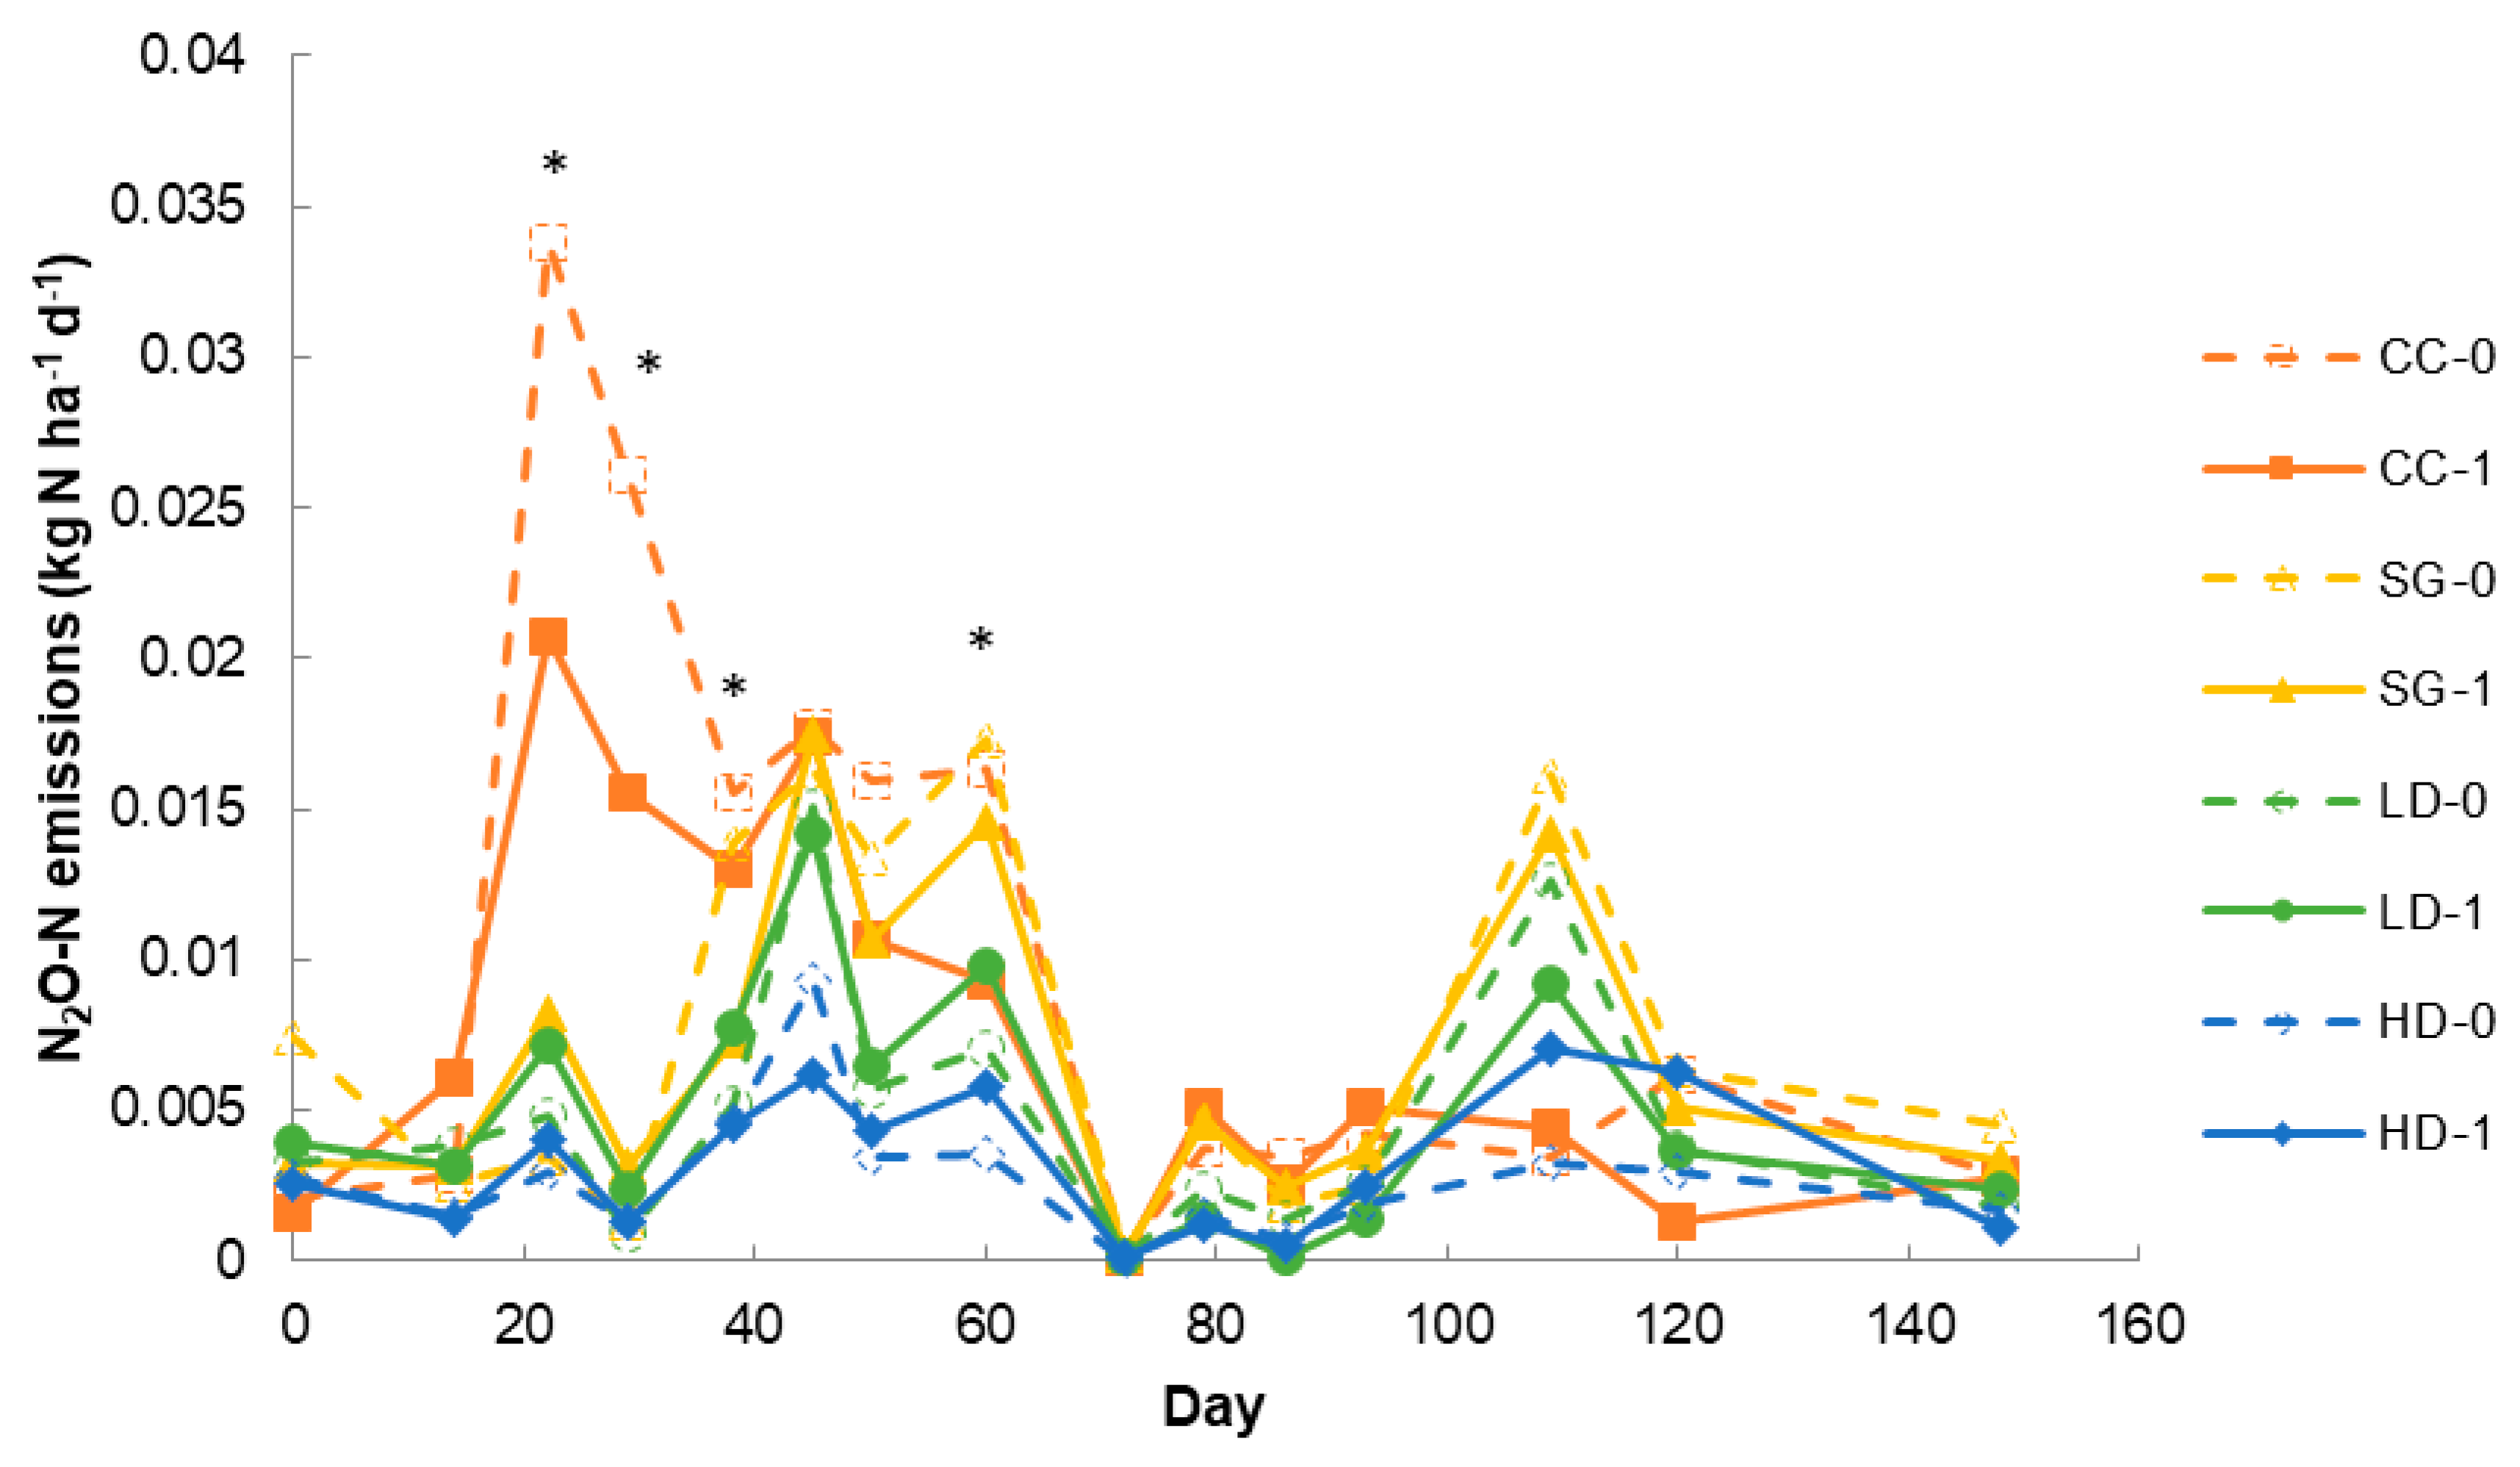
Figure 7.
Accumulated total soil N2O-N emissions from the four cropping systems, with and without biochar. (CC = continuous corn, SG = switchgrass, LD = low diversity grass mix, HD = high diversity grass and forb mix; 0 = control, 1 = biochar-amended) (effect of biochar not significant).
Figure 7.
Accumulated total soil N2O-N emissions from the four cropping systems, with and without biochar. (CC = continuous corn, SG = switchgrass, LD = low diversity grass mix, HD = high diversity grass and forb mix; 0 = control, 1 = biochar-amended) (effect of biochar not significant).


Table 1.
Cumulative total CO2 and N2O emissions from biochar-amended and control soil measured over 80 days and 10 days, respectively, following fertilization during the laboratory incubation (± se). No significant effects of biochar amendment were observed.
Table 1.
Cumulative total CO2 and N2O emissions from biochar-amended and control soil measured over 80 days and 10 days, respectively, following fertilization during the laboratory incubation (± se). No significant effects of biochar amendment were observed.
| Temperature | Moisture (%) | CO2 (mg CO2 g−1) | N2O (µg N2O g−1) | ||
|---|---|---|---|---|---|
| control | biochar | control | biochar | ||
| 10°C | 27 | 2.33 ±0.05 | 2.1 ±0.1 | 0.043±0.003 | 0.047 ±0.002 |
| 31 | 2.21 ±0.09 | 2.4 ±0.1 | 0.041±0.006 | 0.029 ±0.006 | |
| 35 | 2.6 ±0.1 | 2.9 ±0.1 | 0.1 ±0.05 | 0.10 ±0.07 | |
| 20°C | 27 | 5.7 ±0.4 | 5.4 ±0.4 | 0.15 ±0.02 | 0.09 ±0.01 |
| 31 | 5.8 ±0.5 | 6.2 ±0.5 | 0.34 ±0.1 | 0.15 ±0.02 | |
| 35 | 5.9 ±0.2 | 6.6 ±0.6 | 3.2 ±0.4 | 4.3 ±0.9 | |
| 30°C | 27 | 8.0 ±0.5 | 7.9 ±0.4 | 0.4 ±0.05 | 0.4 ±0.07 |
| 31 | 8.4 ±0.5 | 8.2 ±0.6 | 1.6 ±0.5 | 1.6 ±0.5 | |
| 35 | 7.5 ±0.1 | 7.2 ±0.3 | 7 ±2 | 10 ±2 | |
Table 2.
Total %C and %N (weight basis) of soil within greenhouse gas monitoring pans (±se) (CC = continuous corn, SG = switchgrass, LD = low diversity grass mix, HD = high diversity grass and forb mix).
Table 2.
Total %C and %N (weight basis) of soil within greenhouse gas monitoring pans (±se) (CC = continuous corn, SG = switchgrass, LD = low diversity grass mix, HD = high diversity grass and forb mix).
| %C | %N | |||
|---|---|---|---|---|
| Crop | Control | Biochar | Control | Biochar |
| CC | 2.5 ± 0.3 | 2.9 ± 0.2 | 0.26 ± 0.01 | 0.26 ± 0.02 |
| SG | 2.5 ± 0.1 | 3.2 ± 0.3 | 0.26 ± 0.01 | 0.26 ± 0.01 |
| LD | 2.2 ± 0.1 | 3.4 ± 0.2 | 0.24 ± 0.01 | 0.27 ± 0.01 |
| HD | 2.9 ± 0.3 | 3.2 ± 0.3 | 0.27 ± 0.01 | 0.27 ± 0.02 |
© 2019 by the authors. Licensee MDPI, Basel, Switzerland. This article is an open access article distributed under the terms and conditions of the Creative Commons Attribution (CC BY) license (http://creativecommons.org/licenses/by/4.0/).
Share and Cite
MDPI and ACS Style
Fidel, R.B.; Laird, D.A.; Parkin, T.B. Effect of Biochar on Soil Greenhouse Gas Emissions at the Laboratory and Field Scales. Soil Syst. 2019, 3, 8. https://doi.org/10.3390/soilsystems3010008
AMA Style
Fidel RB, Laird DA, Parkin TB. Effect of Biochar on Soil Greenhouse Gas Emissions at the Laboratory and Field Scales. Soil Systems. 2019; 3(1):8. https://doi.org/10.3390/soilsystems3010008
Chicago/Turabian StyleFidel, Rivka B., David A. Laird, and Timothy B. Parkin. 2019. "Effect of Biochar on Soil Greenhouse Gas Emissions at the Laboratory and Field Scales" Soil Systems 3, no. 1: 8. https://doi.org/10.3390/soilsystems3010008