Article

Speciation and Mobility of Mercury in Soils Contaminated by Legacy Emissions from a Chemical Factory in the Rhône Valley in Canton of Valais, Switzerland

1
Soil Chemistry Group, Institute of Biogeochemistry and Pollutant Dynamics, CHN, ETH Zurich, 8092 Zurich, Switzerland
2
Institute of GeoEcology, Division of Environmental Geochemistry, Technische Universität Braunschweig, 38106 Braunschweig, Germany
3
Soils and Substrates Group in TNE-hepia, University of Applied Science and Arts Western Switzerland, 1202 Geneva, Switzerland
*
Author to whom correspondence should be addressed.
Soil Syst. 2018, 2(3), 44; https://doi.org/10.3390/soilsystems2030044
Submission received: 16 June 2018 / Revised: 21 July 2018 / Accepted: 24 July 2018 / Published: 30 July 2018
(This article belongs to the Special Issue Soil Processes Controlling Contaminant Dynamics)

Abstract

:
Legacy contamination of soils and sediments with mercury (Hg) can pose serious threats to the environment and to human health. Assessing risks and possible remediation strategies must consider the chemical forms of Hg, as different Hg species exhibit vastly different environmental behaviors and toxicities. Here, we present a study on Hg speciation and potential mobility in sediments from a chemical factory site, and soils from nearby settlement areas in the canton of Valais, Switzerland. Total Hg ranged from 0.5 to 28.4 mg/kg in the soils, and 3.5 to 174.7 mg/kg in the sediments, respectively. Elemental Hg(0) was not detectable in the soils by thermal desorption analysis. Methylmercury, the most toxic form of Hg, was present at low levels in all soils (<0.010 mg/kg; <0.8% of total Hg). Sequential extractions and thermal desorption analyses suggested that most of the Hg in the soils was present as “matrix-bound Hg(II)”, most likely associated with soil organic matter. For factory sediments, which contained less organic matter, the results suggested a higher fraction of sulfide-bound Hg. Batch extractions in different CaCl2 solutions revealed that Hg solubility was low overall, and there was no Hg-mobilizing effects of Ca2+ or Cl in solution. Only in some of the factory sediments did high CaCl2 concentrations result in increased extractability of Hg, due to the formation of Hg-chloride complexes. Additional experiments with soil redox reactors showed that even mildly reducing conditions led to a sharp release of Hg into solution, which may be highly relevant in soils that are prone to periodic water saturation of flooding.

1. Introduction

Mercury (Hg) is a toxic element with a complex global biogeochemical cycle [1]. The methylmercury (MeHg) form is a potent neurotoxin that can directly affect human and environmental health as it bioaccumulates and biomagnifies upward in the food chain, primarily in aquatic ecosystems [1]. During the 19th and 20th centuries, Hg was utilized and emitted in many industrial and mining processes, thereby increasing the environmental concentrations of Hg in the atmosphere and surface oceans by at least three-fold as compared to pre-industrial times [2,3]. In the late 20th and early 21st centuries, with increasing awareness of the detrimental environmental effects of Hg, came the discovery of many areas with legacy Hg contamination.
In nature, soils are a primary sink for Hg and can act as a long term source to the environment [4]. The current Hg species present in soils from legacy industrial contamination may depend on many influencing factors. These include the variety of Hg species originally used during factory chemical production, the method of downstream transport of Hg from source locations, the time since contaminant deposition, chemical and physical soil properties, seasonal temperature, and groundwater table fluctuations, among others. These parameters may drastically change Hg species in the soils and, thereby increase or decrease its potential mobility, bioavailability, and toxicity. Therefore, knowledge about the speciation of Hg in these soils is of great importance for risk assessment and the development of remediation strategies.
Chemical forms of Hg in soils can include elemental Hg(0), Hg in sulfide minerals (e.g., metacinnabar, β-HgS), Hg chlorides (e.g., calomel, Hg2Cl2), inorganic Hg(II) adsorbed to surfaces of clay minerals, iron (oxyhydr)oxides, or soil organic matter (collectively referred to as “matrix-bound Hg(II)”), and methylated Hg species (MeHg). Of particular importance are the presence and quantities of Hg(0) and MeHg. For example, the presence of Hg(0) could lead to elevated gaseous Hg emissions to the surrounding atmosphere [5], especially during soil remediation works, and to losses of Hg during the sampling and sample preparation for soil analyses [6]. In general, Hg in soils and sediments is controlled by inorganic and organic interactions, since it has an affinity to Cl, OH, S2−, and S-containing functional thiol groups in organic ligands [7,8,9]. Organic matter can both mobilize and immobilize Hg, depending on the prevailing soil pH, redox, and flooding conditions [10,11,12,13]. In addition, in well-oxygenated soils, Hg can be mobilized by the presence of high concentrations of Cl ions [14] that act as a complexing agent, and conditions potentially found in areas with high usage of road deicing salts [15]. Furthermore, pore water chemistry of soils is often dominated by Ca2+ ions, especially in carbonate-bearing and other circum-neutral soils. The Ca2+ concentration can influence Hg mobility either by competing for sorption sites with Hg(II), thereby increasing Hg mobility, or by promoting the aggregation of Hg-bearing colloids, thereby reducing Hg mobility [16]. In soils with variable redox conditions, sulfide can compete with thiol groups of organic matter and precipitate nanoparticulate HgS in the form of metacinnabar (β-HgS) [17], particularly in contaminated soils [18,19]. In general, HgS is stable and has a low solubility [20], though this can be affected by a number of different parameters. The nanoparticles formed in situ in soils can be stabilized by organic matter [21], but will be structurally disordered when formed in low sulfidic environments [22], and may be more bioavailable for Hg methylation [23,24], the most toxic form of mercury [25]. Under reducing soil conditions, the formation of MeHg is predominantly a biotic process, formed by both sulfate-reducing and iron-reducing bacteria [26]. While MeHg is not a major species in predominantly aerated soils, its extreme toxicity is highly relevant for risk assessment.
Unfortunately, the study of solid-phase Hg speciation in soils is not a straightforward task. Various extraction-based techniques have been developed to divide Hg-species into “operationally-defined” pools, but they can be prone to artifacts [27,28,29,30]. More direct information about the dominating Hg species in soils can be obtained by synchrotron X-ray absorption spectroscopy (XAS) with linear combination fitting analysis based on known reference compounds; however, this technique requires high Hg concentrations and also has its limitations. Another technique is thermal desorption analysis (also known as pyrolysis with Hg detection), which is very effective in detecting the presence of elemental Hg(0) in soils or sediments, but other relevant species that are common in soils are difficult to discriminate from each other, due to overlapping Hg release curves [31,32]. MeHg analyses require special extraction procedures and analysis by high-performance liquid chromatography (HPLC) or gas chromatography (GC) coupled to inductively coupled plasma mass spectrometry (ICPMS). Thus, characterization of the chemical speciation of Hg in soils and sediments requires a combination of multiple methods.
Total Hg in soils is commonly determined by aqua regia (3:1 HCl:HNO3) digestion followed by Hg detection by atomic fluorescence spectrometry with cold-vapor injection (CV-AFS) or by inductively coupled plasma mass spectrometry (ICP-MS). However, the Swiss Ordinance on the Pollution of Soil (VBBo, ger.) [33] calls for extractions with 2 M HNO3 for the determination of total concentrations of heavy metals including Hg. It is currently not clear as to whether this extract is sufficient to solubilize all Hg from contaminated soils, because Hg(0) or Hg sulfides may not be fully extracted [27]. Thus, there is a potential that this extraction method underestimates the concentration of total Hg in soils containing Hg(0) or Hg sulfides. Also, the Swiss VBBo procedures involve oven-drying of soils at 40 °C, even though Hg losses and cross-contamination of soil samples by gaseous Hg(0) during oven-drying at 30–50 °C have been reported [6].
Here, we present a study on Hg contaminated soils in southern Switzerland, where legacy Hg pollution was discovered in agricultural fields, private gardens within settlement areas, and the factory site where Hg had been used over decades in various chemical production processes. Our study was designed to shed light on the Hg-species pools in soils from the settlement areas versus the sediments from the factory site, and to assess the solubility of Hg. Specifically, our objectives were (i) to test the validity of the Swiss VBBo methods for soil sampling and analysis of total Hg in soils from the Valais region (ii) to determine the Hg speciation pools in the soils using Hg pyrolysis and sequential extractions, and (iii) to assess parameters influencing Hg release potential by extraction using various Cl- concentrations and ionic strength, and the influence of varying redox conditions. This information will contribute to an improved understanding of the behavior of Hg in the soils and the risks posed as a long-term source to the environment of the surrounding communities.

2. Materials and Methods

2.1. Study Area and Contamination History

The study area is located in the canton of Valais, Switzerland, in the mountainous Rhône river valley, in the settlements areas of the towns of Visp (upstream) and Raron/Turtig (downstream). The site is a flat, relatively narrow flood plain valley surrounded by the steep slopes of the Swiss Pennine Alps. The soils of the region (mostly calcaric Fluvisols) are of fine sand and silt loam texture, and are calcium carbonate-bearing. The contamination is mainly associated with the Grossgrundkanal (GGK), a canal constructed during a decade starting in 1927 to provide drainage to the flood plain areas of the valley, thereby allowing the land to be used for agriculture. The GGK runs for 10.6 km through Visp and the agricultural and settlement areas, before merging with the Rhône River downstream of Turtig. In Visp, the GGK runs through industrial areas in the city and alongside a chemical manufacturing factory that historically produced pharmaceuticals, and agricultural as well as industrial chemicals such as acetaldehyde, vinyl acetate, vinyl chloride, and chloralkali electrolysis [34].
The history of the Hg contamination of the region is only partially documented. It appears that the distribution of Hg-burdened sediment occurred in several phases. During the years of operation of the chemical factory, unknown quantities of elemental Hg(0) and inorganic Hg(II) species were used in the production of the various chemicals, where in some processes it was used as a reaction catalyst, though the specific details of the Hg species used and released into the environment are unclear [34]. The GGK was thus utilized for waste drainage of Hg-laden sewage and other wastewater effluent. Subsequently, the sediments settling in the GGK became contaminated with industrial Hg. In addition, during occasional maintenance and upkeep of the GGK, the canal sediments were dredged and temporarily stored at various locations along the banks of the canal. Some of this sediment was later redistributed as soil amendment or fill for agricultural or settlement areas. Furthermore, it is unknown as to what extent the drainage water in the canal was used for agricultural irrigation, thereby also potentially spreading dissolved or particle-bound Hg to surrounding soils. Finally, several locations on the factory site itself were used as temporary storage for excavated, Hg-laden GGK and industrial muds, sludge, and other waste materials before being transported to the local landfill [34].
Since the discovery of Hg contamination in these soils between 2010 and 2011, various investigations were conducted to determine the range of concentrations and the spatial distribution of the contamination. More than 4000 soil samples have been collected and analyzed according to the Swiss VBBo procedures [35] to assess the extent of Hg contamination, primarily by the principle consultant agency (Arcadis Schweiz AG, Schlieren, Switzerland) on behalf of the chemical manufacturer and the environmental agency of the canton of Valais (DUW, Sion, Switzerland). The VBBo sample preparation method involves the drying of the soil at 40 °C, mixing, and sieving to <2 mm, followed by Hg extraction with 2 M HNO3 at 95 °C for 2 h [33]. These analyses revealed that the range of Hg in the soils is from <0.5 mg/kg to heavily contaminated areas of >200 mg/kg, and the spatial distribution is extremely heterogeneous. According to current Swiss laws and environmental regulations, soils with concentrations ≥2 mg/kg in settlement areas and ≥20 mg/kg in agricultural areas require remediation [36]; however, risks need to be assessed for agricultural soils with concentrations ≥0.5 mg/kg if they are used for food or animal feed production.

2.2. Soil Sampling

2.2.1. Soil Samples Following VBBo Procedures

For the collection of soil samples from the settlement areas of Visp and Turtig (Figure S1), fifteen 10 × 10 m2 plots were selected based on available data to cover a range of total Hg concentrations. Each plot was subdivided into sixteen 2.5 × 2.5 m2 squares marked with posts and string. Within each square, a sampling spot was randomly chosen and a soil sample (0–20 cm) was collected using a gouge sampler. The 16 samples from each plot were collected in a plastic bucket, which was capped, transported to the laboratory, and stored at 4 °C until further treatment. The gouge was thoroughly cleaned with water and paper towels after each sampling. To avoid cross-contamination between sites, sampling was performed in order of increasing expected Hg contamination levels (based on available information). In the laboratory, the soil samples were thoroughly mixed, crushed, dried in an oven at 40 °C until constant weight, and sieved through a 2-mm sieve. The soil samples from Visp and Turtig will be referred to as “V” and “T” samples, respectively.

2.2.2. Soil Samples Collected as Undisturbed Cores

In addition to the standard VBBo sampling procedure, we developed an alternative sampling protocol designed to minimize possible losses of gaseous elemental Hg and changes in Hg speciation during sampling and sample pre-treatment. Of particular concern was the potential presence of elemental Hg(0), which may volatilize during sampling and mixing, or during oven-drying of the soils at 40 °C [6]. To accomplish this goal, undisturbed soil cores (0–40 cm, 5 cm diameter) were collected with an HUMAX core sampler using semi-rigid inner cylinders for sampling and plastic transportation tubes (5.3 cm diameter) for safe transport of the cores to the laboratory. The cores were taken directly side-by-side to the gouge samples for the VBBo composite samples, resulting in 16 cores per plot. All cores were transported to the laboratory and stored in a cold room at 4 °C until further processing. In the cold room, the cores were first sectioned into 0–20 cm and 20–40 cm pieces. The 0–20 cm cores were then cut vertically into halves, of which one half was placed into a sealed plastic bag and stored as an undisturbed half-core, and the other was mixed into composite samples consisting of 16 half-cores per site. These composite samples were thoroughly mixed and sieved through a 2-mm sieve in a field-moist state, and filled into sealed plastic bags. All sample processing and storage was done in a cold room to minimize possible losses of volatile Hg species. All cores and the field-moist composite samples were stored in a dark cold room until analysis.

2.2.3. Sediment Samples from the Factory Site

Sediment samples from three areas within the factory site where different industrial activities have been carried out, were sampled and kindly provided to us by Arcadis Schweiz AG. These samples will be referred to as “F” samples. Samples F-A1 and F-A3 were collected from the location of a former acetaldehyde plant, and were collected from 0–0.5 m and 1.0–1.5 m depth intervals, respectively. Samples F-D2 and F-D4 originate from a former interim storage area of excavated sludge and soil from other acetaldehyde production facilities. Samples were collected from 0.5–1.0 and 1.5–2.0 m depths, respectively. Finally, samples F-F1 and F-F2 were collected at a second interim sediment storage facility and were collected from 0–0.3 and 0.3–0.6 m depths, respectively. All factory samples received were previously processed following the procedures outlined in the VBBo.

2.3. Soil Analyses

All soil samples (<2 mm) were analyzed for elemental composition using energy dispersive X-ray fluorescence spectrometry (XRF; SPECTRO XEPOS; Spectro Analytical Instruments, Kleve, Germany). Soils were analyzed in duplicates using pressed powder pellets, with an in-house standard run in parallel during each session for quality control. Soil pH was measured after equilibrating 10 g of dry soil with 25 mL 0.01 M CaCl2 solution using a glass pH electrode. Total carbon (TC) measurements were conducted on finely ground samples using an elemental analyzer (CHNS-932 LECO, Saint Joseph, MI, USA) by means of high temperature combustion and CO2 detection. All samples were measured with a minimum of duplicates and an uncertainty of ±2%, reflecting the replicate measurements of a standard as a sample. Total inorganic C (TIC) was measured using a solid phase carbonate analyzer (SSM 5000A, Shimadzu Schweiz, Reinach, Switzerland), which measures CO2 vapor produced by acid dissolution of carbonate minerals present in the sample. Quality control was established by the replicate analyses of a carbonate standard and had an uncertainty of ±5%. Organic C (OC) was calculated as the difference between TC and TIC.

2.4. Total Hg Analyses

Total digestions (TD) were conducted on all samples using a solution of 3:1 HCl:HNO3 (aqua regia). A 500 mg sample was digested in 4 mL aqua regia and gently shaken on a horizontal shaker in a fume hood overnight, diluted to 20 mL with doubly deionized (DDI) water (≥18.2 MΩ·cm, Milli-Q, Millipore, Merck KGaA, Darmstadt, Germany), centrifuged at 3000 rpm (2500 g) for 15 min, and filtered through a 0.45-µm PTFE syringe filter. For the VBBo extraction method, duplicate aliquots of 5 g of dried soil were suspended in 50 mL of 2 M HNO3 and placed in a shaking water bath at 95 °C for 2 h. Samples were then passed through Whatman ash-free cellulose filters (<2 μm). All samples were stabilized with 1% BrCl (v/v) (0.2 M BrCl in conc. HCl) following Bloom et al. 2003 [27]. The Hg concentration measurements in all total digests and VBBo extractions were performed using cold vapor atomic fluorescence spectrometry (CV-AFS, Millennium Merlin, PS Analytical). An analytical uncertainty of ±6% reflected the replicate analyses of a standard solution. Blank samples processed in parallel to all the extracts and digests contained an insignificant amount of Hg. Iron, S, and Mn in the digests and extracts were measured simultaneously by inductively coupled plasma optical emission spectrometry (ICP OES; 5100, Agilent Technologies, Santa Clara, CA, USA). Quality control was established by the measurement of blanks and two certified standard reference materials (SRM) processed in parallel (NIST-2711 and NIST-2711a, Montana Soil).
Additionally, all soil samples were analyzed for total Hg by combustion atomic absorption spectrometry (CAAS) on a Leco AMA254 mercury analyzer. Aliquots of 10 to 500 mg of soil, depending on the Hg content detected by XRF, were analyzed with two to four replicates each, and the results were averaged. For quality control, the two SRMs were repeatedly analyzed along with the soil samples.

2.5. Hg Speciation

2.5.1. Sequential Extractions of Hg

Sequential extractions were performed in triplicate on the 15 soil samples from the Visp (V) and Turtig (T) settlement areas and on six samples from the factory site (F). The method followed that of Bloom et al. (2003) with slight modifications [27]. Briefly, the method consisted of five extraction steps performed in a series of increasing solution harshness, developed to separate the Hg-species into operationally defined pools of Hg with different levels of extractability, which may be interpreted with respect to speciation. For each sample, 400 mg of soil was leached in acid-washed polytetrafluoroethylene (PTFE) vials using 40 mL of extractant in each step, such that the solid-to-liquid ratio was 1:100. All reagents used were of analytical grade and were prepared with DDI water. The first extraction (F1) was with deoxygenated DDI water targeting the “water-soluble” Hg fraction (F1). Deoxygenation was achieved by bubbling nitrogen gas through DDI water for a minimum of 4 h. The samples were placed on an end-over-end shaker for approximately 18 h, centrifuged, and filtered using 0.45 µm PTFE syringe filters. A rinse step consisted of 20 mL of the same extractant solution shaken vigorously to re-suspend the sediment pellet, then the solution was again centrifuged, filtered, and added to the extract before the procedure was repeated for the next extraction step. The remaining solutions were: 0.1 M CH3COOH + 0.01 M HCl “human stomach acid” soluble (F2), 1 M KOH “organo-chelated” (F3), 12 M HNO3 “elemental Hg” (F4), and aqua regia (3:1 HCl:HNO3) “mercuric sulfide” (F5) [27]. Extractions F1–F4 were diluted to 100 mL in acid washed, borosilicate glass, volumetric flasks. The F5 extracts were diluted to 50 mL. The Hg in all solutions was stabilized by addition of 0.2 M BrCl in concentrated HCl [27].
For better comparison with published data, we also analyzed SRM NIST-2711, and the results were compared to those published in Bloom et al. 2003 [27]. In addition, we also analyzed its replacement, SRM NIST-2711a (Montana II Soil). To our knowledge, no published sequential extraction results are available to date for SRM NIST-2711a. Due to the similarity of the nature and origin of the two SRMs, the results were also compared to those published for NIST-2711. The Hg concentrations and Fe, S, and Mn, in all sequential extraction solutions, were measured using CV-AFS and ICP-OES as described above, respectively.

2.5.2. Thermal Desorption Analysis of Hg

Thermal desorption analysis of Hg is a speciation technique based on the thermal decomposition or desorption of various Hg compounds with increasing temperatures under a nitrogen atmosphere, combined with continuous determination of released Hg(0). The specific details of the method have been described elsewhere [31,37]. Briefly, 40 to 200 mg of fresh sample were weighed out into a sample vessel in an electric furnace carrying a heated quartz measurement cell that was placed in the detection unit of an atomic absorption spectrometer (AAS, Model 3030, Perkin Elmer, Basel, Switzerland). The samples were continuously heated from 25 to 800 °C at a rate of 0.5–0.6 °C s−1 with N2 carrier gas flowing at 300 mL min−1. All Hg compounds were thermally converted to Hg(0) passing through the detection unit running in continuous detection mode [31,37]. Standard materials used for calibration and comparison of the sample pyrolysis curves were freshly prepared. The procedure included the mixing of various synthetic or natural Hg-bearing compounds with a quartz powder [31,37].

2.5.3. Methyl-Hg Analysis

Methyl-Hg (MeHg) analyses were performed by Brooks Applied Labs (Bothell, WA, USA) on the soil samples collected according to VBBo procedures, using a modification of the US Environmental Protection Agency (USEPA) Method 1630 for MeHg in water. MeHg was first extracted from the soil samples using an acid bromide/methyl chloride extraction. The sample was then analyzed by ethylation using a Tenax trap pre-concentration procedure and introduced into a gas chromatography separation followed by pyrolytic combustion and atomic fluorescence spectrometry (CV-GC-AFS) analysis using a Brooks Rand Instruments MERX-M analyzer. For quality control, several samples were spiked with MeHg where recoveries between 77 and 106% were reported. Blank samples analyzed also contained insignificant concentrations of MeHg as compared to the standard (<0.05%).

2.6. Hg Release Potential

2.6.1. Influence of CaCl2

To assess the influence of Cl and Ca2+ ions on the release potential of Hg from the soils and factory site sediments, batch extraction tests were conducted, modified after the Swiss Ordinance on Disposal of Waste (VVEA, ger.) [38]. The 15 soils were extracted using four different ionic strength solutions: DDI water and solutions of 0.001, 0.01, and 1 M CaCl2 concentration. Four grams of soil were weighed out (in duplicates) into plastic centrifuge vials and suspended in 40 mL solutions such that the solid-to-liquid ratio was 1:10. The vials were placed on an end-over-end shaker at room temperature (25 °C) for approximately 24 h. The samples were then centrifuged followed by filtration through 0.45-µm PTFE syringe filters and Hg was stabilized by addition of 0.2 M BrCl to a concentration of 1% (v/v).
To determine if Hg in the extracts was particle bound, additional batch extractions were performed on three of the soil samples (T-S2, T-S3, T-S9) containing different total Hg concentrations using 0.001 M CaCl2 as described above. The extracts were then filtered in parallel using 0.45-µm PTFE, 0.22-µm PTFE, and 0.02-µm Whatman® Anotop® alumina syringe filters, and stabilized by BrCl addition. To test the influence of time on extracted Hg, the same three soil samples were extracted for varying time periods on an end-over-end shaker (1, 6, 24, 48, 72, 96, and 168 h), centrifuged, filtered using 0.45-µm PTFE syringe filters, and stabilized by BrCl addition. The Hg and Fe, S, and Mn concentrations in all batch extraction solutions were measured using CV-AFS and ICP-OES as described above, respectively. Where possible, dissolved organic carbon (DOC) analyses were measured in the extracts using a DIMATOC 2000 (DIMATEC Analysentechnik GmbH, Essen, Germany), which utilizes high temperature combustion of all extracted carbon after acidification changes it to carbonic acid. Oxygen gas carries the produced CO2 into an infrared detection unit. DOC was not measured in the 1 M CaCl2 batch extractions due to the high salt content of the solution matrix. Uncertainty on the DOC measurements was assigned by the standard deviation of the samples measured in a minimum of triplicates.

2.6.2. Influence of Redox Processes on Hg Release

To assess the influence of varying redox conditions on the mobility of Hg in the soils, one soil sample (T-S9) was continuously extracted in batch reactors purged either with nitrogen (N2) gas or ambient air (see Figure S2). First, 50 g of soil was weighed out each into two 500 mL borosilicate glass reaction vessels, which were then filled with 500 mL of a 0.01 M CaCl2 solution. The reactors were capped and all ports were sealed airtight except for a central port, which allowed for a continuously rotating stir bar, and a small side port used for bubbling the reactors with N2 or air. Subsamples were taken by quickly opening one of the sealed side ports and collecting 50 mL of solution using a syringe sampler after 1, 6, 24, 48, 72, 96, 120, and 168 h. The port was immediately capped, and bubbling and stirring resumed. The Eh and pH of the subsamples were promptly measured by placing a small aliquot of the subsample into a separate anoxic chamber. The remaining solution was immediately centrifuged and filtered with 0.45-µm PTFE syringe filters, and the solution was stabilized for analysis of Hg. The Hg and Fe, S, and Mn in all reactor subsamples were measured using CV-AFS and ICP-OES as described above, respectively. The DOC concentrations were also measured in all reactor subsamples as described above.

3. Results

3.1. Sample Characterization and Total Hg Determination

Selected chemical properties of the soil and sediment samples are provided in Table S1. All samples exhibited circumneutral pH (pH 6.2–8.1), except for factory sediment F-A1, which was more alkaline (pH 10.5). The Visp and Turtig soils contained smaller amounts of inorganic C (0.1–10.9 g/kg) than the factory sediments (14.7–48.5 g/kg). The organic C contents in the soils (12.6–26.2 g/kg) were higher than in the factory sediments (0.8–12.2 g/kg), except for F-D4 with 105.6 g/kg organic carbon. The nature and origin of this anomalously high organic C content in this sediment is currently unclear.

3.1.1. Total Hg in Soils and Sediments

The total Hg concentrations and Hg extracted with the Swiss VBBo method (hot 2 M HNO3) of the soils and factory sediments are shown in Figure 1a. Total Hg ranged from 0.5 to 28.4 mg/kg in the soils and from 3.5 to 174.7 mg/kg in the factory sediments, respectively. The highest Hg concentrations were found in samples F-F1 and F-F2, which were collected at a location on the factory site known to be a former intermediate storage area of waste products from the chemical manufacturing processes and excavated GGK sediments. Sample pairs F-F1/F2 and F-A1/A3 had higher Hg concentrations in the upper layers compared to the corresponding deeper layers. Sample pair F-D2/D4 showed reverse trend, with the higher Hg concentration at greater depth, as was previously observed in other studies in this area [15]. Of the soils from the settlement areas in Visp and Turtig, the highest Hg concentrations were found on two plots adjacent to the GGK (T-S3 and T-S8). The amounts of Hg extracted with the VBBo method were in excellent agreement with the total Hg as determined by total digestion with aqua regia, and CV-AFS analysis (R2 = 0.9926, n = 22) (Figure 1a). Only for the three most contaminated factory sediments (F-A1, F-F1/F2), did the VBBo procedure result in incomplete extraction (Table S1).

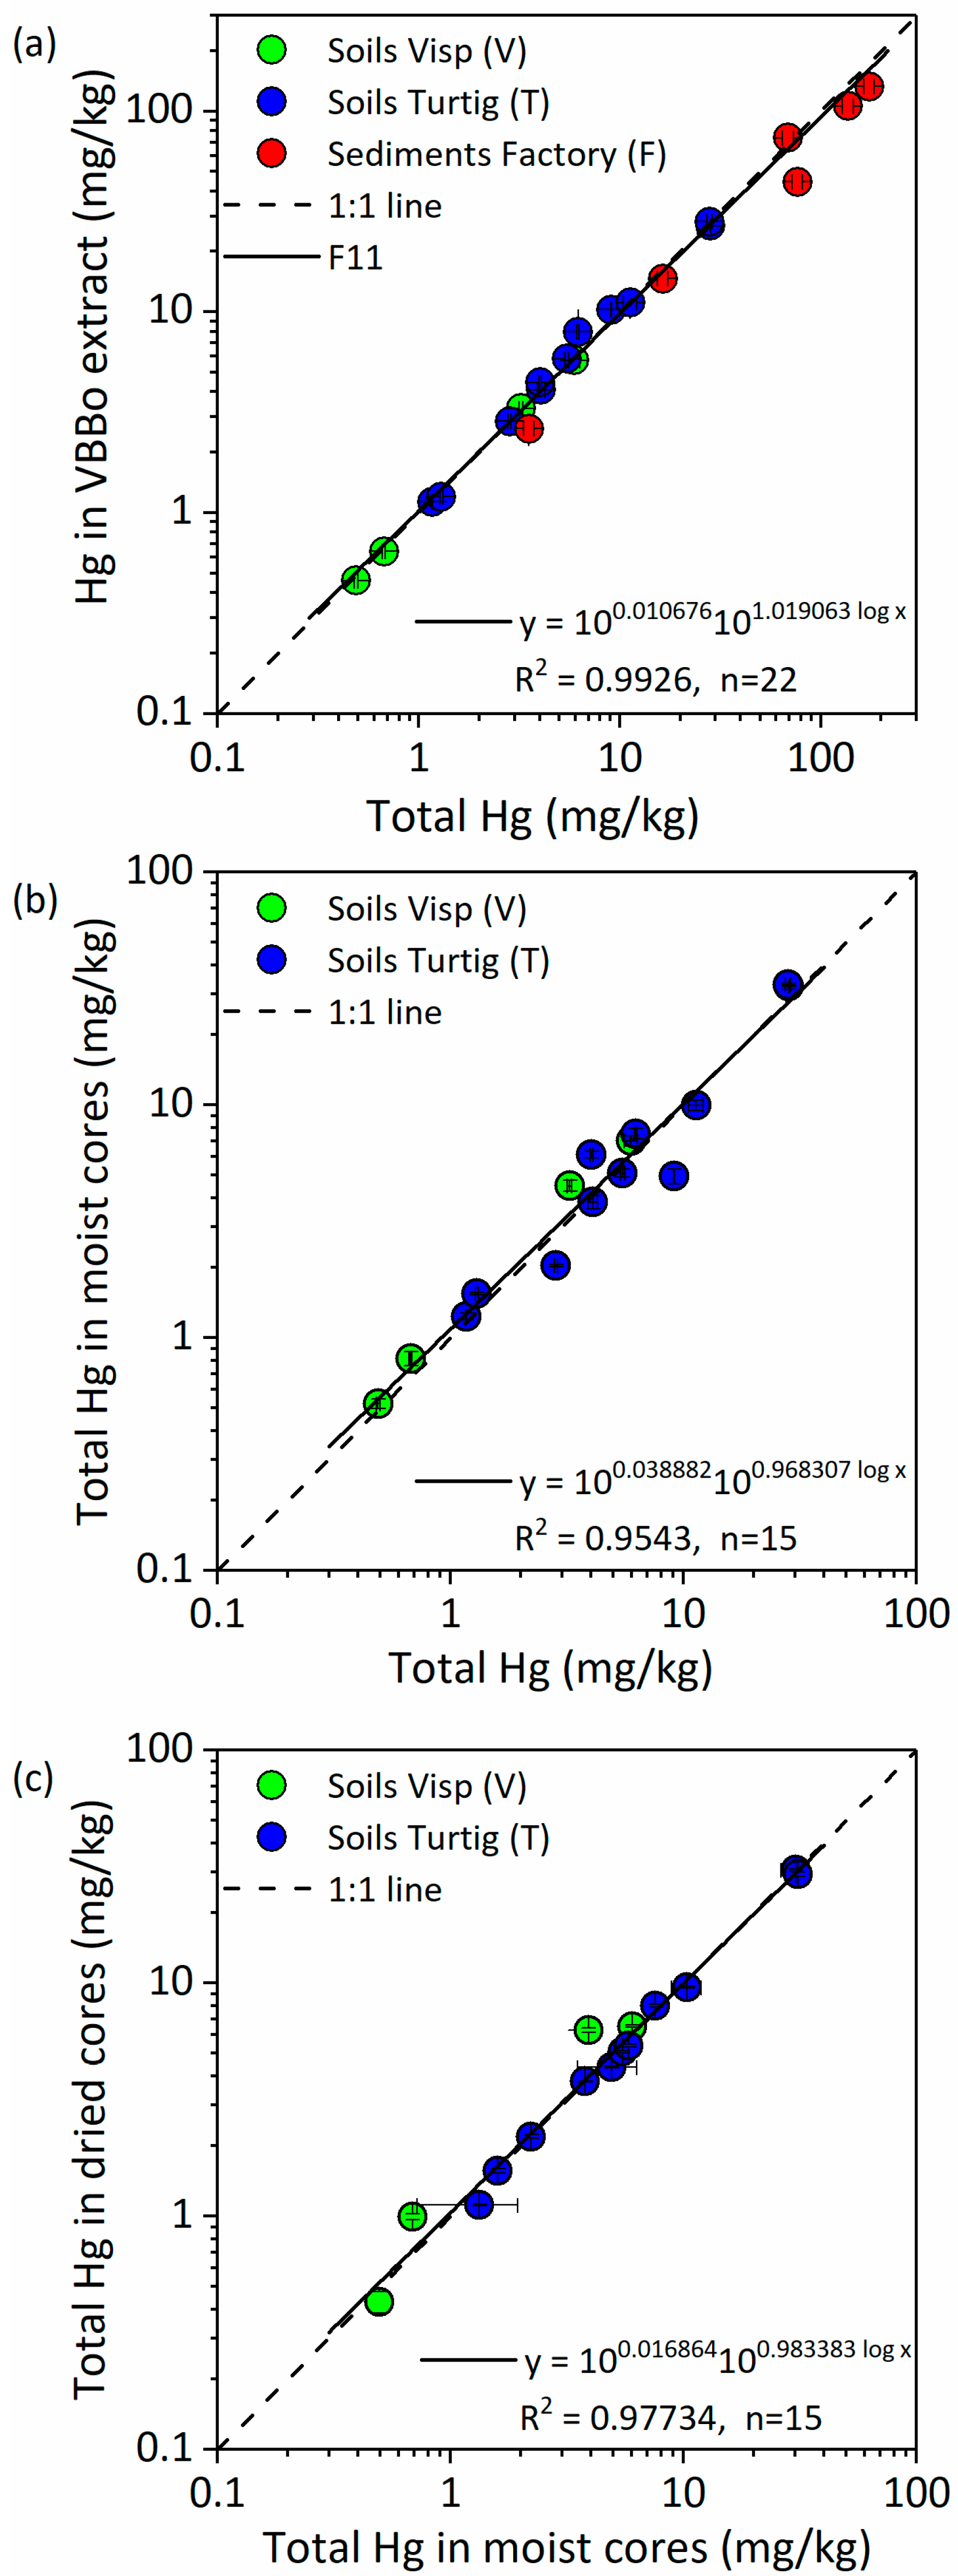
3.1.2. Effect of Soil Sampling Method

The VBBo sampling method was validated against additional soil samples collected side-by-side as undisturbed soil cores, which were further processed in a cold room at 4 °C and analyzed without drying to minimize evaporation losses of Hg. Figure 1b shows a comparison of the total Hg concentrations as determined by aqua regia digest and CV-AFS analysis of the VBBo samples (dried at 40 °C) and the mixed and sieved core samples (analyzed field moist, results corrected for gravimetric water content). The correlation between the results of both sampling methods was high (R2 = 0.9543, n = 15), with a slope of 0.968 and an intercept of 0.039. This indicates that both sampling methods yielded comparable results; however there was some random scatter around the 1:1 line. Since there was no systematic difference, we attributed the scatter primarily to soil heterogeneity rather than errors resulting from soil pre-treatment or analytical techniques. Soil heterogeneity was therefore detectable, even though the 16 VBBo and core samples per 10 × 10 m2 square were taken pairwise directly next to each other, to minimize this source of error. For two independent samplings of the same 10 × 10 m2 plots, one would expect a significantly larger sampling error than observed in pairwise sampling.

3.1.3. Effect of Sample Drying

The effect of drying on the soil samples in an oven at 40 °C on the total Hg concentrations is illustrated in Figure 1c. For this comparison, the soils collected with the core sampling method were analyzed in the moist state and after drying at 40 °C. The results for moist soils were corrected for their gravimetric water loss upon drying at 40 °C. For all except two samples, the Hg concentrations measured in dried samples were nearly identical to the Hg concentrations measured in the moist samples. For two samples (V-S4, V-S5), a slightly lower value was measured in moist soil than in the corresponding dried soils, which could not be explained by losses of Hg during drying. We rather attributed these deviations to a larger analytical error for moist samples, because these samples could not be finely ground and were therefore more heterogeneous than dried and ground soil samples. Moreover, the water content in the moist samples was heterogeneously distributed, which could also contribute to a larger analytical error for moist samples. Overall, the correlation between both sets of analyses was high (R2 = 0.9973, n = 15), with a slope of 0.983 and an intercept of 0.017, implying that drying the soil samples at 40 °C had no detectable effect on their total Hg concentrations in these field soil samples.

3.2. Hg Speciation

3.2.1. Hg Pools Determined by Sequential Extraction

The results of sequential extractions of all soils, sediments, and the two reference materials (NIST 2711 and 2711a) are depicted in Figure 2 and summarized in Table S2. The Hg recovery, calculated as the sum of fractions F1 to F5 as a percent of total Hg as determined by aqua regia digestion and CV-AFS, ranged from 74 to 108%, except for two soils with unacceptable recoveries of 47 and 128%, respectively (Table S2). These two samples were excluded from further discussion and are therefore not shown in Figure 2. On average, the sequential extractions of factory sediments yielded somewhat better recovery (92%) than for the soil samples (87%). Our results for the reference materials were in good agreement with published results for NIST-2711, although our recovery was somewhat lower than in Bloom et al. [27] (Figure S3).
The sequential extraction results for soils and factory sediments showed clear trends with increasing total Hg in the samples. The extraction steps F1 (deionized water) and F2 (0.01 M HCl + 0.1 M CH3COOH) mobilized only very small fractions of the total Hg in soils (0.1–1.5% in F1; 0.01–0.5% in F2) and sediments (0.02–1.5% in F1; 0.3–1.1% in F2). In most soils, the majority of the Hg was recovered in fraction F3 (1 M KOH), which was expected to extract primarily Hg associated with soil organic matter [27]. Samples with low total Hg contents had the highest percentages of Hg in this fraction. With increasing total Hg, the relative contributions of F3 decreased, while those of F4 (12 M HNO3), and F5 (aqua regia) tended to increase, with some exceptions. The fractions F4 and F5 represented the two strongest acid extractions, targeting free elemental Hg and Hg bound to Fe and Mn oxides, and Hg in sulfides, respectively [27]. Soil samples T-S7, T-S9, and V-S5 had large relative fractions of Hg in F4. Similarly, in the six factory sediments, four of which had the highest total Hg concentrations of all samples, most Hg was extracted in fractions F4 and F5. This increase in Hg corresponded to a dramatic increase in extracted Fe in fraction F4 (data not shown). Sample F-A1, collected from the former acetaldehyde plant, and samples F-F1 and F-F2 had the majority of the Hg in fraction F5.

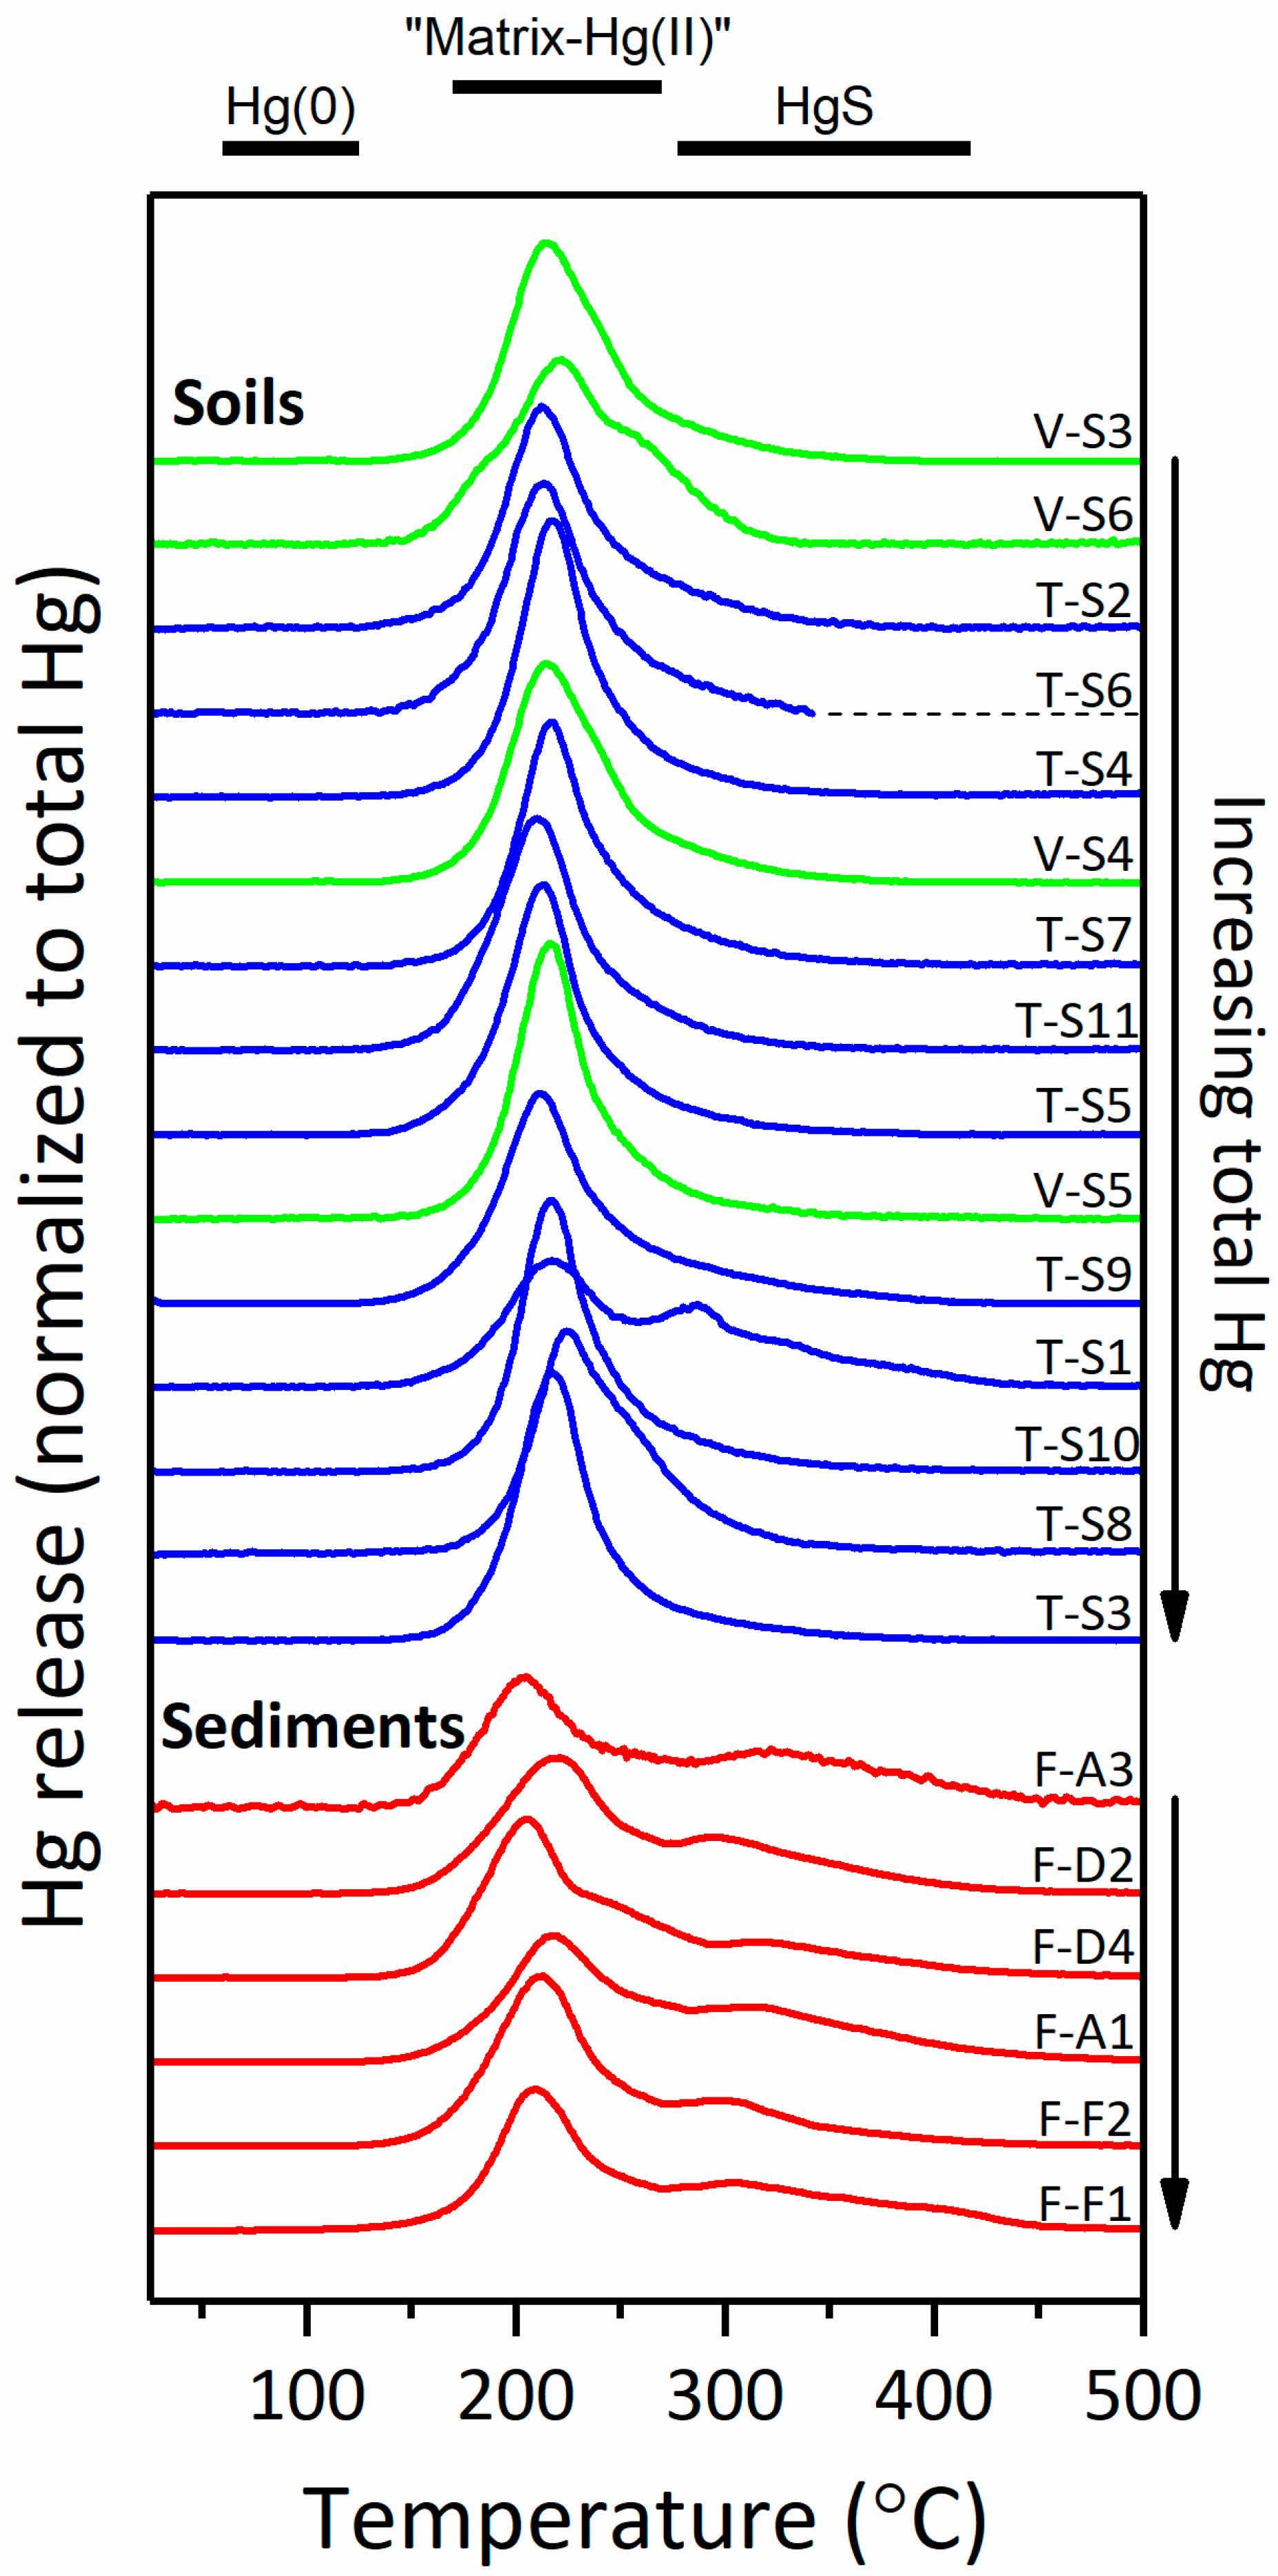
3.2.2. Thermal Desorption Analysis of Hg
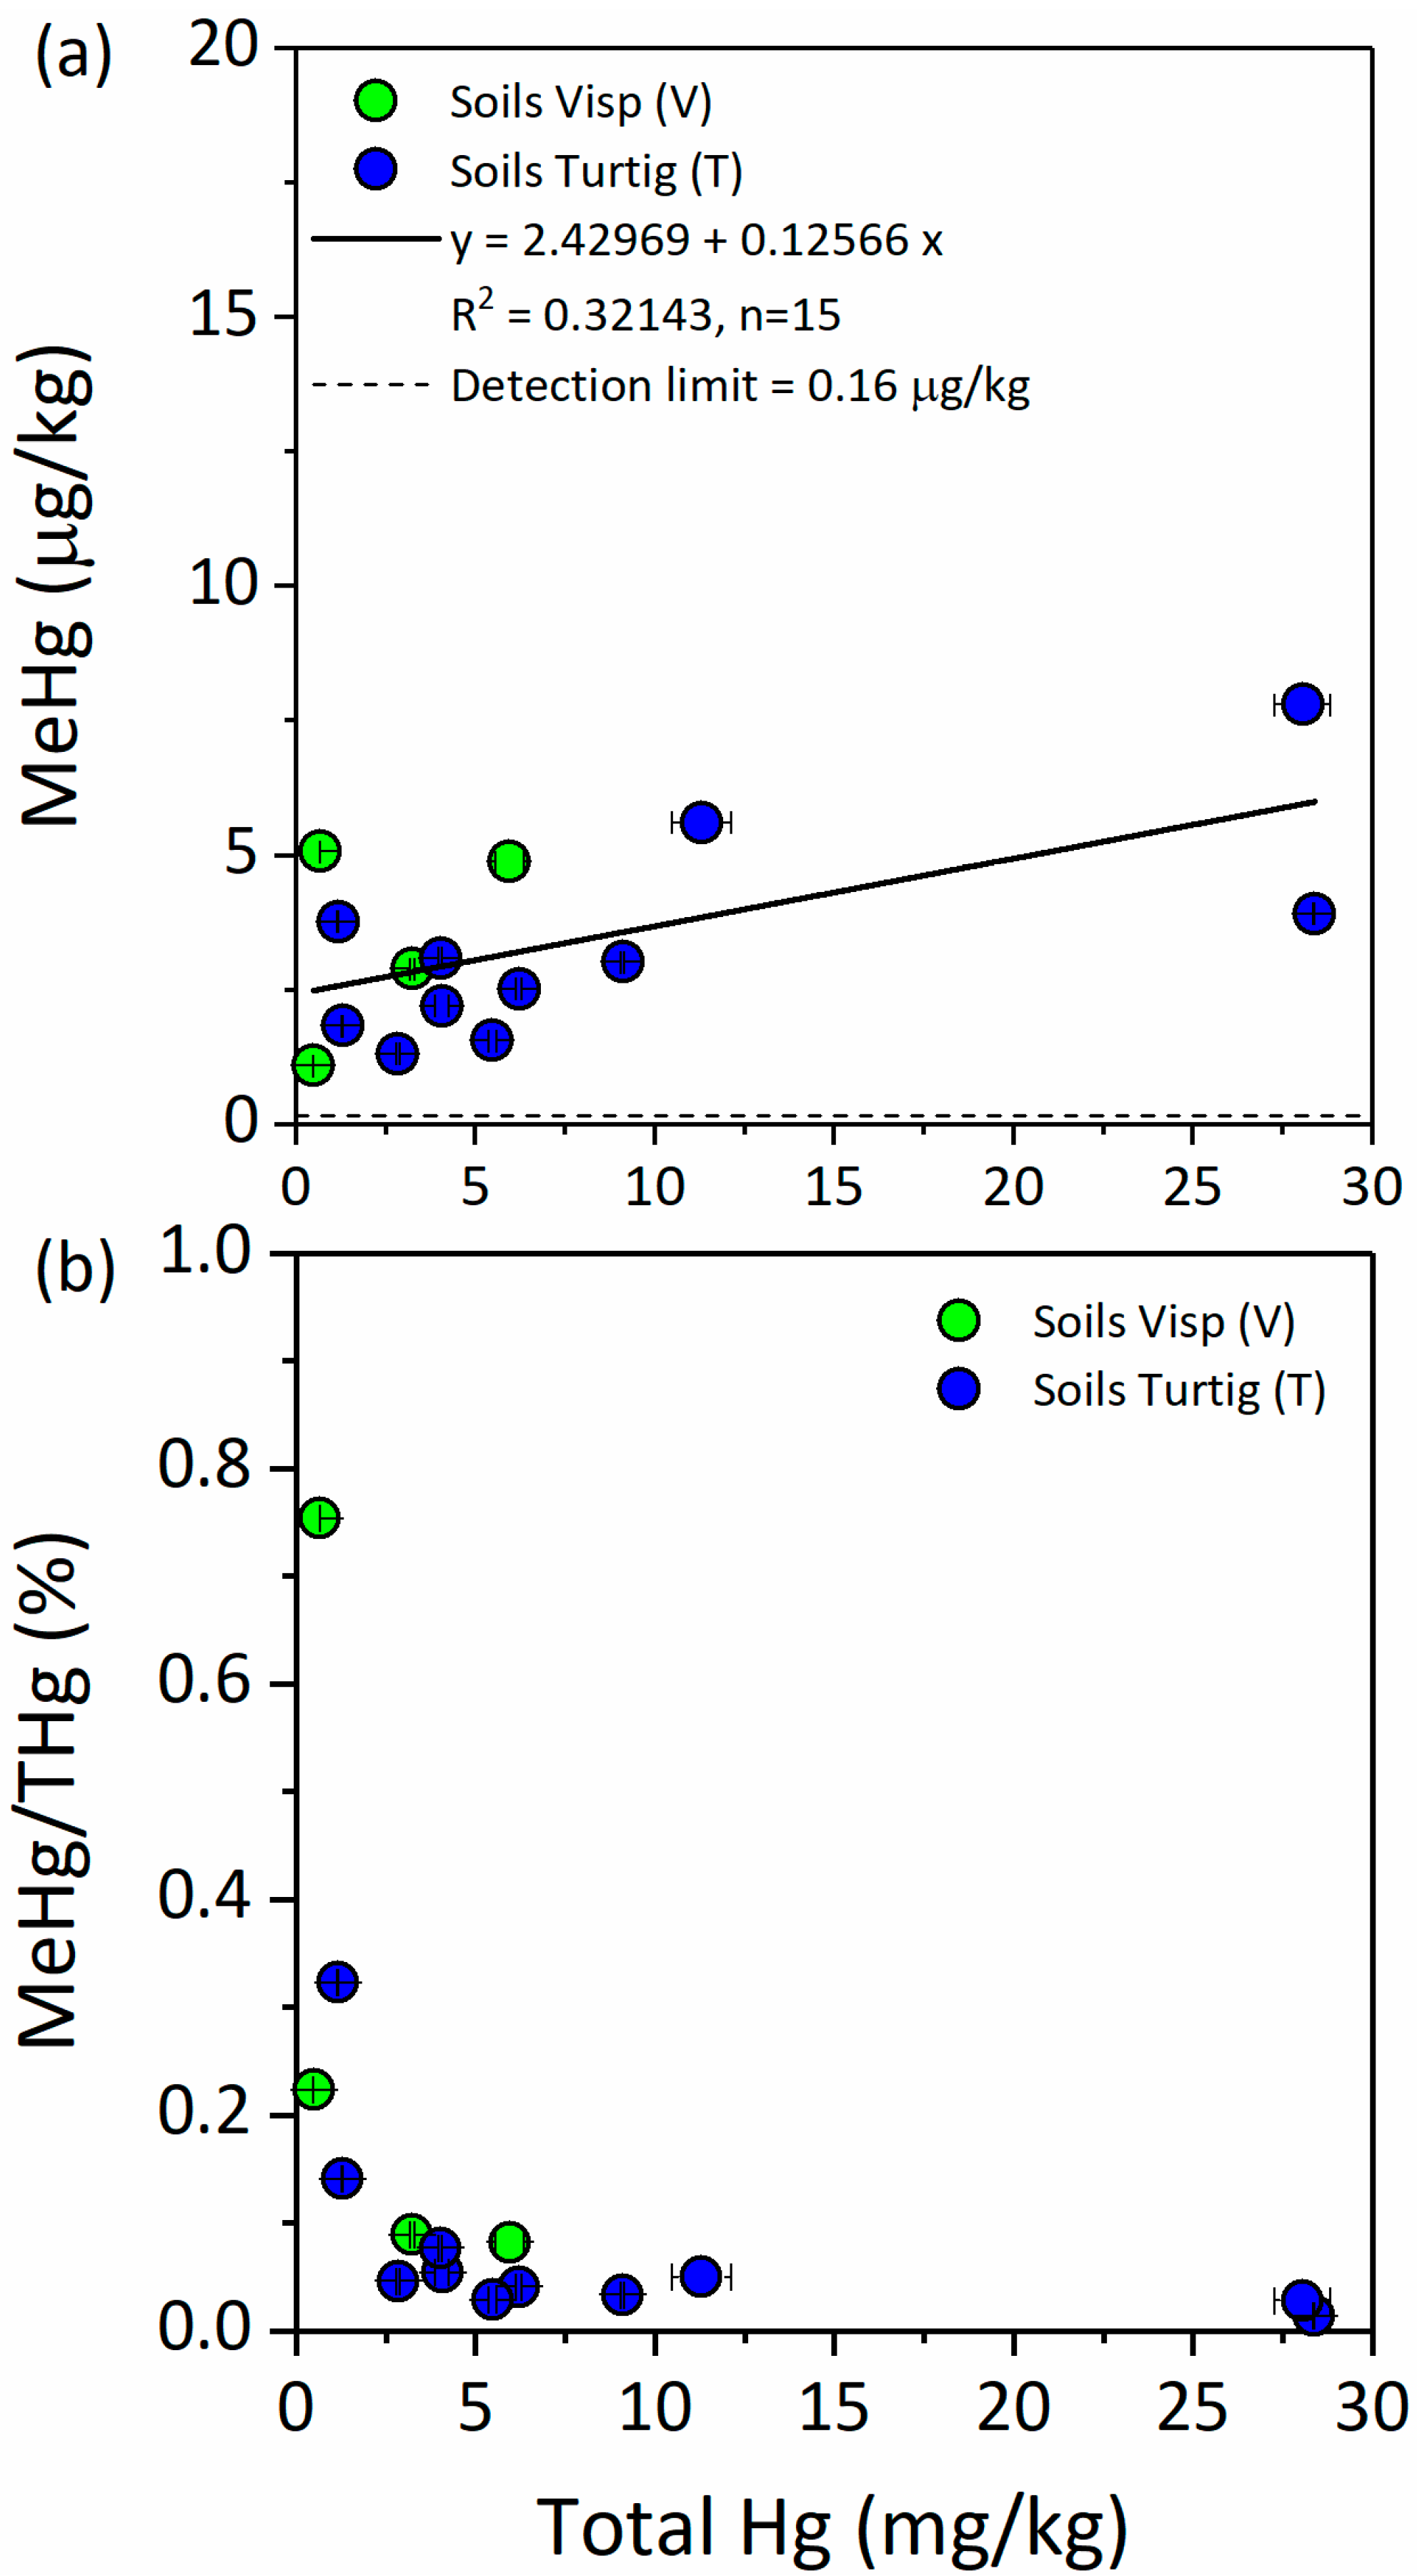
The thermal desorption approach to Hg speciation in soils relies on a slow decomposition or desorption of different Hg-binding forms as a function of temperature, thereby producing individual Hg release peaks for the various species present in the sample. Figure S4 shows the release curves for the standards used in this study. Elemental Hg(0) is released at the lowest temperatures, resulting in a peak maximum around 100 °C or lower. At higher temperatures, some of the most important Hg-binding forms found in soils (i.e., Hg bound to organic matter, Hg bound to Fe-(oxyhydr)oxides, and Hg bound to sulfur in metacinnabar [β-HgS]) produce overlapping peaks between approximately 150 and 300 °C, making differentiation of these species difficult [31,32]. Thus, when Hg thermal release curves of an environmental sample are plotted in this temperature range, the Hg is referred to as “matrix-bound Hg(II)”, not specifying whether it is bound to clay minerals, oxides, organic matter, or other soil solids [31]. Nonetheless, thermal release curves of Hg can help to delineate possible Hg species in the soils.
Figure 3 shows the thermal Hg desorption curves obtained with field-fresh soils and sediments. The release curves of all 15 soils were very similar to each other, with some minor differences. Most importantly, none of the samples released Hg at temperatures below 130 °C, showing that elemental Hg(0) was not a major species of Hg. For all but one soil, Hg release resulted in a single peak with a maximum between 209 ± 2.9 and 226 ± 1.5 °C (Emaxave = 216 ± 14 °C). Only soil sample, T-S1, showed a small additional peak at higher temperature (Emax = 286 °C). Also, the thermal release curves of most sediment samples exhibited a broad second peak or shoulder at higher temperatures, which may indicate the presence of sulfide-bound Hg.

3.2.3. Methyl-Hg

The MeHg contents of the field soil samples are displayed in Figure 4a, plotted against the corresponding total Hg contents of the soils. The measured MeHg concentrations ranged from 1.09 to 7.80 μg/kg, corresponding to 0.014–0.754% of the respective total Hg contents, with the majority of the samples having around 0.1% respectively. The influence of total Hg on MeHg contents appeared to be minor, and no spatial pattern was recognized. The relative fraction of MeHg in the percent of total Hg strongly decreased with increasing total Hg content (Figure 4b).

3.3. Hg Release Potential from Soils and Sediments

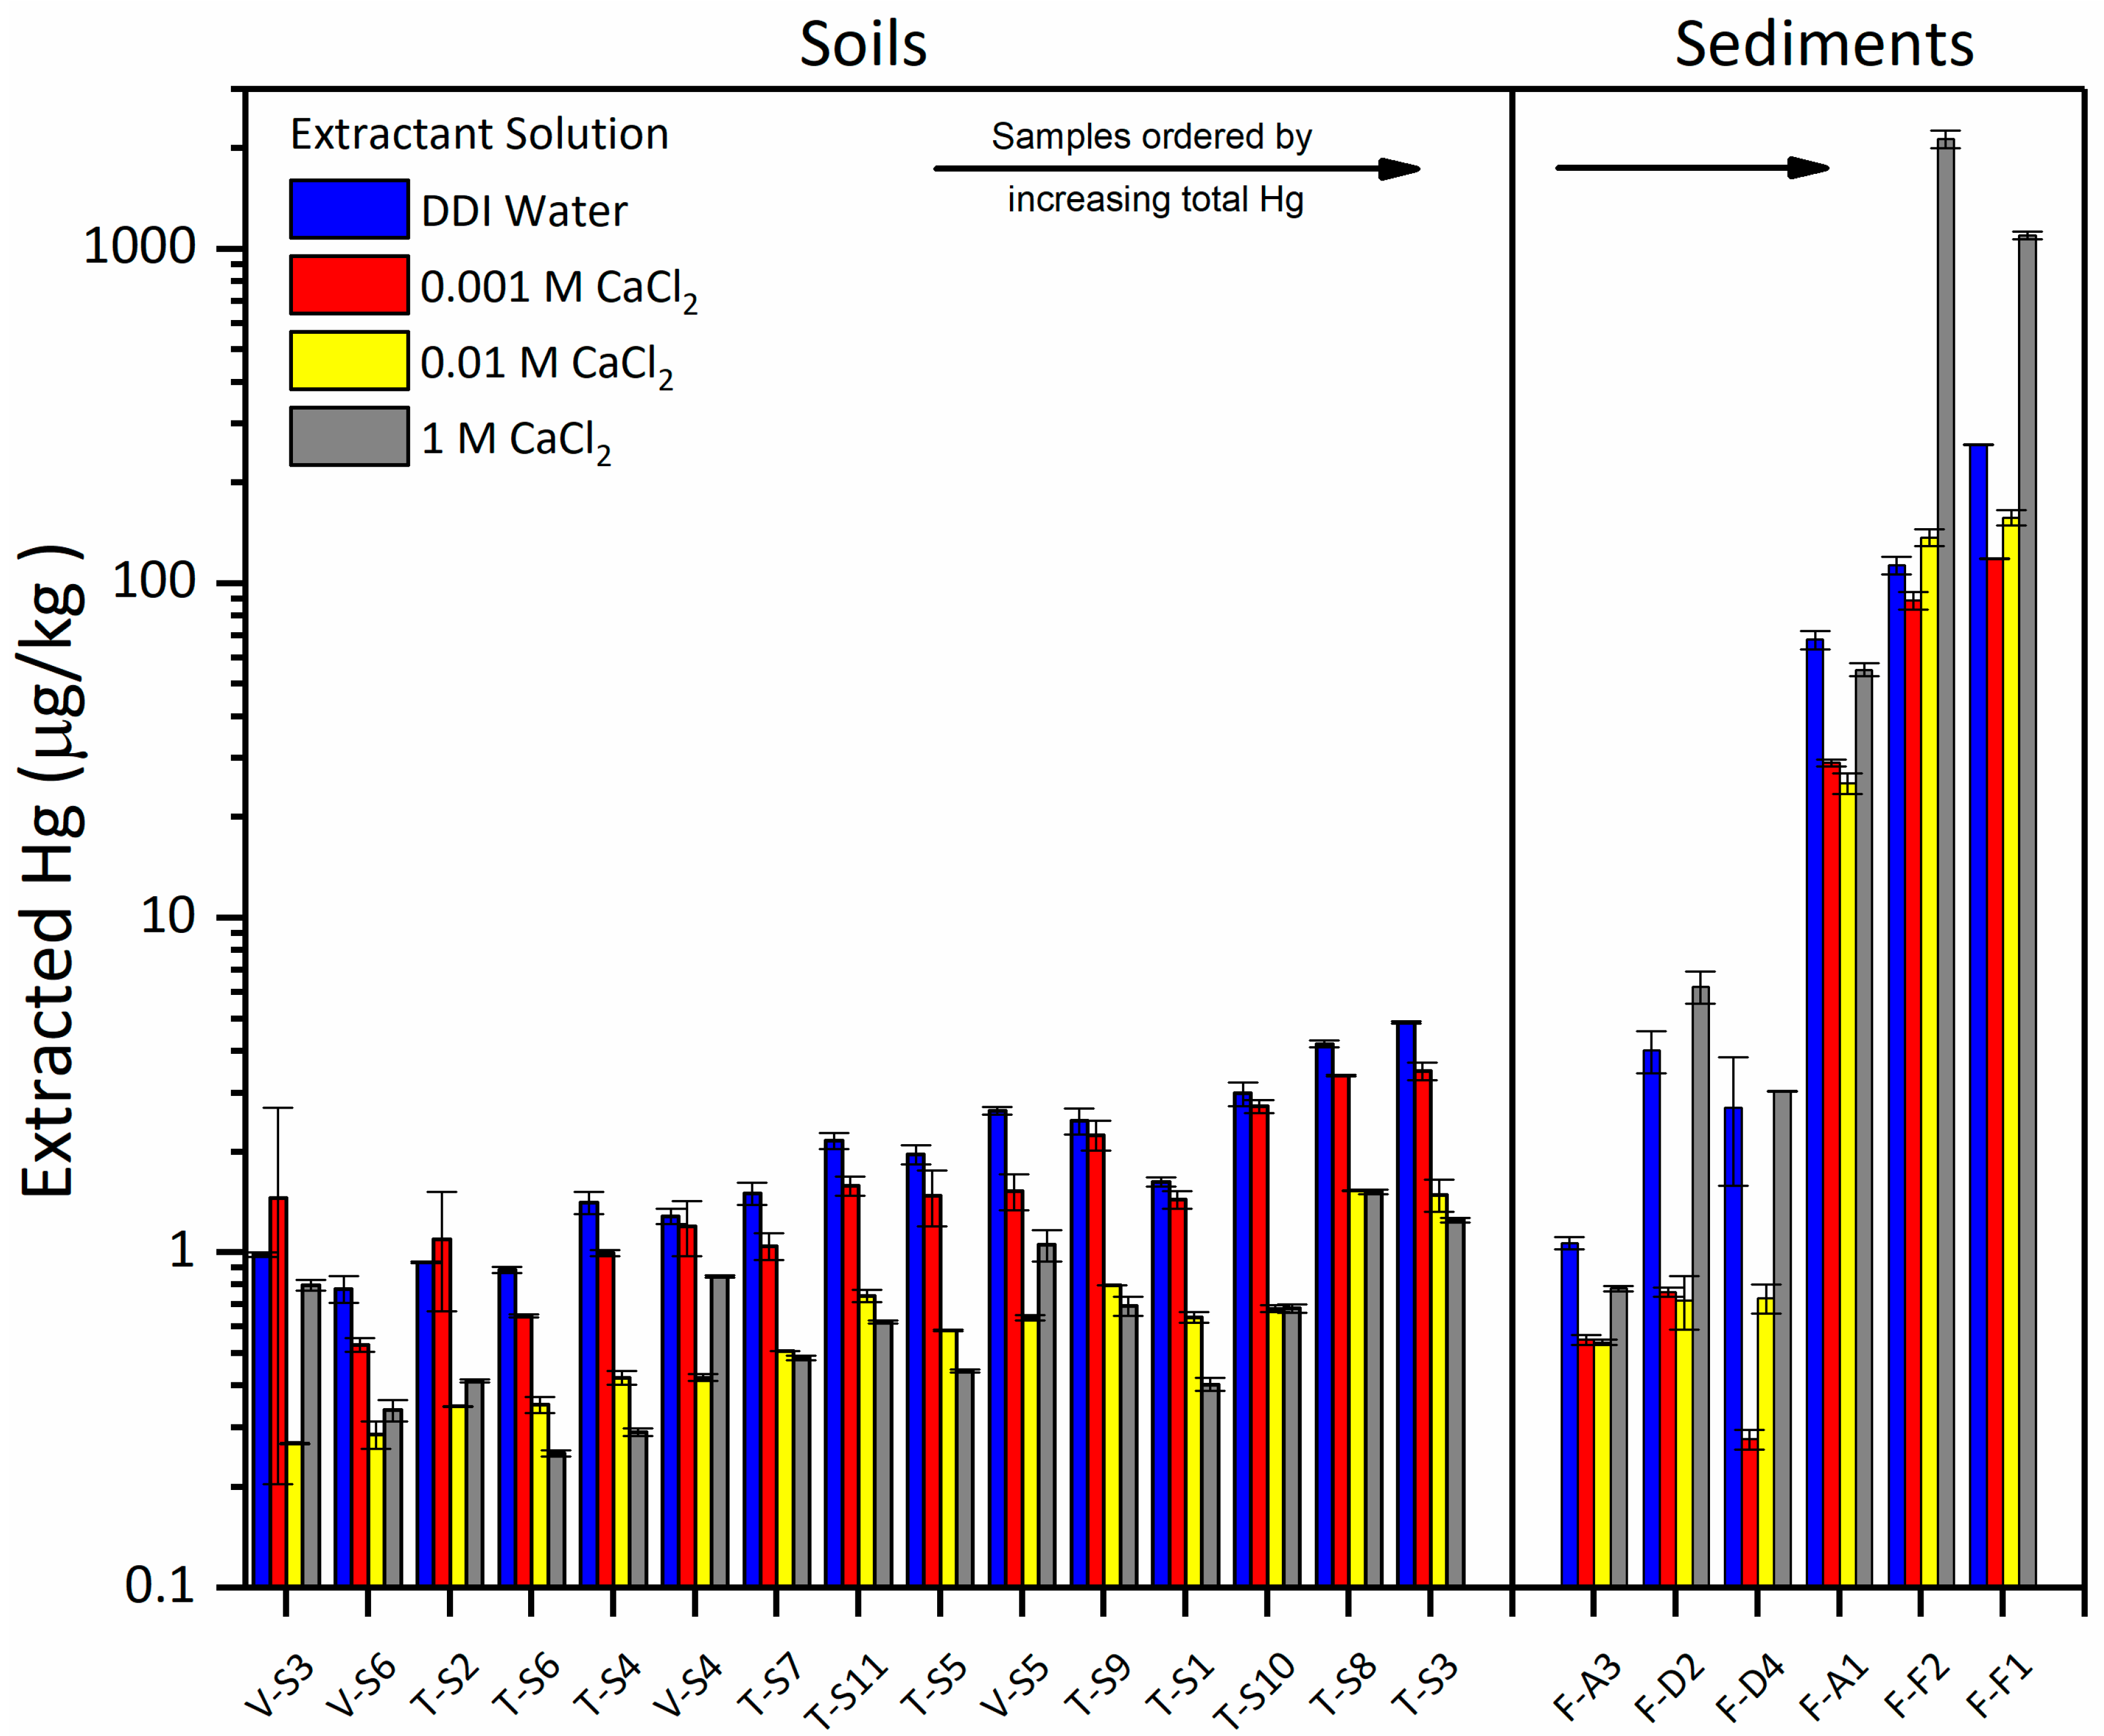
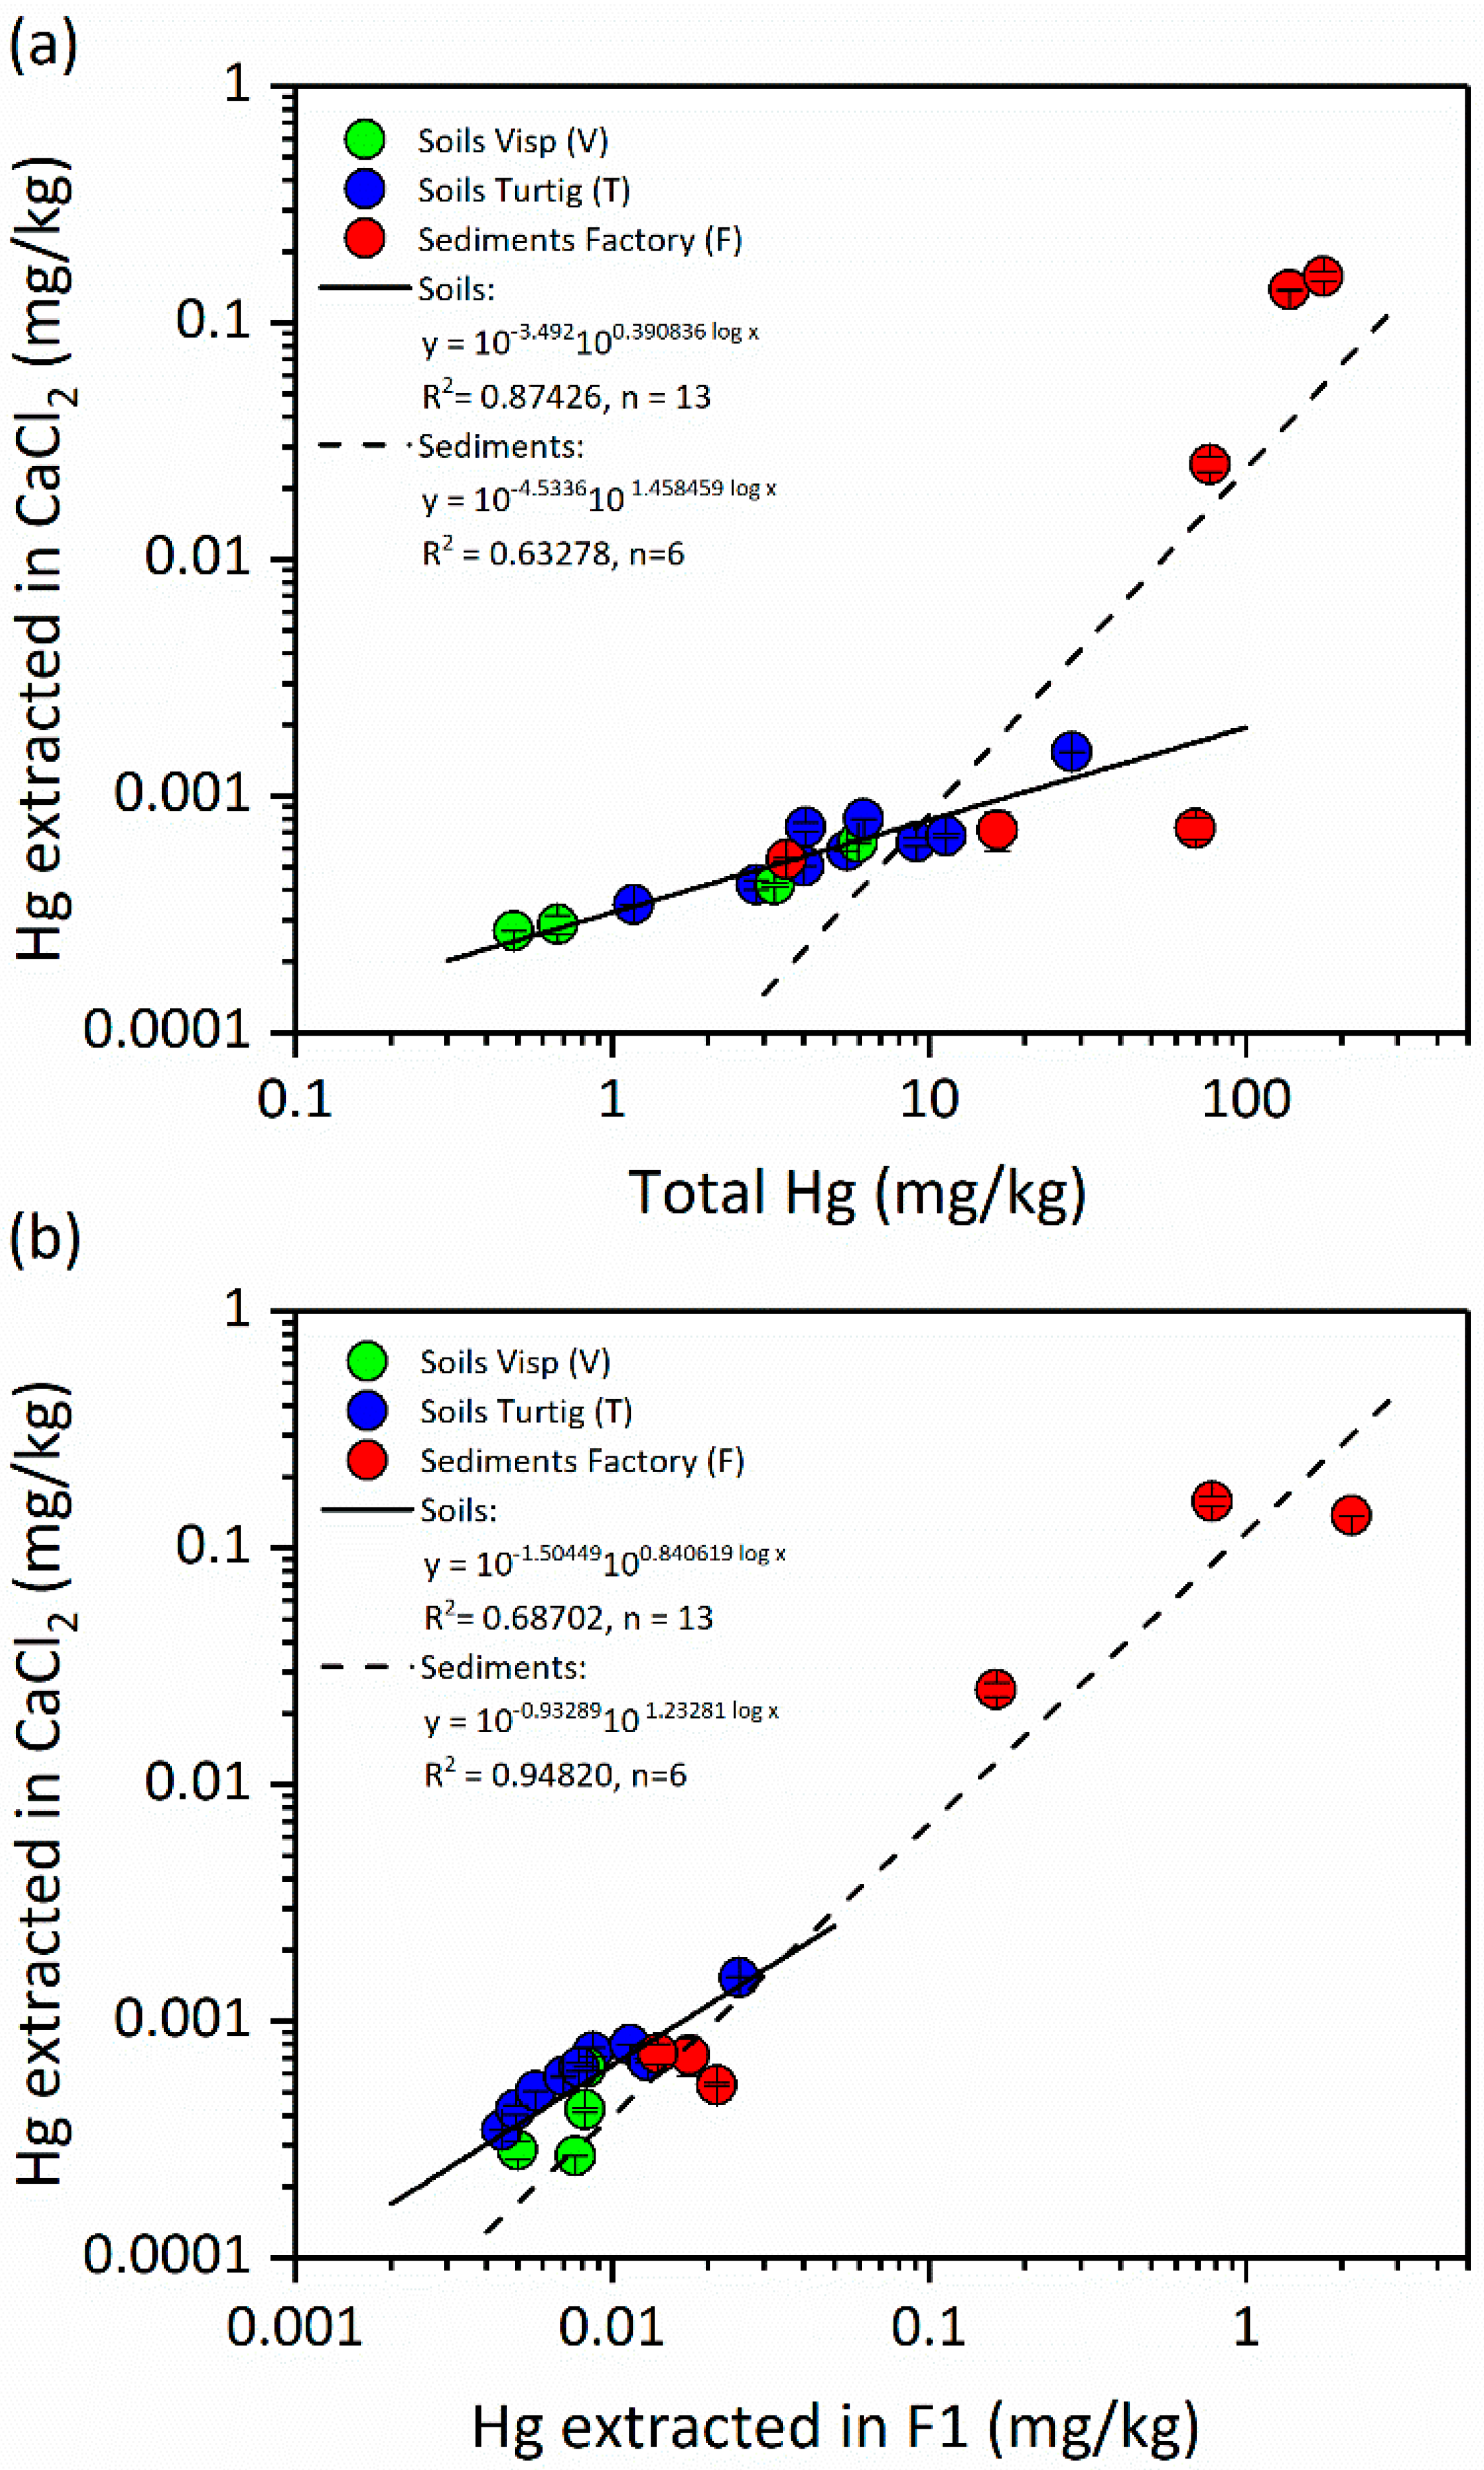
3.3.1. Effect of CaCl2 on Hg Solubility

The results of batch extractions of Hg from all soils and sediments at different CaCl2 solution concentrations are presented in Figure 5. Overall, the 15 soils generally exhibited very low Hg solubility. There was an increase in extracted Hg concentration with increasing total Hg; however, the relative fraction of total Hg released was greatest in the least contaminated samples, and decreased with increasing total soil Hg content. There was a significant decrease of extracted Hg (Figure 5) and DOC (Figure S5) with increasing CaCl2 concentration in the extractant solution. This shows that neither the presence of Cl- in solution, nor the presence of Ca2+, had a solubilizing effect on soil Hg. The decrease in extracted DOC with increasing CaCl2 concentration suggested that soil organic matter remained more strongly aggregated during batch extraction, thus releasing less DOC. This may have contributed to the lower release of DOC-bound Hg to solution. The Fe and S concentrations in the extracts did not display any consistent trends with increasing total Hg concentrations (Figure S5). Overall extracted Fe was low (<0.2 mg/L), and extracted sulfur varied as a function of the total S concentrations of the samples.
In comparison to the soils, the batch extractions of the sediments from the factory site showed somewhat different results (Figure 5 and Figure S5). Again, there was a clear increase in extracted Hg, with increasing total Hg content of the sediments. Also, more Hg was mobilized in DDI water extracts than in the presence of low CaCl2 concentrations, suggesting that an aggregating effect of Ca2+ was observed for soils. However, in contrast to the soils, a further increase of the CaCl2 concentration resulted in enhanced Hg mobilization from the sediments, especially in 1 M CaCl2 extracts of the most highly contaminated samples F-F1 and F-F2. Hg mobilization in all CaCl2 extracts of these samples, as well as F-A1, by far exceeded the Swiss remediation limits for Hg in groundwater (2 μg/L; or 0.5 μg/L in water protection areas) [36]. In addition, sediment samples displayed a much lower overall DOC concentration in the extracts than the soils (Figure S5), with the highest DOC concentrations observed in sample F-D4 (DOCave = 12.0 mg/L in the DDI water and CaCl2 extracts), which also had the highest total organic carbon content of the sediments. As in the soil extracts, extracted concentrations of Fe and S were low and showed no consistent trends with increasing total or extracted Hg (Figure S5).
Figure 6a shows the relationships between Hg extracted with 0.01 CaCl2 (batch extract, L/S ratio = 1:10) and total Hg in soils and sediments. For soils, there was a close correlation between both measurements (R2 = 0.8743, n = 13), but for the sediments, the correlation was much weaker (R2 = 0.6328, n = 6) and exhibited a very different slope, mainly caused by the three most contaminated samples, which had a much higher relative Hg extractability with 0.01 M CaCl2. Figure 6b shows relationships between Hg extracted in extracted with 0.01 CaCl2, and Hg extracted in fraction F1 of the sequential extraction procedure (DDI water, L/S ratio 1:100), respectively. When considering all soils and factory sediments collectively, the resulting correlation was strong (R2 = 0.9473, n = 19, not shown). A separate correlation for soils was weaker (R2 = 0.6870, n = 13), whereas that for sediments alone was also strong (R2 = 0.9482, n = 6). Again this was mainly attributed to the high relative extractability of Hg in the three most contaminated sediment samples.
The results of filtration tests with soil extracts (0.001 M CaCl2) obtained from three soils are displayed in Figure S6. None of the analytes (Hg, Fe, S, DOC) displayed significant decreases in concentration after filtration of the extracts through 0.45, 0.22, or 0.02 μm membrane filters. A small decrease in Hg concentration was only observed for the 0.02 µm filtrates of extracts from samples T-S9 and T-S3, whereas the DOC, Fe, and S concentrations remained unaffected. These results suggest that colloidal or particle-bound Hg (>0.02 μm) played a very minor role in the extracts obtained with 0.001 M CaCl2 solutions.
Figure S7 displays the results of batch extractions of the same three soil samples obtained after different equilibration times between 1 and 170 h. Interestingly, the extracted Hg concentration from all three soils decreased with equilibration time, especially in the first 48 h. After 48 h, the Hg concentrations in the extracts remained nearly constant. Extracted Mn and Fe were very low, extracted S depended on the total S content of the soil and was stable over time, and pH and DOC exhibited initial small increases, followed by slight decreases over time. None of these parameters seemed to be related to the observed decrease in Hg concentration during the first 48 h of equilibration.

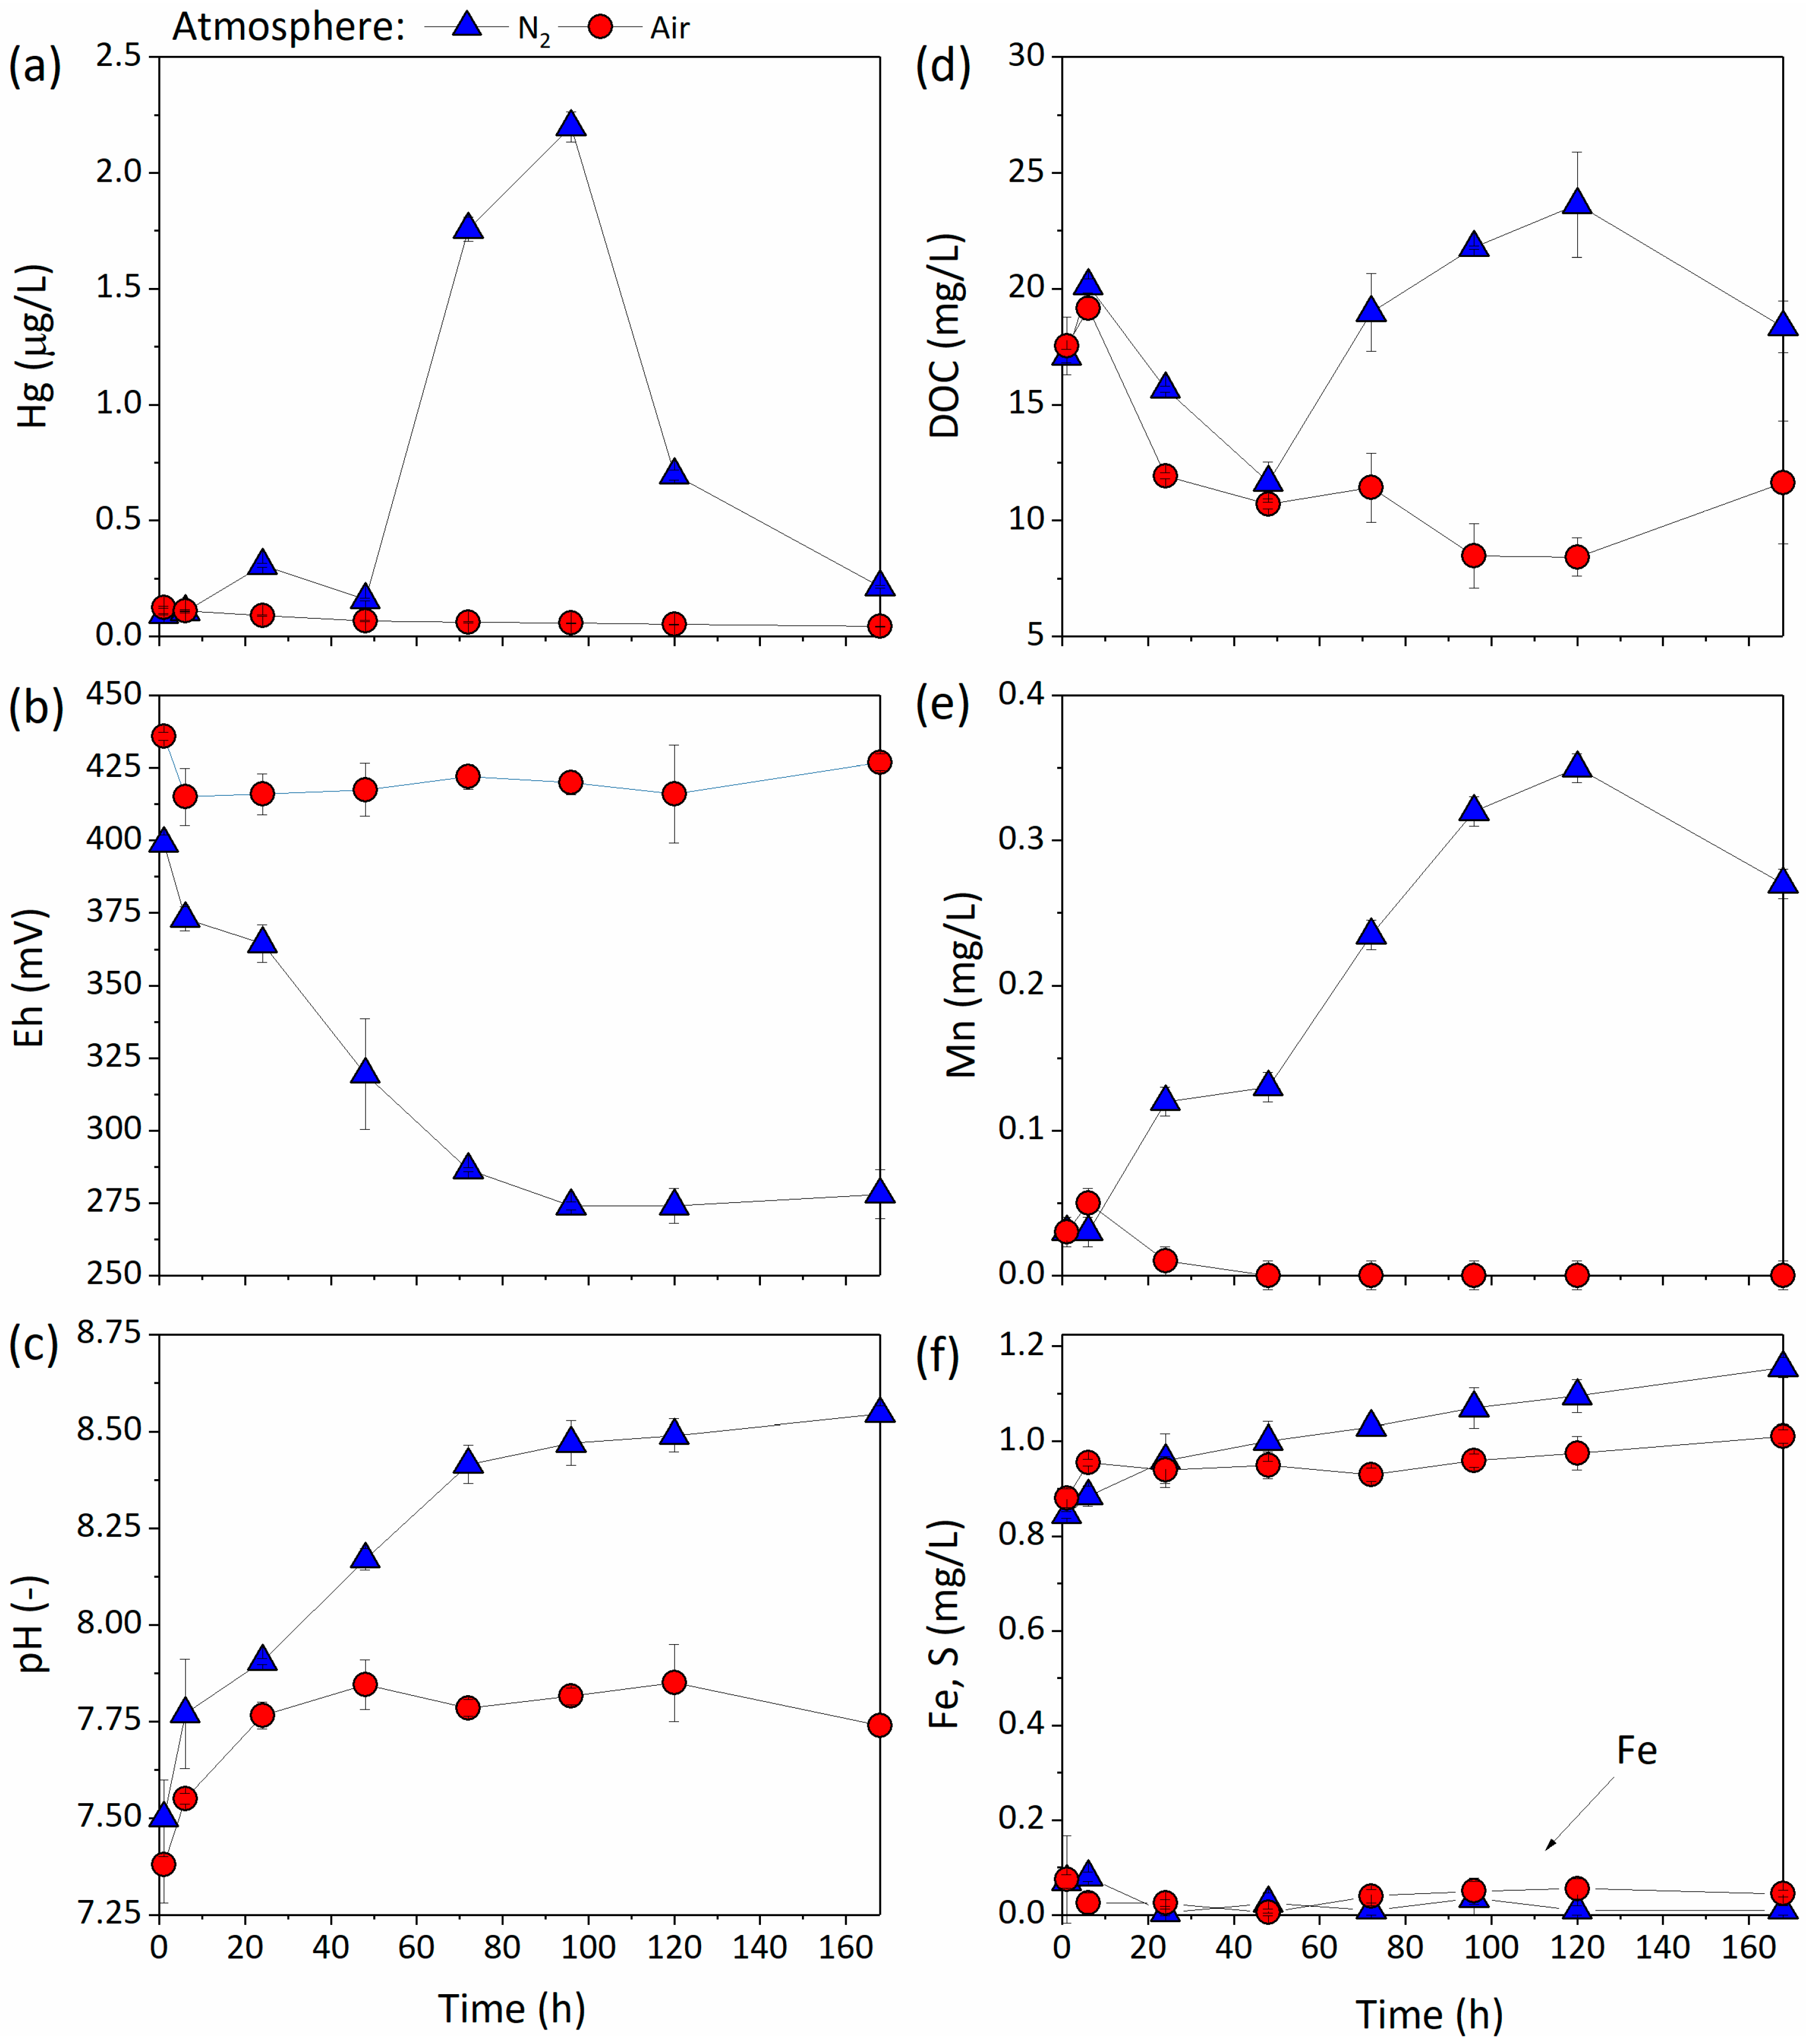
3.3.2. Effect of Redox Processes on Hg Mobility

Figure 7 displays the temporal development of solution pH and Eh, as well as dissolved Hg, Fe, Mn, S, and DOC in the redox reactor experiment conducted with soil T-S9. The results reveal a stark contrast in Hg mobility under different atmospheric conditions (N2 or air). The released Hg concentrations in both reactors were low until about 48 h, after which the dissolved Hg drastically increased in the reactor with N2 atmosphere. In this reactor, a maximum of approximately 2.2 µg/L was reached after 96 h, followed by a sharp drop in dissolved Hg. In contrast, in the reactor under an air atmosphere, the dissolved Hg remained low and even decreased with time, as was previously observed in our batch extractions.
Other measured parameters also showed significant differences between air and N2 atmosphere. In the reactor with N2 atmosphere, Eh decreased and pH increased by one pH-unit, while Eh remained stable and pH increased only slightly under air. The concentrations of dissolved Mn, Fe, and S showed that some Mn reduction, but no Fe and S reduction, occurred in the reactor with N2 atmosphere. The release of DOC was initially similar in both reactors, but started to increase after 48 h under N2 atmosphere as compared to air, indicating that this additional DOC release was also induced directly or indirectly by redox reactions.

4. Discussion

4.1. Total Hg in Soils and Sediments

Our results clearly showed that there were no losses of Hg during oven drying of soils at 40 °C and the 2 M HNO3 extraction following Swiss VBBo procedures recovered nearly 100% of the total Hg from all soil samples. This results are in line with the thermal desorption analyses, which showed that elemental Hg was not detectable, and sulfide-bound Hg was only indicated as a minor species in one of the soils. In all 15 soils analyzed in this study, Hg was primarily present as “matrix-bound Hg(II)”, which was extracted quantitatively by hot 2 M HNO3 within 2 h. We conclude that the VBBo sampling and analytical methods are well-suited for exploring the extent and distribution of Hg contamination in the soils of our study area. However, this result should not be generalized without knowledge on Hg speciation; the extraction efficiency of the VBBo method may be lower at other contaminated sites where elemental Hg(0) and/or Hg sulfides are major species. Indeed, in two of the most contaminated sediment samples from the factory site, we observed lower extraction efficiencies with 2 M HNO3 (76–87%), which may be due to the presence of sulfide-bound Hg, as indicated by thermal desorption analysis and large fractions of Hg extracted in F4 and F5 or the sequential extraction.

4.2. Hg Species in Soils and Factory Sediments

Sequential extraction procedures for Hg are not fully selective towards specific Hg species in soils, but rather, they extract operationally defined pools of Hg. For example, the authors who developed the method, performed this five-step extraction procedure on various pure compounds to establish “extraction fingerprints” [27]. They found that only four Hg species (HgCl2 in F1, Hg(0) in F4, and α-HgS, β-HgS, and HgSe in F5) were quantitatively removed in only one of the five extraction solutions, while the remaining pure compounds were extracted over multiple steps [27,39]. For example, Hg compounds with high water solubility were HgCl2, HgSO4, and HgO, and were classified into a general behavioral extraction class of F1 and F2, while Hg bound to humic substances and MeHg was predominantly extracted in the F3, and partially the F4 fraction [27]. Consequently, the following discussions of the sequential extraction results are restricted to speciation in such operationally defined behavioral pools.
From our combined results, it seems most likely that the majority of Hg in the soil and sediment samples was present as Hg(II) complexed to major soil sorbents such as organic matter and clay minerals (collectively referred to as “matrix-bound Hg(II)”). Nevertheless, the soils versus sediments from the factory site exhibited some important differences. From the soils, most Hg was extracted in fraction F3, with very little labile Hg released in F1 and F2 (Figure 2), indicating an important contribution of organically bound Hg and the absence of readily soluble species such as HgCl2 and HgSO4. The affinity of Hg to thiol groups found in natural organic matter (NOM) is well documented [9,11,40,41,42] and this complexation is considered strong and stable, especially under oxic soil conditions [43]. These thiol groups are almost always present in great excess compared to environmentally relevant concentrations of Hg in soils [9,44]. Studies in contaminated floodplains examining Hg speciation differences in soils versus sediments have shown that Hg bound to organic matter in the soils showed a stronger fixation to stable, high molecular weight humic acids and were consequently less mobile than Hg in the sediments [11,42]. Similarly, in our study examining the relationship between stable Hg isotope signatures and various species pools in these soils, a large concentration of Hg was extracted with NaOH and Na4P2O7 (targeting the organic fraction) and was well correlated with DOC [45]. This finding of organically bound Hg is supported by the thermal desorption release curves (Figure 3), which clearly show that the largest peak is in the range of “matrix-bound Hg(II)” [31]. It is known that the Hg(I) mineral calomel (Hg2Cl2) is also extracted with an 1 M KOH (F3) solution [27]. Calomel is a mineral found in trace amounts in mining waste materials or their leachates [46,47], and it seems possible that this mineral was present at the factory site during chemical production. However, we consider the presence of calomel in these soils as rather unlikely, as it is unstable in the environment and will be at disproportionately low concentrations compared to Hg(0) and Hg(II) [4].
In comparison, Hg in the sediments from the factory site was predominantly extracted in fractions F4 and F5. While the 12 M HNO3 solution is designed to target free elemental Hg, any Hg bound to Fe or Mn mineral phases would also be extracted in these fractions. Iron was found only in very low concentrations in the F1–F3 extracts of the soil and sediment samples, with the majority of Fe extracted in fraction F4 (data not shown). Fraction F4 may also contain some remaining Hg bound to humic substances if it was not completely extracted in fraction F3 [27,48]. In addition, the factory sediments displayed an ongoing transformation to HgS as indicated by a high-temperature second peak or shoulder in thermal desorption analysis (Figure 3). This may be attributed to potential sulfate reducing conditions below the factory site [15] and the formation of metacinnabar. The F5 extractions from these factory sediments show that Hg(II) has likely been partially precipitated into sulfide phases. In natural systems with variable redox conditions contaminated by an industrial Hg source, such in situ precipitation of metacinnabar is more likely than cinnabar [19,49]. Moreover, in situ formation of submicron sized metacinnabar occurs in floodplain soils and sediments originally contaminated by elemental Hg [19]. However, such nano-particulate metacinnabar precipitates are known to begin to dissolve in 12 M HNO3 [48], or even in 4 M HNO3 [50] and 6 M HCl [51], which may be a function of structural disorder of in situ-formed β-HgS [22]. Thus, we think that the majority of the Hg in the factory samples is likely a mixture of Hg bound to Fe/Mn crystalline phases, organic matter, and S in the form of HgS.
The low concentrations of MeHg and the weak relationship between HgMe and total Hg in the 15 soils (Figure 4) suggested that, at the time of sampling, Hg methylation rates were rather low and not limited by soil Hg concentration. The results were in good agreement with a previous report for soils of this region [15]. Based on these results, we conclude that the majority of MeHg present was produced in situ by methylating microorganisms, rather than from the primary contamination. Apparently, biogeochemical parameters other than total Hg control methylation and demethylation rates (e.g., soil redox conditions, microbial activity). Predominantly oxic conditions are expected in most surface soils (0–20 cm) during most of the year; however, some soils in the study area may be periodically water-logged or flooded. This may lead to anoxic conditions, promoting the methylation of Hg by sulfate- or iron-reducing bacteria and/or the release of Hg into solution, increasing Hg mobility. Higher Hg methylation rates have also been found at greater soil depths near the groundwater table and at the water/sediment interface along the canal (GGK) [15].

4.3. Mobility of Hg

When comparing the batch extractions of soils and sediments using variable CaCl2 concentrations with the redox reactor experiments, we can speculate on the potential for Hg to be mobilized under different prevailing conditions. It has been reported that the presence of Cl can lower Hg sorption to mineral sorbents by the formation of dissolved Hg-Cl complexes in solution [14,52]. However, speciation calculations with VisualMINTEQ have suggested that, in solutions with 0.35 μg/L Hg and 0.001 M CaCl2 (comparable to our 0.001 M CaCl2 extracts) only 0.1 mg/L DOC would be sufficient to complex 100% of the dissolved Hg, effectively suppressing the formation of Hg-Cl complexes. Without DOC, 47% of the dissolved Hg would be expected to be present as HgCl2 (Table S3). Thus, even with low DOC concentrations in the extracts, the binding of Hg to DOC should strongly dominate over the formation of Hg-Cl complexes [53].
In the soils, the decreasing Hg and DOC concentrations with increasing ionic strength (Figure 5 and Figure S5) pointed to an aggregating effect of Ca2+ ions on Hg bound to organic colloids, though likely at particle sizes smaller than the 0.02 µm filter used in the experiment (Figure S6). This hypothesis is supported by the release of Hg into solution simultaneously with DOC and Mn under suboxic conditions in the reactor experiment (Figure 7). It is well known that under saturated conditions, microbes present in soils will rapidly consume oxygen and utilize alternative electron acceptors, such as Mn(VI/III) and Fe(III)-oxyhydroxide phases, resulting in a release of metals into solution from the reductive dissolution of these and other phases and others along the redox ladder [54,55]. The increase of Hg at approximately 48 h likely coincides with the dissolution of Mn-oxides present in the soil and the release of DOC sorbed onto their surface [56,57] into solution, at increasing pH when desorption and repulsion of negatively charged OM and the mineral surface occurs [58,59]. VisualMINTEQ calculations again suggested that the Hg(II) was solely associated with organic matter. Thus, the direct association of Hg to Mn phases is likely less significant than Hg association with the sorbed organic matter.
There were some important differences in the mobility of Hg found in soils and factory sediments, which deserve some discussion. In contrast to the soils, we observed an increase in Hg mobility in the presence of high CaCl2 concentrations. VisualMINTEQ calculations of solution species for similar Hg, DOC, and pH conditions as to what was found in the batch extractions of sample F-F2 (Table S4) suggested that 100% of the Hg was associated with DOC in the DDI water and 0.001 M CaCl2 extracts. However, with increasing CaCl2 concentration, an increasing fraction of Hg was predicted to be present as Hg-Cl complexes (88% Hg-Cl complexes in a solution with 0.4 M CaCl2). Thus, the Hg was likely associated with mobilized organic colloids in the DDI water, 0.001 M, 0.01 M CaCl2 extracts, but predominantly as Hg-chloride complexes in the 1 M CaCl2 extract. Thus, the difference between factory sediments and soils was likely due to the lower organic matter contents of the factory sediments, resulting in lower DOC concentrations in the extracts (Table S1, Figure S5).

4.4. Environmental Implications

Overall, we conclude from our results that Hg in soils of the Visp and Turtig settlement areas is mainly present as Hg(II) strongly bound to soil solids (“matrix-bound Hg(II)”), most likely to soil organic matter. Outgassing of elemental Hg(0) and leaching of dissolved Hg(II) or methylmercury to groundwater may occur to some extent, but the expected concentrations in air and groundwater are low. Nevertheless, gaseous elemental Hg measurements in the atmosphere should be carried out to confirm these results. The presence of metal cations or chloride from deicing salts are not expected to result in Hg mobilization from soils. Additional research should be conducted in order to better understand Hg speciation in the highly contaminated factory sediments, as well as the influence of redox processes on Hg release during soil leaching or batch extraction tests, and in the field when soils are water-logged or periodically flooded. Some soils in the study area may be prone to periodic water saturation or flooding, and may then become sites of elevated Hg methylation and mobilization.

Supplementary Materials

The following are available online at https://www.mdpi.com/2571-8789/2/3/44/s1. Schematic map of the Visp-Turtig area; schematic diagram of the redox reactor experiment; sequential extraction results for standard reference materials (SRMs), thermal desorption curves of Hg reference compounds; Hg, dissolved organic carbon (DOC), Fe and S concentrations in batch extractions; results of filtration tests; time-dependent batch extractions; characteristics of soils and sediments; results of sequential extractions of soils and sediments; VisualMINTEQ calculations of Hg speciation in soil extracts; VisualMINTEQ calculations of Hg speciation in sediment extracts.

Author Contributions

Conceptualization, R.K. and R.S.G.; Funding acquisition, R.K.; Soil sampling: P.B.; Experiments: C.K., M.W., J.R., H.B. and R.S.G.; Methodology, R.S.G., K.B. and H.B.; Resources, R.K.; Supervision, R.S.G. and R.K.; Writing—original draft, R.S.G.; Writing—review & editing, R.K.

Acknowledgments

We wish to thank T. Ferber, M. Anor, A. Sauty, and H. Vermeulen (University of Applied Science and Arts Western Switzerland) for support with sampling of soils. The factory sediments were kindly made available to us by David Trudel (Arcadis Switzerland). Information on soil contamination and partial funding, which made this research possible, was provided by the Dienststelle für Umwelt (DUW, Canton of Valais), which is gratefully acknowledged. We are especially grateful to David Trudel (Arcadis), Yves Degoumois (DUW), Marco Perrig (DUW), and Daniel Obrist (DUW) for fruitful discussions and continued support.

Conflicts of Interest

The authors declare no conflict of interest.

References

  1. Selin, N.E. Global biogeochemical cycling of mercury: A review. Annu. Rev. Environ. Resour. 2009, 34, 43–63. [Google Scholar] [CrossRef]
  2. Mason, R.P.; Choi, A.L.; Fitzgerald, W.F.; Hammerschmidt, C.R.; Lamborg, C.H.; Soerensen, A.L.; Sunderland, E.M. Mercury biogeochemical cycling in the ocean and policy implications. Environ. Res. 2012, 119, 101–117. [Google Scholar] [CrossRef] [PubMed] [Green Version]
  3. Mason, R.P.; Fitzgerald, W.F.; Morel, F.M.M. The biogeochemical cycling of elemental mercury—Anthropogenic influences. Geochim. Cosmochim. Acta 1994, 58, 3191–3198. [Google Scholar] [CrossRef]
  4. Fitzgerald, W.F.; Lamborg, C.H. Geochemistry of Mercury in the Environment. In Treatise on Geochemistry, 2nd ed.; Holland, H.D., Turekian, K.K., Eds.; Elsevier: Oxford, UK, 2014; pp. 91–129. [Google Scholar]
  5. Obrist, D.; Pokharel, A.K.; Moore, C. Vertical profile measurements of soil air suggest immobilization of gaseous elemental mercury in mineral soil. Environ. Sci. Technol. 2014, 48, 2242–2252. [Google Scholar] [CrossRef] [PubMed]
  6. Schwab, P.; Dahinden, R.; Desaules, A. Einflüsse der Probentrocknung auf Quecksilberkonzentrationen in Bodenproben. Bull. BGS 2002, 26, 39–42. [Google Scholar]
  7. Gabriel, M.C.; Williamson, D.G. Principal biogeochemical factors affecting the speciation and transport of mercury through the terrestrial environment. Environ. Geochem. Health 2004, 26, 421–434. [Google Scholar] [CrossRef] [PubMed]
  8. Schuster, E. The behavior of mercury in the soil with special emphasis on complexation and adsorption processes—A review of the literature. Water Air Soil Pollut. 1991, 56, 667–680. [Google Scholar] [CrossRef]
  9. Skyllberg, U. Chemical Speciation of Mercury in Soil and Sediment. In Environmental Chemistry and Toxicology of Mercury; John Wiley & Sons, Inc.: Hoboken, NJ, USA, 2011; pp. 219–258. [Google Scholar]
  10. Poulin, B.A.; Aiken, G.R.; Nagy, K.L.; Manceau, A.; Krabbenhoft, D.P.; Ryan, J.N. Mercury transformation and release differs with depth and time in a contaminated riparian soil during simulated flooding. Geochim. Cosmochim. Acta 2016, 176, 118–138. [Google Scholar] [CrossRef] [Green Version]
  11. Wallschlager, D.; Desai, M.V.M.; Spengler, M.; Windmoller, C.C.; Wilken, R.D. How humic substances dominate mercury geochemistry in contaminated floodplain soils and sediments. J. Environ. Qual. 1998, 27, 1044–1054. [Google Scholar] [CrossRef]
  12. Wallschlager, D.; Desai, M.V.M.; Wilken, R.D. The role of humic substances in the aqueous mobilization of mercury from contaminated floodplain soils. Water Air Soil Pollut. 1996, 90, 507–520. [Google Scholar] [CrossRef]
  13. Yin, Y.J.; Allen, H.E.; Huang, C.P.; Sparks, D.L.; Sanders, P.F. Kinetics of mercury(II) adsorption and desorption on soil. Environ. Sci. Technol. 1997, 31, 496–503. [Google Scholar] [CrossRef]
  14. Kim, C.S.; Rytuba, J.; Brown, G.E., Jr. EXAFS study of mercury(II) sorption to Fe- and Al-(hydr)oxides—II. Effects of chloride and sulfate. J. Colloid Interface Sci. 2004, 270, 9–20. [Google Scholar] [CrossRef] [PubMed]
  15. Charlet, L.; Blancho, F.; Bonnet, T.; Garambois, S.; Boivin, P.; Ferber, T.; Tisserand, D.; Guedron, S. Industrial mercury pollution in a mountain valley: A combined geophysical and geochemical study. Procedia Earth Planet. Sci. 2017, 17, 77–80. [Google Scholar] [CrossRef]
  16. Ravichandran, M.; Aiken, G.R.; Ryan, J.N.; Reddy, M.M. Inhibition of precipitation and aggregation of metacinnabar (mercuric sulfide) by dissolved organic matter isolated from the Florida Everglades. Environ. Sci. Technol. 1999, 33, 1418–1423. [Google Scholar] [CrossRef]
  17. Gerbig, C.A.; Kim, C.S.; Stegemeier, J.P.; Ryan, J.N.; Aiken, G.R. Formation of nanocolloidal metacinnabar in mercury-DOM-sulfide systems. Environ. Sci. Technol. 2011, 45, 9180–9187. [Google Scholar] [CrossRef] [PubMed]
  18. Barnett, M.O.; Harris, L.A.; Turner, R.R.; Henson, T.J.; Melton, R.E.; Stevenson, R.J. Characterization of mercury species in contaminated floodplain soils. Water Air Soil Pollut. 1995, 80, 1105–1108. [Google Scholar] [CrossRef]
  19. Barnett, M.O.; Harris, L.A.; Turner, R.R.; Stevenson, R.J.; Henson, T.J.; Melton, R.C.; Hoffman, D.P. Formation of mercuric sulfide in soil. Environ. Sci. Technol. 1997, 31, 3037–3043. [Google Scholar] [CrossRef]
  20. Drott, A.; Bjorn, E.; Bouchet, S.; Skyllberg, U. Refining thermodynamic constants for mercury(II)-sulfides in equilibrium with metacinnabar at sub-micromolar aqueous sulfide concentrations. Environ. Sci. Technol. 2013, 47, 4197–4203. [Google Scholar] [CrossRef] [PubMed]
  21. Deonarine, A.; Hsu-Kim, H. Precipitation of mercuric sulfide nanoparticles in NOM-containing water: Implications for the natural environment. Environ. Sci. Technol. 2009, 43, 2368–2373. [Google Scholar] [CrossRef] [PubMed]
  22. Poulin, B.A.; Gerbig, C.A.; Kim, C.S.; Stegemeier, J.P.; Ryan, J.N.; Aiken, G.R. Effects of sulfide concentration and dissolved organic matter characteristics on the structure of nanocolloidal metacinnabar. Environ. Sci. Technol. 2017, 51, 13133–13142. [Google Scholar] [CrossRef] [PubMed]
  23. Graham, A.M.; Aiken, G.R.; Gilmour, C.C. Dissolved organic matter enhances microbial mercury methylation under sulfidic conditions. Environ. Sci. Technol. 2012, 46, 2715–2723. [Google Scholar] [CrossRef] [PubMed]
  24. Zhang, T.; Kim, B.; Leyard, C.; Reinsch, B.C.; Lowry, G.V.; Deshusses, M.A.; Hsu-Kim, H. Methylation of mercury by bacteria exposed to dissolved, nanoparticulate, and microparticulate mercuric sulfides. Environ. Sci. Technol. 2012, 46, 6950–6958. [Google Scholar] [CrossRef] [PubMed]
  25. Clarkson, T.W.; Magos, L. The toxicology of mercury and its chemical compounds. Crit. Rev. Toxicol. 2006, 36, 609–662. [Google Scholar] [CrossRef] [PubMed]
  26. Barkay, T.; Wagner-Dobler, I. Microbial transformations of mercury: Potentials, challenges, and achievements in controlling mercury toxicity in the environment. Adv. Appl. Microbiol. 2005, 57, 1–52. [Google Scholar] [PubMed]
  27. Bloom, N.S.; Preus, E.; Katon, J.; Hiltner, M. Selective extractions to assess the biogeochemically relevant fractionation of inorganic mercury in sediments and soils. Anal. Chim. Acta 2003, 479, 233–248. [Google Scholar] [CrossRef]
  28. Issaro, N.; Abi-Ghanem, C.; Bermond, A. Fractionation studies of mercury in soils and sediments: A review of the chemical reagents used for mercury extraction. Anal. Chim. Acta 2009, 631, 1–12. [Google Scholar] [CrossRef] [PubMed]
  29. Nirel, P.M.V.; Morel, F.M.M. Pitfalls of Sequential Extractions. Water Res. 1990, 24, 1055–1056. [Google Scholar] [CrossRef]
  30. Reis, A.T.; Davidson, C.M.; Vale, C.; Pereira, E. Overview and challenges of mercury fractionation and speciation in soils. Trac-Trends Anal. Chem. 2016, 82, 109–117. [Google Scholar] [CrossRef] [Green Version]
  31. Biester, H.; Scholz, C. Determination of mercury binding forms in contaminated soils: Mercury pyrolysis versus sequential extractions. Environ. Sci. Technol. 1997, 31, 233–239. [Google Scholar] [CrossRef]
  32. Reis, A.T.; Coelho, J.P.; Rucandio, I.; Davidson, C.M.; Duarte, A.C.; Pereira, E. Thermo-desorption: A valid tool for mercury speciation in soils and sediments? Geoderma 2015, 237, 98–104. [Google Scholar] [CrossRef] [Green Version]
  33. Das Bundesamt für Umwelt (BAFU). Vollzugshilfe: Erläuterungen zur Verordnung vom 1. Juli 1998 über Belastungen des Bodens (VBBo); BAFU: Bern, Switzerland, 2001. [Google Scholar]
  34. Christian, G.; Jean-Rober, E. Voruntersuchung von Belasteten Standorten—Historische Untersuchung: Objekt Grossgrundkanal; ForumUmwelt AG: Visp, Switzerland, 2011. [Google Scholar]
  35. VBBo. Verordnung über Belastungen des Bodens; VBBo: Bern, Switzerland, 1998. [Google Scholar]
  36. AltIV (Altlasten-Verordnung). Verordnung über die Sanierung von belasteten Standorten; AltIV: Bern, Switzerland, 1998. [Google Scholar]
  37. Biester, H.; Nehrke, G. Quantification of mercury in soils and sediments—Acid digestion versus pyrolysis. Fresen. J. Anal. Chem. 1997, 358, 446–452. [Google Scholar]
  38. VVEA (Abfallverordnung). Verordnung über die Vermeidung und die Entsorgung von Abfällen; VVEA: Bern, Switzerland, 2016. [Google Scholar]
  39. Kim, C.S.; Bloom, N.S.; Rytuba, J.J.; Brown, G.E., Jr. Mercury speciation by X-ray absorption fine structure spectroscopy and sequential chemical extractions: A comparison of speciation methods. Environ. Sci. Technol. 2003, 37, 5102–5108. [Google Scholar] [CrossRef] [PubMed]
  40. Riccardi, D.; Guo, H.B.; Parks, J.M.; Gu, B.H.; Summers, A.O.; Miller, S.M.; Liang, L.Y.; Smith, J.C. Why mercury prefers soft ligands. J. Phys. Chem. Lett. 2013, 4, 2317–2322. [Google Scholar] [CrossRef]
  41. Skyllberg, U. Competition among thiols and inorganic sulfides and polysulfides for Hg and MeHg in wetland soils and sediments under suboxic conditions: Illumination of controversies and implications for MeHg net production. J. Geophys. Res. 2008, 113, G00C03. [Google Scholar] [CrossRef]
  42. Wallschlager, D.; Desai, M.V.M.; Spengler, M.; Wilken, R.D. Mercury speciation in floodplain soils and sediments along a contaminated river transect. J. Environ. Qual. 1998, 27, 1034–1044. [Google Scholar] [CrossRef]
  43. Skyllberg, U.; Qian, J.; Frech, W.; Xia, K.; Bleam, W.F. Distribution of mercury, methyl mercury and organic sulphur species in soil, soil solution and stream of a boreal forest catchment. Biogeochemistry 2003, 64, 53–76. [Google Scholar] [CrossRef]
  44. Skyllberg, U.; Bloom, P.R.; Qian, J.; Lin, C.M.; Bleam, W.F. Complexation of mercury (II) in soil organic matter: EXAFS evidence for linear two-coordination with reduced sulfur groups. Environ. Sci. Technol. 2006, 40, 4174–4180. [Google Scholar] [CrossRef] [PubMed]
  45. Grigg, A.R.C.; Kretzschmar, R.; Gilli, R.S.; Wiederhold, J.G. Mercury isotope signatures of digests and sequential extractions from industrially contaminated soils and sediments. Sci. Total Environ. 2018, 636, 1344–1354. [Google Scholar] [CrossRef] [PubMed]
  46. Gray, J.E.; Hines, M.E.; Higueras, P.L.; Adatto, I.; Lasorsa, B.K. Mercury speciation and microbial transformations in mine wastes, stream sediments, and surface waters at the Almaden Mining District, Spain. Environ. Sci. Technol. 2004, 38, 4285–4292. [Google Scholar] [CrossRef] [PubMed]
  47. Smith, R.S.; Wiederhold, J.G.; Jew, A.D.; Brown, G.E., Jr.; Bourdon, B.; Kretzschmar, R. Small-scale studies of roasted ore waste reveal extreme ranges of stable mercury isotope signatures. Geochim. Cosmochim. Acta 2014, 137, 1–17. [Google Scholar] [CrossRef]
  48. Hall, G.E.M.; Pelchat, P.; Percival, J.B. The design and application of sequential extractions for mercury, Part 1. Optimization of HNO3 extraction for all non-sulphide forms of Hg. Geochem. Explor. Environ. Anal. 2005, 5, 107–113. [Google Scholar] [CrossRef]
  49. Tauson, V.L.; Akimov, V.V. Introduction to the theory of forced equilibria: General principles, basic concepts, and definitions. Geochim. Cosmochim. Acta 1997, 61, 4935–4943. [Google Scholar] [CrossRef]
  50. Han, F.X.X.; Shiyab, S.; Chen, J.; Su, Y.; Monts, D.L.; Waggoner, C.A.; Matta, F.B. Extractability and bioavailability of mercury from a mercury sulfide contaminated soil in Oak Ridge, Tennessee, USA. Water Air Soil Pollut. 2008, 194, 67–75. [Google Scholar] [CrossRef]
  51. Mikac, N.; Foucher, D.; Niessen, S.; Fischer, J.C. Extractability of HgS (cinnabar and metacinnabar) by hydrochloric acid. Anal. Bioanal. Chem. 2002, 374, 1028–1033. [Google Scholar] [CrossRef] [PubMed]
  52. Yin, Y.J.; Allen, H.E.; Li, Y.M.; Huang, C.P.; Sanders, P.F. Adsorption of mercury (II) by soil: Effects of pH, chloride, and organic matter. J. Environ. Qual. 1996, 25, 837–844. [Google Scholar] [CrossRef]
  53. Haitzer, M.; Aiken, G.R.; Ryan, J.N. Binding of mercury (II) to dissolved organic matter: The role of the mercury-to-DOM concentration ratio. Environ. Sci. Technol. 2002, 36, 3564–3570. [Google Scholar] [CrossRef] [PubMed]
  54. Borch, T.; Kretzschmar, R.; Kappler, A.; Van Cappellen, P.; Ginder-Vogel, M.; Voegelin, A.; Campbell, K. Biogeochemical redox processes and their impact on contaminant dynamics. Environ. Sci. Technol. 2010, 44, 15–23. [Google Scholar] [CrossRef] [PubMed]
  55. Stumm, W.; Sulzberger, B. The cycling of iron in natural environments—Considerations based on laboratory studies of heterogeneous redox processes. Geochim. Cosmochim. Acta 1992, 56, 3233–3257. [Google Scholar] [CrossRef]
  56. Chorover, J.; Amistadi, M.K. Reaction of forest floor organic matter at goethite, birnessite and smectite surfaces. Geochim. Cosmochim. Acta 2001, 65, 95–109. [Google Scholar] [CrossRef]
  57. Tipping, E.; Heaton, M.J. The adsorption of aquatic humic substances by two oxides of manganese. Geochim. Cosmochim. Acta 1983, 47, 1393–1397. [Google Scholar] [CrossRef]
  58. Avena, M.J.; Koopal, L.K. Desorption of humic acids from an iron oxide surface. Environ. Sci. Technol. 1998, 32, 2572–2577. [Google Scholar] [CrossRef]
  59. Grybos, M.; Davranche, M.; Gruau, G.; Petitjean, P.; Pedrot, M. Increasing pH drives organic matter solubilization from wetland soils under reducing conditions. Geoderma 2009, 154, 13–19. [Google Scholar] [CrossRef]
Figure 1. Hg in soils and sediments collected following the Swiss Ordinance on the Pollution of Soil (VBBo) procedures (with oven drying at 40 °C) and core sampling and analysis with and without sample drying. Total Hg refers to analysis by total digestion/CV-AFS (panels a,b) or by CAAS (panel c). (a) Total Hg in soils and sediments collected following VBBo methods versus Hg extracted with the VBBo method (hot 2 M HNO3) from the same samples; (b) Total Hg in the soils collected following VBBo methods versus total Hg in field-fresh soil cores analyzed without drying; and (c) Total Hg in field-fresh soil cores analyzed without drying versus total Hg in oven-dried samples (40 °C for 2 days). All values for moist samples were corrected for water loss upon drying at 40 °C. Error bars show the standard deviation of duplicates (TD/AFS) or at least triplicates (CAAS).
Soilsystems 02 00044 g001
Figure 2. Sequential extraction results for the soils, sediments, and the two reference materials NIST-2711 and NIST-2711a. Data are averages of replicate extractions conducted in parallel for all samples. Within each group, the samples are ordered by increasing total Hg content from left to right.
Soilsystems 02 00044 g002
Figure 3. Thermal desorption curves of Hg for 15 soils (core samples, field-moist, 0–20 cm) and six sediments (dried at 40 °C following VBBo methods). The samples within each group are ordered by increasing total Hg content from top to bottom. Visp soils are plotted in green, Turtig soils in blue, and sediments in red.
Soilsystems 02 00044 g003
Figure 4. (a) Methylmercury (MeHg) contents of the soils as a function of total Hg; (b) Fraction of MeHg (in % of total Hg) as a function of total Hg. Error bars show the range of duplicate measurements.
Soilsystems 02 00044 g004
Figure 5. Hg extracted from the soils and sediments in batch extracts with double deionized (DDI) water and 0.001 M, 0.01 M, and 1 M CaCl2 solutions at a solid:solution ratio of 1:10 (48 h equilibration time). The samples are grouped by soils and sediments, and then ordered by increasing total Hg content from left to right. Error bars represent the standard deviation of the duplicate extractions.
Soilsystems 02 00044 g005
Figure 6. The relationships between Hg extracted by 0.01 M CaCl2 in batch extractions and (a) total Hg concentrations in the soils and sediments; and (b) Hg extracted in fraction F1 (DDI water) of the sequential extraction procedure. Error bars represent the standard deviation of at least duplicate extractions.
Soilsystems 02 00044 g006
Figure 7. Solution composition in soil redox reactor experiments with soil sample T-S9: (a) total Hg, (b) redox potential, (c) pH, (d) dissolved organic carbon, (e) total Mn, and (f) total Fe and S in solution. Error bars represent the standard deviation of the replicate extractions.
Soilsystems 02 00044 g007

